Since 1950, the population of the United States has more than doubled to about 327 million people, making America the third-most populous nation on Earth.
As the U.S. population climbed through births and immigration, trends emerged that fit the era. Much of the increase has been in the suburbs throughout the latter part of the 20th century, as families and immigrants climbing the income ladder moved from the city to less densely populated areas in the suburbs.
Even so, many of America’s largest cities have participated in this national population surge, and that is why 24/7 Wall St. has compiled a list of the largest city in every state, using figures obtained from the U.S. Census Bureau.
Click here to see the largest city in every state.
Click here to see detailed findings.
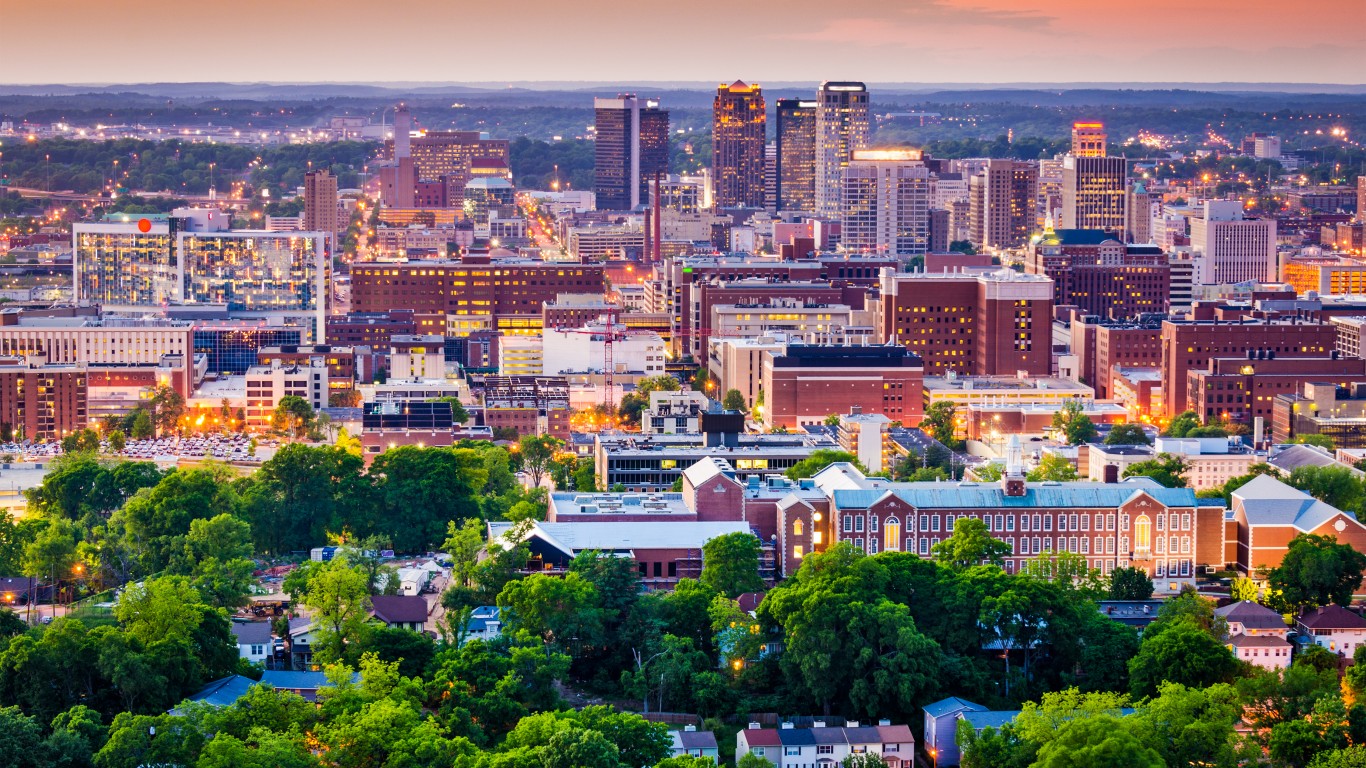
1. Alabama: Birmingham
> Population, 2017: 210,710
> Change since 2010: -0.5%
> State population: 4,874,747 (24th highest)
> Share of state pop. living in largest city: 4.3% (6th lowest)
> Land area: 148.6 sq. miles
> Population density: 1,453 / sq. mile
[in-text-ad]
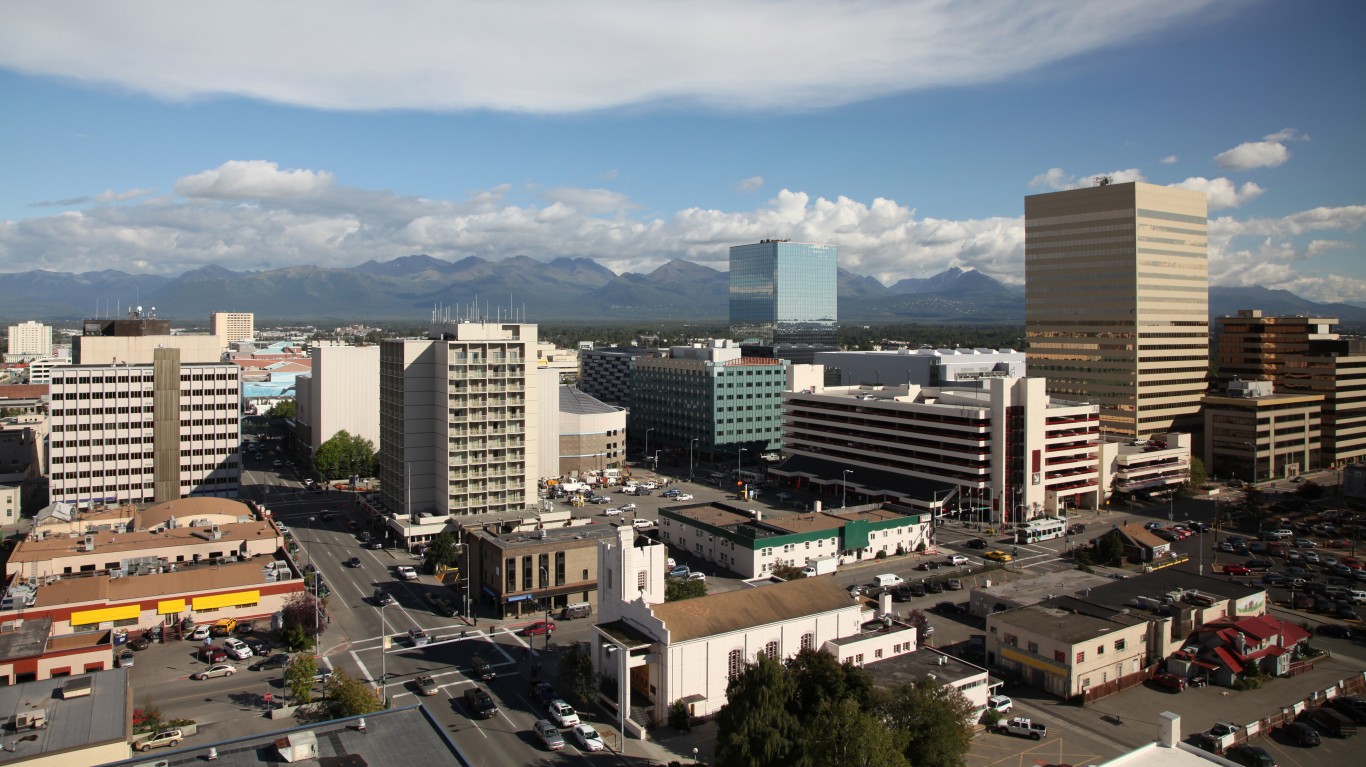
2. Alaska: Anchorage
> Population, 2017: 294,356
> Change since 2010: +0.3%
> State population: 739,795 (3rd lowest)
> Share of state pop. living in largest city: 39.8% (2nd highest)
> Land area: 1961.0 sq. miles
> Population density: 171 / sq. mile
[recirclink id=444492]
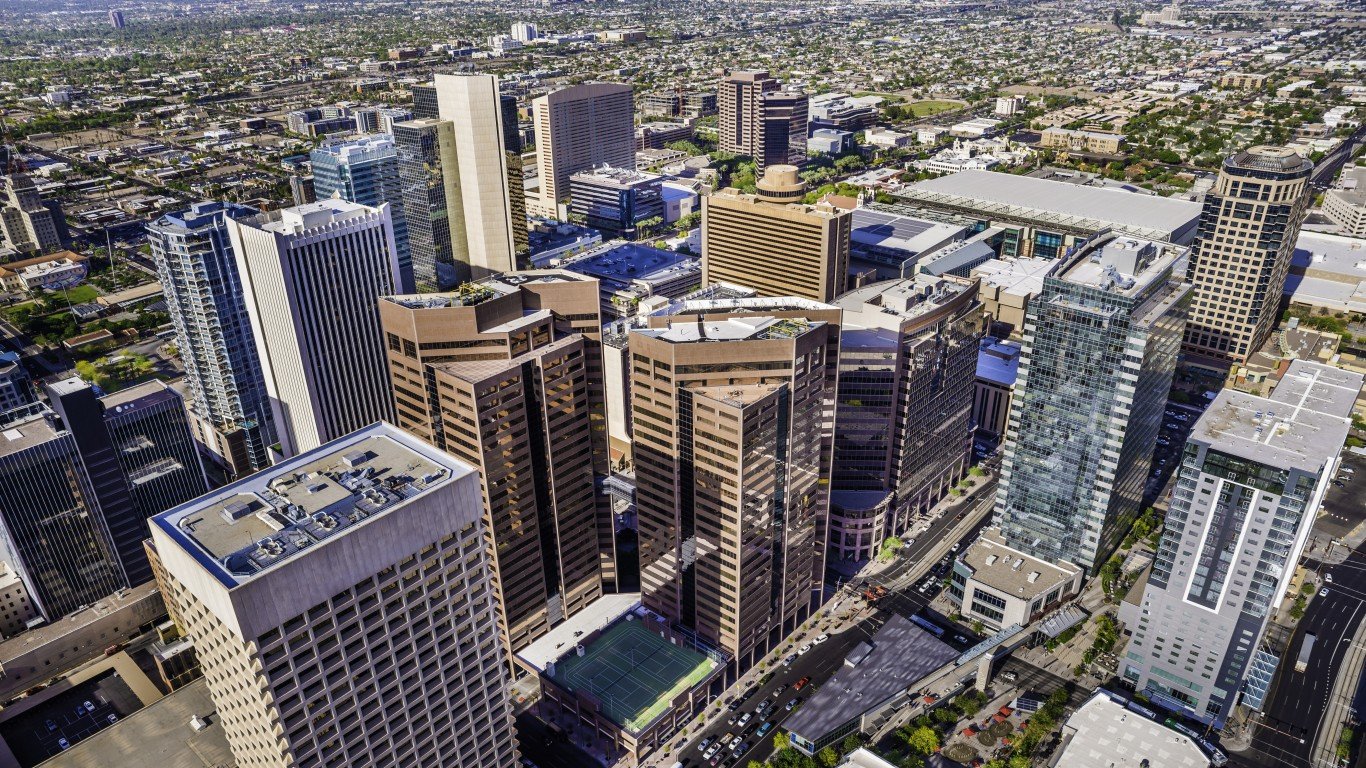
3. Arizona: Phoenix
> Population, 2017: 1,626,078
> Change since 2010: +12.2%
> State population: 7,016,270 (14th highest)
> Share of state pop. living in largest city: 23.2% (6th highest)
> Land area: 518.0 sq. miles
> Population density: 2,798 / sq. mile
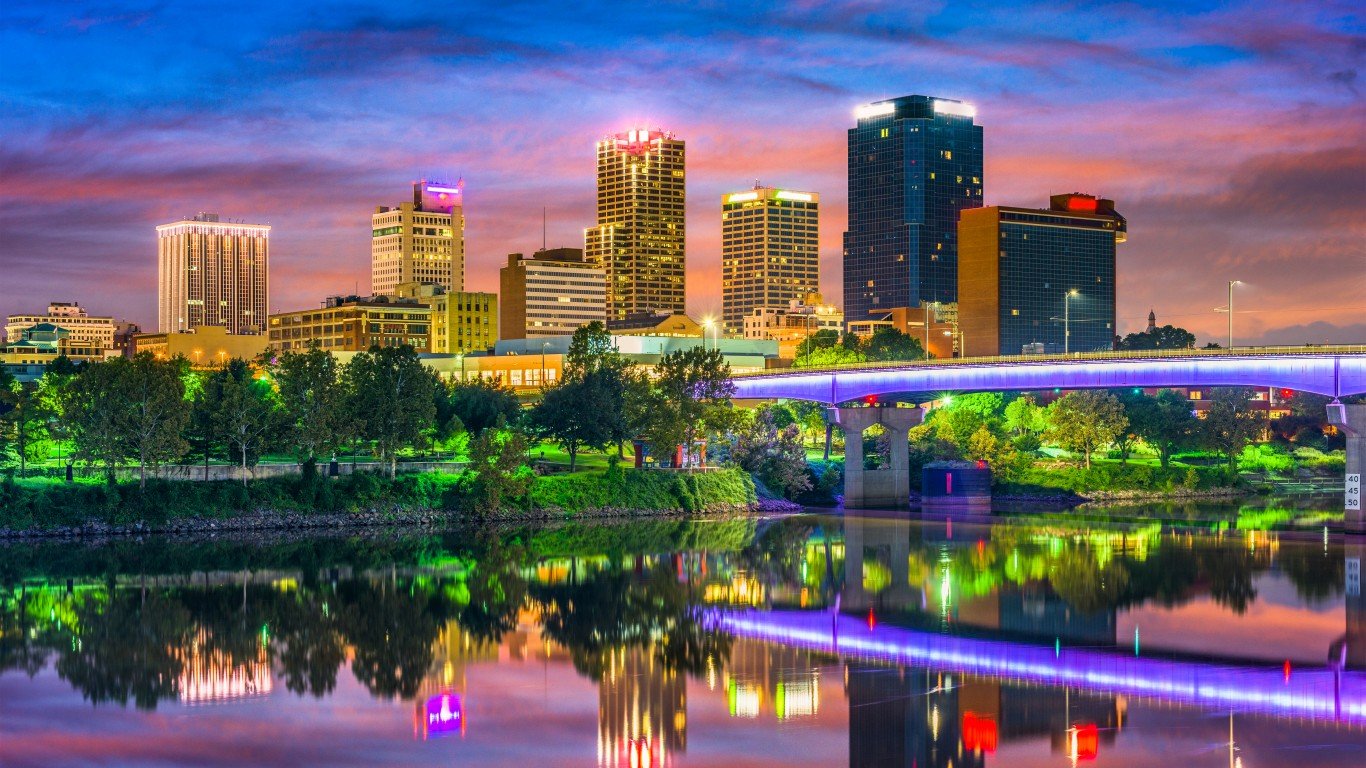
4. Arkansas: Little Rock
> Population, 2017: 198,606
> Change since 2010: +2.4%
> State population: 3,004,279 (19th lowest)
> Share of state pop. living in largest city: 6.6% (12th lowest)
> Land area: 121.0 sq. miles
> Population density: 1,624 / sq. mile
[in-text-ad-2]
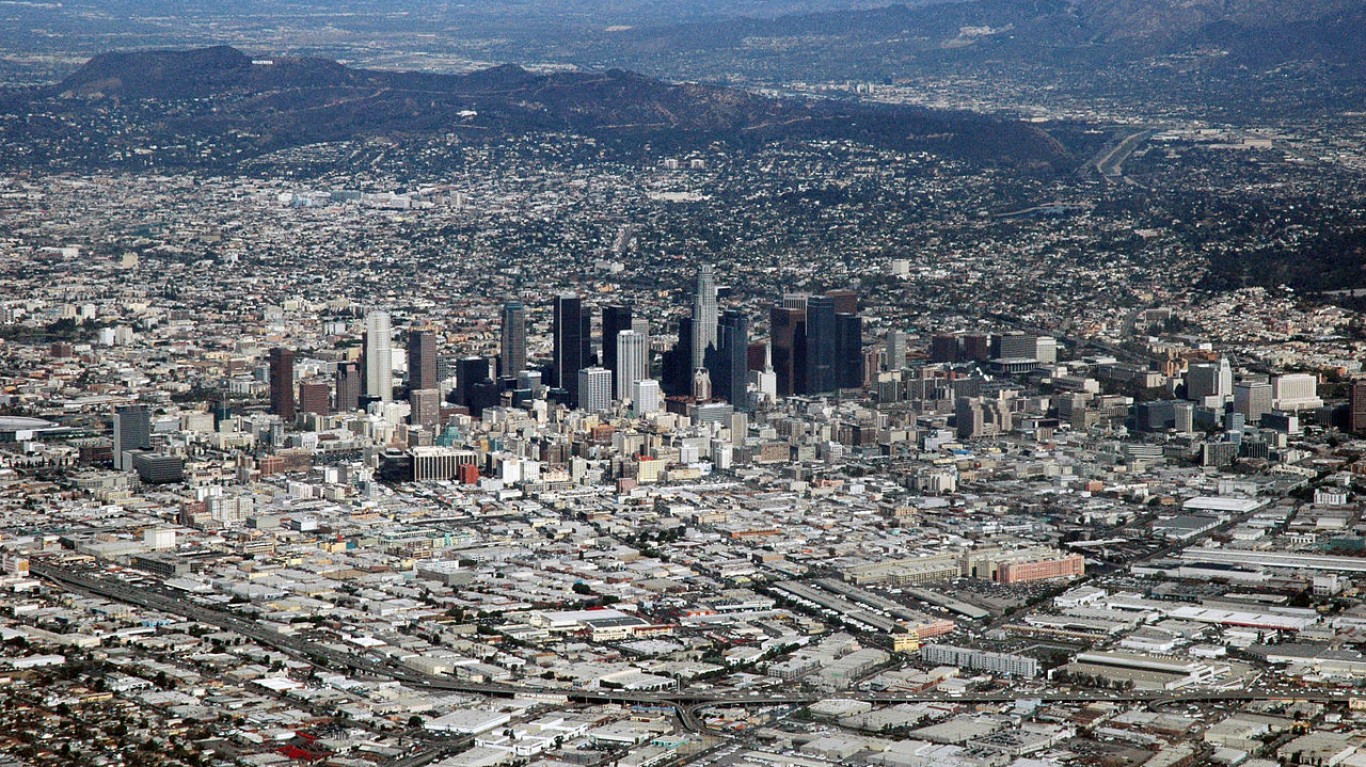
5. California: Los Angeles
> Population, 2017: 3,999,759
> Change since 2010: +5.4%
> State population: 39,536,653 (the highest)
> Share of state pop. living in largest city: 10.1% (24th highest)
> Land area: 502.7 sq. miles
> Population density: 8,092 / sq. mile
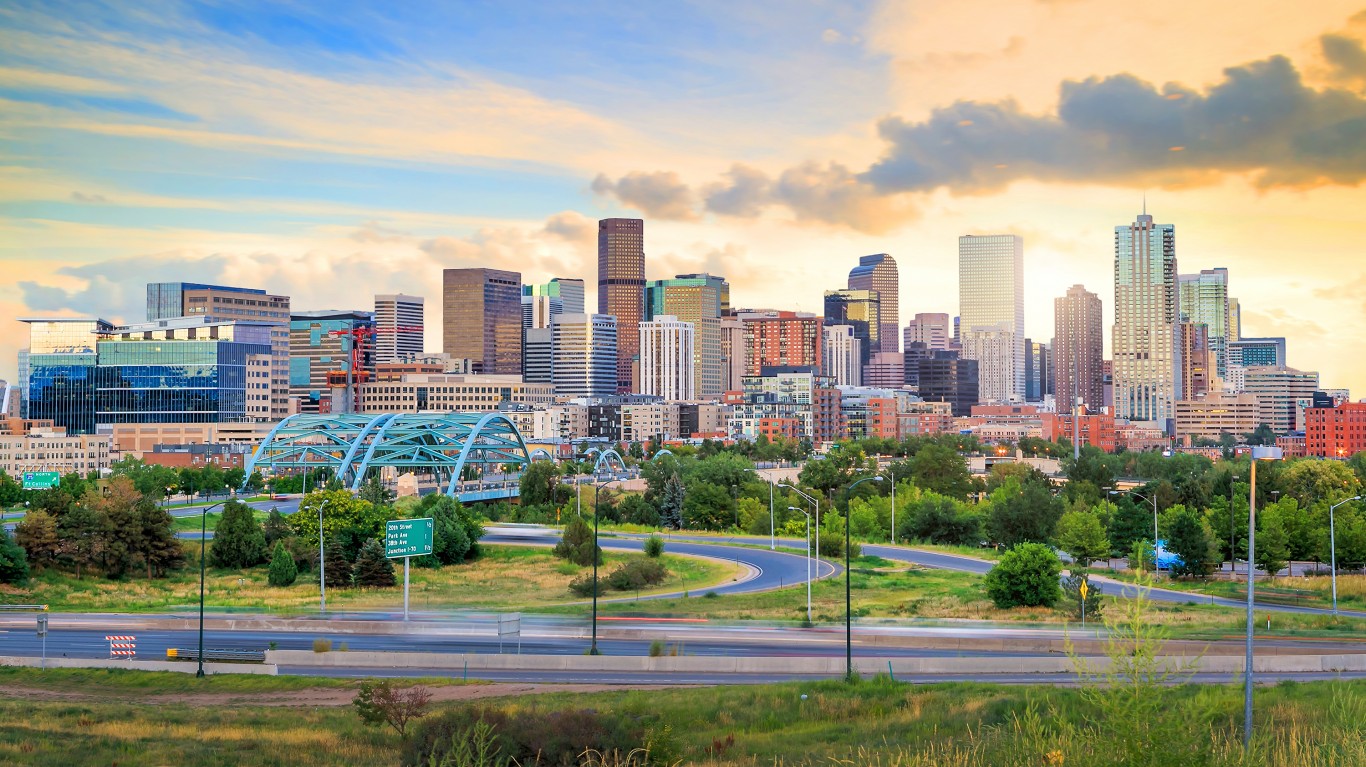
6. Colorado: Denver
> Population, 2017: 704,621
> Change since 2010: +16.8%
> State population: 5,607,154 (21st highest)
> Share of state pop. living in largest city: 12.6% (18th highest)
> Land area: 154.6 sq. miles
> Population density: 3,923 / sq. mile
[in-text-ad]
7. Connecticut: Bridgeport
> Population, 2017: 146,579
> Change since 2010: +1.1%
> State population: 3,588,184 (22nd lowest)
> Share of state pop. living in largest city: 4.1% (4th lowest)
> Land area: 19.3 sq. miles
> Population density: 9,029 / sq. mile
[recirclink id=444468]
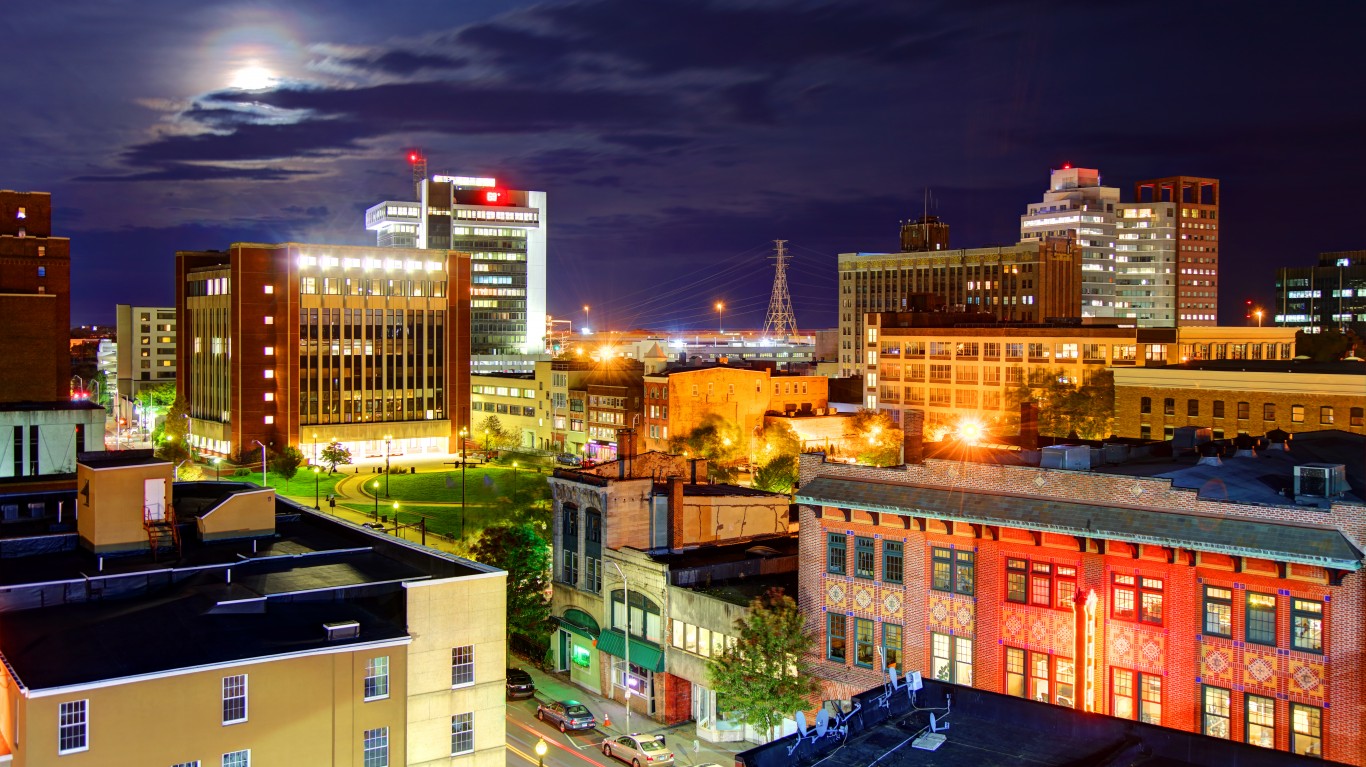
8. Delaware: Wilmington
> Population, 2017: 71,106
> Change since 2010: +0.5%
> State population: 961,939 (6th lowest)
> Share of state pop. living in largest city: 7.4% (16th lowest)
> Land area: 16.9 sq. miles
> Population density: 6,498 / sq. mile
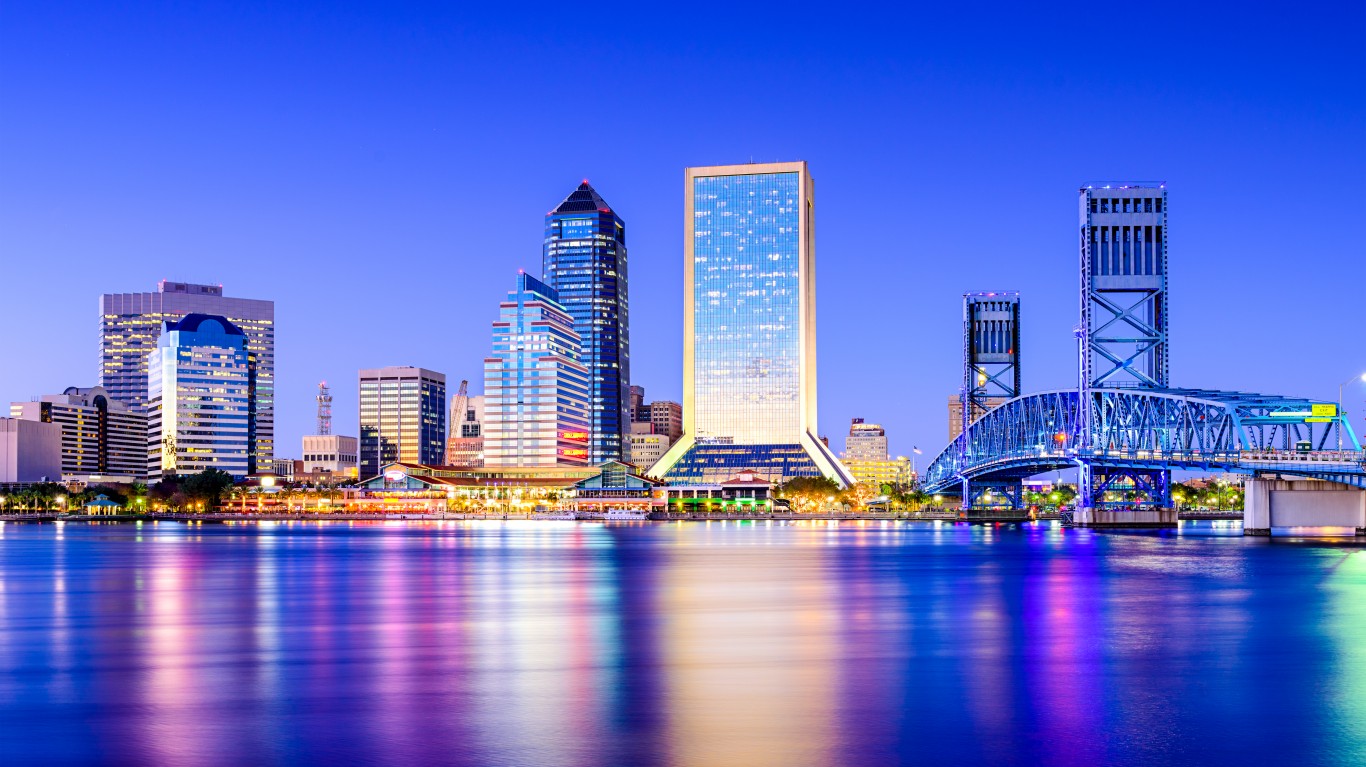
9. Florida: Jacksonville
> Population, 2017: 892,062
> Change since 2010: +8.4%
> State population: 20,984,400 (3rd highest)
> Share of state pop. living in largest city: 4.3% (5th lowest)
> Land area: 874.6 sq. miles
> Population density: 1,100 / sq. mile
[in-text-ad-2]
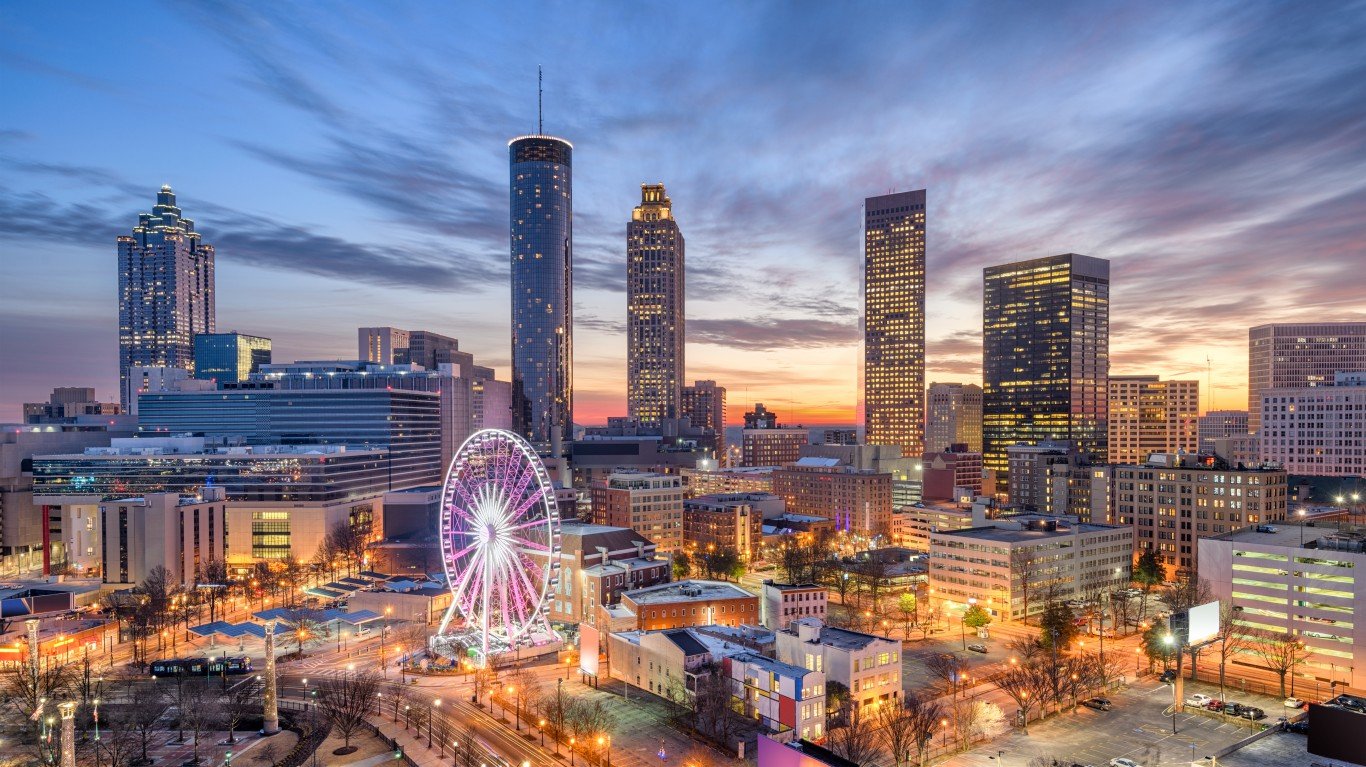
10. Georgia: Atlanta
> Population, 2017: 486,290
> Change since 2010: +15.0%
> State population: 10,429,379 (8th highest)
> Share of state pop. living in largest city: 4.7% (7th lowest)
> Land area: 134.0 sq. miles
> Population density: 3,154 / sq. mile
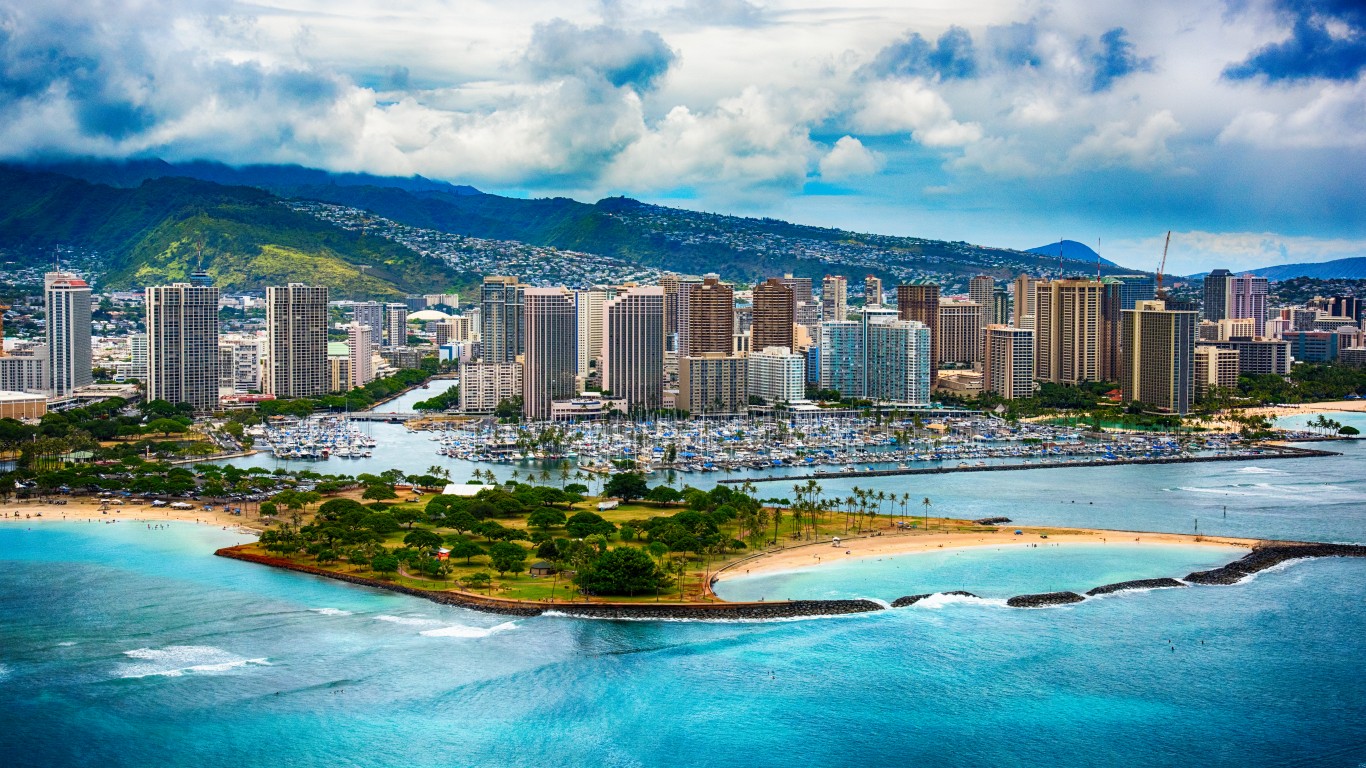
11. Hawaii: Urban Honolulu
> Population, 2017: 350,395
> Change since 2010: +3.3%
> State population: 1,427,538 (11th lowest)
> Share of state pop. living in largest city: 24.5% (4th highest)
> Land area: 68.4 sq. miles
> Population density: 5,573 / sq. mile
[in-text-ad]
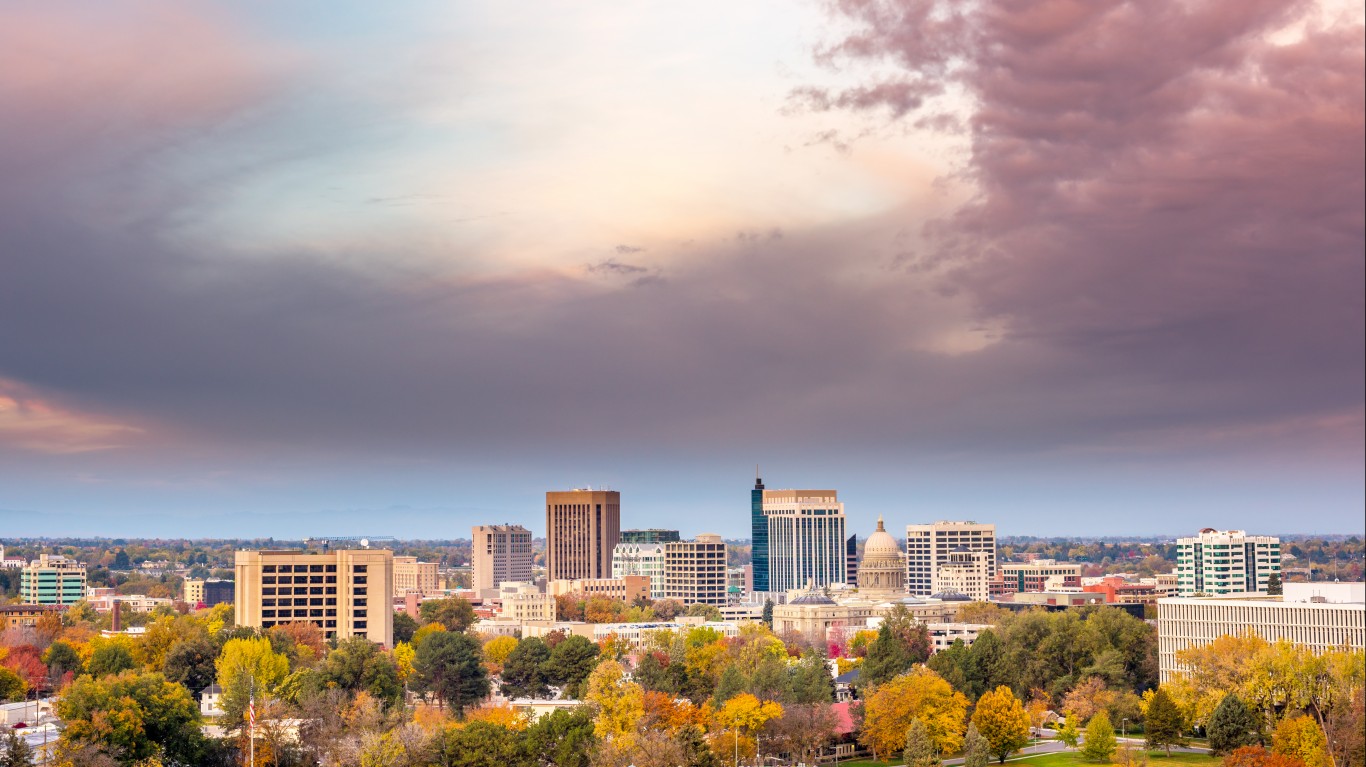
12. Idaho: Boise City
> Population, 2017: 226,570
> Change since 2010: +8.6%
> State population: 1,716,943 (12th lowest)
> Share of state pop. living in largest city: 13.2% (16th highest)
> Land area: 80.0 sq. miles
> Population density: 2,592 / sq. mile
[recirclink id=444391]
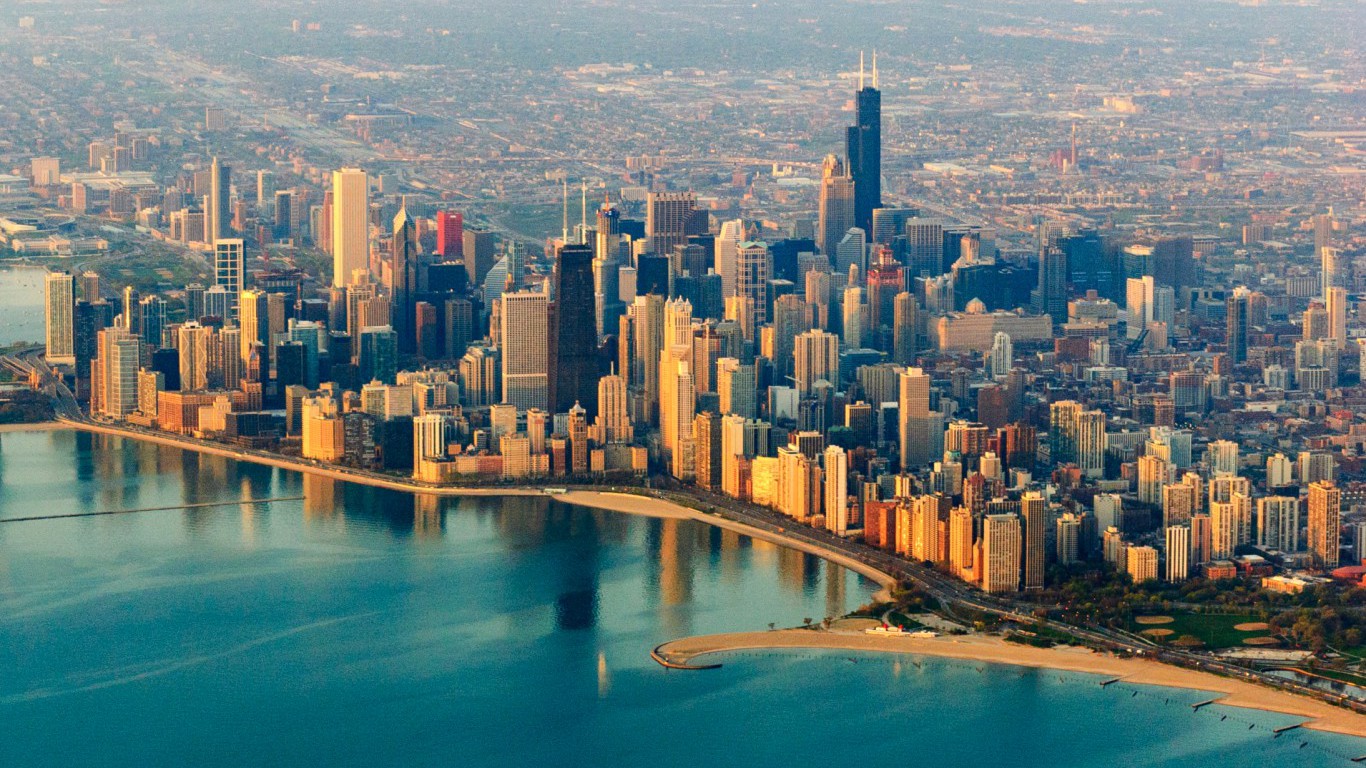
13. Illinois: Chicago
> Population, 2017: 2,716,450
> Change since 2010: +0.7%
> State population: 12,802,023 (6th highest)
> Share of state pop. living in largest city: 21.2% (8th highest)
> Land area: 234.1 sq. miles
> Population density: 11,842 / sq. mile
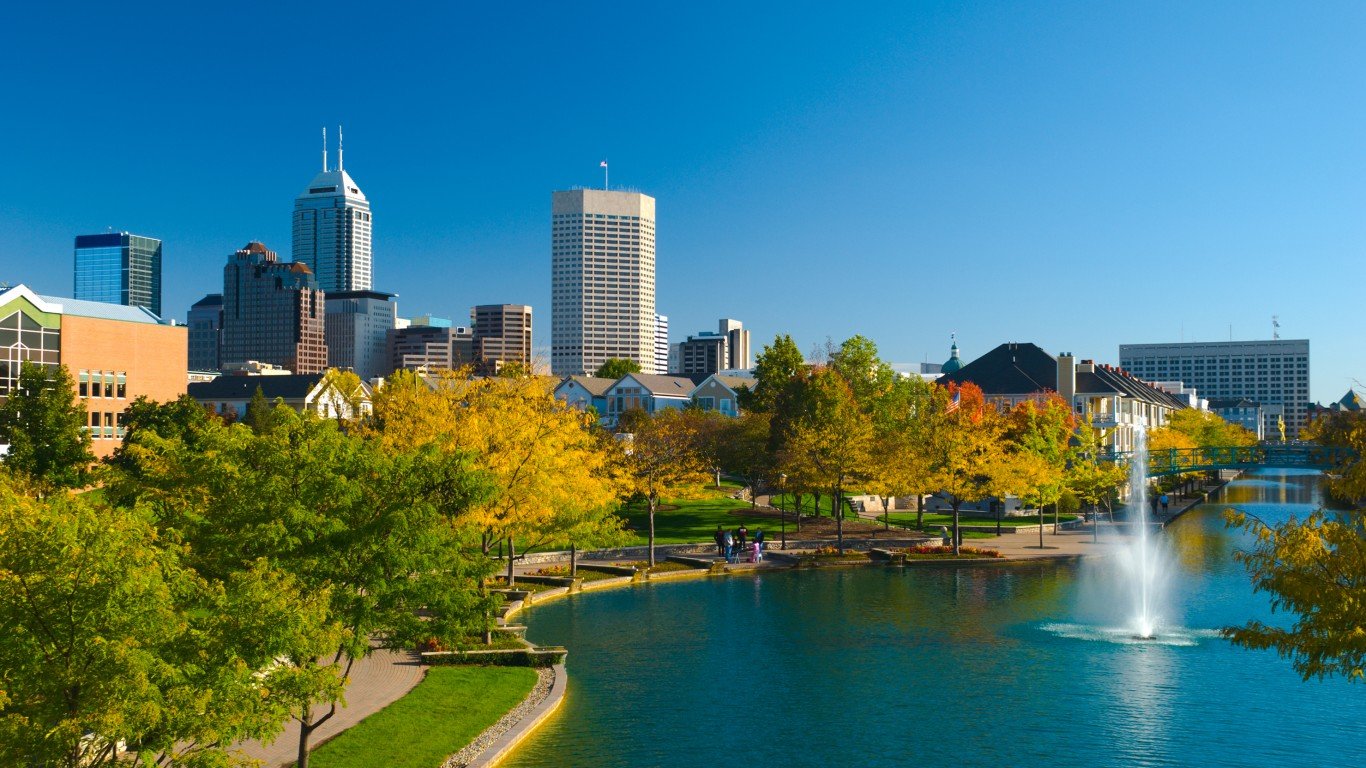
14. Indiana: Indianapolis
> Population, 2017: 872,680
> Change since 2010: +5.1%
> State population: 6,666,818 (17th highest)
> Share of state pop. living in largest city: 13.1% (17th highest)
> Land area: 368.0 sq. miles
> Population density: 2,270 / sq. mile
[in-text-ad-2]
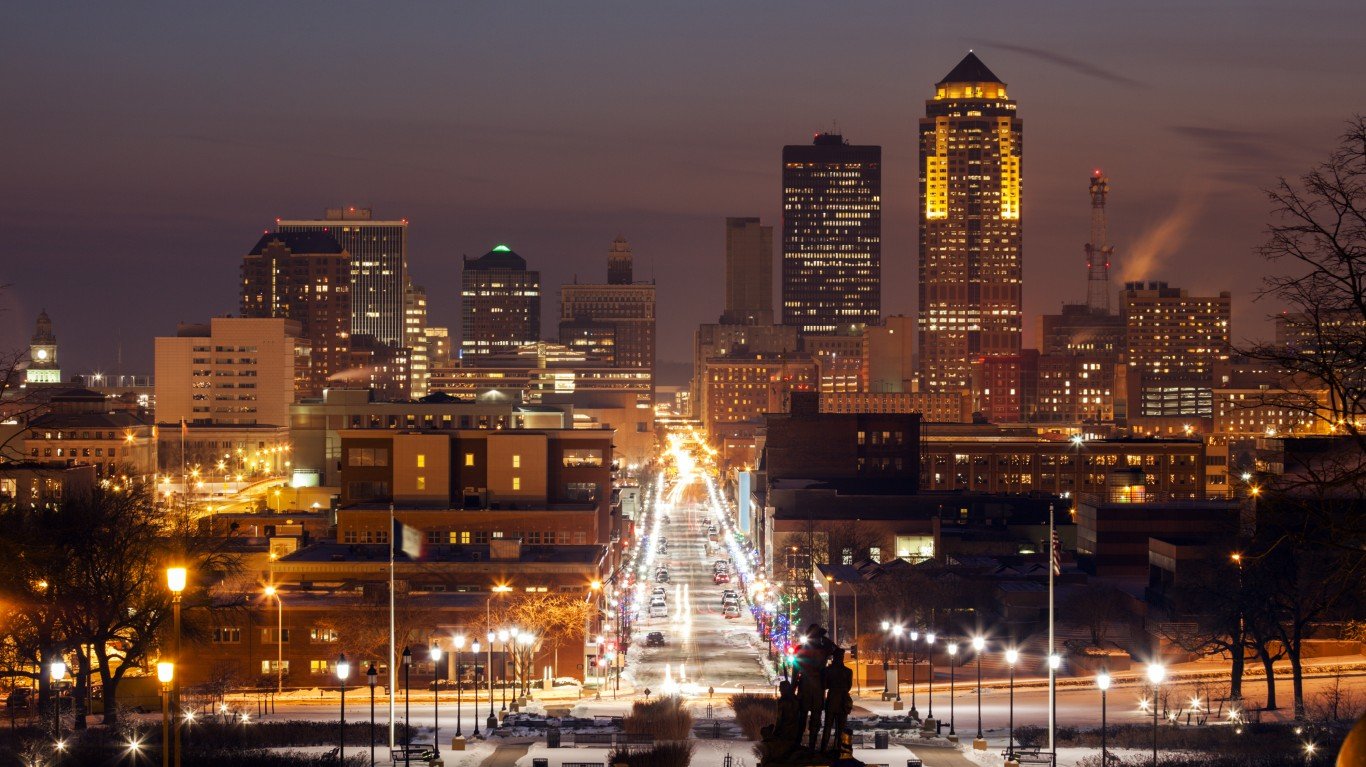
15. Iowa: Des Moines
> Population, 2017: 217,521
> Change since 2010: +6.2%
> State population: 3,145,711 (21st lowest)
> Share of state pop. living in largest city: 6.9% (15th lowest)
> Land area: 82.6 sq. miles
> Population density: 2,516 / sq. mile

16. Kansas: Wichita
> Population, 2017: 390,591
> Change since 2010: +2.1%
> State population: 2,913,123 (16th lowest)
> Share of state pop. living in largest city: 13.4% (15th highest)
> Land area: 163.6 sq. miles
> Population density: 2,400 / sq. mile
[in-text-ad]
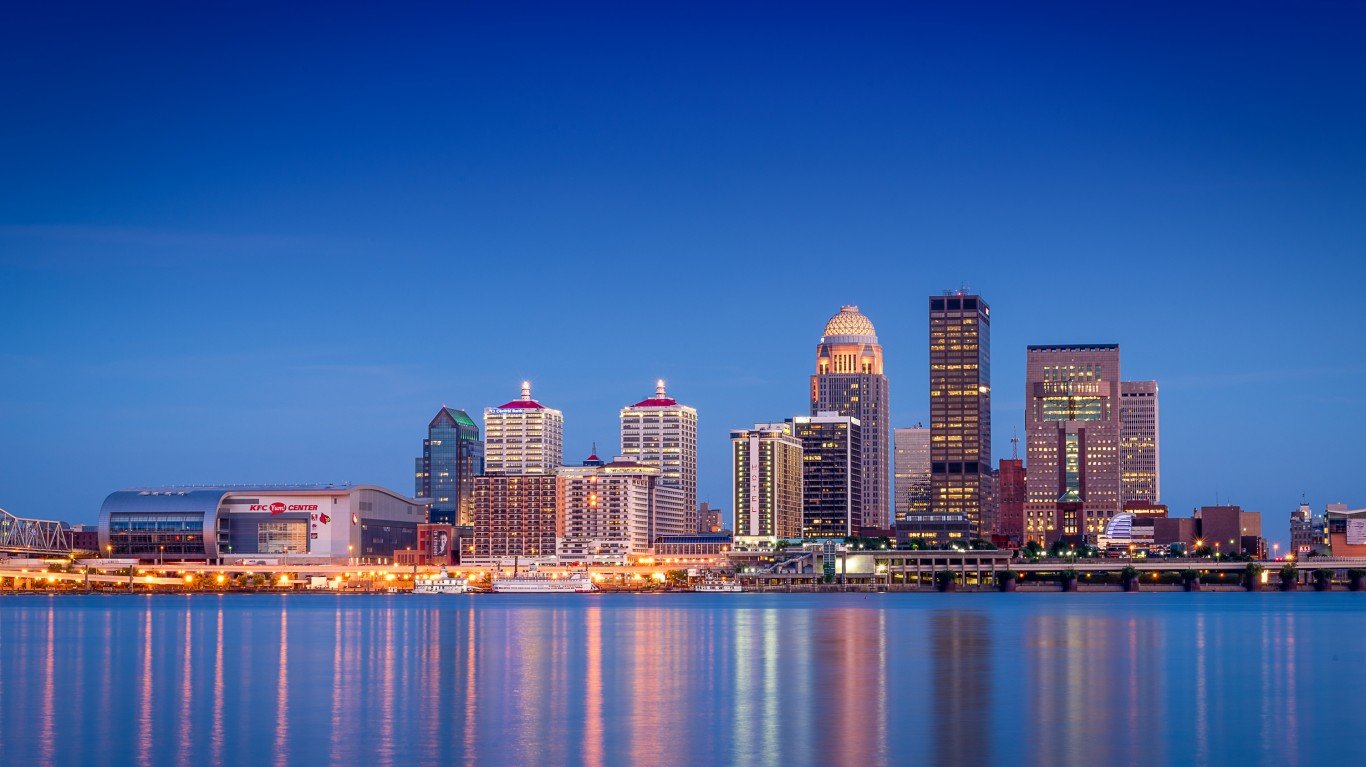
17. Kentucky: Louisville/Jefferson County
> Population, 2017: 771,158
> Change since 2010: +3.9%
> State population: 4,454,189 (25th lowest)
> Share of state pop. living in largest city: 17.3% (10th highest)
> Land area: 342.2 sq. miles
> Population density: 1,837 / sq. mile
[recirclink id=444326]
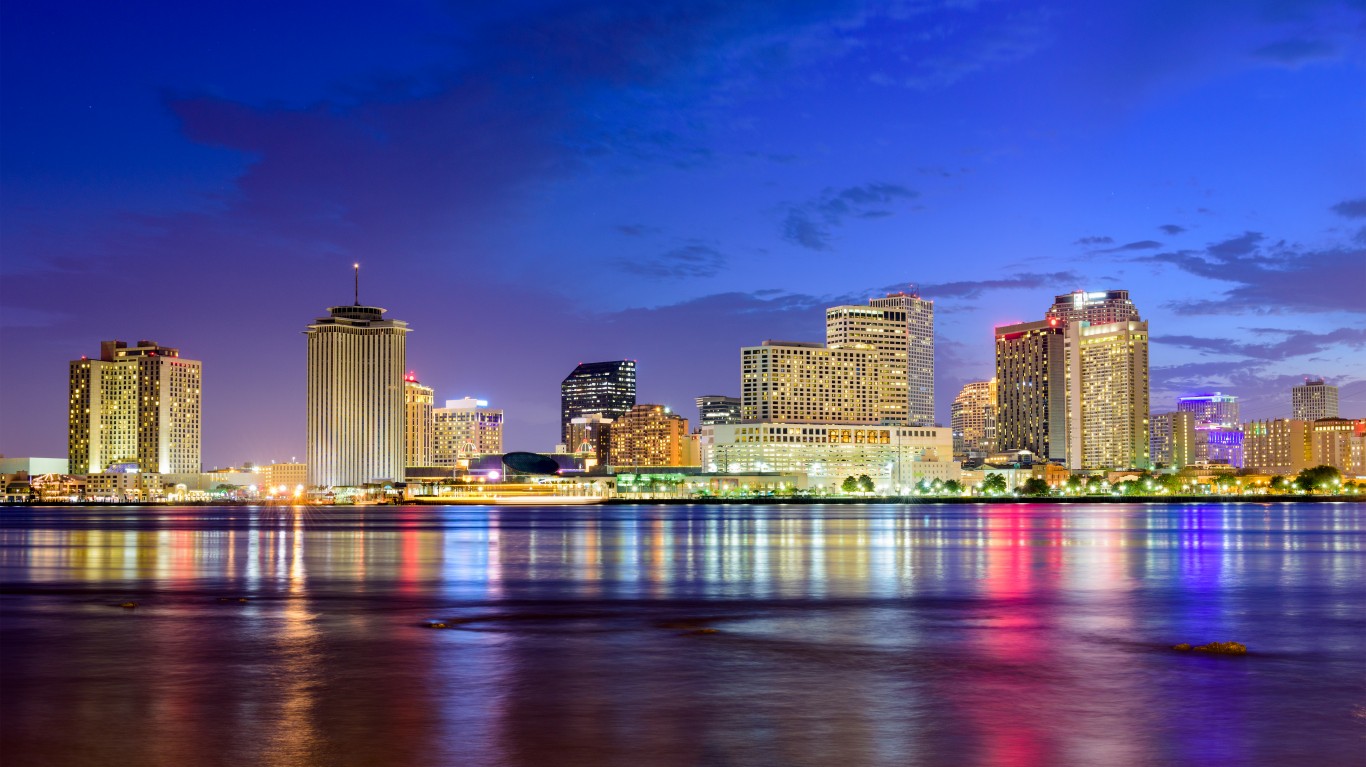
18. Louisiana: New Orleans
> Population, 2017: 393,292
> Change since 2010: +13.1%
> State population: 4,684,333 (25th highest)
> Share of state pop. living in largest city: 8.4% (23rd lowest)
> Land area: 350.2 sq. miles
> Population density: 2,029 / sq. mile
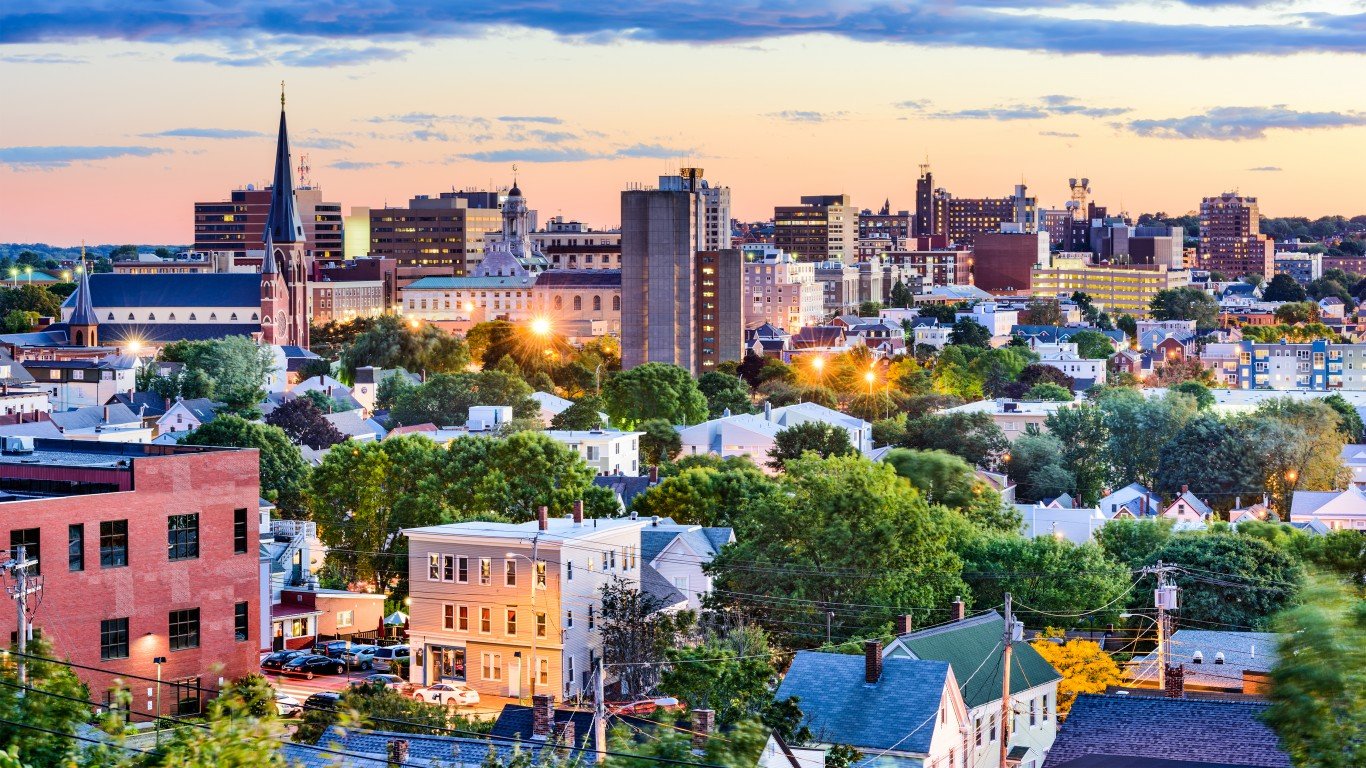
19. Maine: Portland
> Population, 2017: 66,882
> Change since 2010: +1.2%
> State population: 1,335,907 (9th lowest)
> Share of state pop. living in largest city: 5.0% (8th lowest)
> Land area: 69.4 sq. miles
> Population density: 3,107 / sq. mile
[in-text-ad-2]

20. Maryland: Baltimore
> Population, 2017: 611,648
> Change since 2010: -1.5%
> State population: 6,052,177 (19th highest)
> Share of state pop. living in largest city: 10.1% (25th highest)
> Land area: 92.0 sq. miles
> Population density: 7,672 / sq. mile

21. Massachusetts: Boston
> Population, 2017: 685,094
> Change since 2010: +10.4%
> State population: 6,859,819 (15th highest)
> Share of state pop. living in largest city: 10.0% (25th lowest)
> Land area: 89.6 sq. miles
> Population density: 12,793 / sq. mile
[in-text-ad]
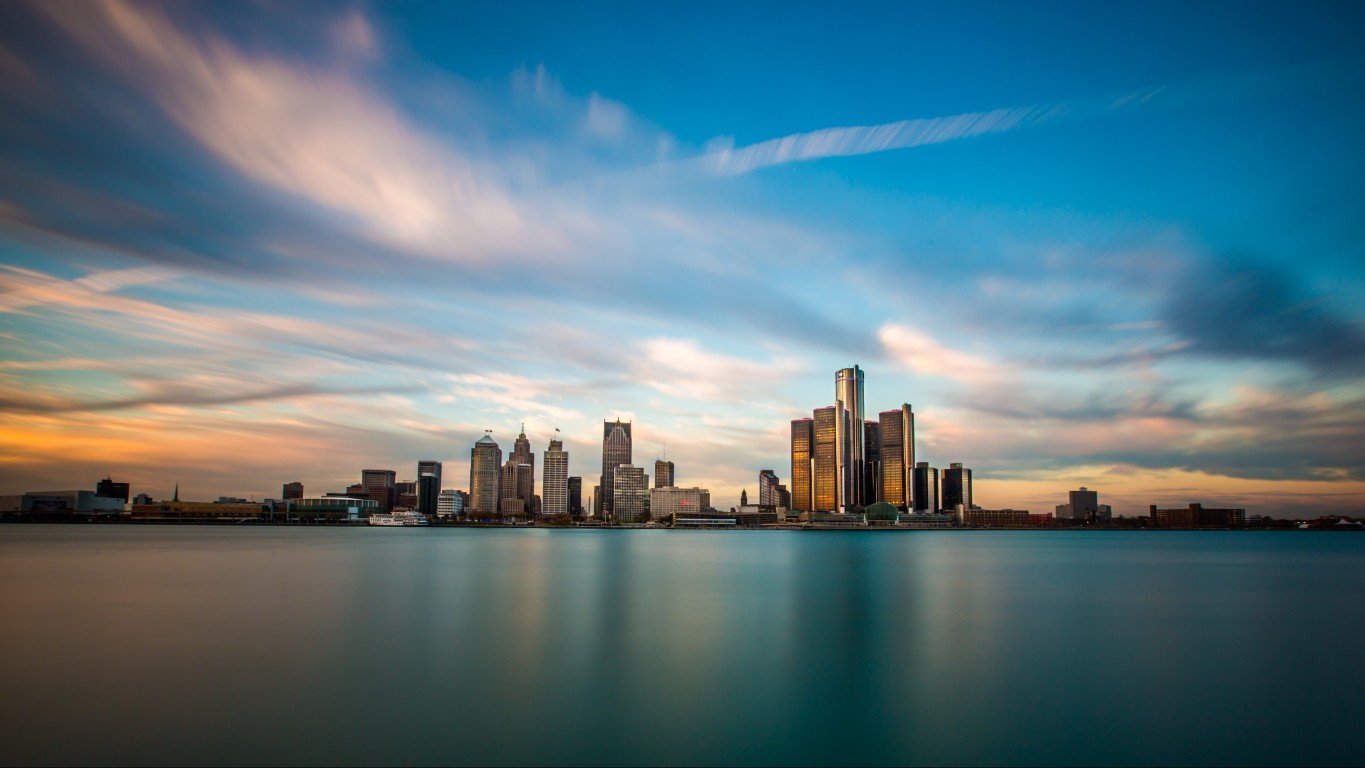
22. Michigan: Detroit
> Population, 2017: 673,104
> Change since 2010: -5.3%
> State population: 9,962,311 (10th highest)
> Share of state pop. living in largest city: 6.8% (13th lowest)
> Land area: 142.9 sq. miles
> Population density: 5,144 / sq. mile
[recirclink id=444046]
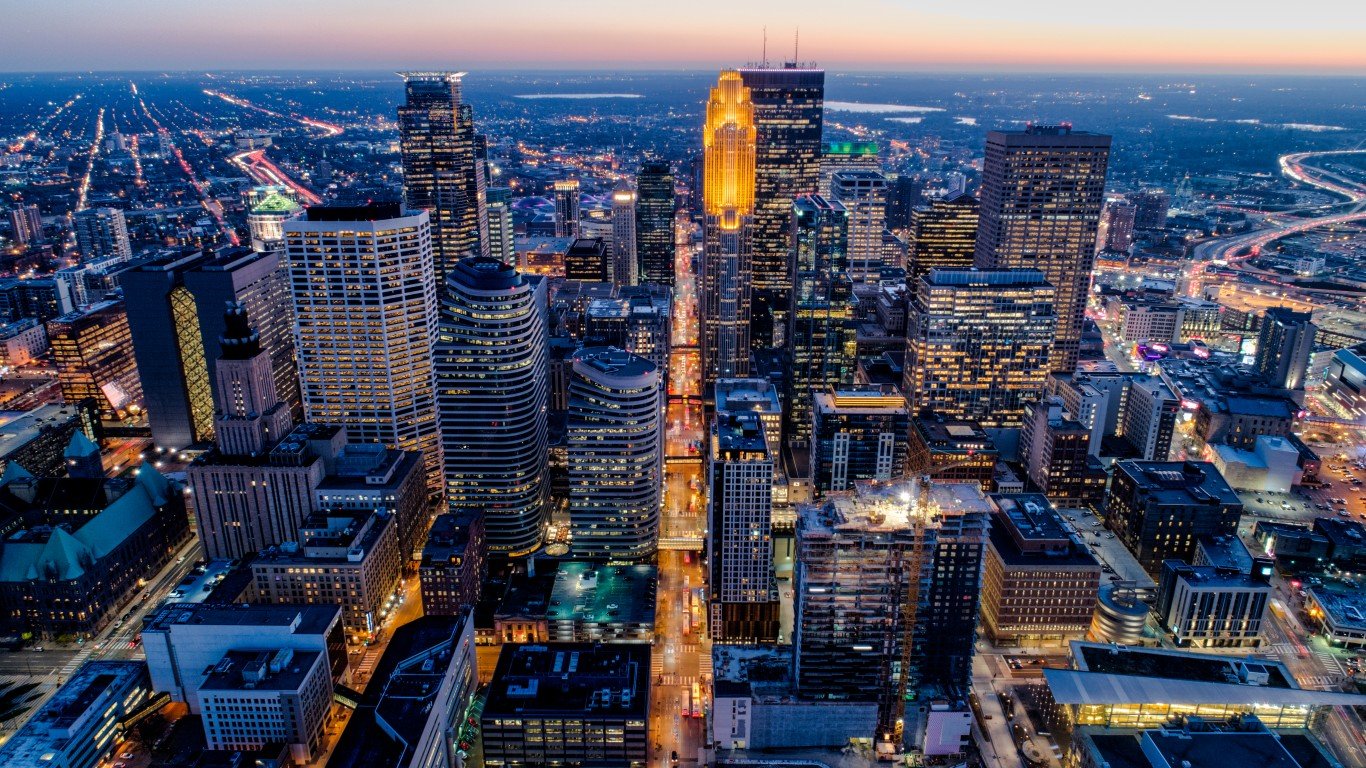
23. Minnesota: Minneapolis
> Population, 2017: 422,331
> Change since 2010: +10.2%
> State population: 5,576,606 (22nd highest)
> Share of state pop. living in largest city: 7.6% (18th lowest)
> Land area: 57.5 sq. miles
> Population density: 7,088 / sq. mile
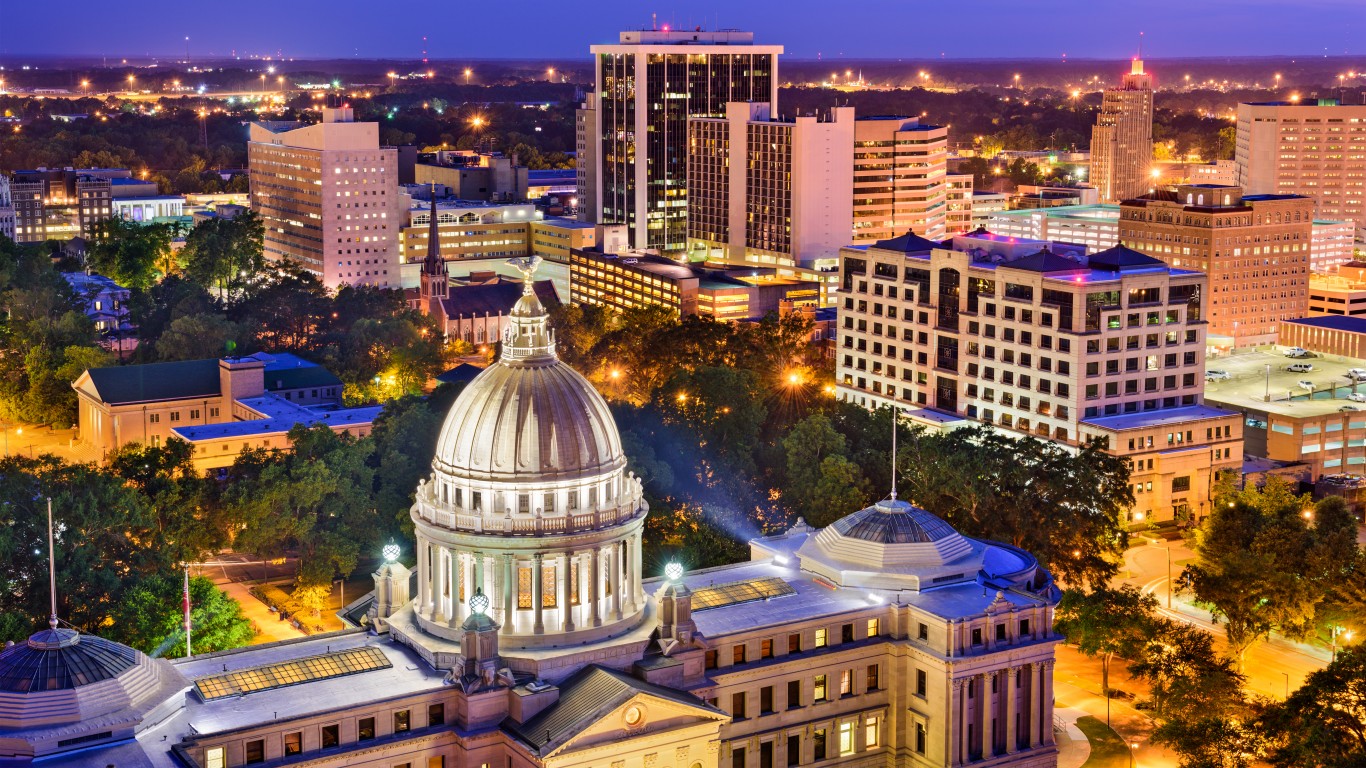
24. Mississippi: Jackson
> Population, 2017: 166,965
> Change since 2010: -3.9%
> State population: 2,984,100 (17th lowest)
> Share of state pop. living in largest city: 5.6% (10th lowest)
> Land area: 113.2 sq. miles
> Population density: 1,563 / sq. mile
[in-text-ad-2]
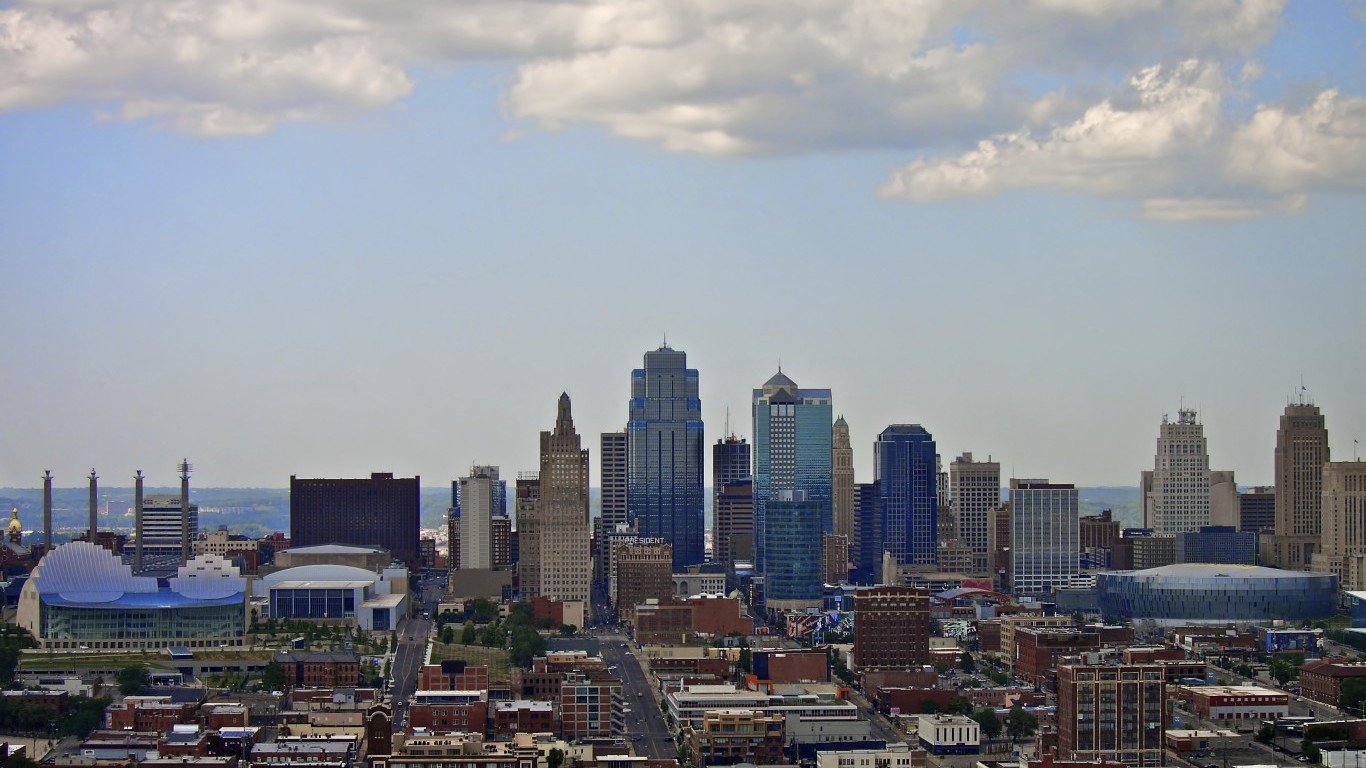
25. Missouri: Kansas City
> Population, 2017: 488,943
> Change since 2010: +6.1%
> State population: 6,113,532 (18th highest)
> Share of state pop. living in largest city: 8.0% (19th lowest)
> Land area: 319.0 sq. miles
> Population density: 1,460 / sq. mile
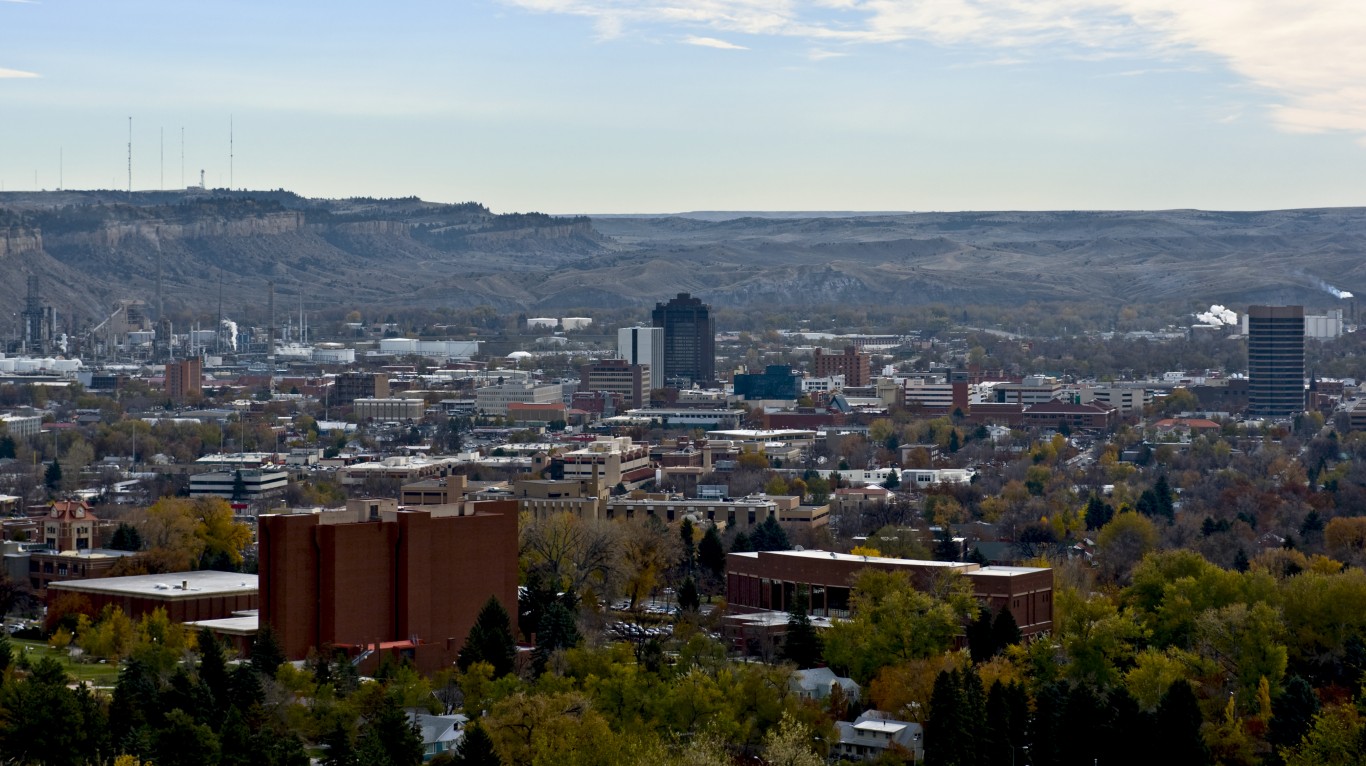
26. Montana: Billings
> Population, 2017: 109,642
> Change since 2010: +4.9%
> State population: 1,050,493 (7th lowest)
> Share of state pop. living in largest city: 10.4% (21st highest)
> Land area: 43.5 sq. miles
> Population density: 2,400 / sq. mile
[in-text-ad]

27. Nebraska: Omaha
> Population, 2017: 466,893
> Change since 2010: +3.7%
> State population: 1,920,076 (14th lowest)
> Share of state pop. living in largest city: 24.3% (5th highest)
> Land area: 130.6 sq. miles
> Population density: 3,218 / sq. mile
[recirclink id=443940]

28. Nevada: Las Vegas
> Population, 2017: 641,676
> Change since 2010: +9.7%
> State population: 2,998,039 (18th lowest)
> Share of state pop. living in largest city: 21.4% (7th highest)
> Land area: 135.9 sq. miles
> Population density: 4,298 / sq. mile
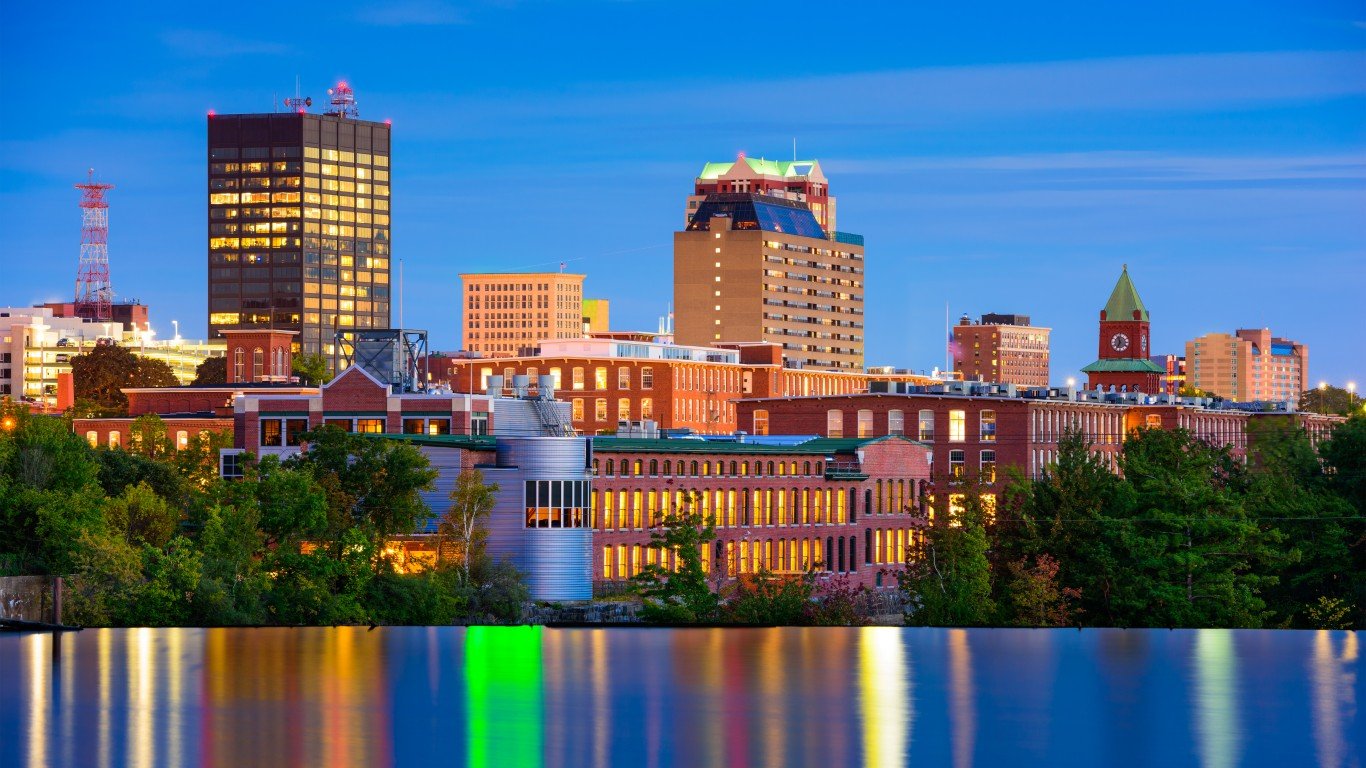
29. New Hampshire: Manchester
> Population, 2017: 111,196
> Change since 2010: +1.4%
> State population: 1,342,795 (10th lowest)
> Share of state pop. living in largest city: 8.3% (21st lowest)
> Land area: 35.0 sq. miles
> Population density: 3,310 / sq. mile
[in-text-ad-2]
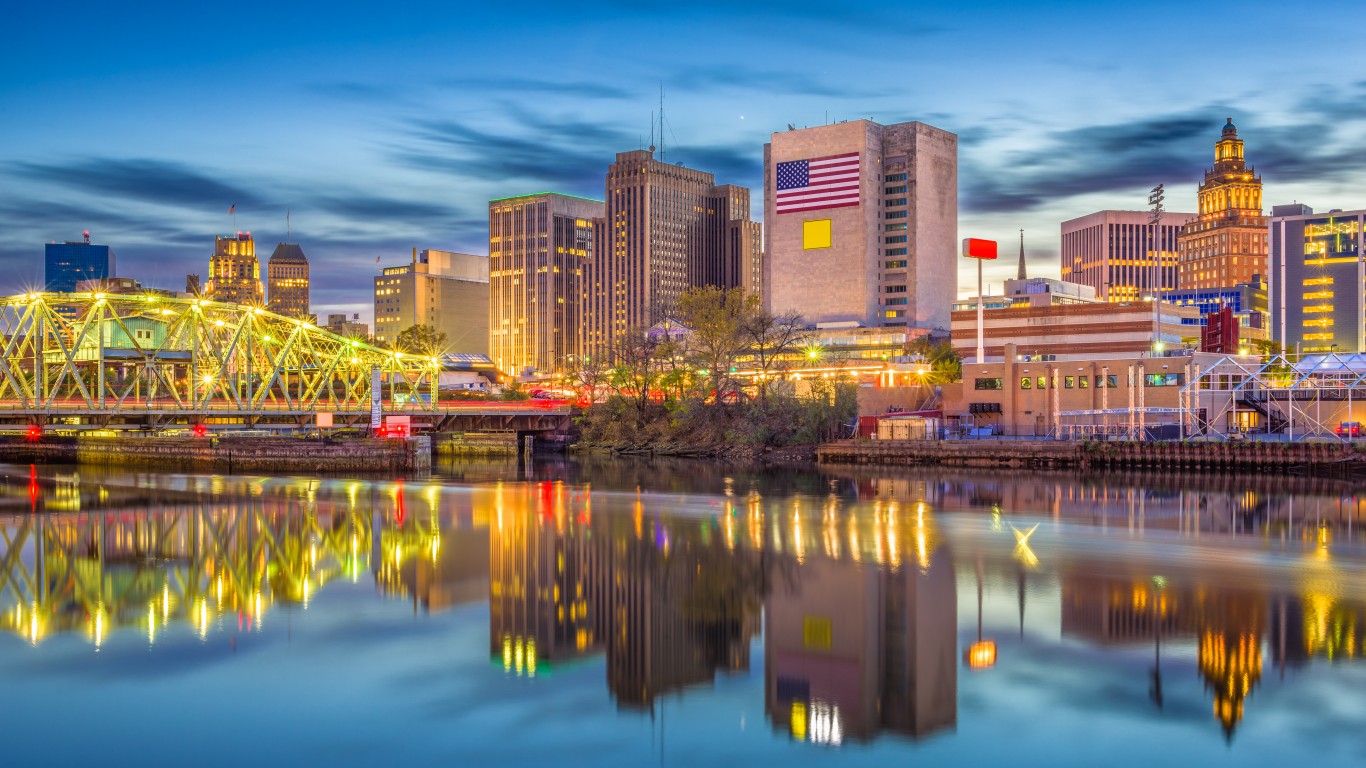
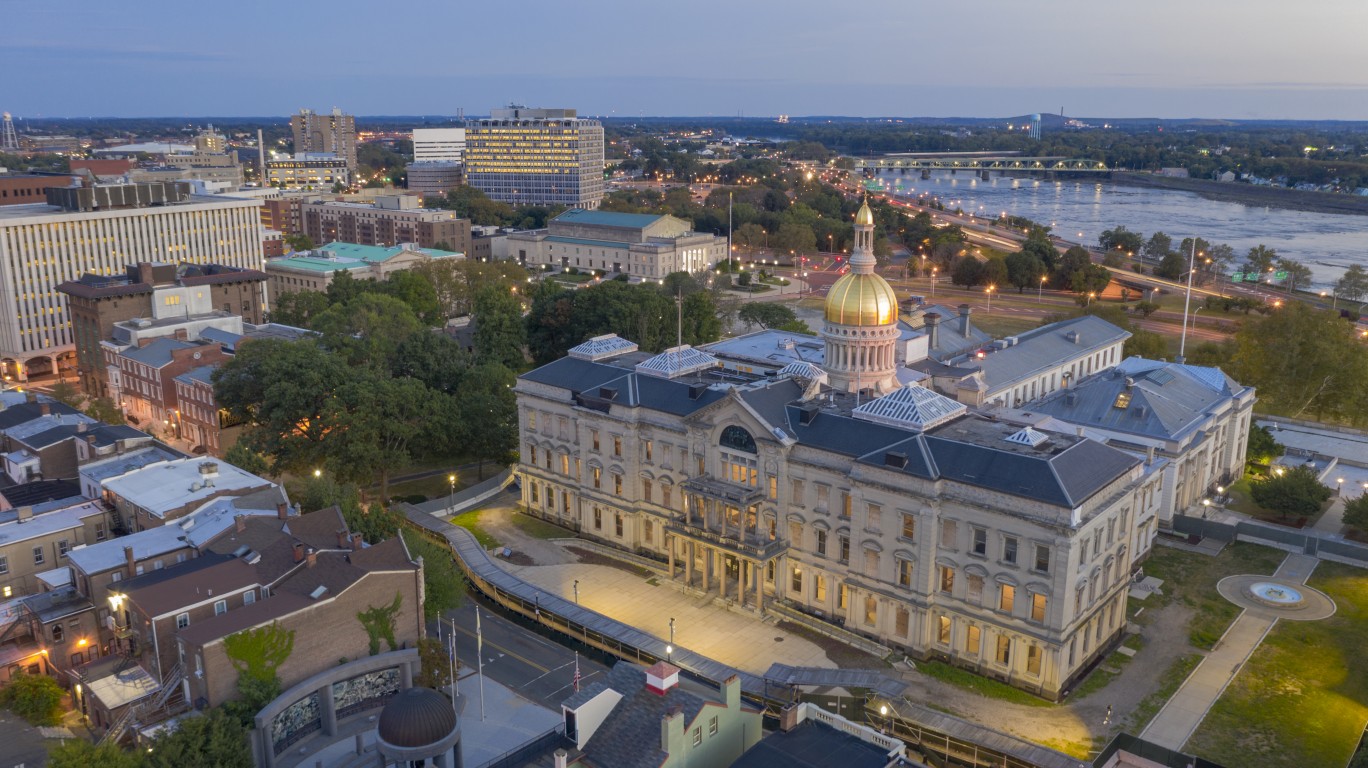
30. New Jersey: Newark
> Population, 2017: 285,154
> Change since 2010: +2.8%
> State population: 9,005,644 (11th highest)
> Share of state pop. living in largest city: 3.2% (3rd lowest)
> Land area: 26.1 sq. miles
> Population density: 11,458 / sq. mile
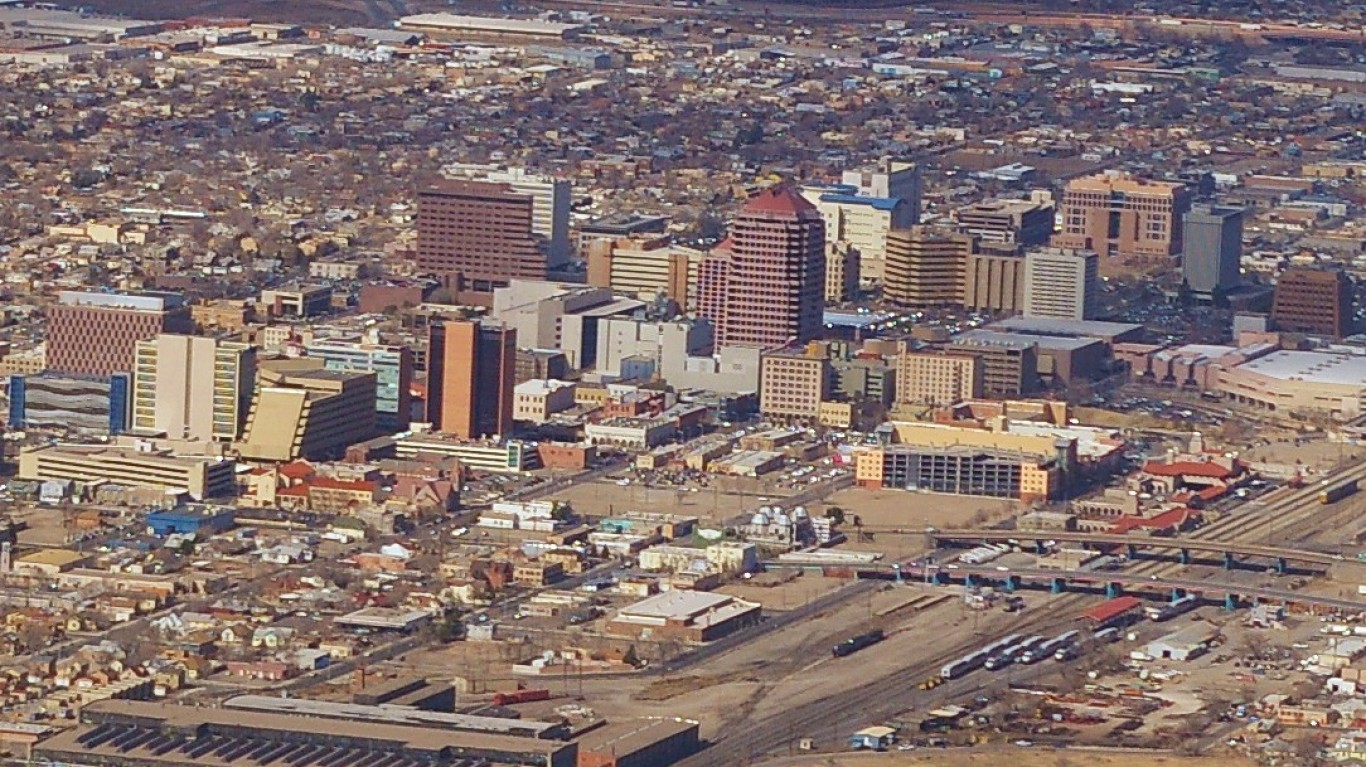
31. New Mexico: Albuquerque
> Population, 2017: 558,545
> Change since 2010: +2.1%
> State population: 2,088,070 (15th lowest)
> Share of state pop. living in largest city: 26.7% (3rd highest)
> Land area: 189.6 sq. miles
> Population density: 2,908 / sq. mile
[in-text-ad]
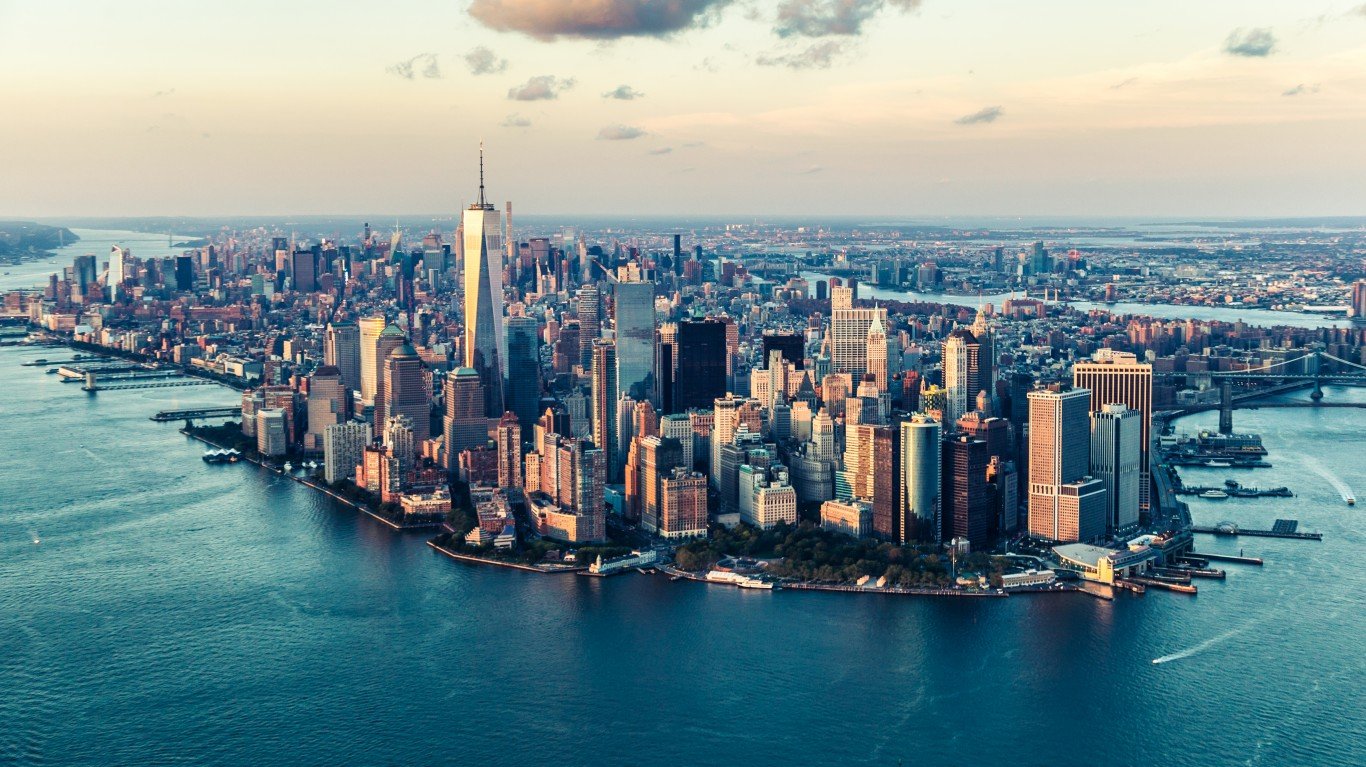
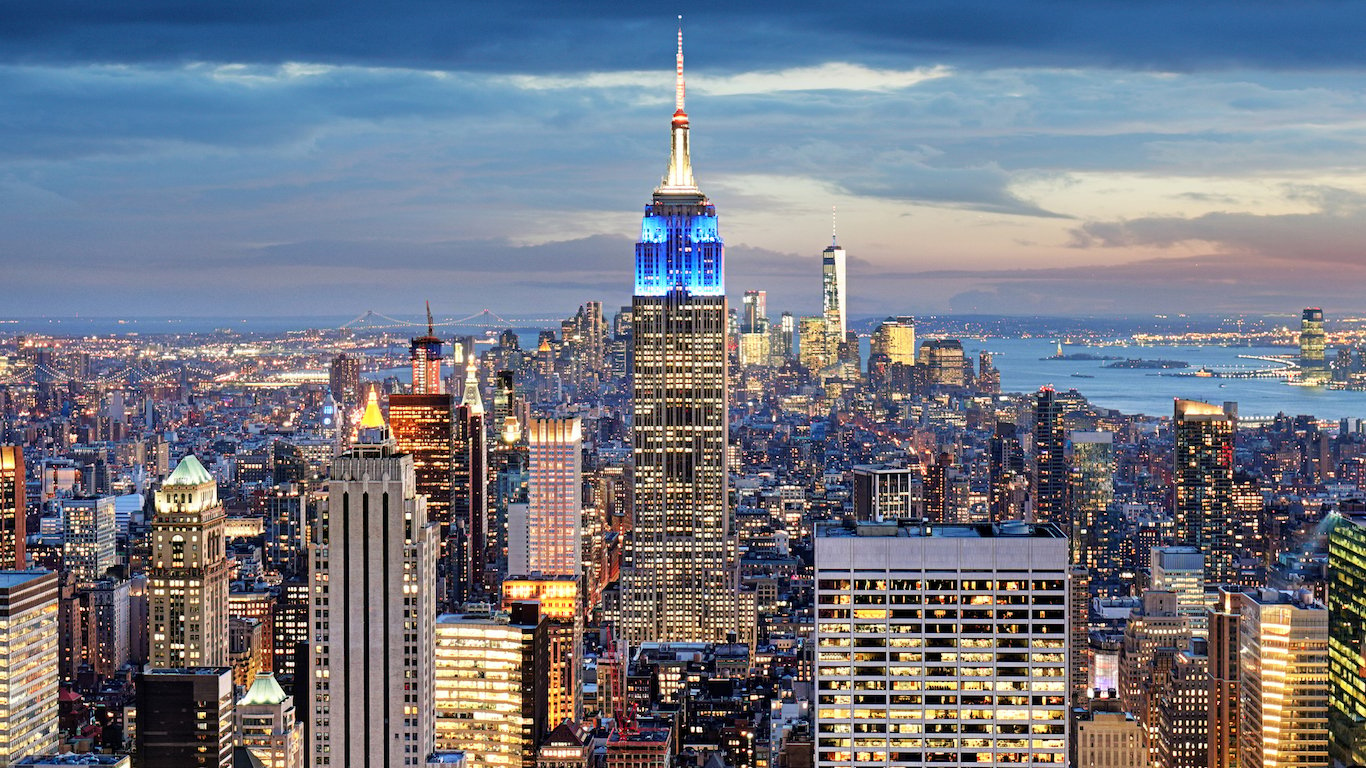
32. New York: New York
> Population, 2017: 8,622,698
> Change since 2010: +5.2%
> State population: 19,849,399 (4th highest)
> Share of state pop. living in largest city: 43.4% (the highest)
> Land area: 468.5 sq. miles
> Population density: 27,012 / sq. mile
[recirclink id=443564]

33. North Carolina: Charlotte
> Population, 2017: 859,035
> Change since 2010: +16.3%
> State population: 10,273,419 (9th highest)
> Share of state pop. living in largest city: 8.4% (22nd lowest)
> Land area: 299.7 sq. miles
> Population density: 2,457 / sq. mile
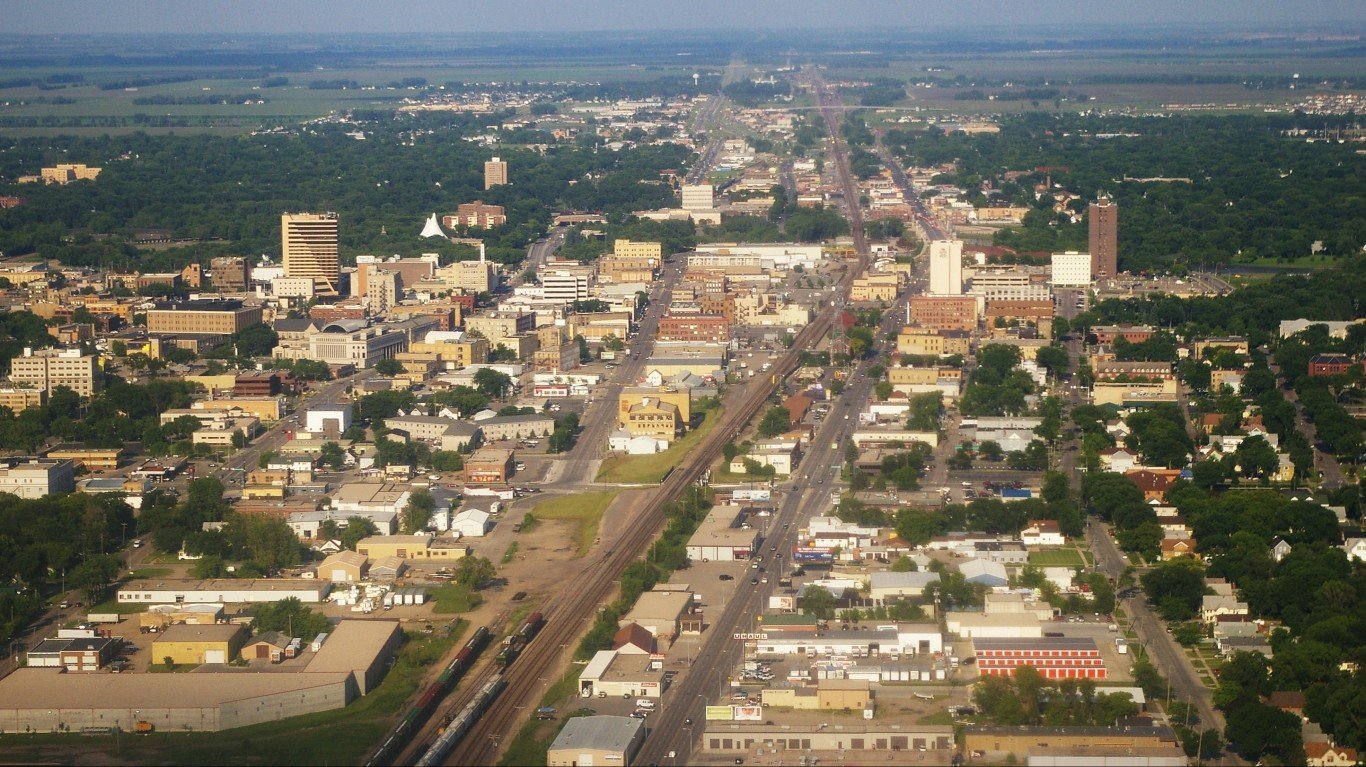
34. North Dakota: Fargo
> Population, 2017: 122,359
> Change since 2010: +15.5%
> State population: 755,393 (4th lowest)
> Share of state pop. living in largest city: 16.2% (13th highest)
> Land area: 48.8 sq. miles
> Population density: 2,162 / sq. mile
[in-text-ad-2]
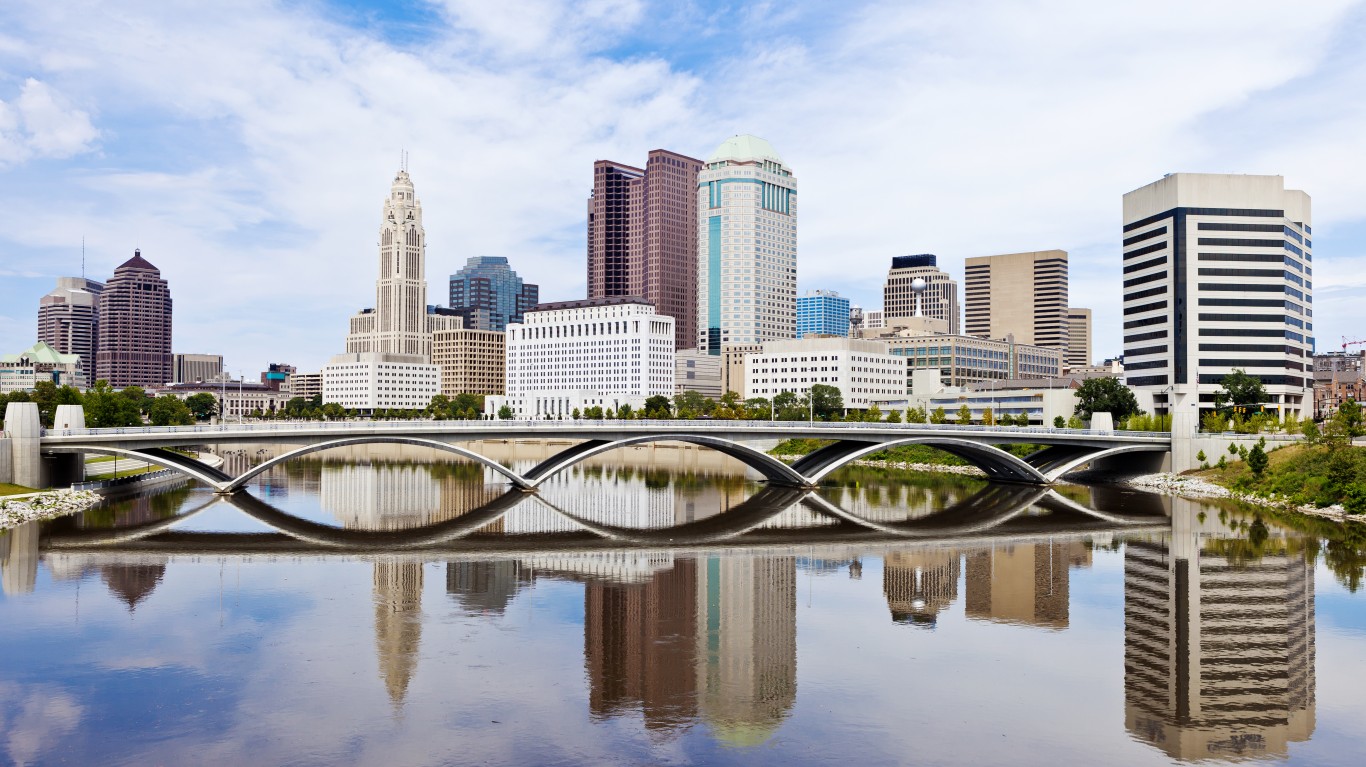
35. Ohio: Columbus
> Population, 2017: 879,170
> Change since 2010: +11.2%
> State population: 11,658,609 (7th highest)
> Share of state pop. living in largest city: 7.5% (17th lowest)
> Land area: 223.1 sq. miles
> Population density: 3,624 / sq. mile
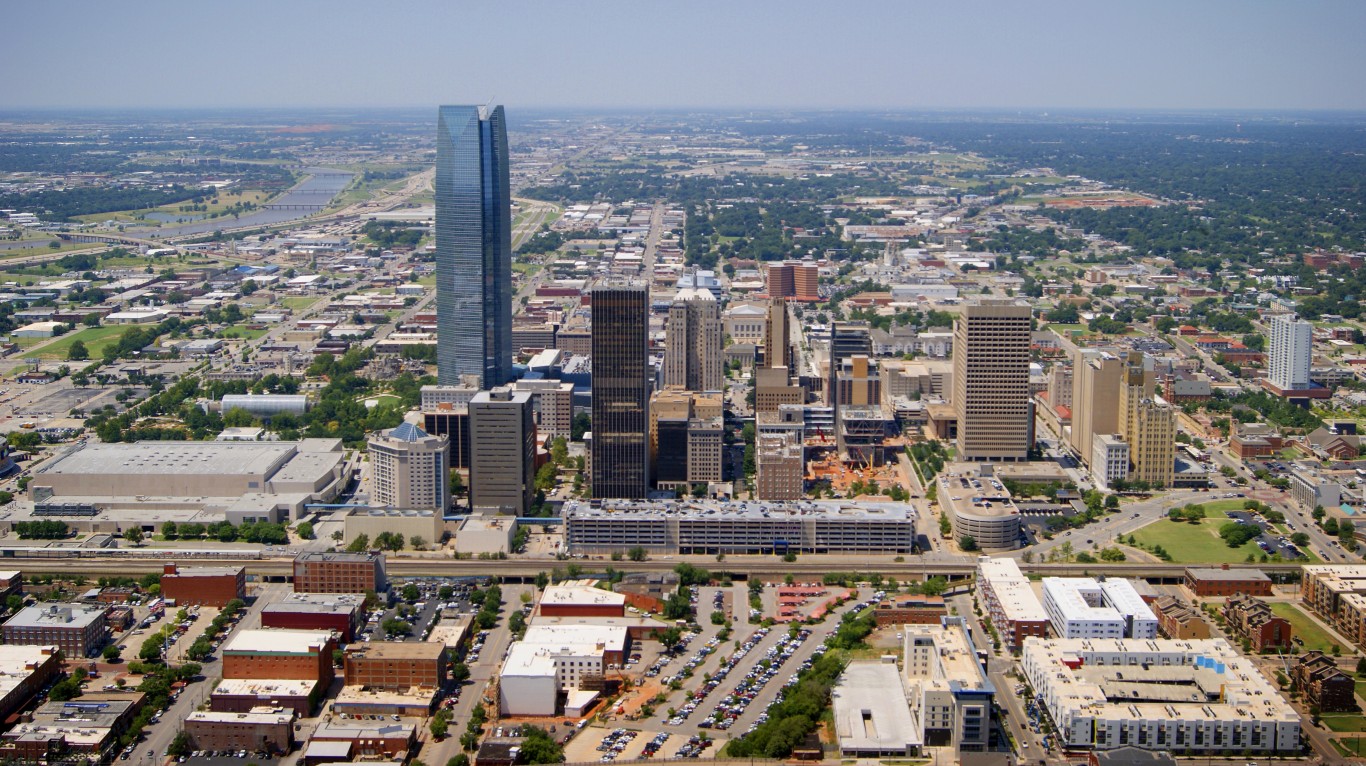
36. Oklahoma: Oklahoma City
> Population, 2017: 643,648
> Change since 2010: +10.5%
> State population: 3,930,864 (23rd lowest)
> Share of state pop. living in largest city: 16.4% (12th highest)
> Land area: 620.8 sq. miles
> Population density: 956 / sq. mile
[in-text-ad]
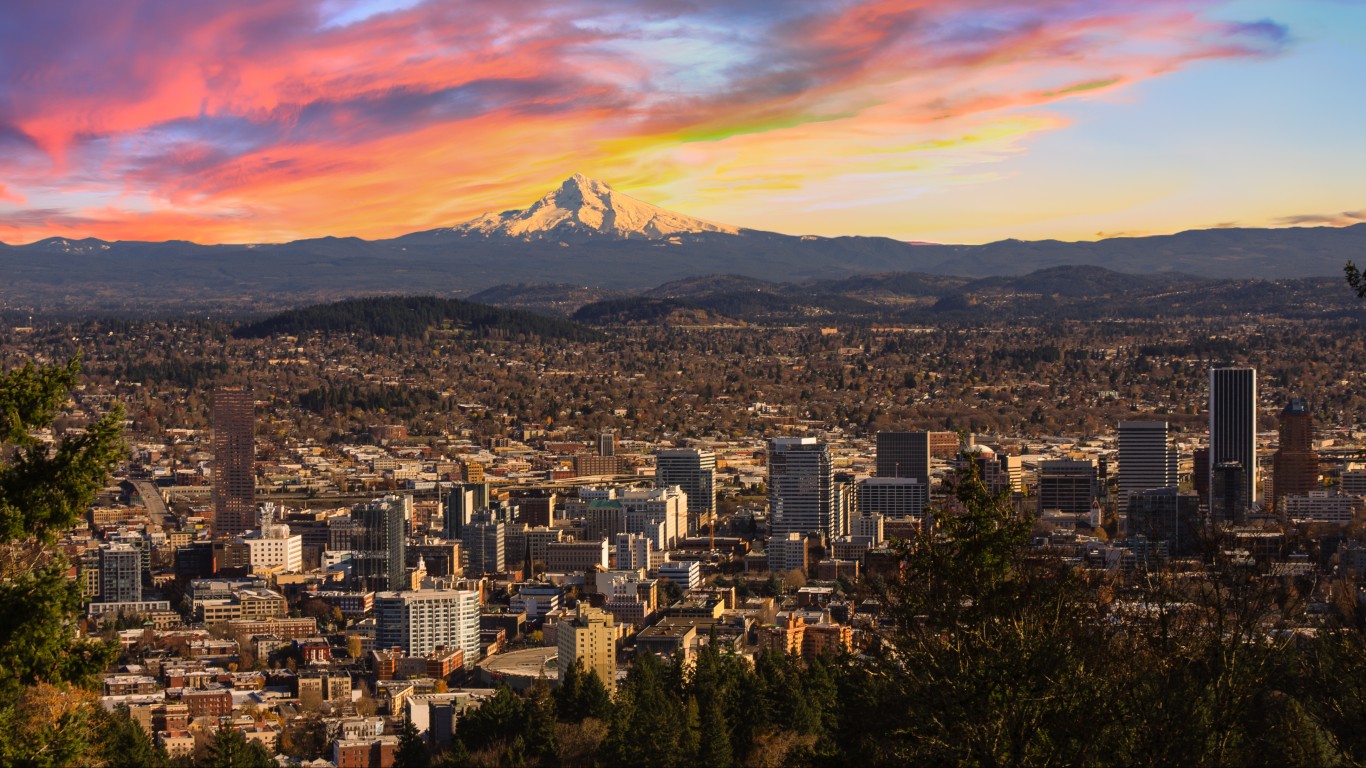
37. Oregon: Portland
> Population, 2017: 647,805
> Change since 2010: +10.7%
> State population: 4,142,776 (24th lowest)
> Share of state pop. living in largest city: 15.6% (14th highest)
> Land area: 145.1 sq. miles
> Population density: 4,375 / sq. mile
[recirclink id=443882]

38. Pennsylvania: Philadelphia
> Population, 2017: 1,580,863
> Change since 2010: +3.4%
> State population: 12,805,537 (5th highest)
> Share of state pop. living in largest city: 12.3% (19th highest)
> Land area: 142.7 sq. miles
> Population density: 11,380 / sq. mile
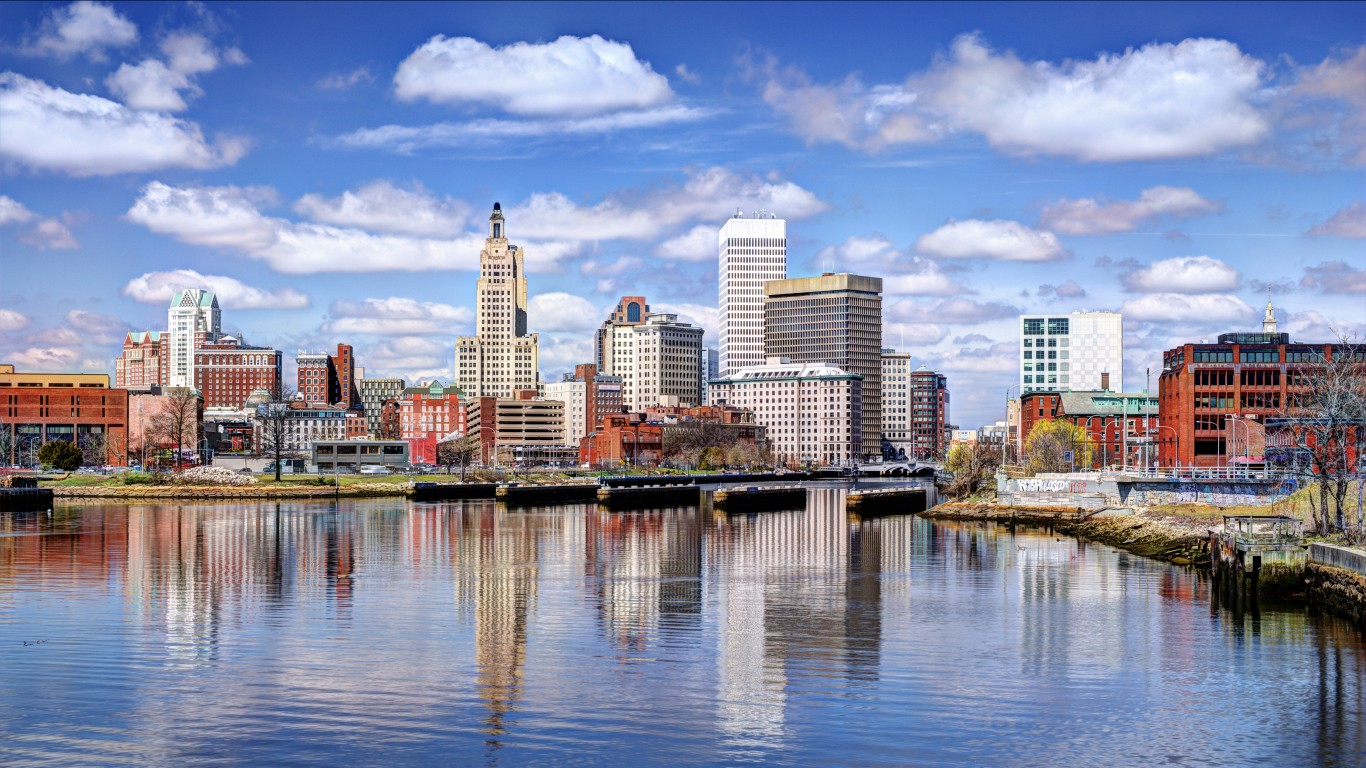
39. Rhode Island: Providence
> Population, 2017: 180,393
> Change since 2010: +1.3%
> State population: 1,059,639 (8th lowest)
> Share of state pop. living in largest city: 17.0% (11th highest)
> Land area: 20.6 sq. miles
> Population density: 9,676 / sq. mile
[in-text-ad-2]
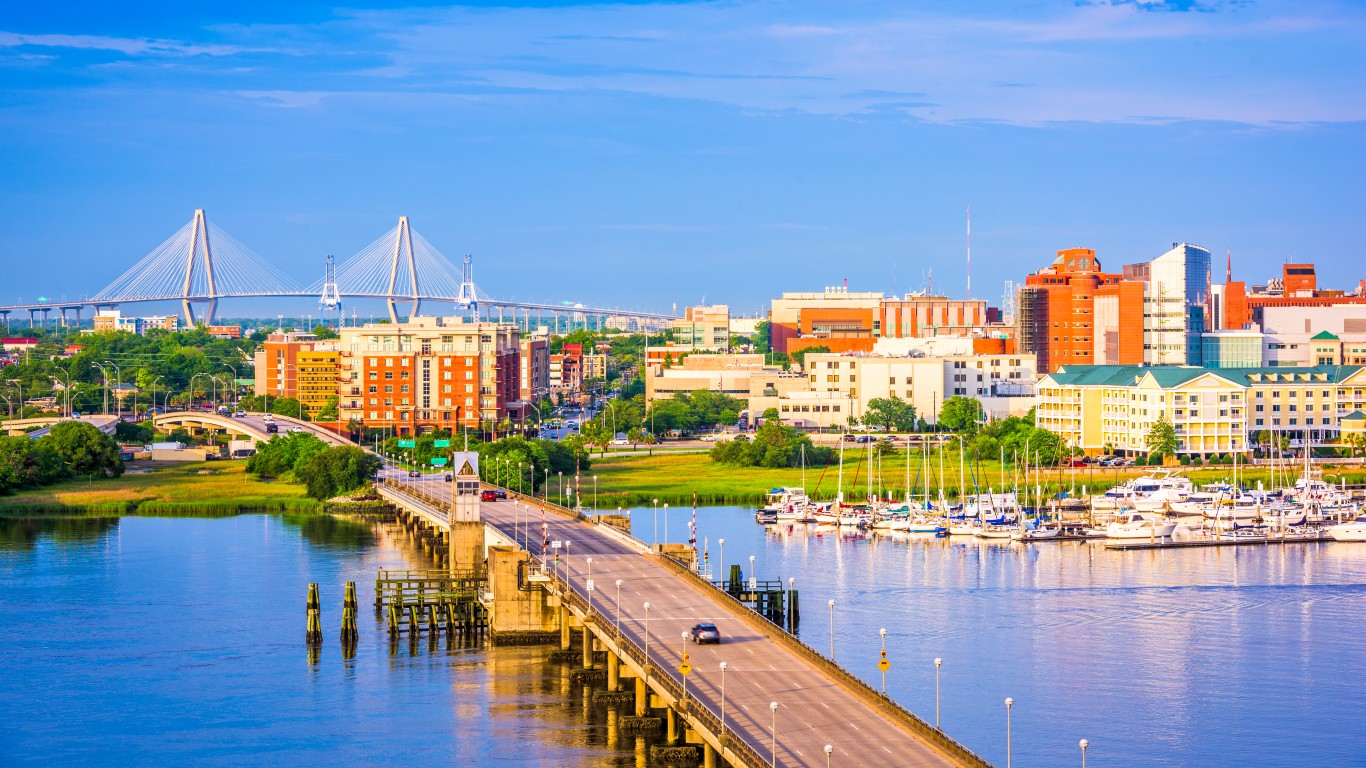
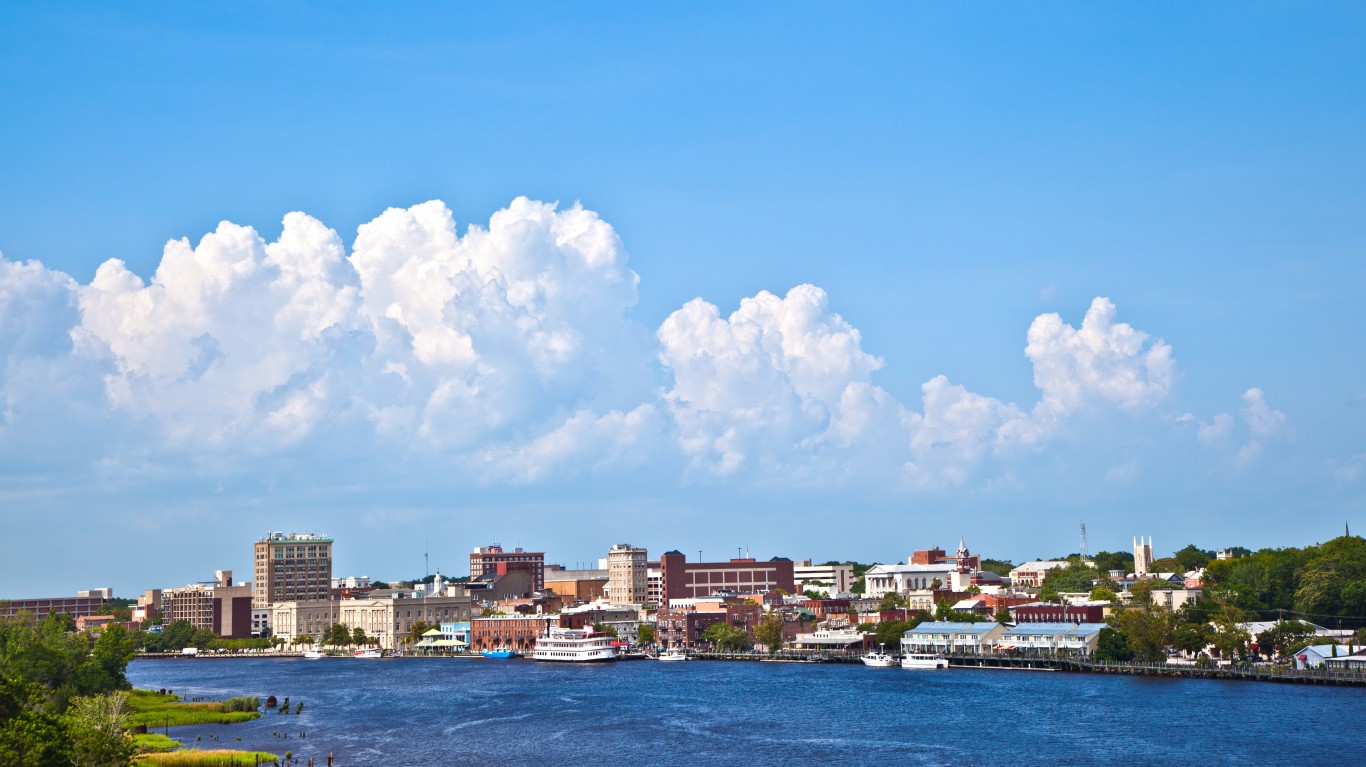
40. South Carolina: Charleston
> Population, 2017: 134,875
> Change since 2010: +12.1%
> State population: 5,024,369 (23rd highest)
> Share of state pop. living in largest city: 2.7% (2nd lowest)
> Land area: 127.5 sq. miles
> Population density: 1,102 / sq. mile
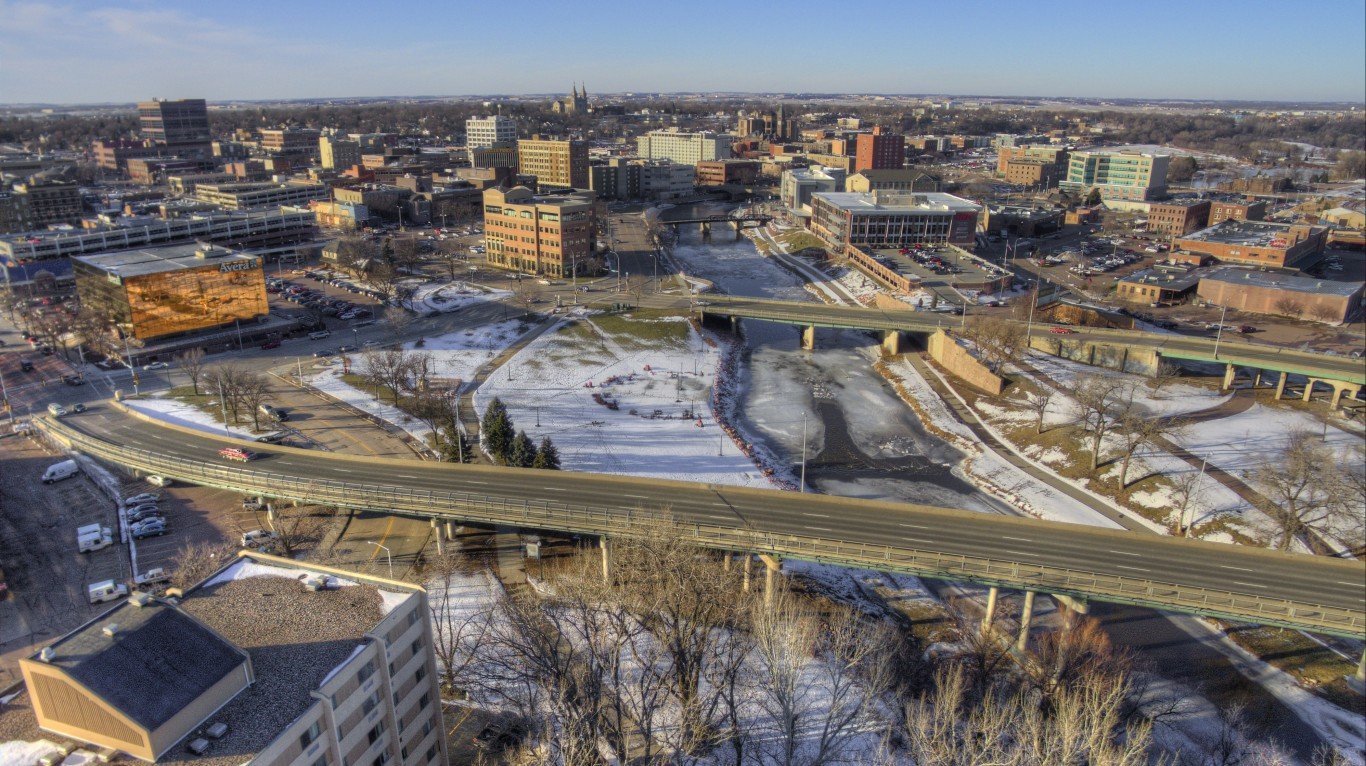
41. South Dakota: Sioux Falls
> Population, 2017: 176,888
> Change since 2010: +14.5%
> State population: 869,666 (5th lowest)
> Share of state pop. living in largest city: 20.3% (9th highest)
> Land area: 73.5 sq. miles
> Population density: 2,109 / sq. mile
[in-text-ad]
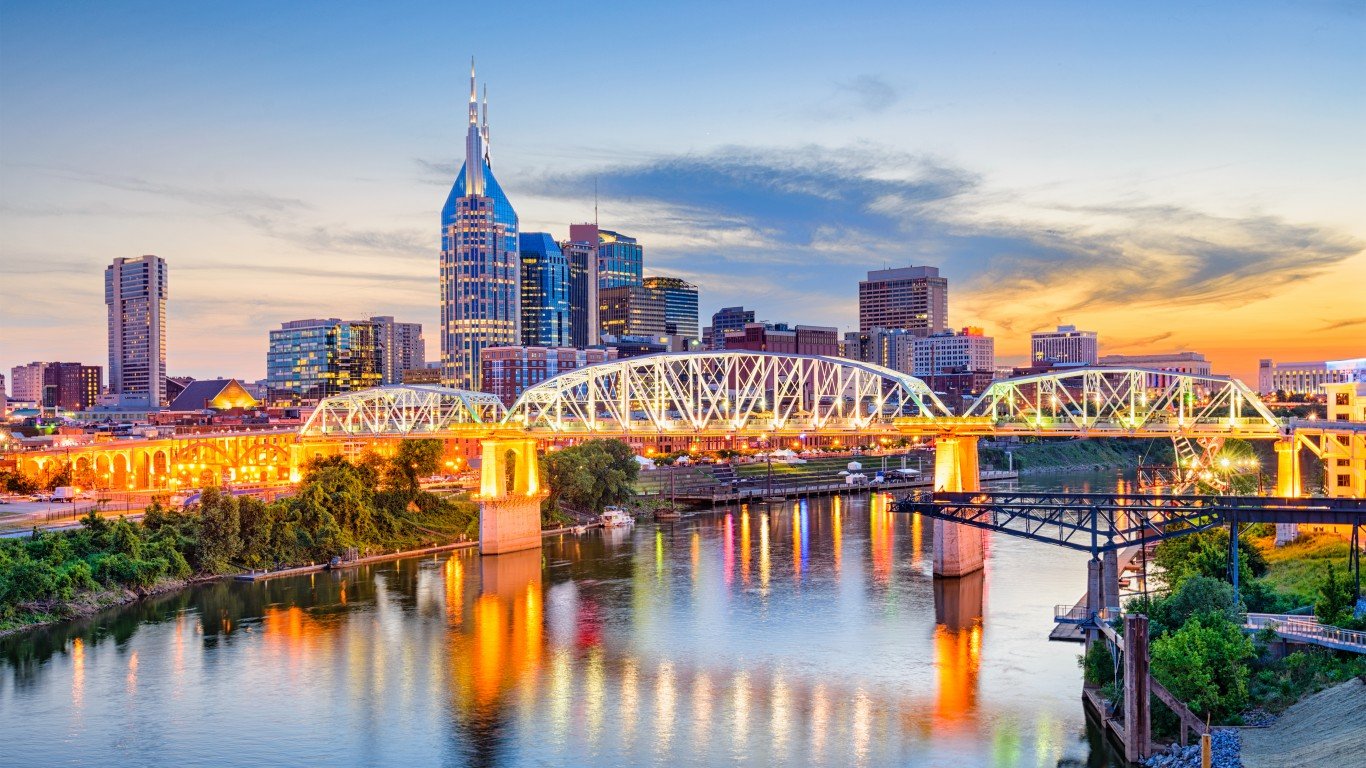
42. Tennessee: Nashville-Davidson
> Population, 2017: 691,243
> Change since 2010: +10.1%
> State population: 6,715,984 (16th highest)
> Share of state pop. living in largest city: 10.3% (22nd highest)
> Land area: 496.9 sq. miles
> Population density: 1,265 / sq. mile
[recirclink id=443620]
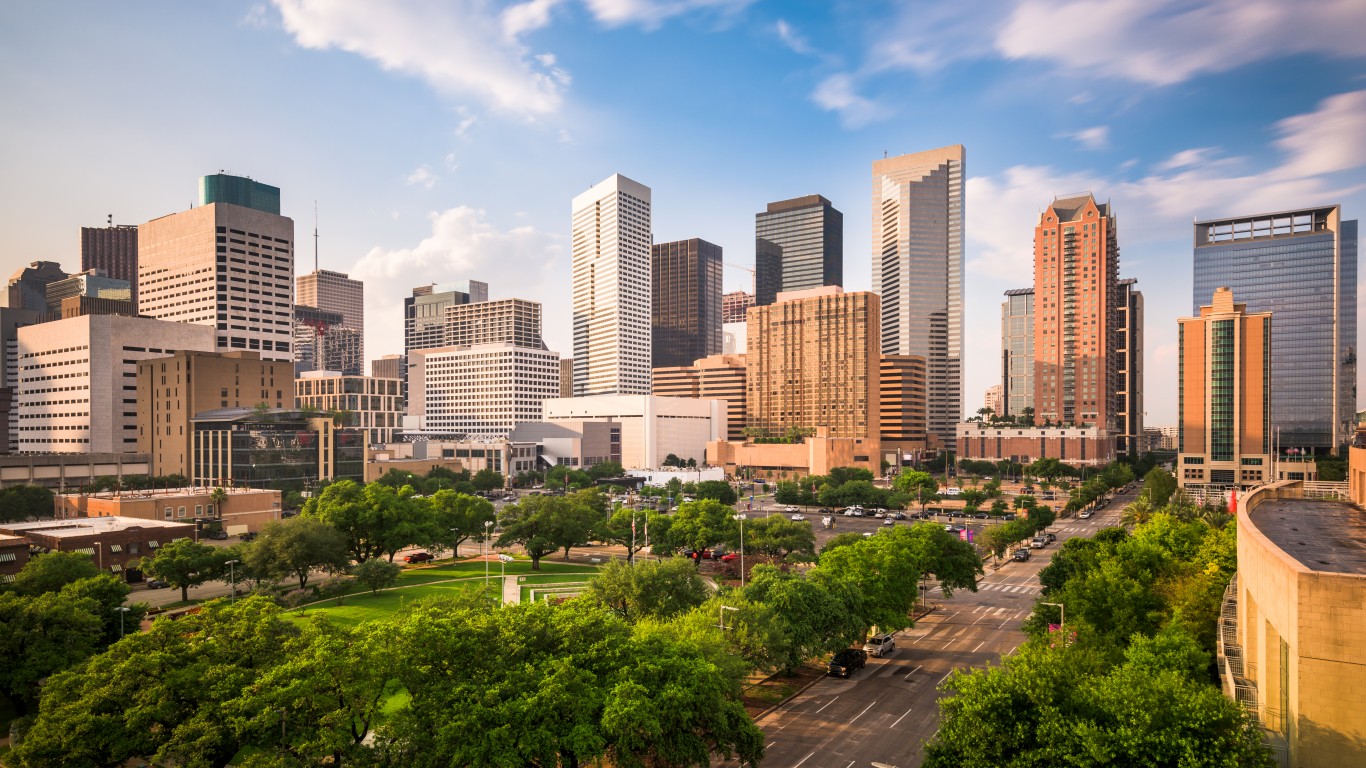
43. Texas: Houston
> Population, 2017: 2,312,717
> Change since 2010: +10.2%
> State population: 28,304,596 (2nd highest)
> Share of state pop. living in largest city: 8.2% (20th lowest)
> Land area: 627.5 sq. miles
> Population density: 3,502 / sq. mile
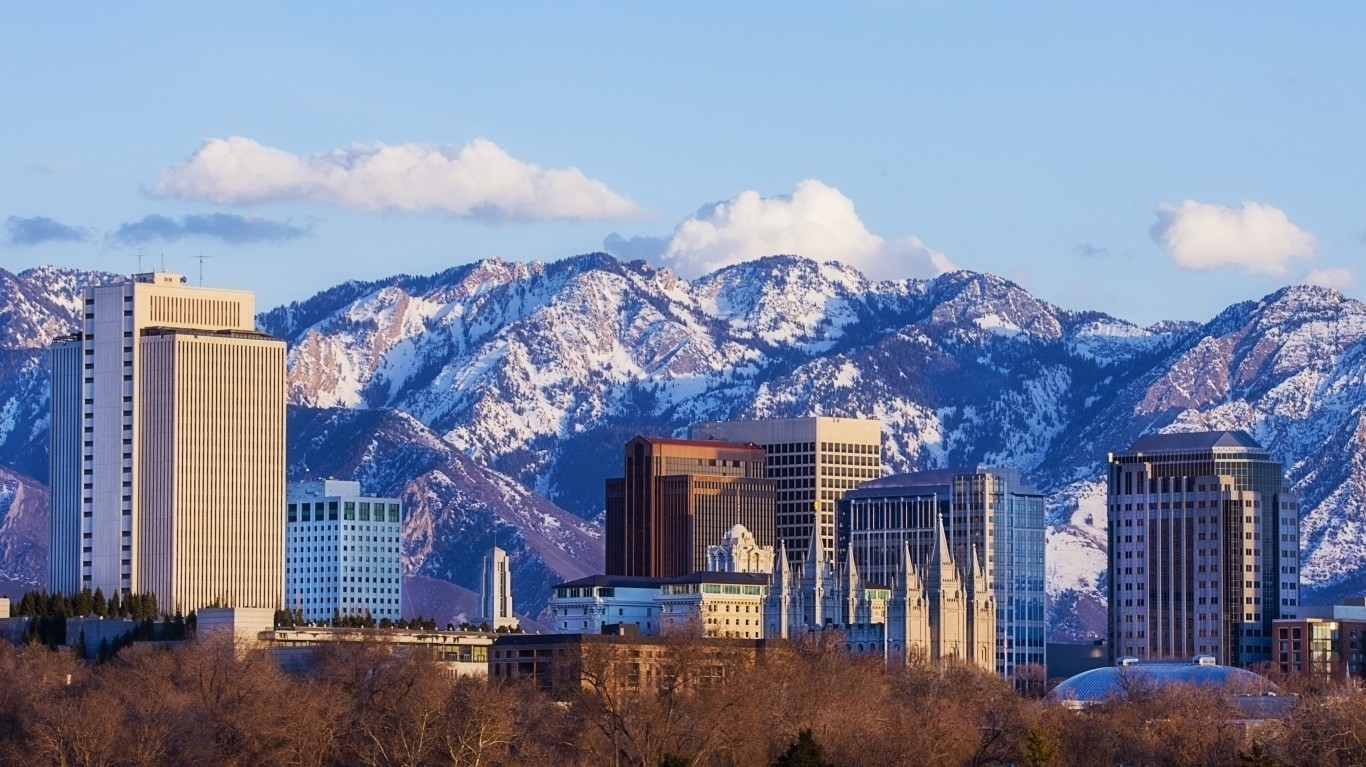
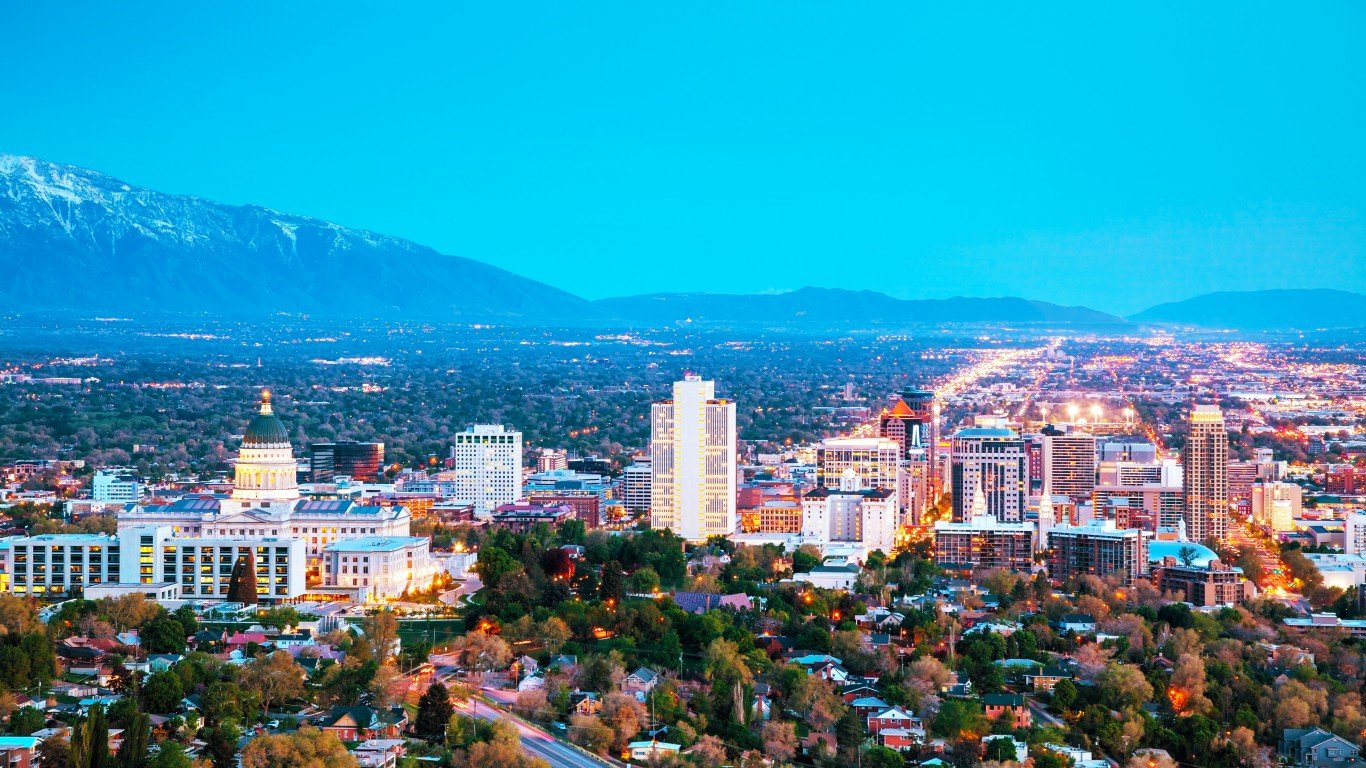
44. Utah: Salt Lake City
> Population, 2017: 200,544
> Change since 2010: +7.5%
> State population: 3,101,833 (20th lowest)
> Share of state pop. living in largest city: 6.5% (11th lowest)
> Land area: 111.7 sq. miles
> Population density: 1,678 / sq. mile
[in-text-ad-2]
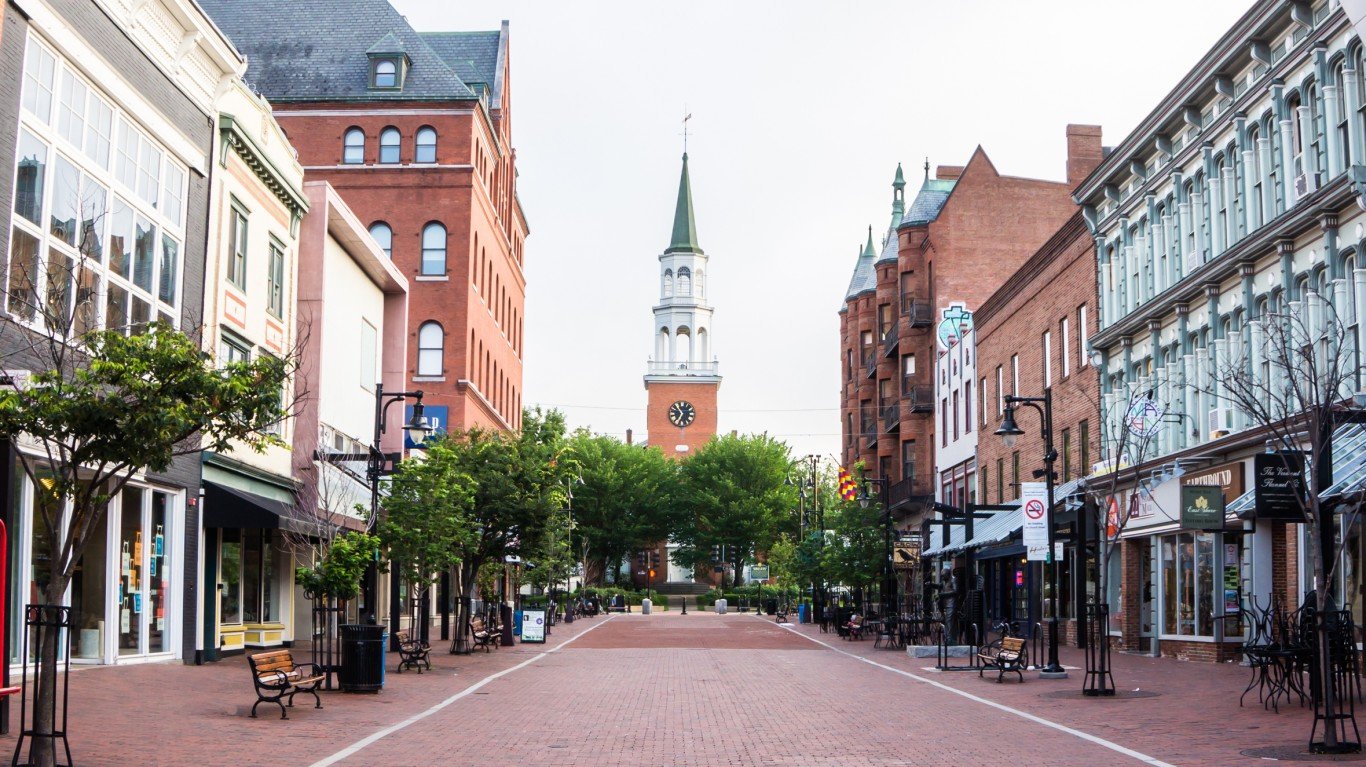
45. Vermont: Burlington
> Population, 2017: 42,239
> Change since 2010: -0.5%
> State population: 623,657 (2nd lowest)
> Share of state pop. living in largest city: 6.8% (14th lowest)
> Land area: 15.5 sq. miles
> Population density: 4,116 / sq. mile

46. Virginia: Virginia Beach
> Population, 2017: 450,435
> Change since 2010: +2.6%
> State population: 8,470,020 (12th highest)
> Share of state pop. living in largest city: 5.3% (9th lowest)
> Land area: 497.3 sq. miles
> Population density: 1,759 / sq. mile
[in-text-ad]
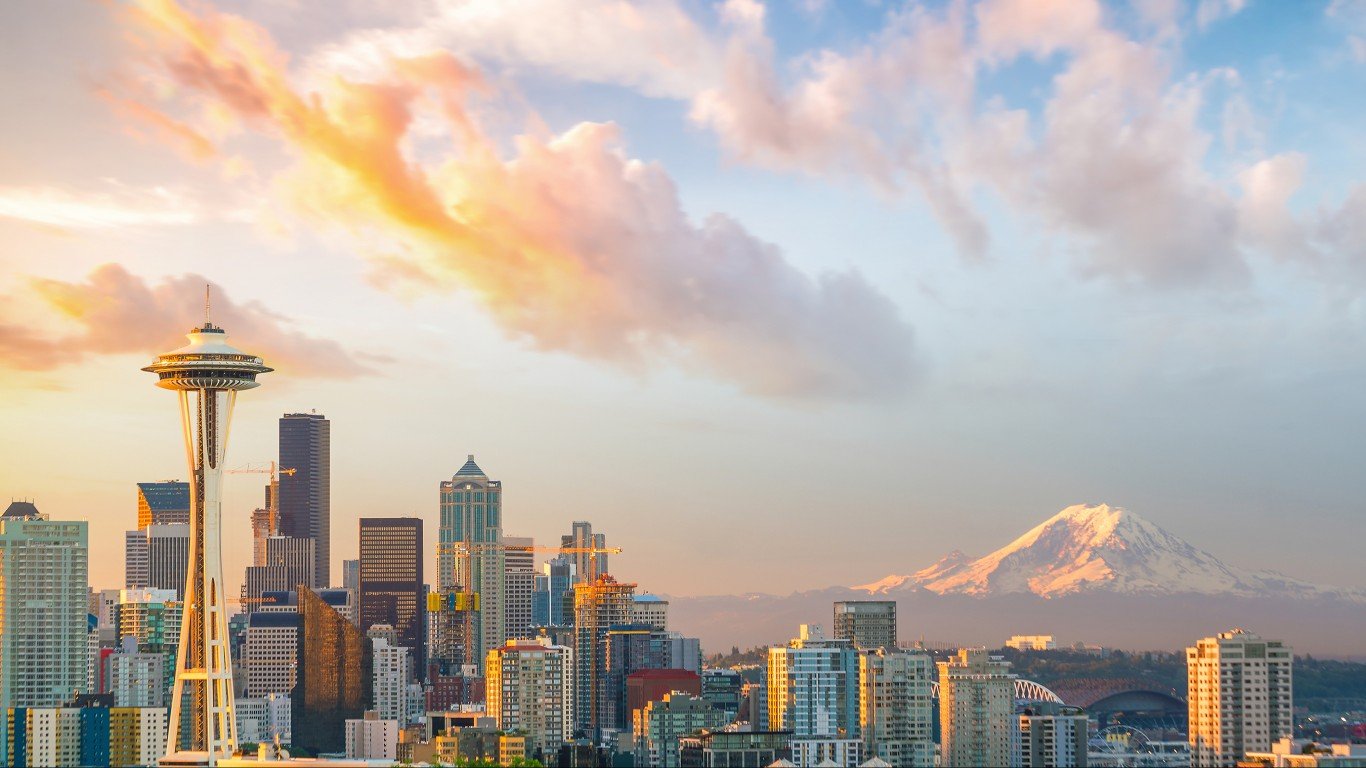
47. Washington: Seattle
> Population, 2017: 724,745
> Change since 2010: +18.7%
> State population: 7,405,743 (13th highest)
> Share of state pop. living in largest city: 9.8% (24th lowest)
> Land area: 142.7 sq. miles
> Population density: 7,251 / sq. mile
[recirclink id=443575]
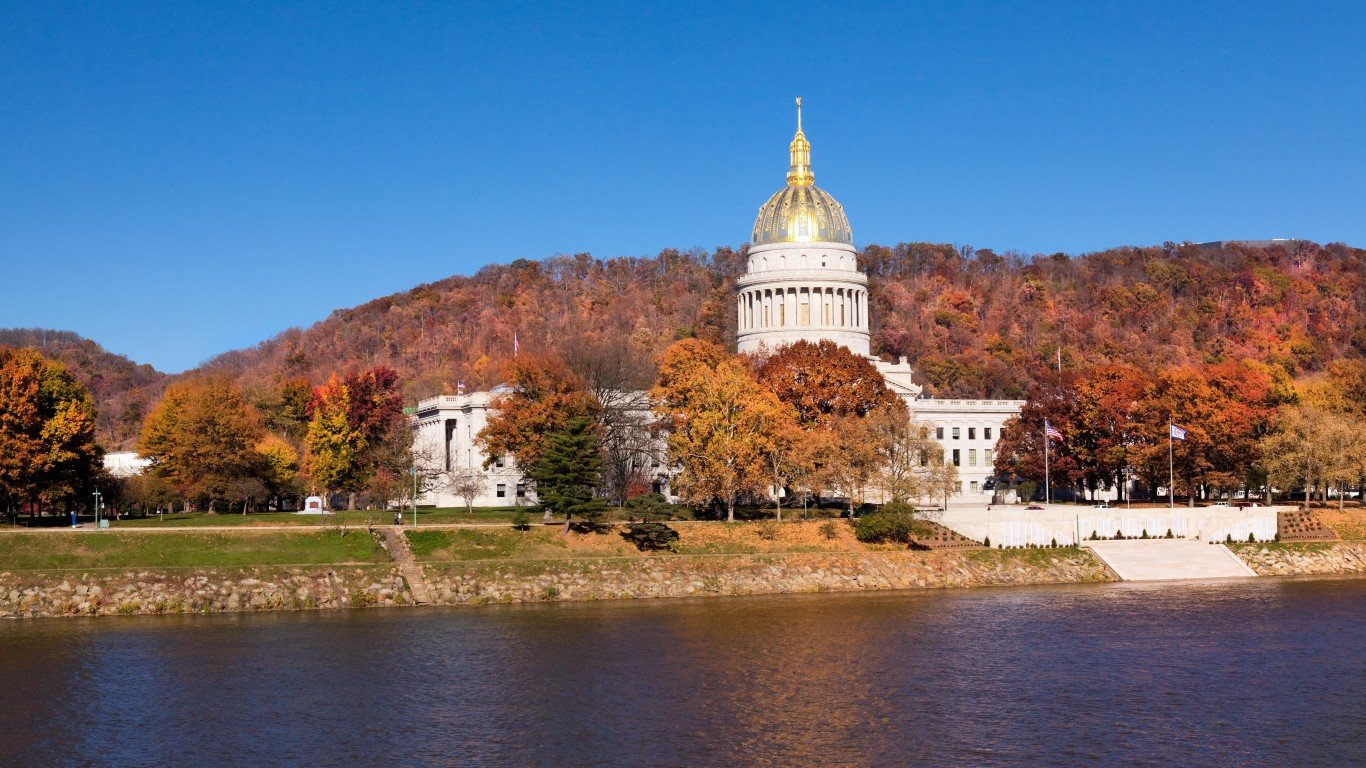
48. West Virginia: Charleston
> Population, 2017: 47,929
> Change since 2010: -6.5%
> State population: 1,815,857 (13th lowest)
> Share of state pop. living in largest city: 2.6% (the lowest)
> Land area: 32.7 sq. miles
> Population density: 1,631 / sq. mile
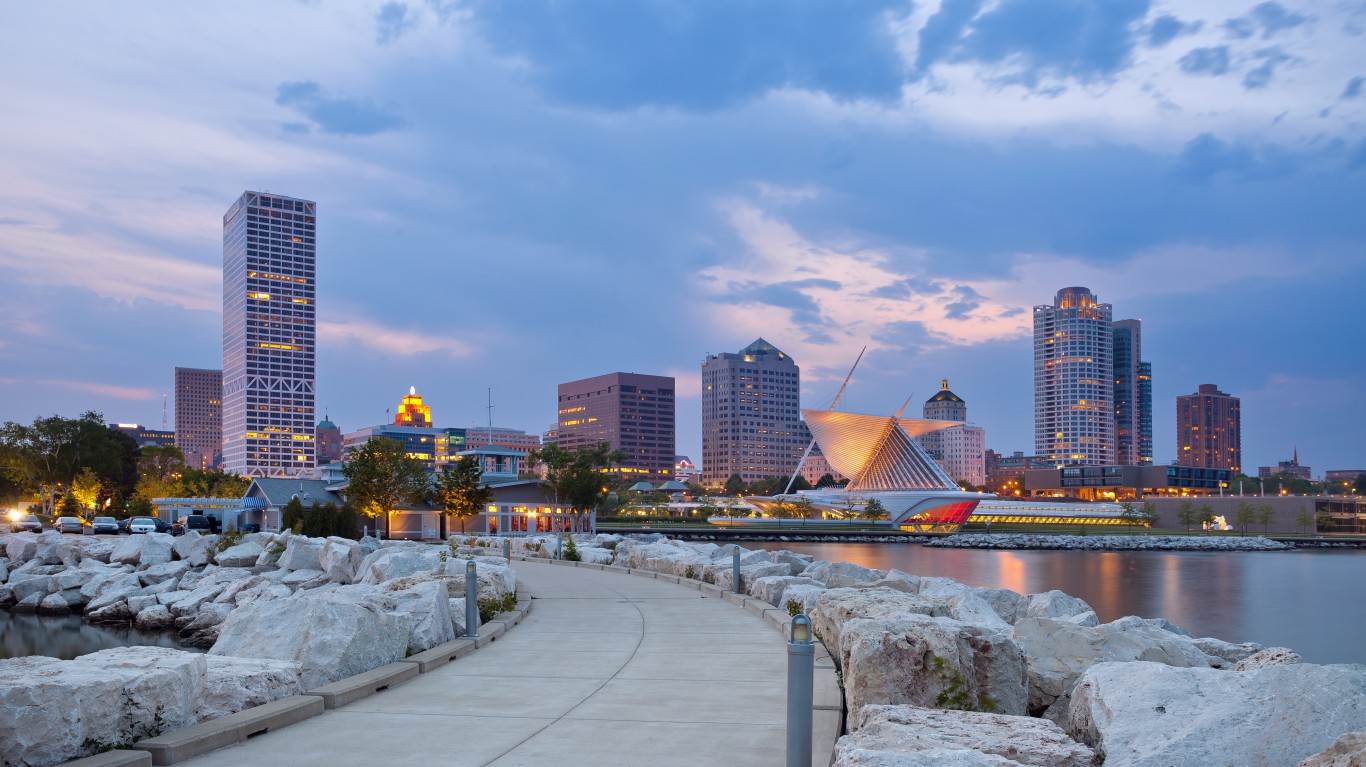
49. Wisconsin: Milwaukee
> Population, 2017: 595,351
> Change since 2010: 0.0%
> State population: 5,795,483 (20th highest)
> Share of state pop. living in largest city: 10.3% (23rd highest)
> Land area: 96.8 sq. miles
> Population density: 6,188 / sq. mile
[in-text-ad-2]
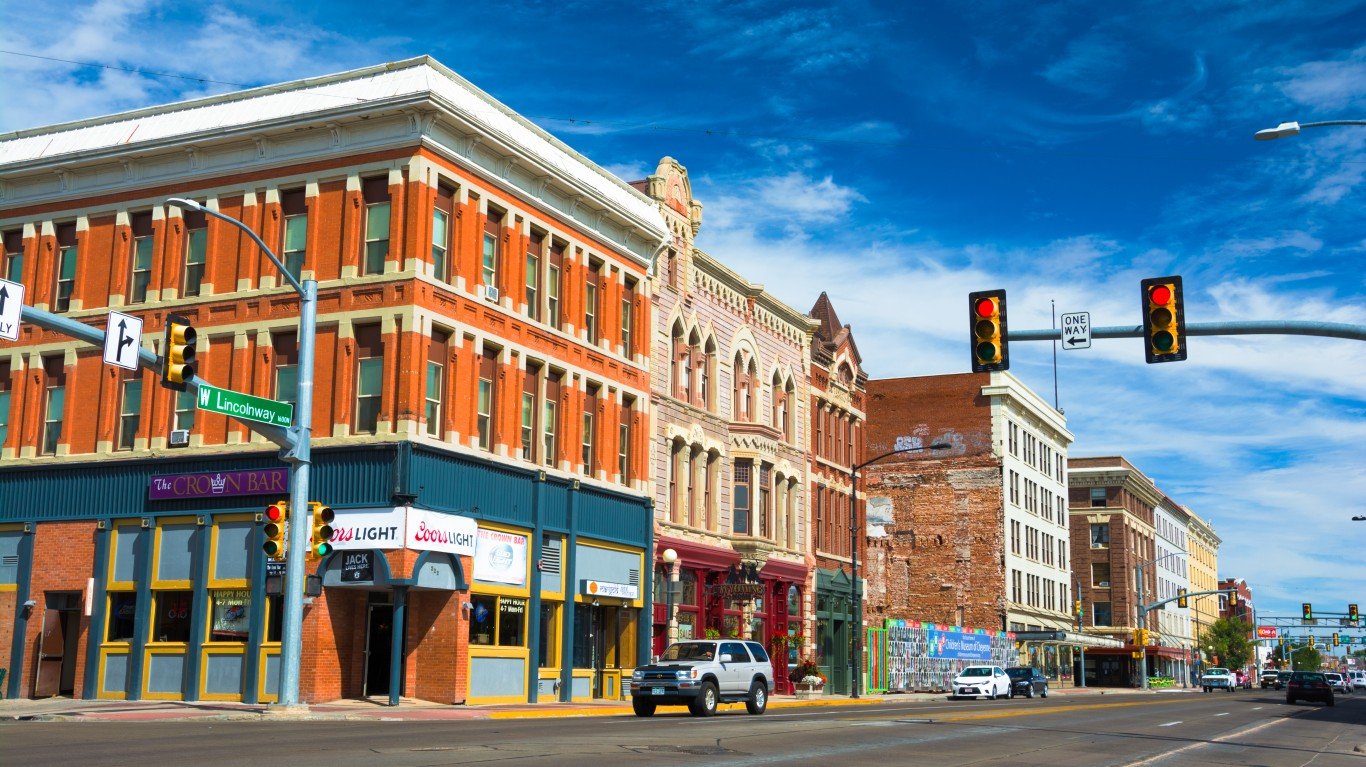
50. Wyoming: Cheyenne
> Population, 2017: 63,624
> Change since 2010: +6.2%
> State population: 579,315 (the lowest)
> Share of state pop. living in largest city: 11.0% (20th highest)
> Land area: 24.6 sq. miles
> Population density: 2,425 / sq. mile
Detailed Findings
After World War II, the nation experienced a seismic shift economically, politically, and demographically with the migration of the nation’s population west and south.
Still, many cities in all parts of the country have grown since 2010. Demographers have suggested various reasons why this is happening. Millennials are forgoing the bigger suburban homes of their parents to live in smaller domiciles and be closer to work. Also, empty-nest baby boomers are downsizing and moving to cities — such as college towns — to take advantage of cultural amenities they can’t find in the suburbs.
Using data obtained from the U.S. Department of Agriculture’s Economic Research Service, Bloomberg News found that although urban areas account for just 3.6% of the total size of the 48 contiguous U.S. states, four in five Americans live, work and play in urban areas.
In all but five states, the largest city either gained population or the population was little changed since 2010. The population of New York City, the nation’s biggest metropolitan area, climbed to an all-time high of 8.6 million. It is one of six cities on the list with a population topping 1 million people. Burlington, Vermont, is the largest city in the Green Mountain State with just over 42,000 people, the smallest population of each state’s biggest cities.
Among the cities with noteworthy increases is Seattle, Washington, whose population has leaped more than 18% since 2010. Seattle’s growth has been buoyed by its indie music scene and major corporations such as Microsoft, Starbucks, and Boeing. Also in the Northwest, proudly quirky Portland, Oregon, experienced a population increase of 10%.
A pro-business climate has raised optimism in Denver, Colorado (whose population is up almost 17% since 2010), Charlotte, North Carolina (16.3%), and Indianapolis, Indiana (5.1%). Technology, energy, and the burgeoning cannabis industry — Colorado was the first state to legalize marijuana for recreational use — power Denver’s economy. North Carolina and Indiana annually rank highly in pro-business surveys of states conducted by CNBC and Forbes.
The energy sector helped boost North Dakota’s economy, with Fargo, the state’s biggest city, gaining 15.5% more residents since 2010. The population of Sioux Falls, the largest city in South Dakota, has increased 14.5% since 2010, as that state’s economy has been buoyed by agriculture.
The populations of Nashville-Davidson, Tennessee; Oklahoma City, Oklahoma; and Columbus, Ohio, have all grown by at least 10% since 2010. Common threads connecting all three cities are that all received their first major league sports team over the last 20 years and that all three are state capitals. Nashville is also one of the music hubs of the United States, while Columbus is home to Ohio State University.
The lure of the Sun Belt continues to boost Phoenix, Arizona, whose population climbed 12.2% since 2010 to 1.6 million, lifting the southwestern city into the top 10 biggest cities in the country. Another Sun Belt city, Las Vegas, Nevada, had been badly hurt by the housing bust more than a decade ago, but it has since rebounded, with a population growth of almost 10%.
Speaking of cities shaking off adversity, New Orleans’ population continues to grow following the devastation of Hurricane Katrina in Louisiana in 2005. New York City, battered by Superstorm Sandy in 2011, has seen its population climb 5.2% since 2010. Today, New York City contains 43.4% of the state’s population, the largest share of any state’s largest city. The population of Newark, New Jersey, which had been declining for generations, edged up 2.8% to about 285,000 people.
Other Northeast cities such as Philadelphia, Pennsylvania, and Boston, Massachusetts, have both added residents since 2010.
The largest cities in five states have shed population since 2010: Birmingham, Alabama; Baltimore, Maryland; Detroit, Michigan; Jackson, Mississippi; and Charleston, West Virginia.
Contact [email protected] for any questions or corrections.