There is no question that people living in poverty face unique challenges that can lead to poor diets. Low-income Americans often cannot afford high-quality, nutritious food, but that alone is not the reason financial insecurity often leads to unhealthy eating.
Many low-income Americans also tend to live in areas where grocery stores are few and far between, and where healthy food options are limited. Poor Americans also tend to have less free time as a result of the need to work multiple jobs or irregular shifts, leaving them with less time to shop at the store or prepare nutritious meals. Poor Americans are less likely to have access to a car or other transportation needed to get to a store.
The U.S. Department of Agriculture measures the share of residents who live on low incomes and also lack access to nearby grocery stores and from that data derives the food insecurity rate. Food insecurity measures the share of households who report inconsistent access to adequate food. This could be caused by the scarcity of nearby stores — low access to food, and it can also be the result of poverty.
In some U.S. counties, over 20% of households suffer from food insecurity and more than 40% of residents are both low income and have low food access. As both factors can lead to poor diets, 24/7 Wall St. created an index based on the share of residents who are both low income and have low access to food, and the percentage of households that face food insecurity in a given month.
Click here to see the places where poverty leads to bad diets
Click here to see our full methodology
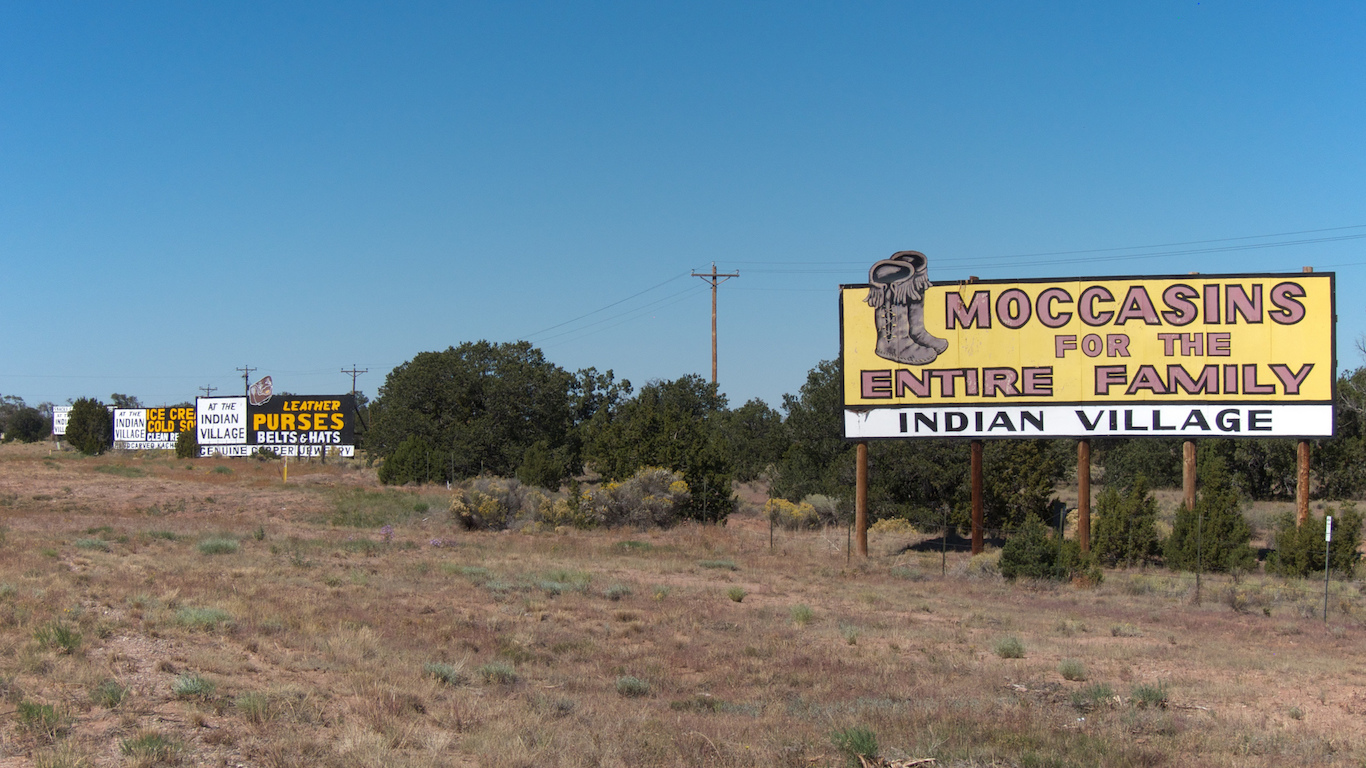
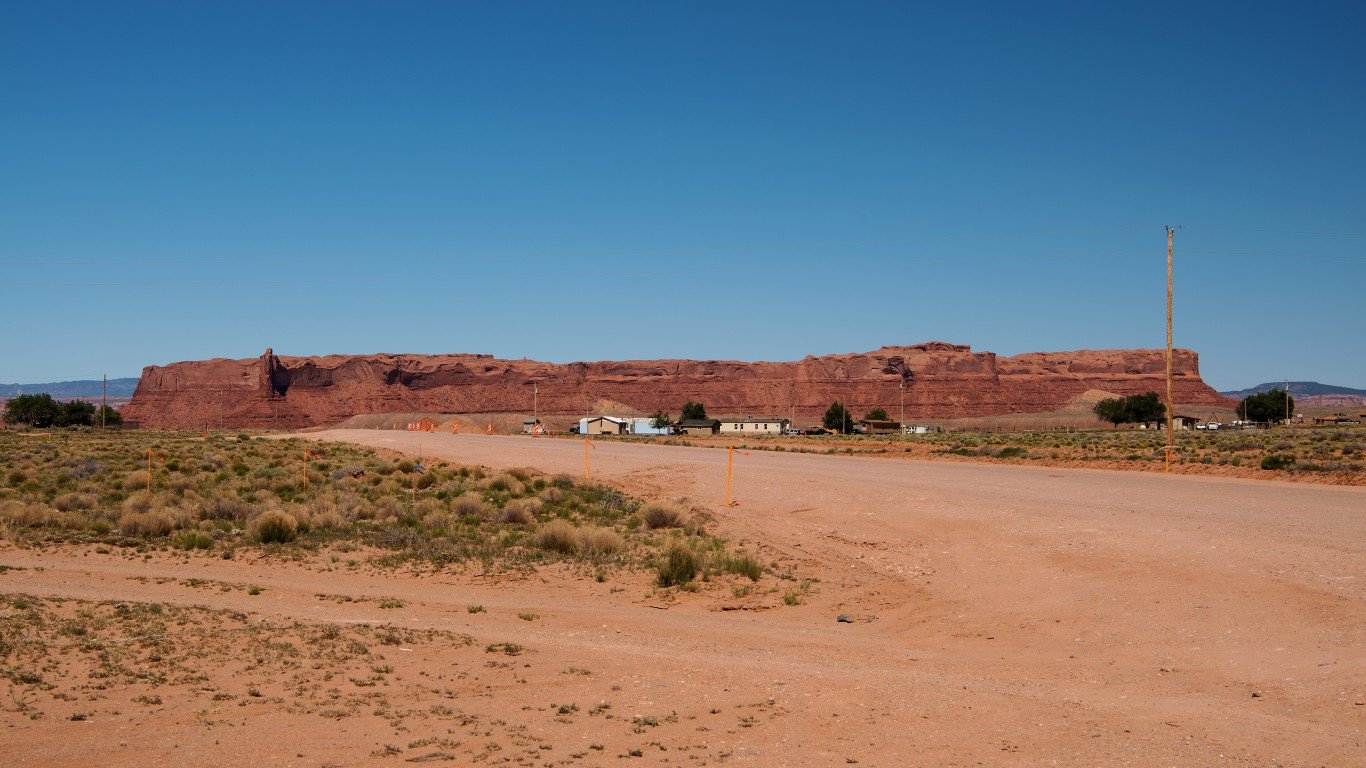
Three of the most food-insecure counties on this list, Apache and Navajo in Arizona and San Juan County in Utah, are each partially within the Navajo Nation, the most populous American Indian reservation in the nation, as well as the largest geographically, spanning four states. In Apache County, and in Navajo nation in general, the health crisis related to poor nutrition and poverty has been well documented. As part of a 2015 in-depth report on the region’s health crisis, Al Jazeera noted that there were just 10 grocery stores serving the entire Navajo Nation, an area with roughly 300,000 residents that is about the size of the state of South Carolina.
Residents in those two Arizona counties suffer from the same health problems that the other poor counties on this list do. Those include high obesity rates and other problems an area with roughly 300,000 residents (the same as Pittsburgh) and about the size of the state of South Carolina associated with poor diets, such as diabetes. In Apache, Navajo, and San Juan counties, for example, residents report feeling unhealthy more than five days a month.. Likely in part as a result of their food insecurity, these counties also rank as among the least healthy counties in America.
25. Todd County, South Dakota
> Households that are food insecure: 25.4%
> Residents who have low incomes and poor food access: 14.3%
> Poverty rate: 52.0%
> Households receiving SNAP benefits: 41.2%
> Adult obesity rate: 38.0%
> Pct. adults in fair or poor health: 29.9%
[in-text-ad]
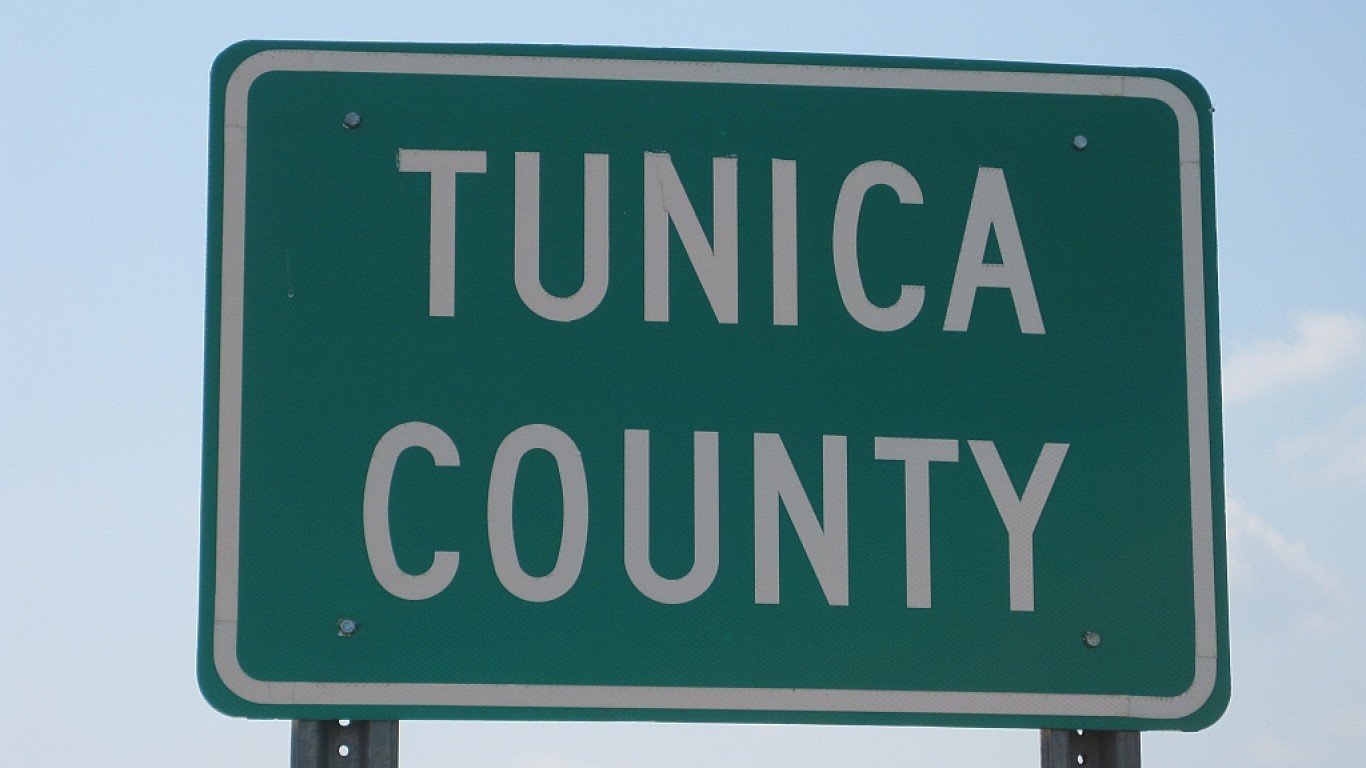
24. Tunica County, Mississippi
> Households that are food insecure: 28.0%
> Residents who have low incomes and poor food access: 9.6%
> Poverty rate: 27.0%
> Households receiving SNAP benefits: 31.2%
> Adult obesity rate: 40.7%
> Pct. adults in fair or poor health: 27.2%
[recirclink id=546650]

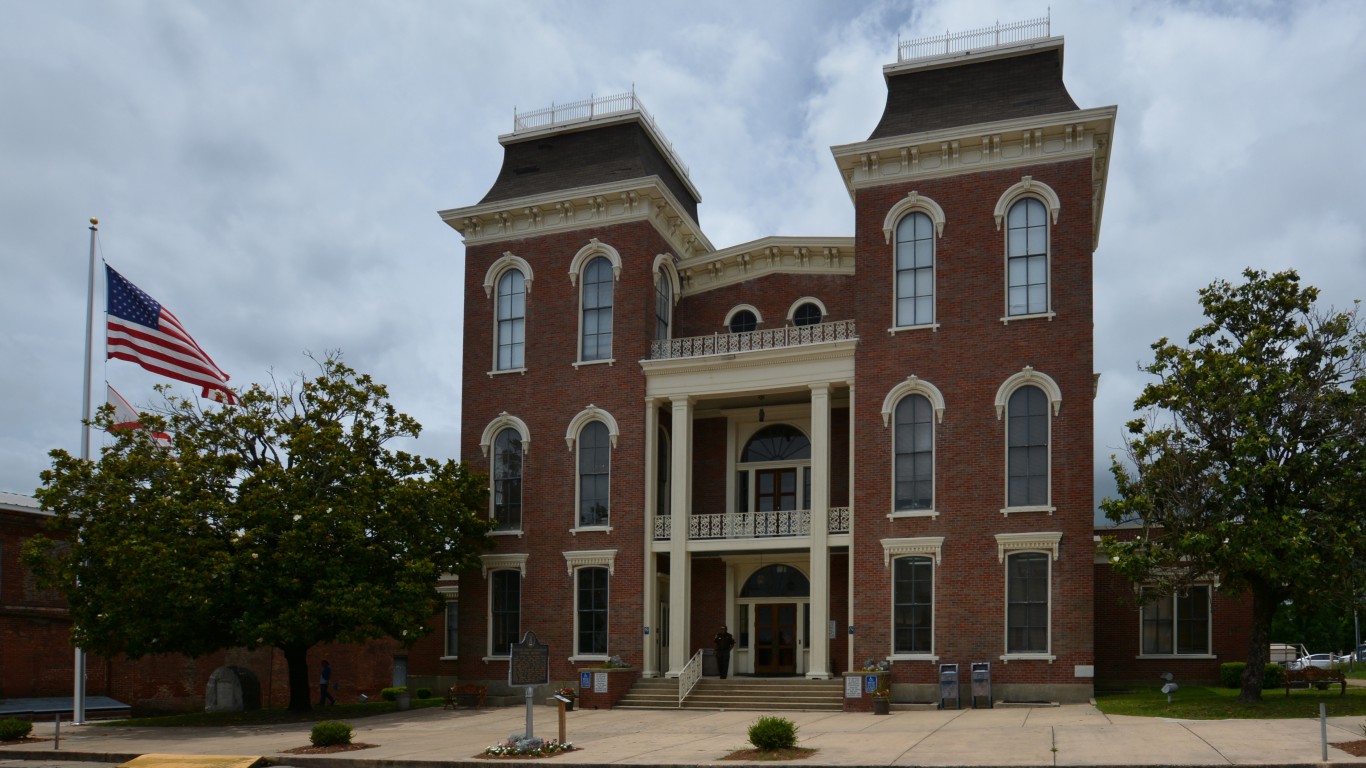
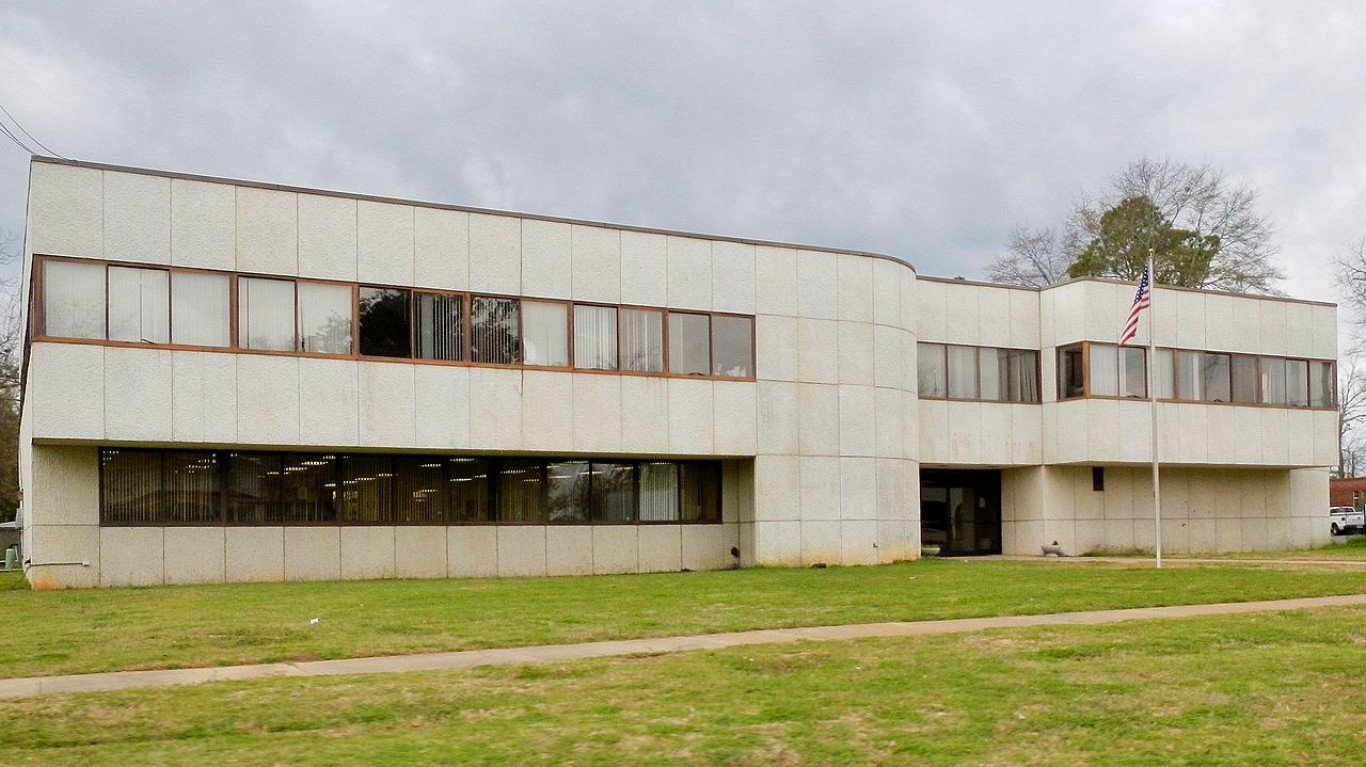
23. Sumter County, Alabama
> Households that are food insecure: 27.7%
> Residents who have low incomes and poor food access: 10.4%
> Poverty rate: 36.0%
> Households receiving SNAP benefits: 31.5%
> Adult obesity rate: 40.3%
> Pct. adults in fair or poor health: 32.0%
22. Navajo County, Arizona
> Households that are food insecure: 20.9%
> Residents who have low incomes and poor food access: 25.0%
> Poverty rate: 29.1%
> Households receiving SNAP benefits: 24.9%
> Adult obesity rate: 30.9%
> Pct. adults in fair or poor health: 23.8%
[in-text-ad-2]

21. Dallas County, Alabama
> Households that are food insecure: 27.2%
> Residents who have low incomes and poor food access: 11.6%
> Poverty rate: 31.9%
> Households receiving SNAP benefits: 31.9%
> Adult obesity rate: 40.8%
> Pct. adults in fair or poor health: 28.7%

20. St. Francis County, Arkansas
> Households that are food insecure: 25.7%
> Residents who have low incomes and poor food access: 15.1%
> Poverty rate: 27.5%
> Households receiving SNAP benefits: 24.8%
> Adult obesity rate: 42.5%
> Pct. adults in fair or poor health: 27.4%
[in-text-ad]
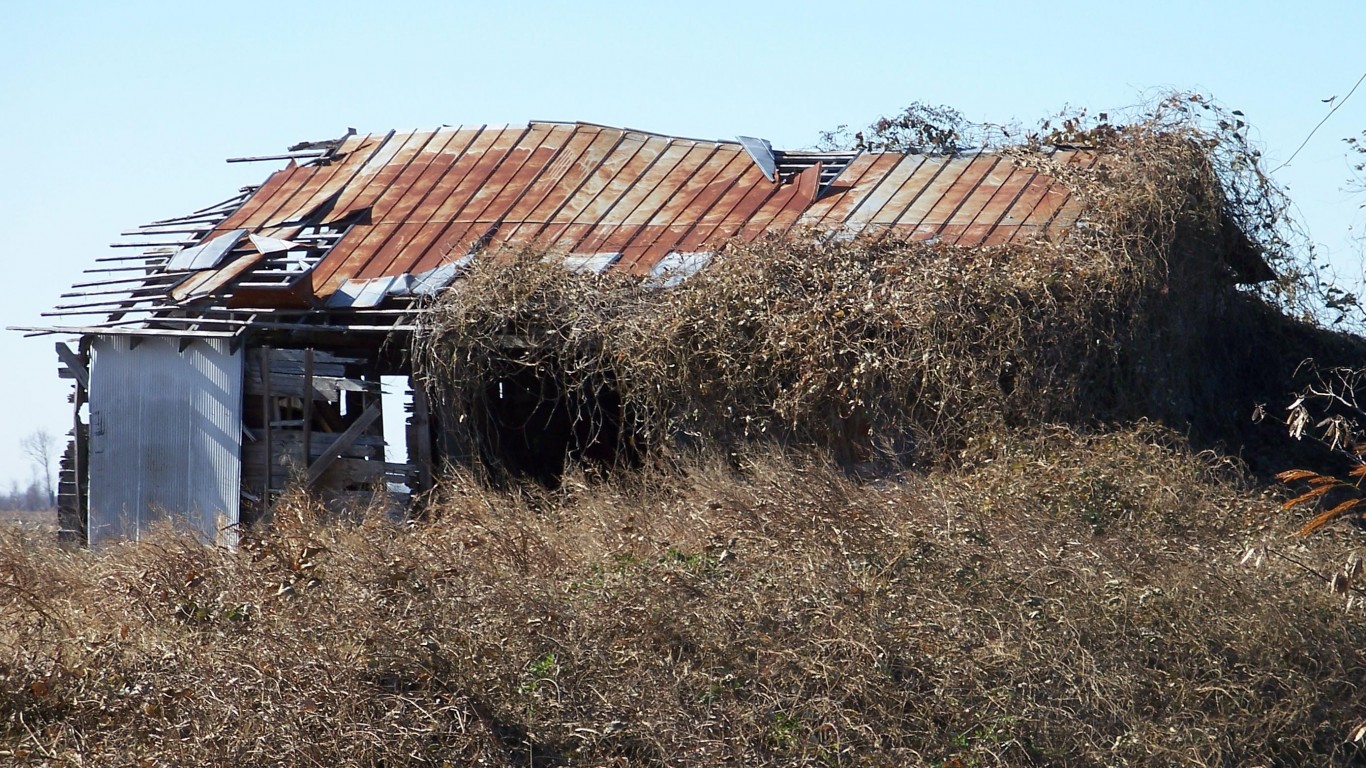
19. Tallahatchie County, Mississippi
> Households that are food insecure: 19.2%
> Residents who have low incomes and poor food access: 30.3%
> Poverty rate: 28.3%
> Households receiving SNAP benefits: 28.3%
> Adult obesity rate: 39.6%
> Pct. adults in fair or poor health: 26.4%
[recirclink id=509416]
18. Bullock County, Alabama
> Households that are food insecure: 24.8%
> Residents who have low incomes and poor food access: 19.7%
> Poverty rate: 28.5%
> Households receiving SNAP benefits: 24.6%
> Adult obesity rate: 43.0%
> Pct. adults in fair or poor health: 29.4%
17. Choctaw County, Oklahoma
> Households that are food insecure: 21.7%
> Residents who have low incomes and poor food access: 26.6%
> Poverty rate: 31.0%
> Households receiving SNAP benefits: 27.4%
> Adult obesity rate: 36.2%
> Pct. adults in fair or poor health: 25.4%
[in-text-ad-2]
16. Desha County, Arkansas
> Households that are food insecure: 25.6%
> Residents who have low incomes and poor food access: 20.0%
> Poverty rate: 32.6%
> Households receiving SNAP benefits: 29.1%
> Adult obesity rate: 39.6%
> Pct. adults in fair or poor health: 30.4%
15. Yazoo County, Mississippi
> Households that are food insecure: 25.5%
> Residents who have low incomes and poor food access: 20.8%
> Poverty rate: 36.5%
> Households receiving SNAP benefits: 29.2%
> Adult obesity rate: 38.8%
> Pct. adults in fair or poor health: 27.1%
[in-text-ad]
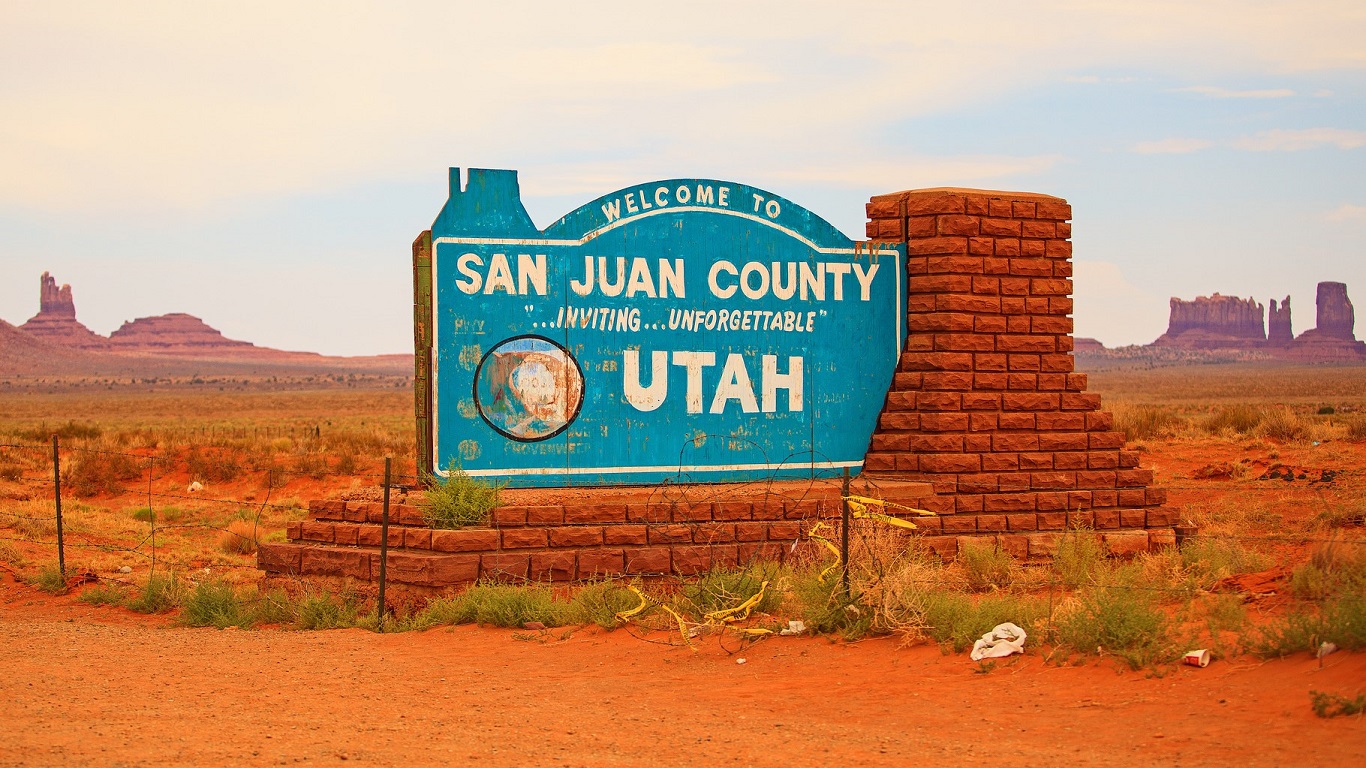
14. San Juan County, Utah
> Households that are food insecure: 19.4%
> Residents who have low incomes and poor food access: 34.2%
> Poverty rate: 28.4%
> Households receiving SNAP benefits: 17.7%
> Adult obesity rate: 26.7%
> Pct. adults in fair or poor health: 20.9%
[recirclink id=504457]
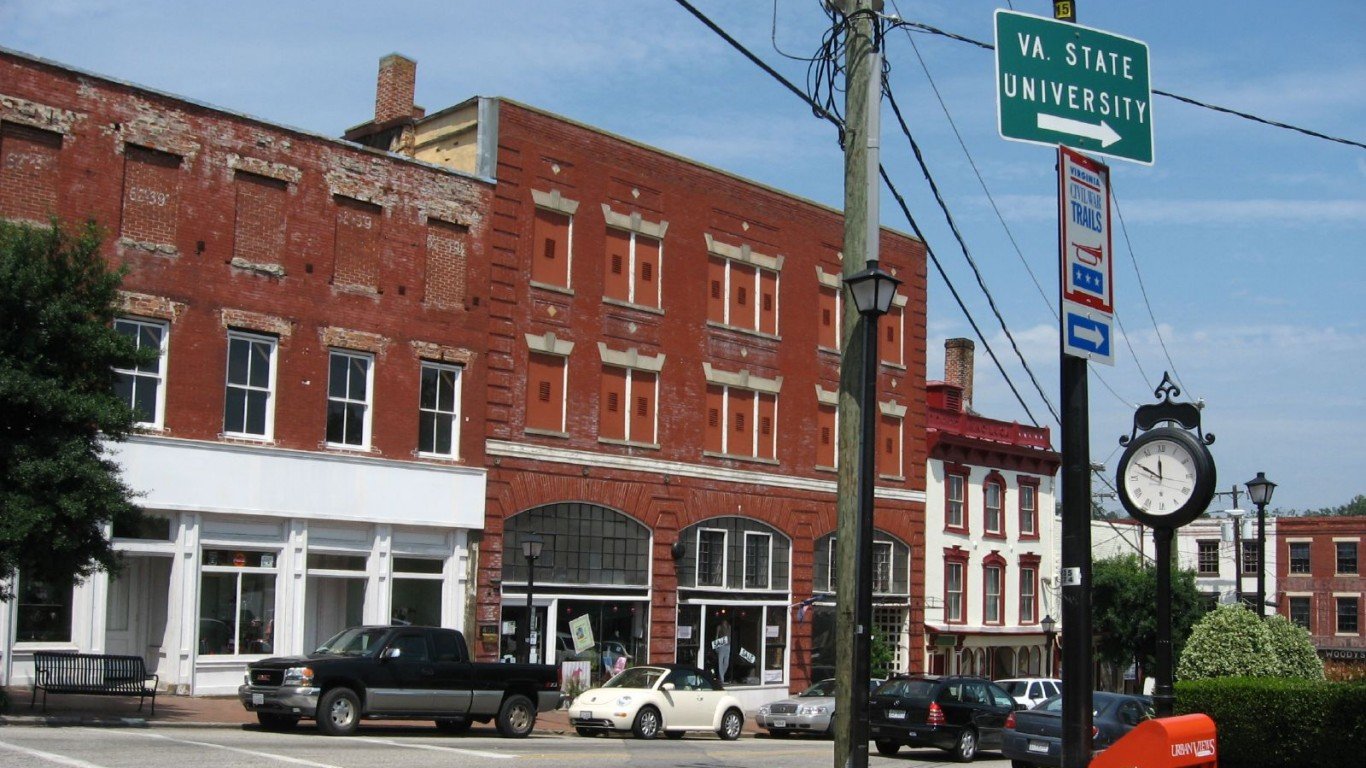
13. Petersburg County, Virginia
> Households that are food insecure: 25.9%
> Residents who have low incomes and poor food access: 20.5%
> Poverty rate: 27.6%
> Households receiving SNAP benefits: 27.0%
> Adult obesity rate: 41.4%
> Pct. adults in fair or poor health: 26.0%
12. Macon County, Alabama
> Households that are food insecure: 25.6%
> Residents who have low incomes and poor food access: 21.6%
> Poverty rate: 25.9%
> Households receiving SNAP benefits: 28.0%
> Adult obesity rate: 44.7%
> Pct. adults in fair or poor health: 30.0%
[in-text-ad-2]
11. Dougherty County, Georgia
> Households that are food insecure: 25.5%
> Residents who have low incomes and poor food access: 22.6%
> Poverty rate: 30.5%
> Households receiving SNAP benefits: 28.1%
> Adult obesity rate: 34.4%
> Pct. adults in fair or poor health: 26.0%
10. Washington County, Mississippi
> Households that are food insecure: 28.2%
> Residents who have low incomes and poor food access: 18.8%
> Poverty rate: 33.7%
> Households receiving SNAP benefits: 30.4%
> Adult obesity rate: 38.9%
> Pct. adults in fair or poor health: 26.6%
[in-text-ad]
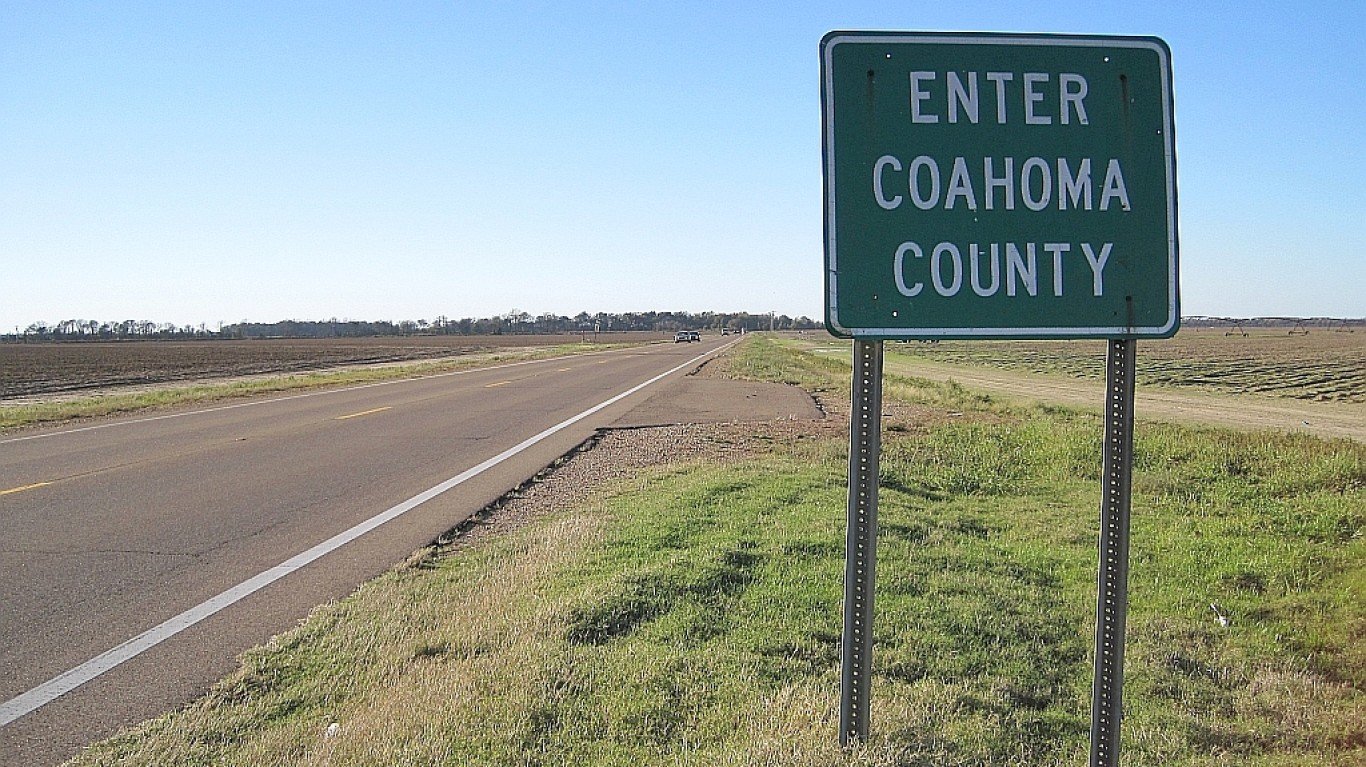
9. Coahoma County, Mississippi
> Households that are food insecure: 29.9%
> Residents who have low incomes and poor food access: 16.5%
> Poverty rate: 36.2%
> Households receiving SNAP benefits: 38.2%
> Adult obesity rate: 42.9%
> Pct. adults in fair or poor health: 29.0%
[recirclink id=498420]
8. Bolivar County, Mississippi
> Households that are food insecure: 27.7%
> Residents who have low incomes and poor food access: 24.4%
> Poverty rate: 37.4%
> Households receiving SNAP benefits: 29.9%
> Adult obesity rate: 37.5%
> Pct. adults in fair or poor health: 28.8%
7. Sunflower County, Mississippi
> Households that are food insecure: 28.5%
> Residents who have low incomes and poor food access: 24.7%
> Poverty rate: 32.5%
> Households receiving SNAP benefits: 33.3%
> Adult obesity rate: 42.2%
> Pct. adults in fair or poor health: 28.9%
[in-text-ad-2]

6. Bethel census area, Alaska
> Households that are food insecure: 21.5%
> Residents who have low incomes and poor food access: 42.0%
> Poverty rate: 27.0%
> Households receiving SNAP benefits: 39.2%
> Adult obesity rate: 30.3%
> Pct. adults in fair or poor health: 26.3%
5. Wilcox County, Alabama
> Households that are food insecure: 29.3%
> Residents who have low incomes and poor food access: 30.5%
> Poverty rate: 31.9%
> Households receiving SNAP benefits: 24.8%
> Adult obesity rate: 44.9%
> Pct. adults in fair or poor health: 30.4%
[in-text-ad]

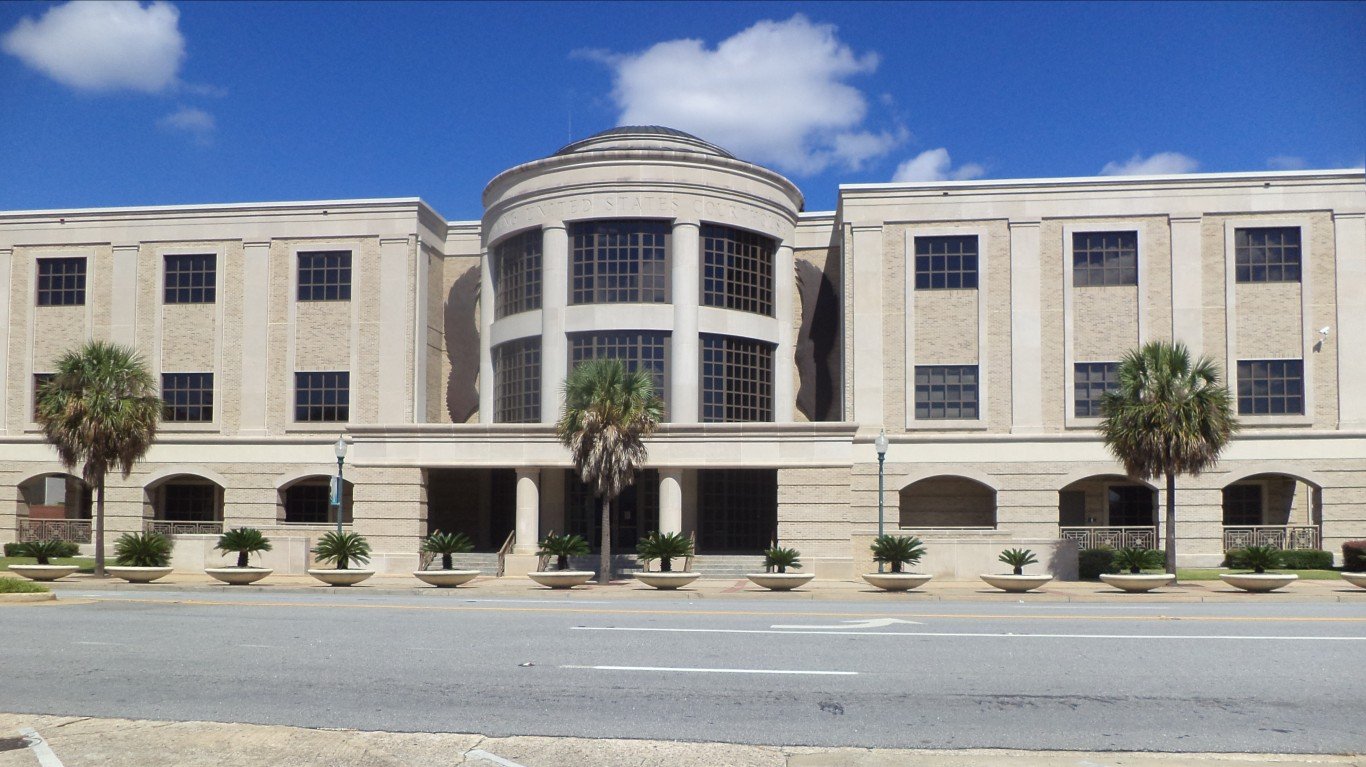
4. Phillips County, Arkansas
> Households that are food insecure: 29.5%
> Residents who have low incomes and poor food access: 31.0%
> Poverty rate: 33.0%
> Households receiving SNAP benefits: 30.8%
> Adult obesity rate: 45.5%
> Pct. adults in fair or poor health: 30.7%
[recirclink id=544777]
3. Leflore County, Mississippi
> Households that are food insecure: 30.4%
> Residents who have low incomes and poor food access: 30.8%
> Poverty rate: 40.3%
> Households receiving SNAP benefits: 23.2%
> Adult obesity rate: 44.0%
> Pct. adults in fair or poor health: 31.2%
2. McKinley County, New Mexico
> Households that are food insecure: 26.0%
> Residents who have low incomes and poor food access: 41.3%
> Poverty rate: 37.5%
> Households receiving SNAP benefits: 25.7%
> Adult obesity rate: 35.1%
> Pct. adults in fair or poor health: 26.2%
[in-text-ad-2]
1. Apache County, Arizona
> Households that are food insecure: 24.2%
> Residents who have low incomes and poor food access: 47.4%
> Poverty rate: 35.9%
> Households receiving SNAP benefits: 26.3%
> Adult obesity rate: 35.2%
> Pct. adults in fair or poor health: 26.2%
Methodology
To identify the places where poverty may be leading to bad diets, 24/7 Wall St. created an index based on the food insecurity rate and the share of low- food access/low-income people in each county with data from the United States Department of Agriculture’s Food Environment Atlas, which was last updated in March 2018. The USDA identifies individuals and households with low food security as those that report “reduced quality, variety, or desirability of diet,” which also may include “indications of disrupted eating patterns and reduced food intake.” Low-income/low-access to food individuals are defined as the “Number of people in a county with low income and living more than 1 mile from a supermarket, supercenter or large grocery store if in an urban area, or more than 10 miles from a supermarket or large grocery store if in a rural area.”
Adult diabetes and obesity, child food insecurity, and SNAP (previously known as food stamps) recipiency by county is also from the USDA report. Poverty rate is from the American Community Survey and is for 2017 5-Year estimates. The percentage of adults 65 and older who report fair or poor health is from County Health Rankings & Roadmaps program, a collaboration between the Robert Wood Johnson Foundation and the University of Wisconsin Population Health Institute for 2018. We excluded from consideration all counties and county equivalents for which the share of residents who have low incomes and low food access changed by more than 10% between 2010 and 2015, and also excluded counties with populations below 10,000 residents as of 2017.
Contact [email protected] for any questions or corrections.