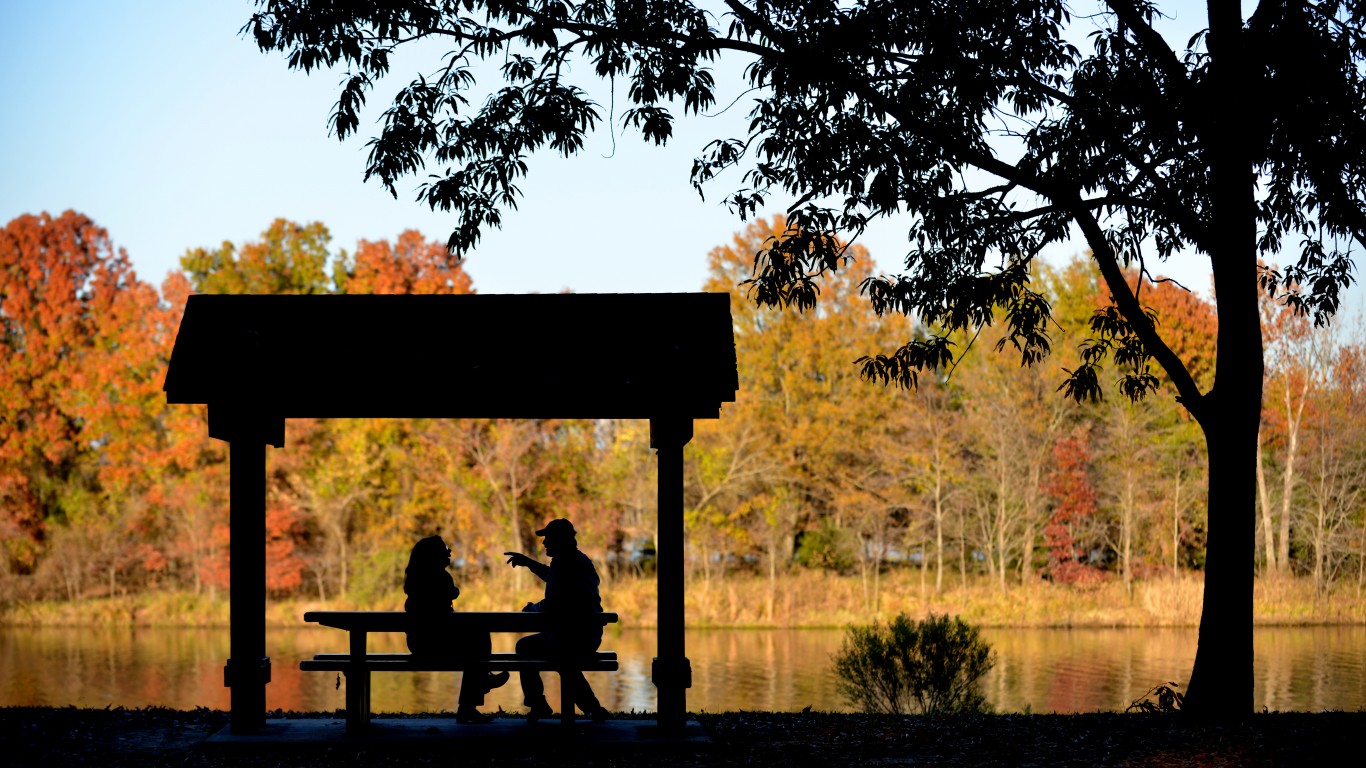
[cnxvideo id=”795679″ placement=”ros”]Dating can be fun, and it can be stressful; the two of you might be meeting for the first time or you might be well into a relationship. But no matter if it’s the love of your life who is sitting across the table from you or someone you can’t wait to never see again, at the end of the evening comes the bill — and that can be expensive. Dating happens to be a lucrative business.
Finding love comes at a cost, and people seem to be ready to open up their wallets. Single people spend the most on dating, compared to people in a relationship or married, according to a 2018 poll of about 1,000 people conducted by GiftCards.com. They spend an average of $146 per month on dating.
24/7 Tempo constructed an index based on nine different measures related to dating expenses in all 50 states. The following list is ranked from most to least affordable states for dating based on the overall composite index value.
The average cost of a date today — consisting of two dinners, a bottle of wine, and two movie tickets — adds up to $102.57. Are you already thinking it’s better to stay single? The independence of single life is for many people highly desirable — and these are America’s best cities to be single.
But many of the factors that contribute to the average cost of a date – from price of gas to taxes — vary considerably from state to state, making dating far more expensive in some parts of the country than others. By far the most affordable states to take someone on a date are in the Midwest, while the least affordable are in the Northeast.
Click here to learn about the average cost of a date in each state.
To determine the cost of a date in each state, 24/7 Tempo constructed an index based on measures related to dating expenses in all 50 states. The index was applied to the national average cost of the typical date, consisting of a liter of wine, two movie tickets, and two restaurant dinners.
The index consists of the average U.S. price of a liter of wine from the Bureau of Labor Statistics, the average U.S. price of two movie tickets from the National Association of Theatre Owners, and the national average cost of two restaurant dinners from a Zagat survey.
Each state was given an index value based on nine measures related to the cost of goods, services, dining out, transportation, and alcohol. The regional price parities for goods and services other than rents came from the Bureau of Economic Analysis and received a full weighting. Consumer price indices for the cost of food away from home and for recreation by region — Northeast, South, West, and Midwest — are unadjusted figures from the Bureau of Labor Statistics and were given a half-weight. Data on the mean travel time to work is from the U.S. Census Bureau’s 2017 American Community Survey. Commute time and the average price of a regular gallon of gasoline from AAA as of Aug. 6, 2019 were combined into a product and given double weight. Data on the combined state sales tax rate and average local sales tax rate for each state came from the Tax Foundation and were given a one-tenth weighting. Data on state spirit tax, wine tax, and beer tax in dollars per gallon also came from the Tax Foundation and were each given a one-tenth weight. All data are for the most recent period available.

1. Wisconsin
> Average cost of dinner, drinks, and movie: $98.26 (tied — 13th lowest)
> Combined average tax rate: 5.44% (8th lowest)
> Price of regular gasoline as of Aug. 6, 2019: $2.68 (25th highest)
> Arts, entertainment, and recreation establishments: 47 per 100,000 people
[in-text-ad]

2. Kansas
> Average cost of dinner, drinks, and movie: $98.16 (10th lowest)
> Combined average tax rate: 8.67% (8th highest)
> Price of regular gasoline as of Aug. 6, 2019: $2.46 (11th lowest)
> Arts, entertainment, and recreation establishments: 36 per 100,000 people
[recirclink id=438440]
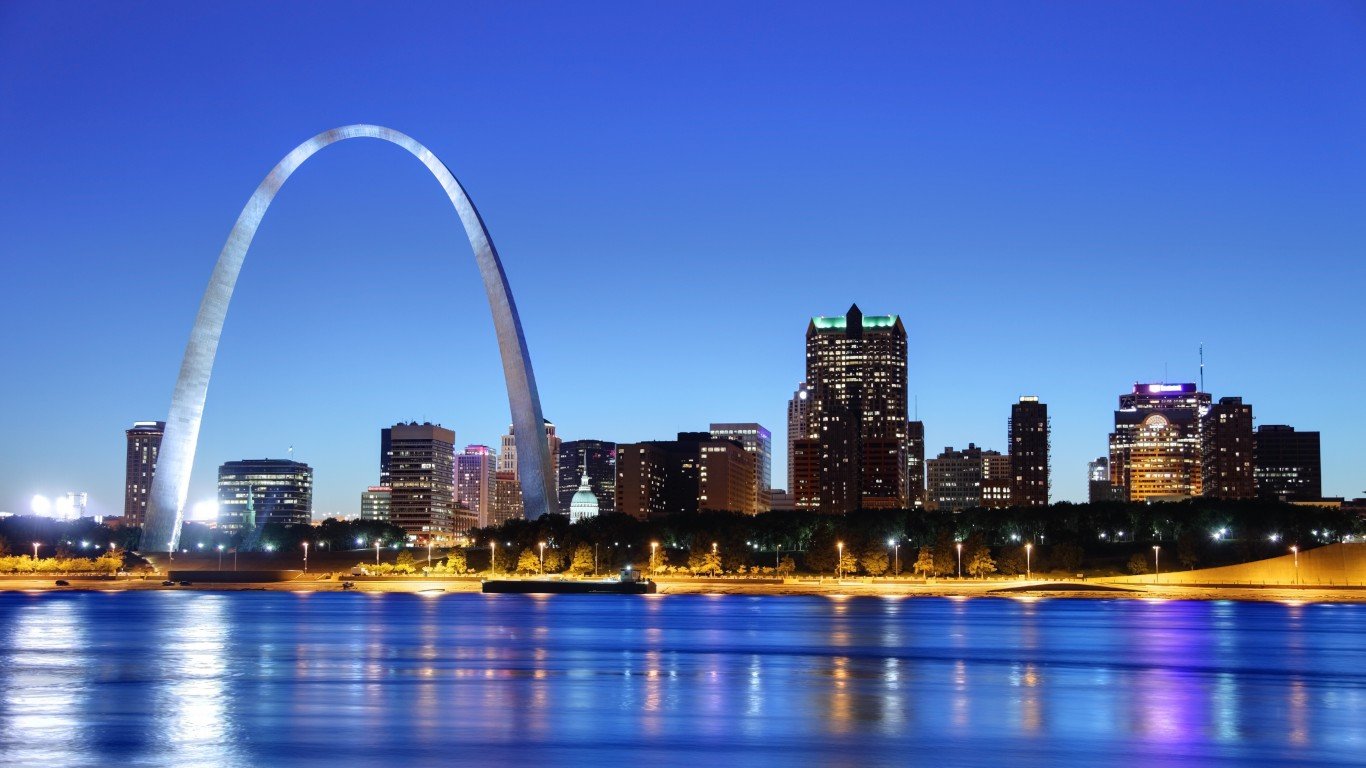
3. Missouri
> Average cost of dinner, drinks, and movie: $97.96 (9th lowest)
> Combined average tax rate: 8.13% (14th highest)
> Price of regular gasoline as of Aug. 6, 2019: $2.45 (9th lowest)
> Arts, entertainment, and recreation establishments: 36 per 100,000 people
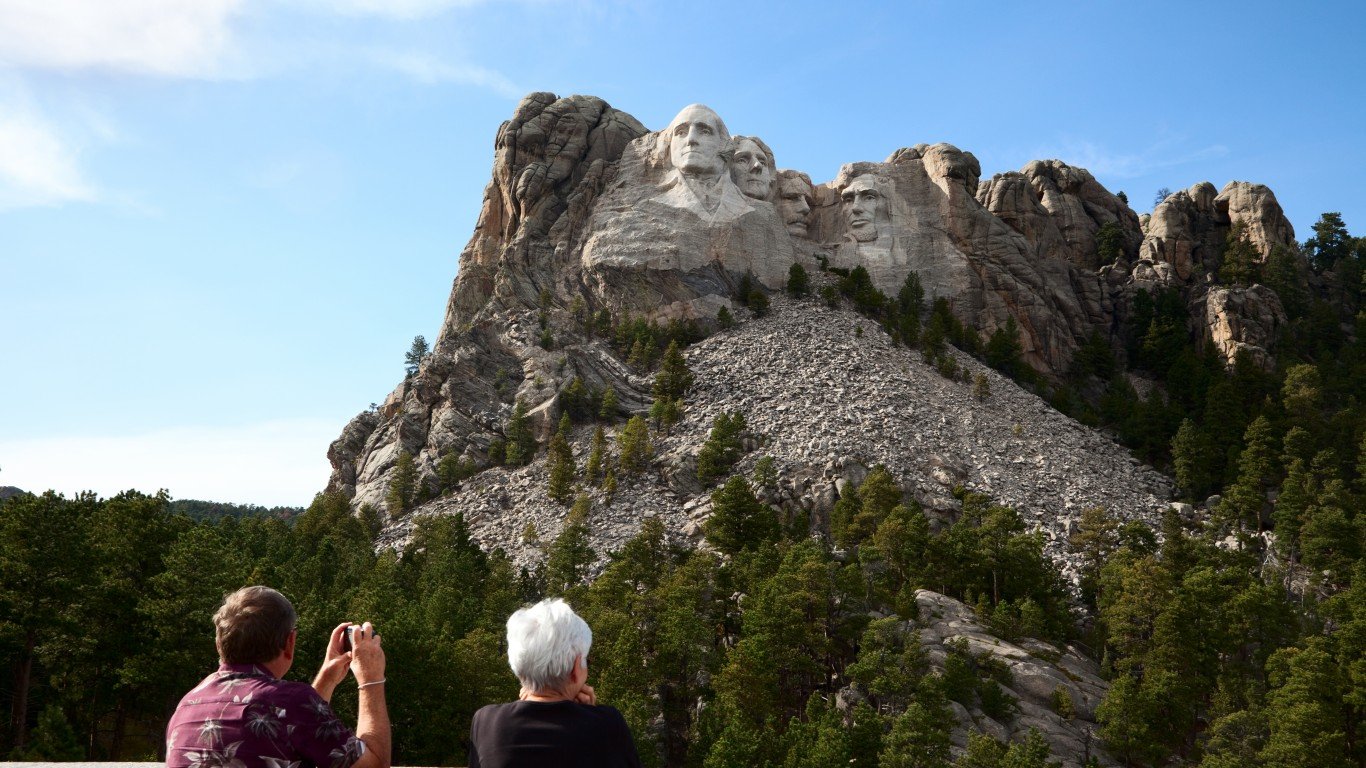
4. South Dakota
> Average cost of dinner, drinks, and movie: $97.14 (4th lowest)
> Combined average tax rate: 6.40% (20th lowest)
> Price of regular gasoline as of Aug. 6, 2019: $2.69 (24th highest)
> Arts, entertainment, and recreation establishments: 80 per 100,000 people
[in-text-ad-2]
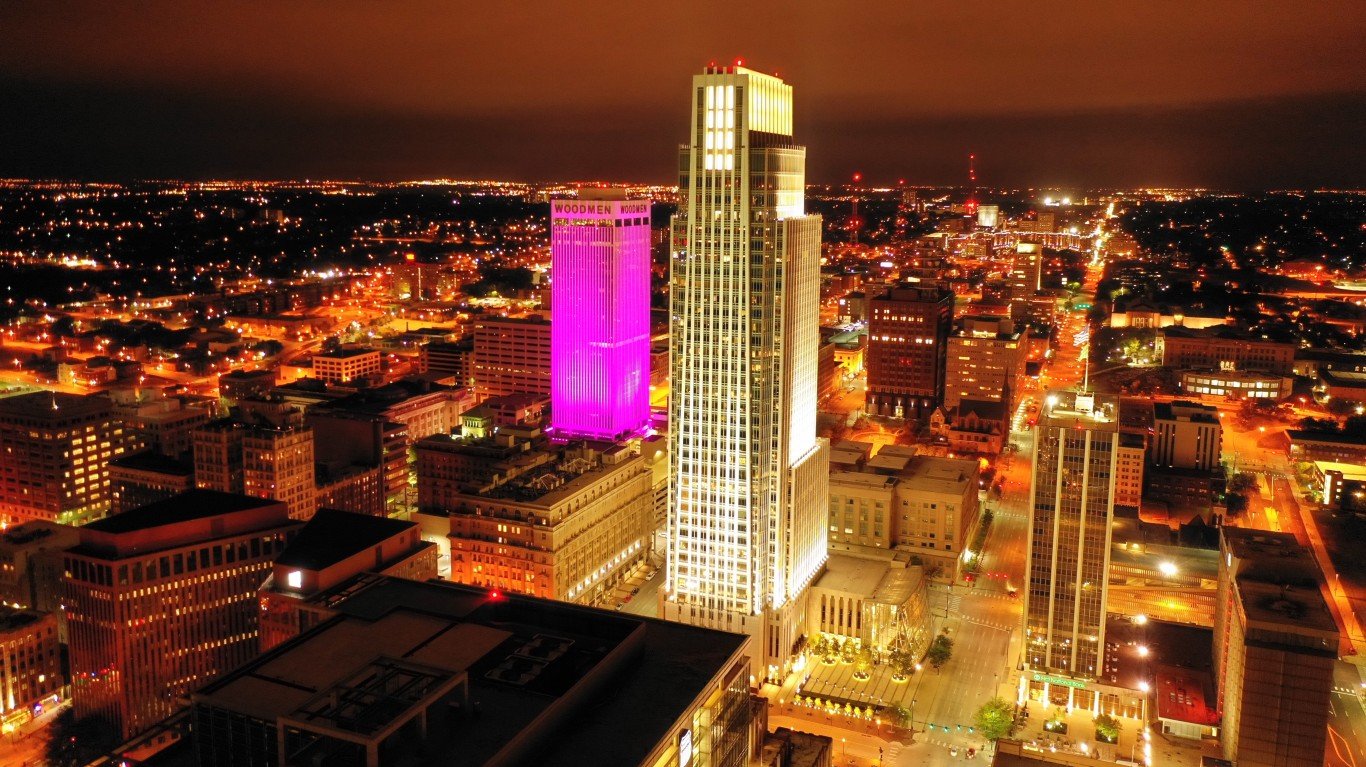
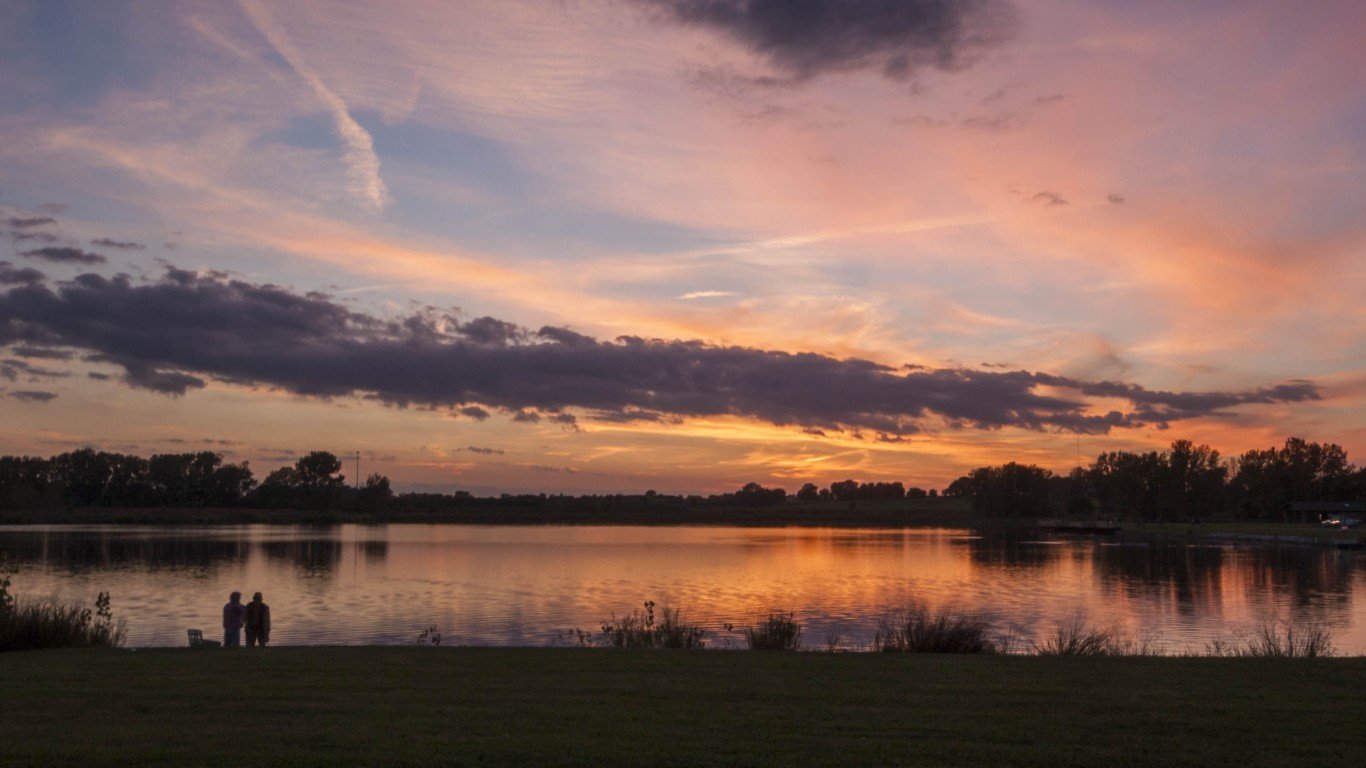
5. Nebraska
> Average cost of dinner, drinks, and movie: $97.65 (8th lowest)
> Combined average tax rate: 6.85% (24th lowest)
> Price of regular gasoline as of Aug. 6, 2019: $2.58 (19th lowest)
> Arts, entertainment, and recreation establishments: 48 per 100,000 people
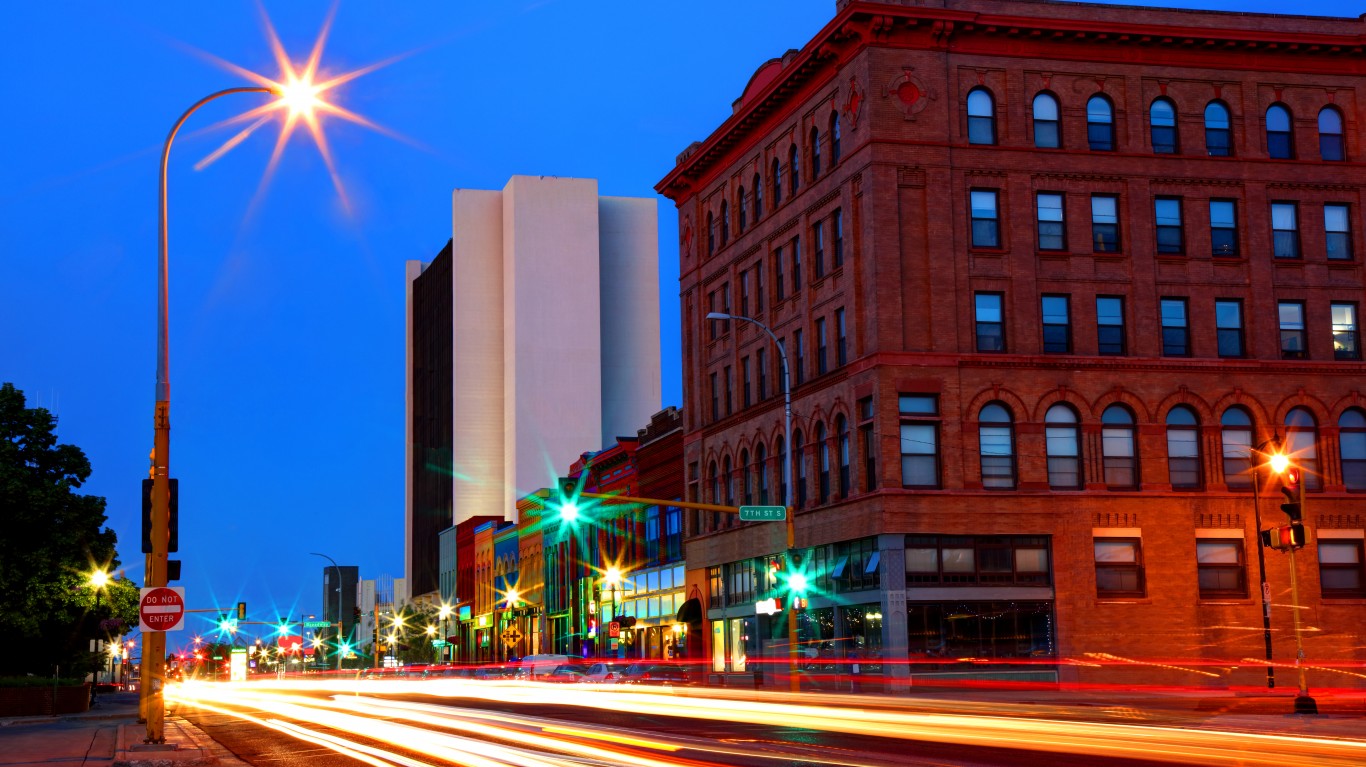
6. North Dakota
> Average cost of dinner, drinks, and movie: $97.24 (5th lowest)
> Combined average tax rate: 6.85% (23rd lowest)
> Price of regular gasoline as of Aug. 6, 2019: $2.68 (25th lowest)
> Arts, entertainment, and recreation establishments: 60 per 100,000 people
[in-text-ad]

7. Indiana
> Average cost of dinner, drinks, and movie: $98.67 (15th lowest)
> Combined average tax rate: 7.00% (tied — 23rd highest)
> Price of regular gasoline as of Aug. 6, 2019: $2.73 (tied — 20th highest)
> Arts, entertainment, and recreation establishments: 32 per 100,000 people
[recirclink id=526865]

8. Montana
> Average cost of dinner, drinks, and movie: $101.96 (tied — 14th highest)
> Combined average tax rate: 0.00% (tied — 4th lowest)
> Price of regular gasoline as of Aug. 6, 2019: $2.80 (13th highest)
> Arts, entertainment, and recreation establishments: 115 per 100,000 people
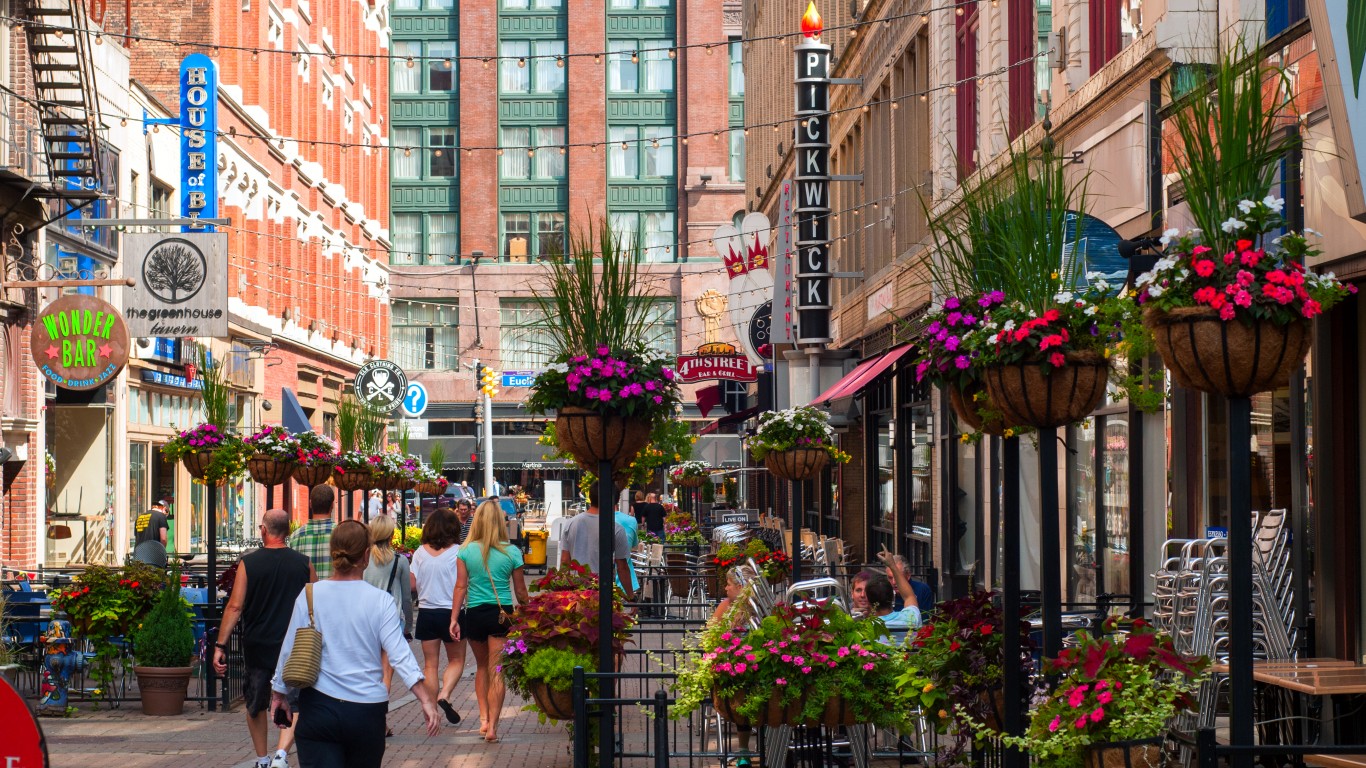
9. Ohio
> Average cost of dinner, drinks, and movie: $98.26 (tied — 13th lowest)
> Combined average tax rate: 7.17% (20th highest)
> Price of regular gasoline as of Aug. 6, 2019: $2.74 (17th highest)
> Arts, entertainment, and recreation establishments: 33 per 100,000 people
[in-text-ad-2]
10. Iowa
> Average cost of dinner, drinks, and movie: $97.44 (7th lowest)
> Combined average tax rate: 6.82% (22nd lowest)
> Price of regular gasoline as of Aug. 6, 2019: $2.55 (tied — 17th lowest)
> Arts, entertainment, and recreation establishments: 46 per 100,000 people
11. Wyoming
> Average cost of dinner, drinks, and movie: $101.75 (16th highest)
> Combined average tax rate: 5.36% (7th lowest)
> Price of regular gasoline as of Aug. 6, 2019: $2.74 (16th highest)
> Arts, entertainment, and recreation establishments: 76 per 100,000 people
[in-text-ad]

12. Michigan
> Average cost of dinner, drinks, and movie: $99.91 (25th highest)
> Combined average tax rate: 6.00% (tied — 13th lowest)
> Price of regular gasoline as of Aug. 6, 2019: $2.73 (tied — 20th highest)
> Arts, entertainment, and recreation establishments: 34 per 100,000 people
[recirclink id=526877]
13. Idaho
> Average cost of dinner, drinks, and movie: $101.03 (tied — 20th highest)
> Combined average tax rate: 6.03% (14th lowest)
> Price of regular gasoline as of Aug. 6, 2019: $2.90 (9th highest)
> Arts, entertainment, and recreation establishments: 47 per 100,000 people

14. Oregon
> Average cost of dinner, drinks, and movie: $101.65 (17th highest)
> Combined average tax rate: 0.00% (tied — 4th lowest)
> Price of regular gasoline as of Aug. 6, 2019: $3.13 (5th highest)
> Arts, entertainment, and recreation establishments: 46 per 100,000 people
[in-text-ad-2]

15. Colorado
> Average cost of dinner, drinks, and movie: $102.16 (13th highest)
> Combined average tax rate: 7.63% (16th highest)
> Price of regular gasoline as of Aug. 6, 2019: $2.62 (21st lowest)
> Arts, entertainment, and recreation establishments: 52 per 100,000 people
16. West Virginia
> Average cost of dinner, drinks, and movie: $97.03 (tied — 3rd lowest)
> Combined average tax rate: 6.39% (19th lowest)
> Price of regular gasoline as of Aug. 6, 2019: $2.67 (24th lowest)
> Arts, entertainment, and recreation establishments: 40 per 100,000 people
[in-text-ad]

17. Mississippi
> Average cost of dinner, drinks, and movie: $96.52 (the lowest)
> Combined average tax rate: 7.07% (21st highest)
> Price of regular gasoline as of Aug. 6, 2019: $2.34 (2nd lowest)
> Arts, entertainment, and recreation establishments: 23 per 100,000 people
[recirclink id=527019]

18. Arizona
> Average cost of dinner, drinks, and movie: $99.29 (tied — 21st lowest)
> Combined average tax rate: 8.37% (11th highest)
> Price of regular gasoline as of Aug. 6, 2019: $2.78 (14th highest)
> Arts, entertainment, and recreation establishments: 28 per 100,000 people

19. Nevada
> Average cost of dinner, drinks, and movie: $98.37 (14th lowest)
> Combined average tax rate: 8.14% (13th highest)
> Price of regular gasoline as of Aug. 6, 2019: $3.23 (4th highest)
> Arts, entertainment, and recreation establishments: 52 per 100,000 people
[in-text-ad-2]
20. Oklahoma
> Average cost of dinner, drinks, and movie: $98.26 (tied — 13th lowest)
> Combined average tax rate: 8.92% (6th highest)
> Price of regular gasoline as of Aug. 6, 2019: $2.42 (6th lowest)
> Arts, entertainment, and recreation establishments: 29 per 100,000 people
21. Texas
> Average cost of dinner, drinks, and movie: $99.60 (25th lowest)
> Combined average tax rate: 8.19% (12th highest)
> Price of regular gasoline as of Aug. 6, 2019: $2.44 (8th lowest)
> Arts, entertainment, and recreation establishments: 26 per 100,000 people
[in-text-ad]
22. Arkansas
> Average cost of dinner, drinks, and movie: $97.34 (6th lowest)
> Combined average tax rate: 9.43% (3rd highest)
> Price of regular gasoline as of Aug. 6, 2019: $2.37 (5th lowest)
> Arts, entertainment, and recreation establishments: 27 per 100,000 people
[recirclink id=470471]
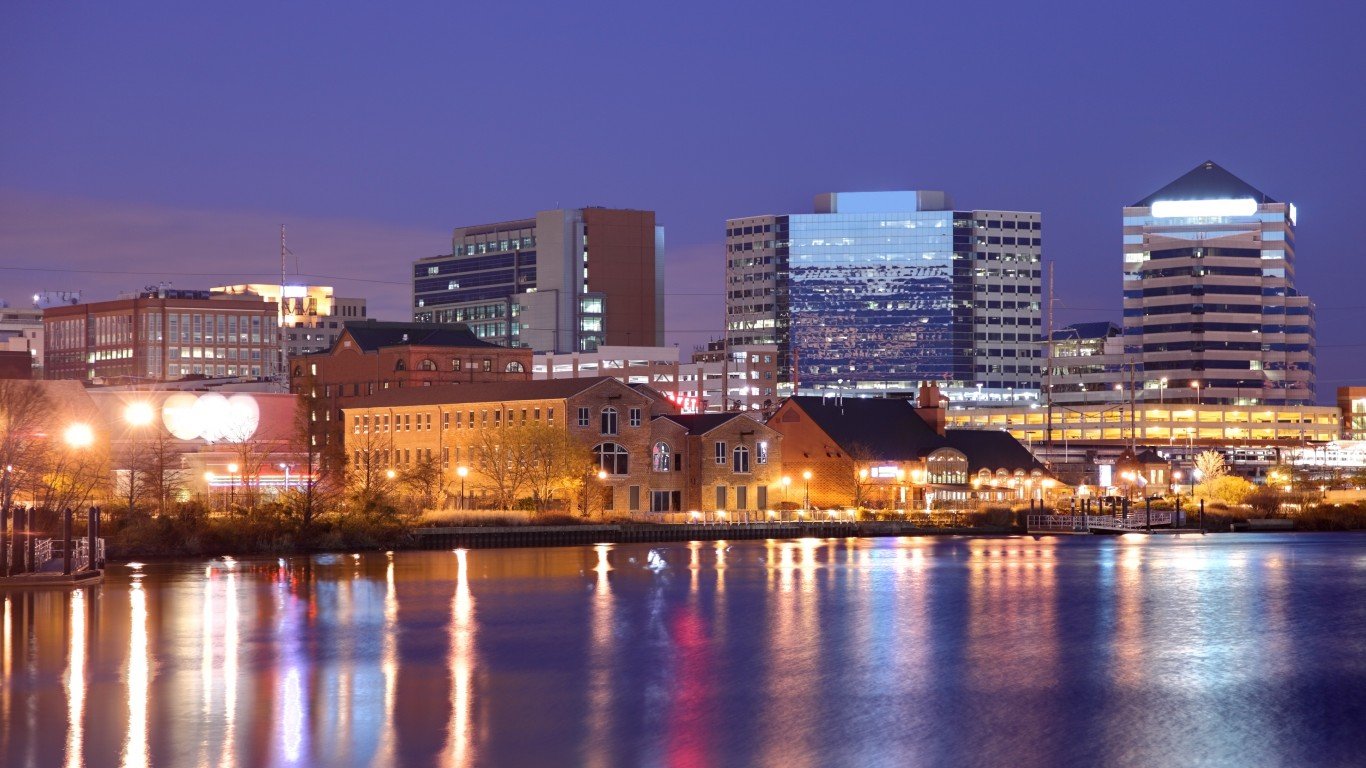
23. Delaware
> Average cost of dinner, drinks, and movie: $101.44 (18th highest)
> Combined average tax rate: 0.00% (tied — 4th lowest)
> Price of regular gasoline as of Aug. 6, 2019: $2.49 (12th lowest)
> Arts, entertainment, and recreation establishments: 46 per 100,000 people
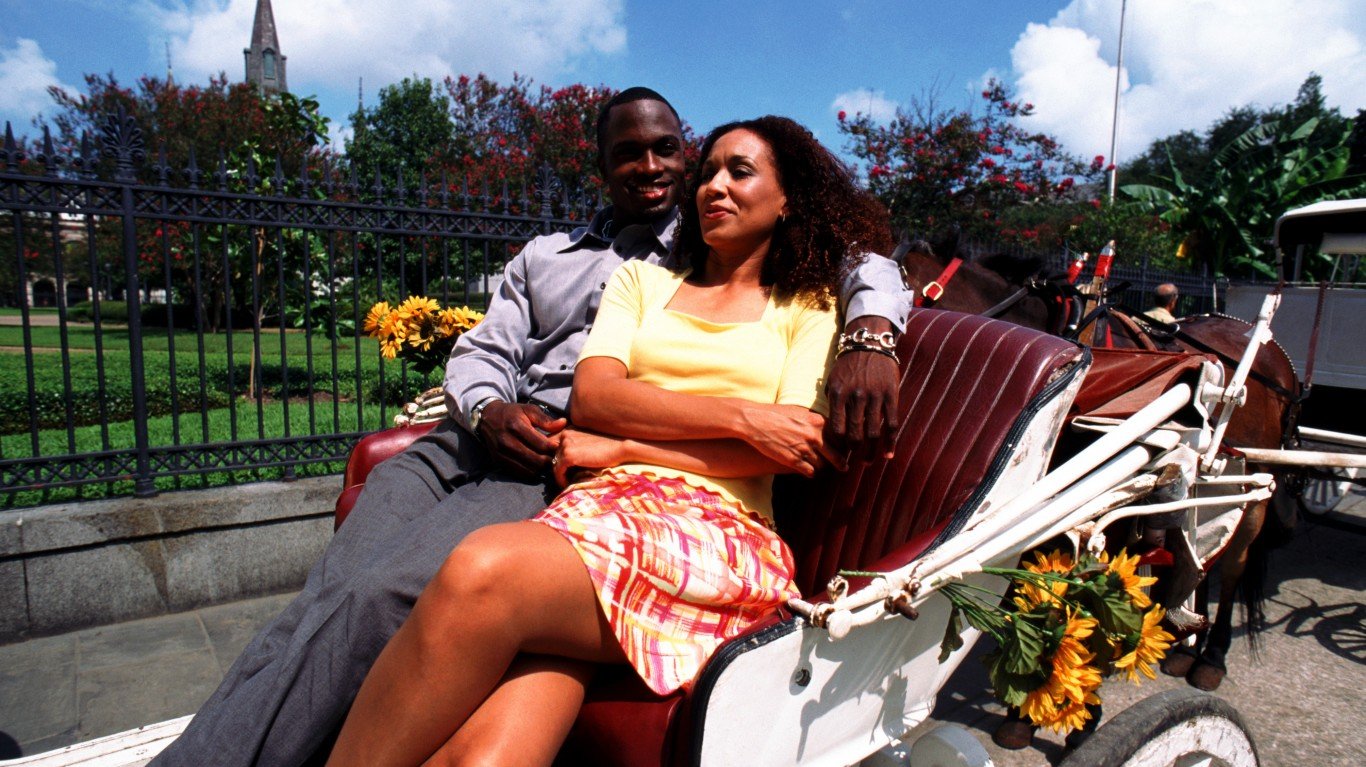
24. Louisiana
> Average cost of dinner, drinks, and movie: $99.29 (tied — 21st lowest)
> Combined average tax rate: 9.45% (2nd highest)
> Price of regular gasoline as of Aug. 6, 2019: $2.33 (the lowest)
> Arts, entertainment, and recreation establishments: 31 per 100,000 people
[in-text-ad-2]
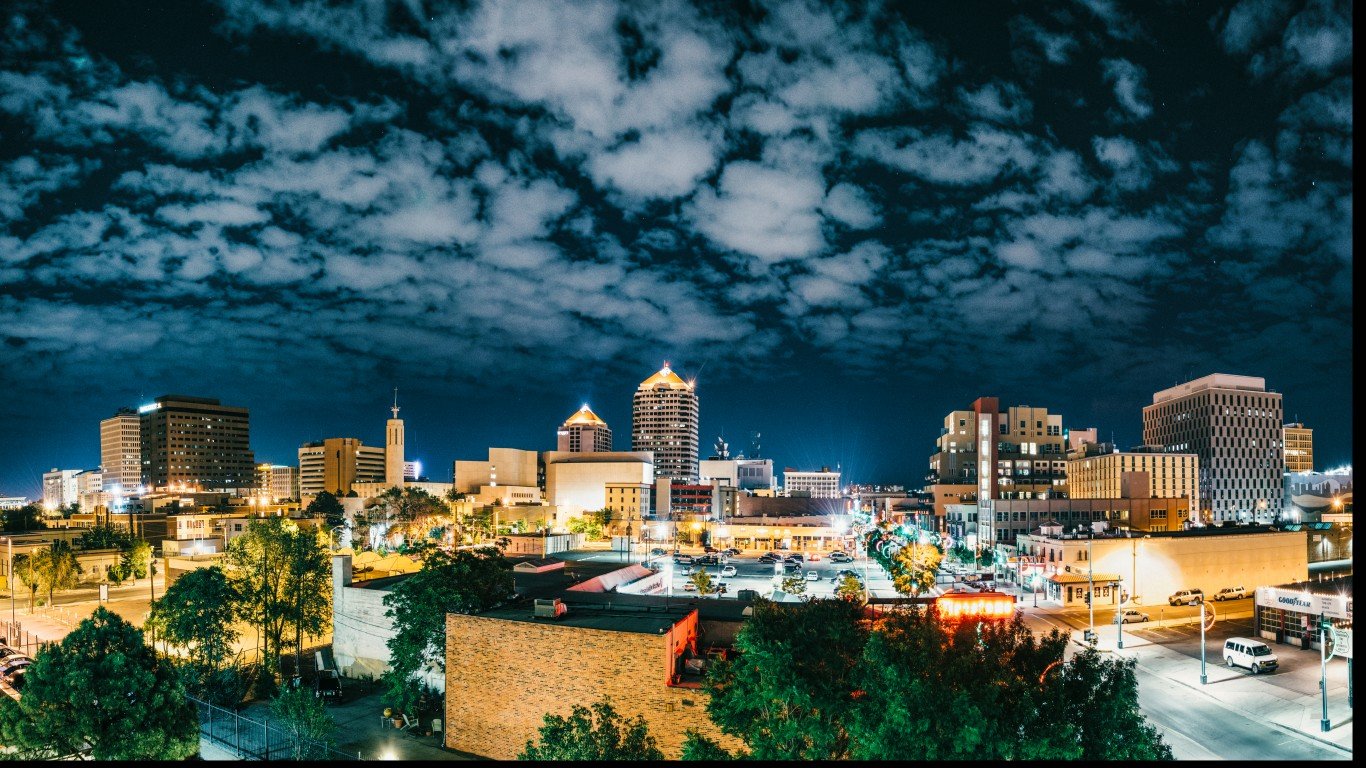
25. New Mexico
> Average cost of dinner, drinks, and movie: $99.49 (24th lowest)
> Combined average tax rate: 7.82% (15th highest)
> Price of regular gasoline as of Aug. 6, 2019: $2.55 (tied — 17th lowest)
> Arts, entertainment, and recreation establishments: 34 per 100,000 people
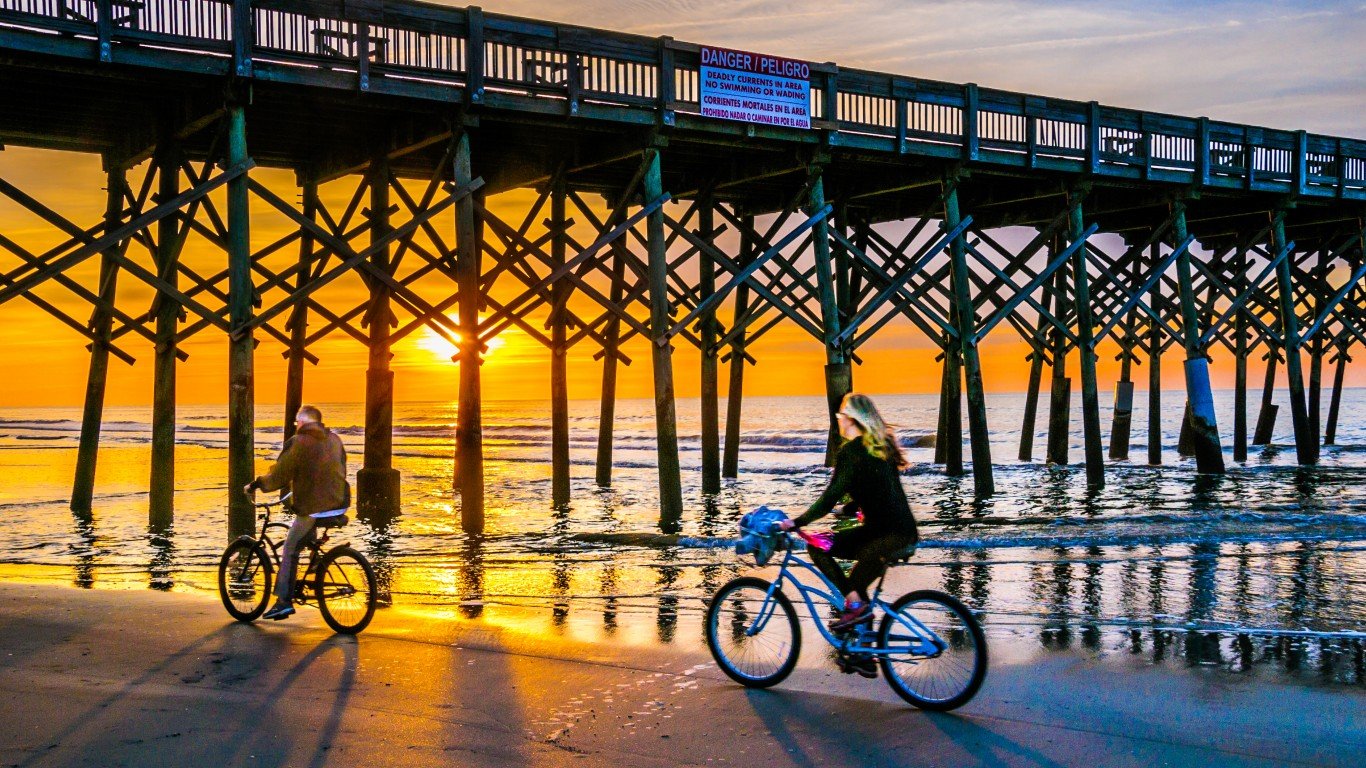
26. South Carolina
> Average cost of dinner, drinks, and movie: $99.39 (tied — 23rd lowest)
> Combined average tax rate: 7.43% (17th highest)
> Price of regular gasoline as of Aug. 6, 2019: $2.37 (4th lowest)
> Arts, entertainment, and recreation establishments: 34 per 100,000 people
[in-text-ad]

27. Utah
> Average cost of dinner, drinks, and movie: $99.08 (tied — 19th lowest)
> Combined average tax rate: 6.94% (25th lowest)
> Price of regular gasoline as of Aug. 6, 2019: $2.92 (7th highest)
> Arts, entertainment, and recreation establishments: 37 per 100,000 people
[recirclink id=543026]

28. Minnesota
> Average cost of dinner, drinks, and movie: $103.91 (10th highest)
> Combined average tax rate: 7.43% (18th highest)
> Price of regular gasoline as of Aug. 6, 2019: $2.60 (20th lowest)
> Arts, entertainment, and recreation establishments: 52 per 100,000 people
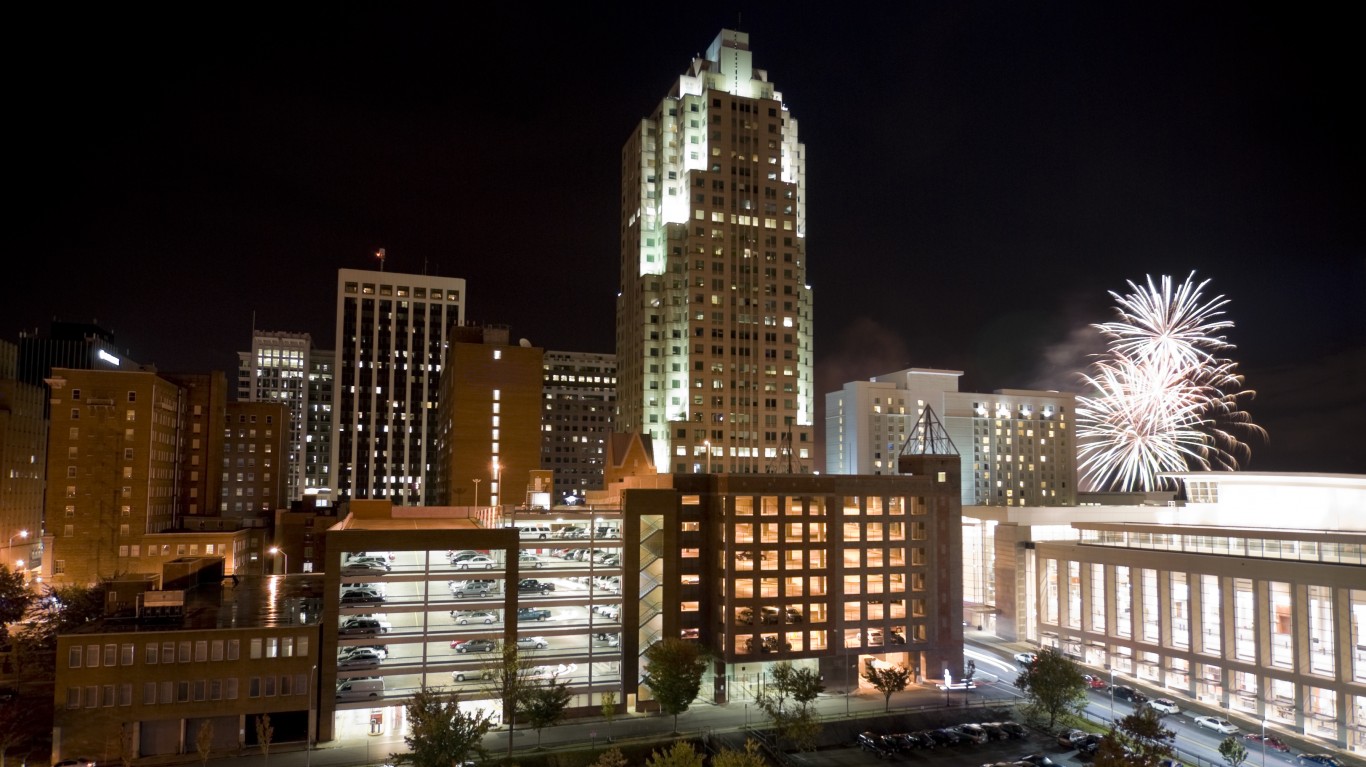
29. North Carolina
> Average cost of dinner, drinks, and movie: $99.08 (tied — 19th lowest)
> Combined average tax rate: 6.97% (25th highest)
> Price of regular gasoline as of Aug. 6, 2019: $2.52 (14th lowest)
> Arts, entertainment, and recreation establishments: 37 per 100,000 people
[in-text-ad-2]

30. Georgia
> Average cost of dinner, drinks, and movie: $99.39 (tied — 23rd lowest)
> Combined average tax rate: 7.29% (19th highest)
> Price of regular gasoline as of Aug. 6, 2019: $2.57 (18th lowest)
> Arts, entertainment, and recreation establishments: 31 per 100,000 people
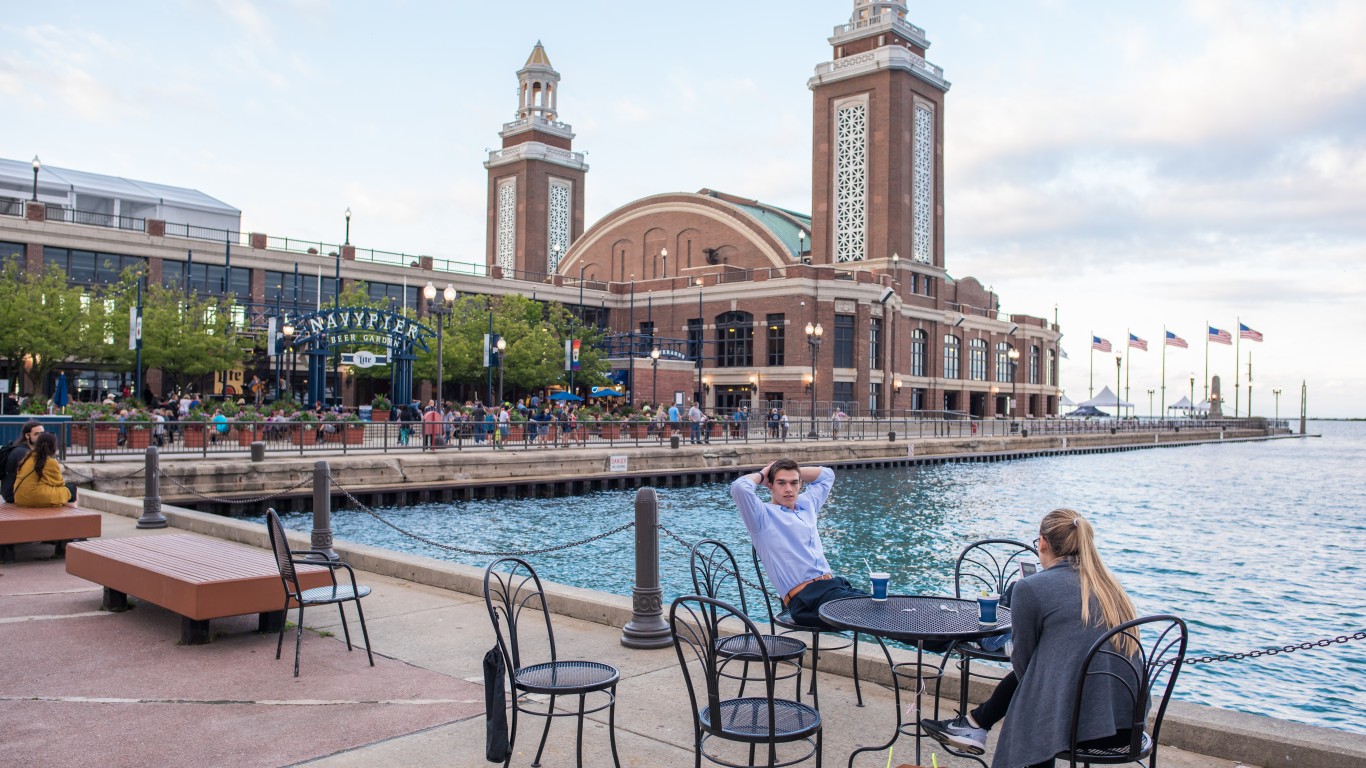
31. Illinois
> Average cost of dinner, drinks, and movie: $100.83 (24th highest)
> Combined average tax rate: 8.74% (7th highest)
> Price of regular gasoline as of Aug. 6, 2019: $2.90 (8th highest)
> Arts, entertainment, and recreation establishments: 38 per 100,000 people
[in-text-ad]

32. Kentucky
> Average cost of dinner, drinks, and movie: $97.03 (tied — 3rd lowest)
> Combined average tax rate: 6.00% (tied — 13th lowest)
> Price of regular gasoline as of Aug. 6, 2019: $2.52 (15th lowest)
> Arts, entertainment, and recreation establishments: 30 per 100,000 people
[recirclink id=451945]
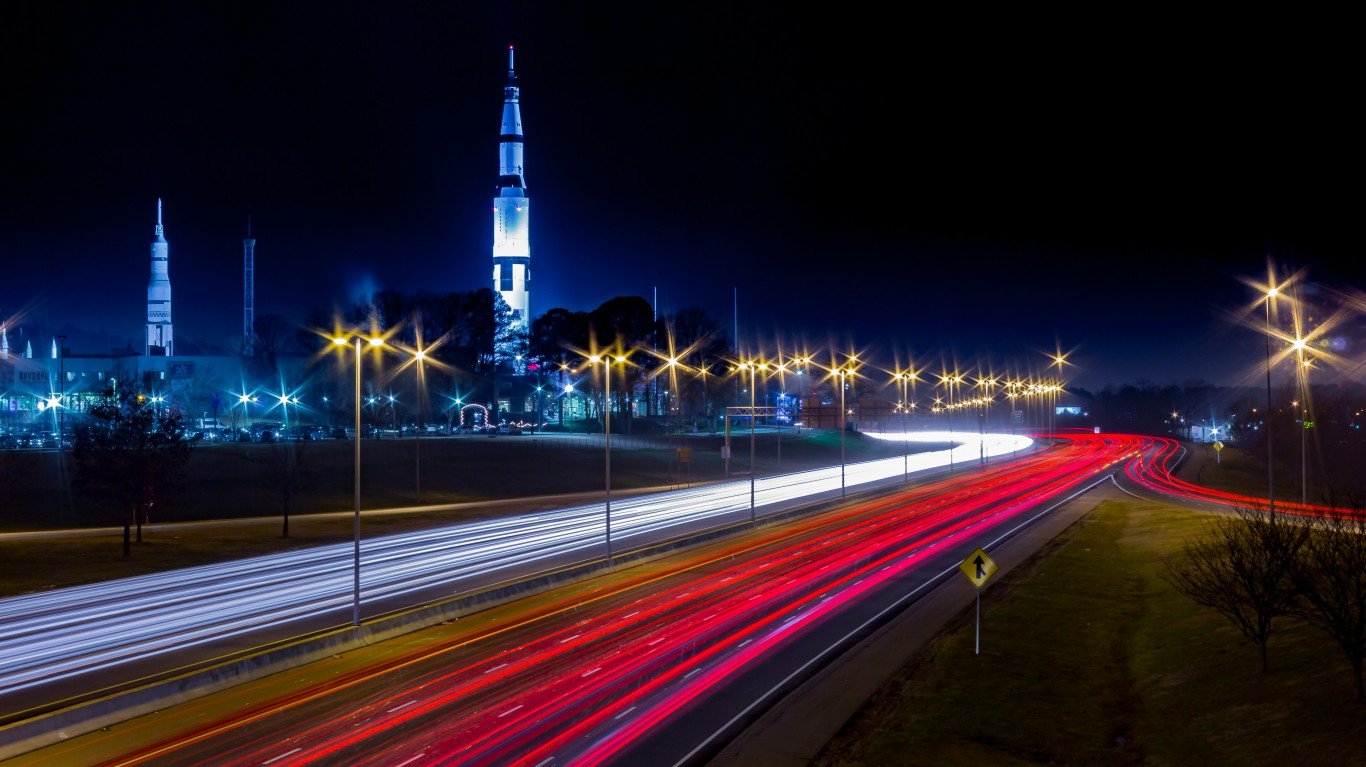
33. Alabama
> Average cost of dinner, drinks, and movie: $98.98 (17th lowest)
> Combined average tax rate: 9.14% (5th highest)
> Price of regular gasoline as of Aug. 6, 2019: $2.35 (3rd lowest)
> Arts, entertainment, and recreation establishments: 24 per 100,000 people

34. Alaska
> Average cost of dinner, drinks, and movie: $104.01 (9th highest)
> Combined average tax rate: 1.43% (5th lowest)
> Price of regular gasoline as of Aug. 6, 2019: $3.10 (6th highest)
> Arts, entertainment, and recreation establishments: 77 per 100,000 people
[in-text-ad-2]
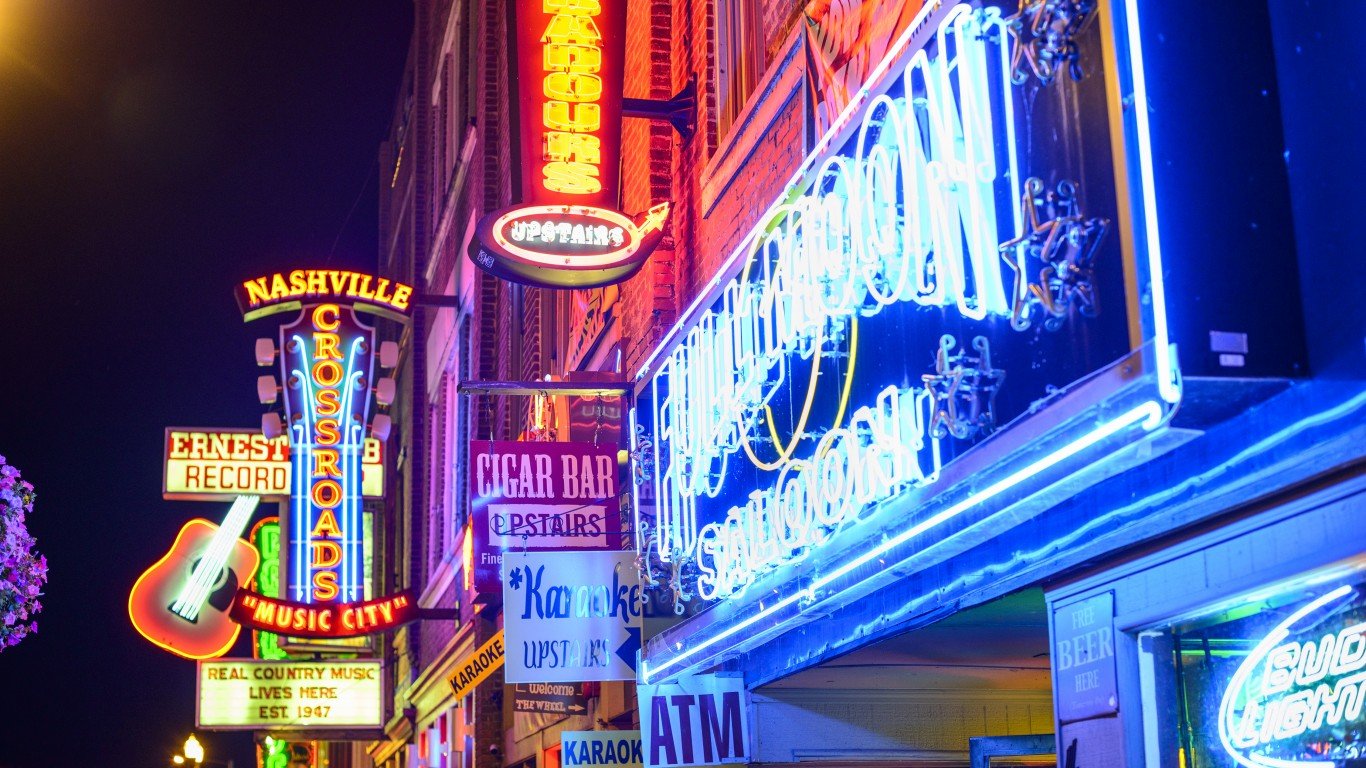
35. Tennessee
> Average cost of dinner, drinks, and movie: $98.88 (16th lowest)
> Combined average tax rate: 9.47% (the highest)
> Price of regular gasoline as of Aug. 6, 2019: $2.43 (7th lowest)
> Arts, entertainment, and recreation establishments: 39 per 100,000 people
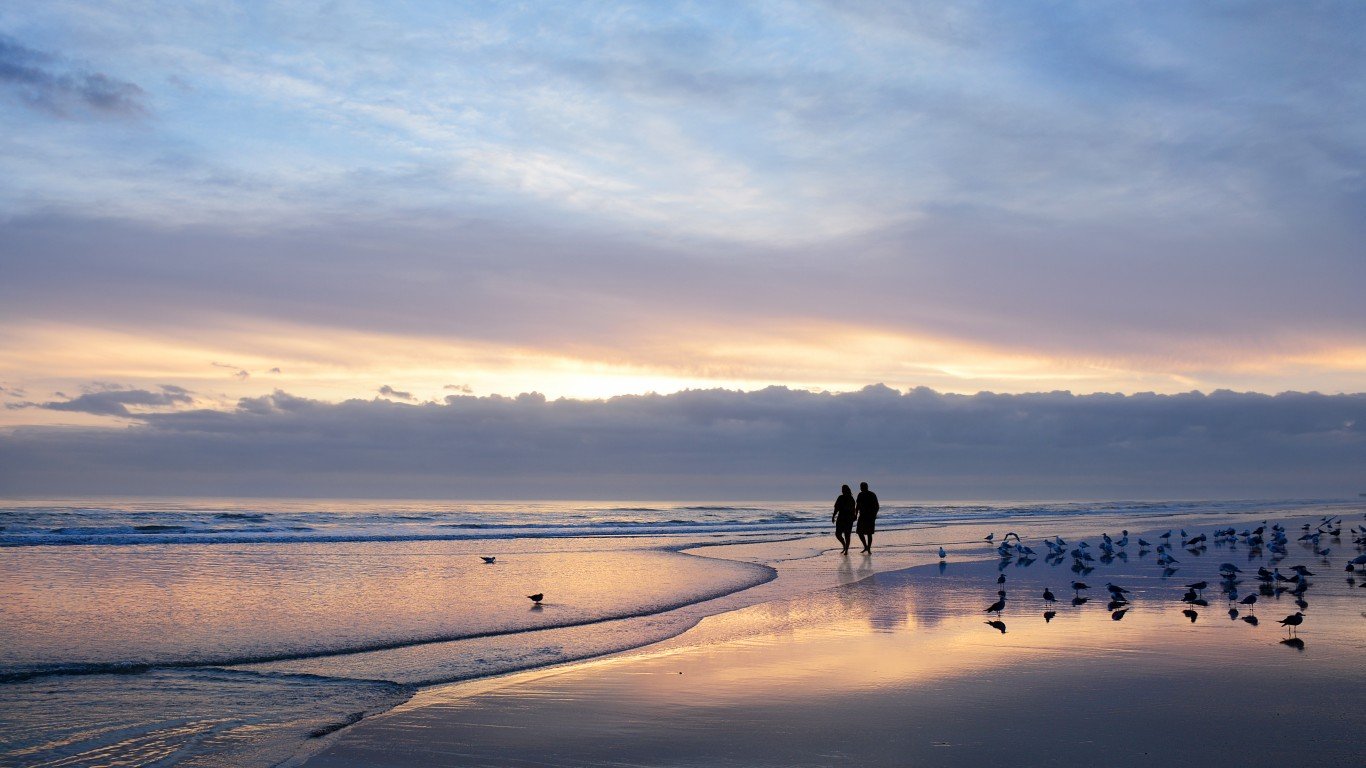
36. Florida
> Average cost of dinner, drinks, and movie: $101.03 (tied — 20th highest)
> Combined average tax rate: 7.05% (22nd highest)
> Price of regular gasoline as of Aug. 6, 2019: $2.50 (13th lowest)
> Arts, entertainment, and recreation establishments: 42 per 100,000 people
[in-text-ad]
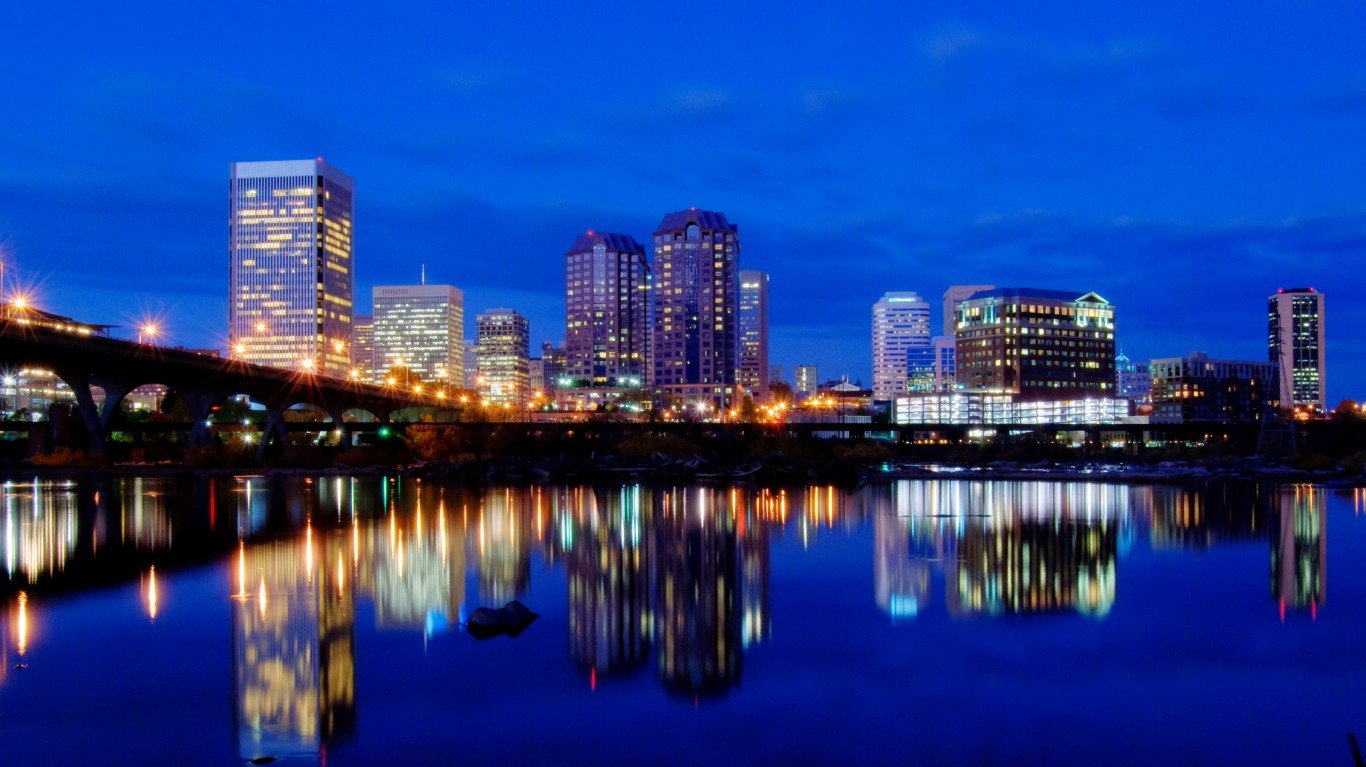
37. Virginia
> Average cost of dinner, drinks, and movie: $102.37 (12th highest)
> Combined average tax rate: 5.65% (10th lowest)
> Price of regular gasoline as of Aug. 6, 2019: $2.46 (10th lowest)
> Arts, entertainment, and recreation establishments: 36 per 100,000 people
[recirclink id=520415]
38. Maine
> Average cost of dinner, drinks, and movie: $101.14 (19th highest)
> Combined average tax rate: 5.50% (9th lowest)
> Price of regular gasoline as of Aug. 6, 2019: $2.70 (23rd highest)
> Arts, entertainment, and recreation establishments: 67 per 100,000 people
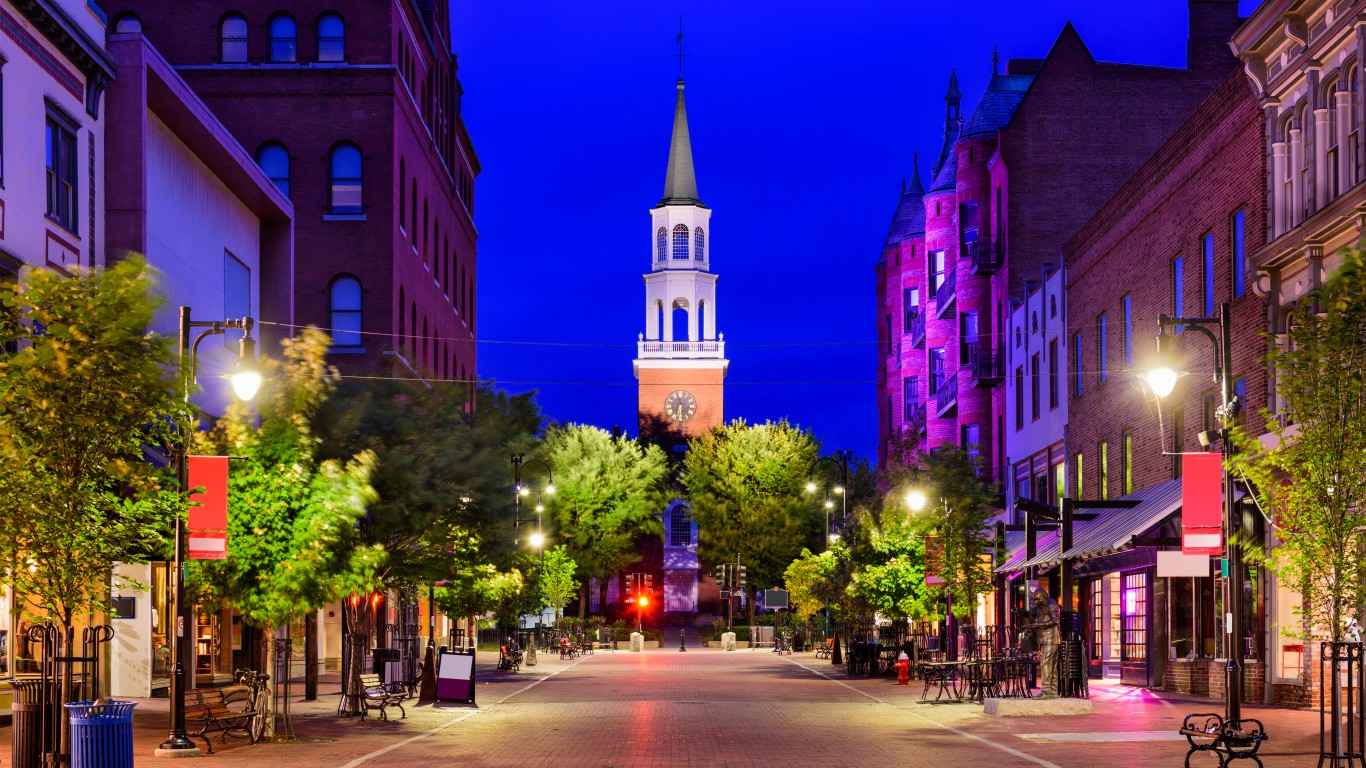
39. Vermont
> Average cost of dinner, drinks, and movie: $101.03 (tied — 20th highest)
> Combined average tax rate: 6.18% (15th lowest)
> Price of regular gasoline as of Aug. 6, 2019: $2.73 (18th highest)
> Arts, entertainment, and recreation establishments: 79 per 100,000 people
[in-text-ad-2]

40. California
> Average cost of dinner, drinks, and movie: $106.16 (6th highest)
> Combined average tax rate: 8.56% (9th highest)
> Price of regular gasoline as of Aug. 6, 2019: $3.67 (the highest)
> Arts, entertainment, and recreation establishments: 63 per 100,000 people
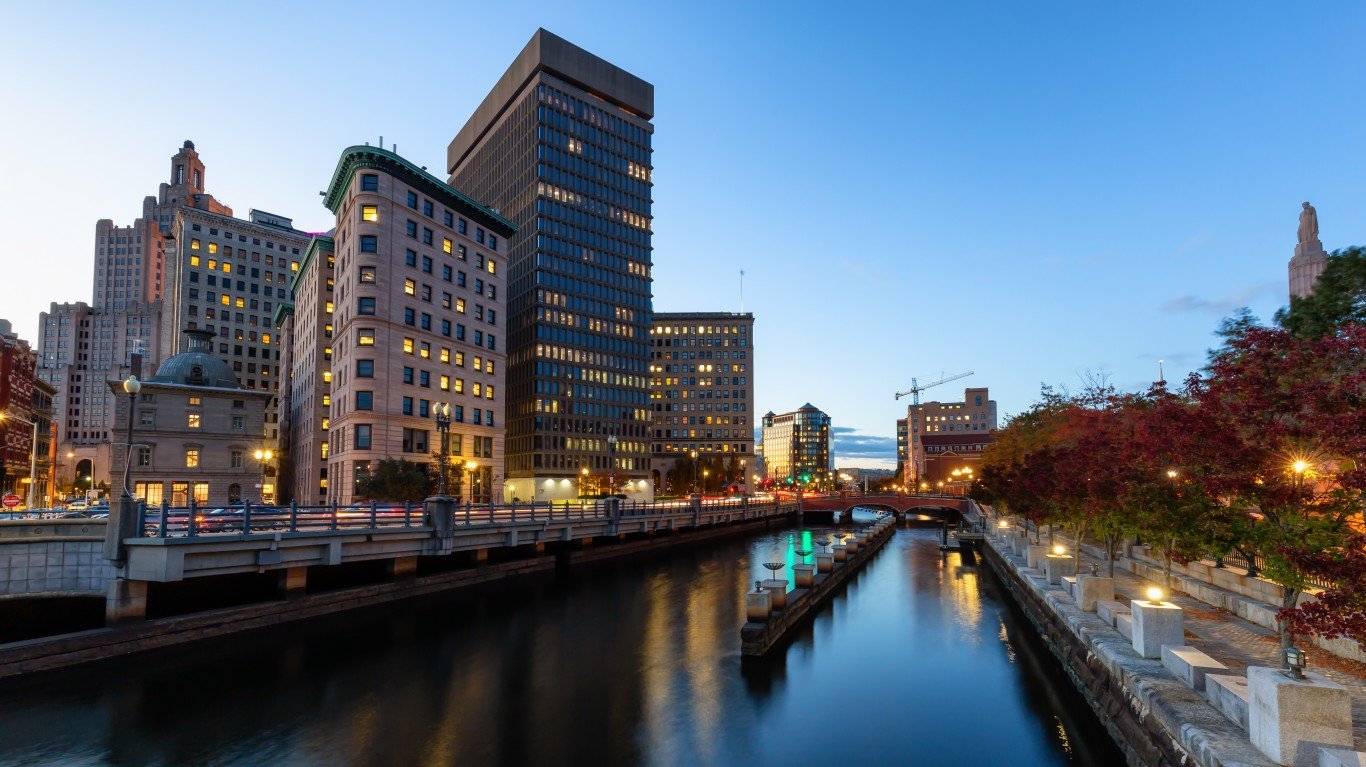
41. Rhode Island
> Average cost of dinner, drinks, and movie: $100.93 (23rd highest)
> Combined average tax rate: 7.00% (tied — 23rd highest)
> Price of regular gasoline as of Aug. 6, 2019: $2.71 (22nd highest)
> Arts, entertainment, and recreation establishments: 52 per 100,000 people
[in-text-ad]

42. Maryland
> Average cost of dinner, drinks, and movie: $106.26 (5th highest)
> Combined average tax rate: 6.00% (tied — 13th lowest)
> Price of regular gasoline as of Aug. 6, 2019: $2.64 (23rd lowest)
> Arts, entertainment, and recreation establishments: 35 per 100,000 people
[recirclink id=546759]
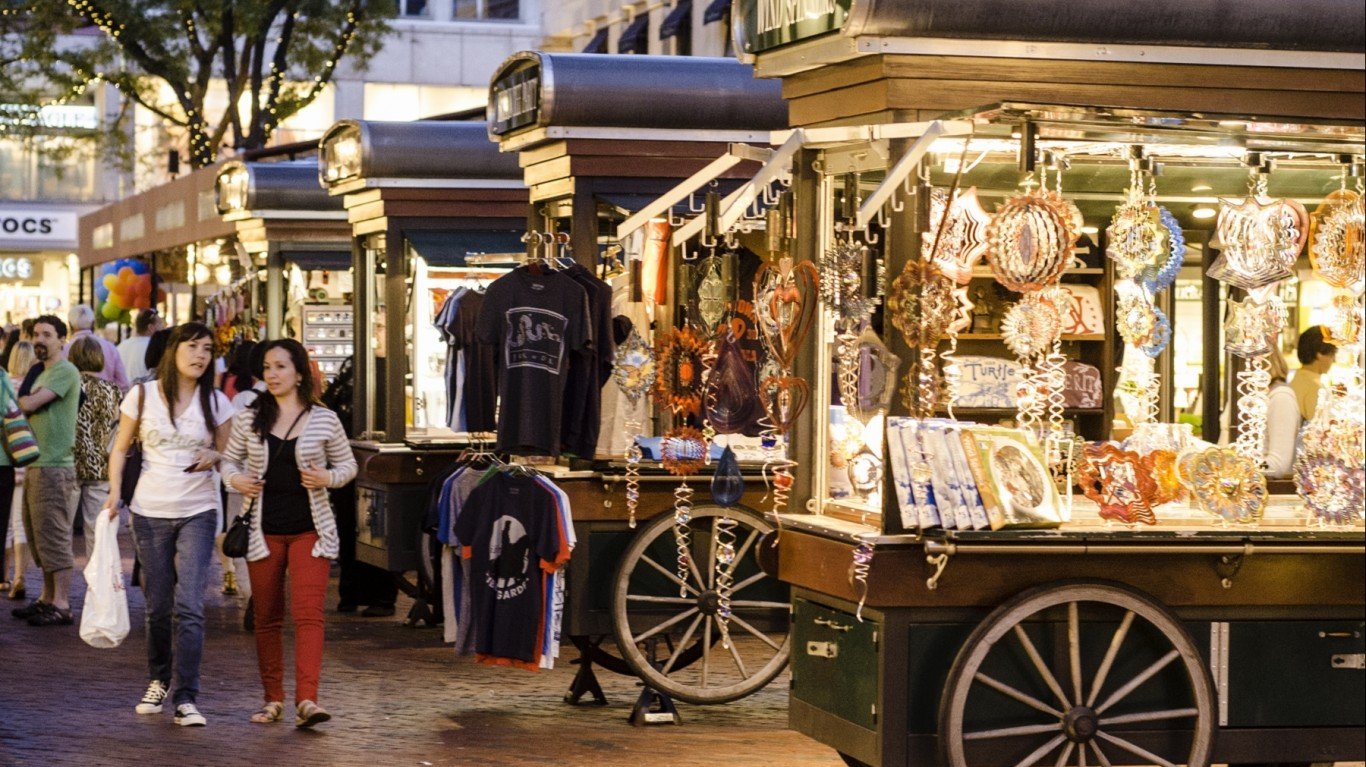
43. Massachusetts
> Average cost of dinner, drinks, and movie: $104.42 (8th highest)
> Combined average tax rate: 6.25% (16th lowest)
> Price of regular gasoline as of Aug. 6, 2019: $2.73 (19th highest)
> Arts, entertainment, and recreation establishments: 50 per 100,000 people

44. New Hampshire
> Average cost of dinner, drinks, and movie: $103.50 (11th highest)
> Combined average tax rate: 0.00% (tied — 4th lowest)
> Price of regular gasoline as of Aug. 6, 2019: $2.62 (22nd lowest)
> Arts, entertainment, and recreation establishments: 60 per 100,000 people
[in-text-ad-2]
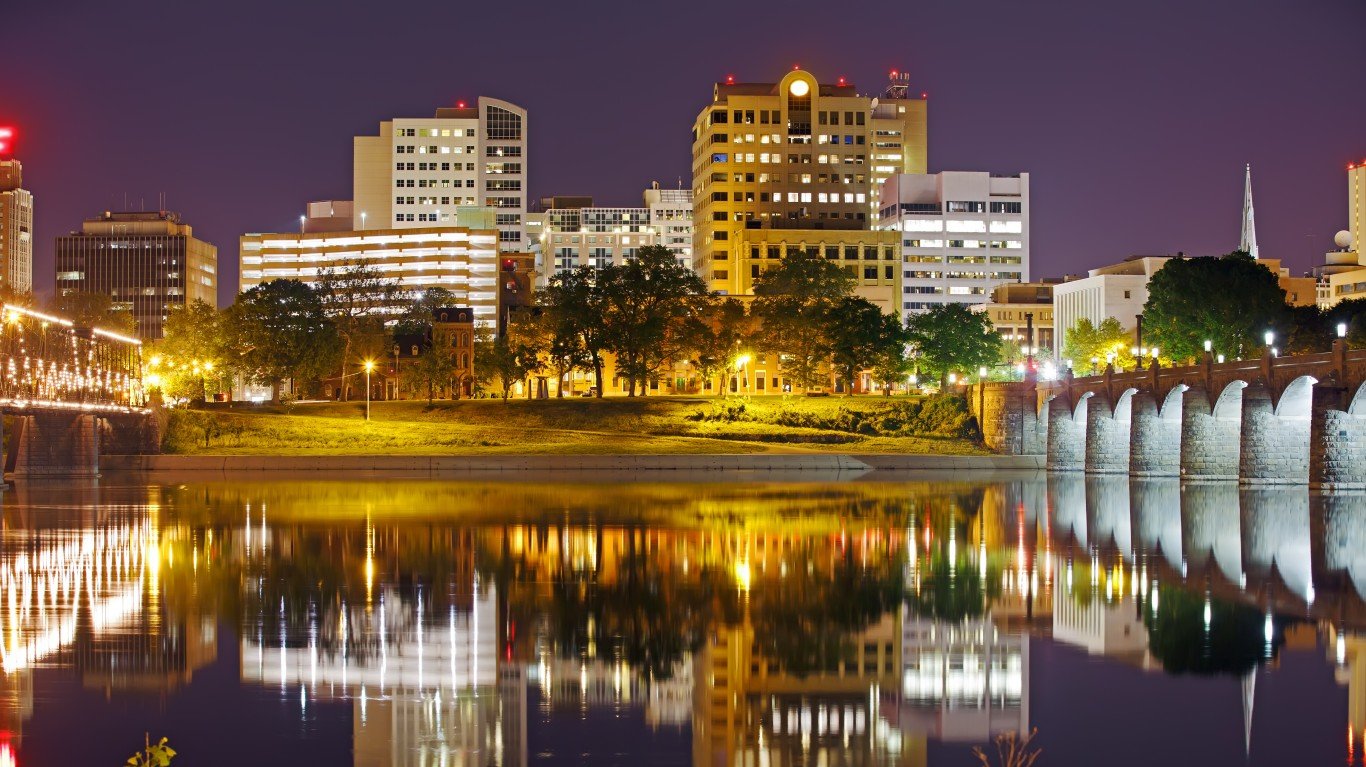
45. Pennsylvania
> Average cost of dinner, drinks, and movie: $101.96 (tied — 14th highest)
> Combined average tax rate: 6.34% (17th lowest)
> Price of regular gasoline as of Aug. 6, 2019: $2.87 (10th highest)
> Arts, entertainment, and recreation establishments: 37 per 100,000 people

46. Washington
> Average cost of dinner, drinks, and movie: $107.09 (3rd highest)
> Combined average tax rate: 9.17% (4th highest)
> Price of regular gasoline as of Aug. 6, 2019: $3.28 (3rd highest)
> Arts, entertainment, and recreation establishments: 41 per 100,000 people
[in-text-ad]

47. Connecticut
> Average cost of dinner, drinks, and movie: $106.67 (4th highest)
> Combined average tax rate: 6.35% (18th lowest)
> Price of regular gasoline as of Aug. 6, 2019: $2.87 (11th highest)
> Arts, entertainment, and recreation establishments: 48 per 100,000 people
[recirclink id=438440]

48. Hawaii
> Average cost of dinner, drinks, and movie: $114.16 (the highest)
> Combined average tax rate: 4.41% (6th lowest)
> Price of regular gasoline as of Aug. 6, 2019: $3.66 (2nd highest)
> Arts, entertainment, and recreation establishments: 37 per 100,000 people
49. New Jersey
> Average cost of dinner, drinks, and movie: $104.62 (7th highest)
> Combined average tax rate: 6.60% (21st lowest)
> Price of regular gasoline as of Aug. 6, 2019: $2.77 (15th highest)
> Arts, entertainment, and recreation establishments: 40 per 100,000 people
[in-text-ad-2]

50. New York
> Average cost of dinner, drinks, and movie: $111.60 (2nd highest)
> Combined average tax rate: 8.49% (10th highest)
> Price of regular gasoline as of Aug. 6, 2019: $2.86 (12th highest)
> Arts, entertainment, and recreation establishments: 64 per 100,000 people
Contact [email protected] for any questions or corrections.