[cnxvideo id=”894040″ placement=”ros”]
Living in the United States by no means guarantees a good life, but in some parts of the country, virtually all residents live a highly prosperous lifestyle. Being born in these cities is as close to a guarantee as possible that at least in terms of socioeconomic measures, these people will live a better-than-average lifestyle.
While quality of life is subject to a range of factors — close relationships and personal health chief among them — the local community, economy, and environment can also have a meaningful impact.
When it comes to choosing a place to call home, everyone has their own priorities and subjective tastes. Still, certain attributes that some communities share are almost universally desirable, including safe streets, a strong economy, affordability, and a range of entertainment options, to name a few.
24/7 Wall St. created a weighted index of over two dozen measures from the U.S. Census Bureau, the FBI, and other sources to identify the best city to live in. We considered all boroughs, census designated places, cities, towns, and villages with at least 8,000 residents.
The best cities to live in tend to have much in common beyond the index components. For one, these communities are often within commuting distance of a major metropolitan area.
This is no coincidence as close proximity to a major city provides residents with access to more job opportunities, which in turn can help lower unemployment and improve financial security. Places where more residents have completed a college education also tend to be more affluent. Several of the cities on this list also can be found on this list of the most educated city in every state.
The best cities include places just outside of just outside of Chicago, Los Angeles, Houston, and Milwaukee. These metro areas are highly desirable places to live, but the downside is that they also tend to be very expensive. Here is a list of the county with the most expensive housing market in every state.
Click here to see America’s 50 best cities to live
Click here to read our methodology

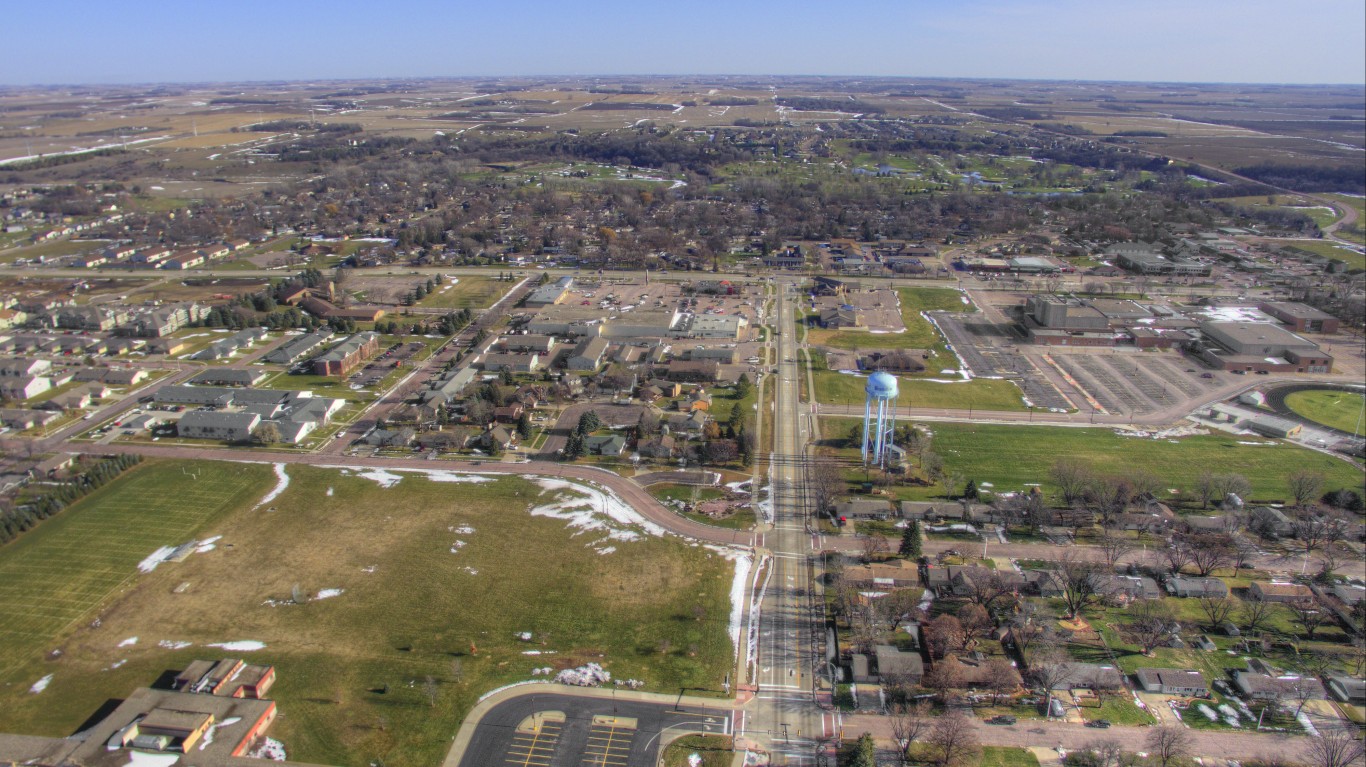
50. Grand Rapids, Minnesota
> Population: 11,099
> 5 yr. population change: +2.2%
> Median household income: $44,514
> Five-year unemployment rate: 0.6%
Grand Rapids, located in northern Minnesota, is one of several cities in the state to rank on this list. With a staggeringly low unemployment rate of just 0.6%, virtually anyone in the city who wants a job can get one. Grand Rapids residents also benefit from a low cost of living, as goods and services in the city are about 8% less expensive on average than they are nationwide.
Quality of life in Grand Rapids is also supported by easy access to a wide range of amenities. The city has a far greater than typical concentration of restaurants, bars, hotels, fitness centers, museums, and movie theaters on a per capita basis.
[in-text-ad]
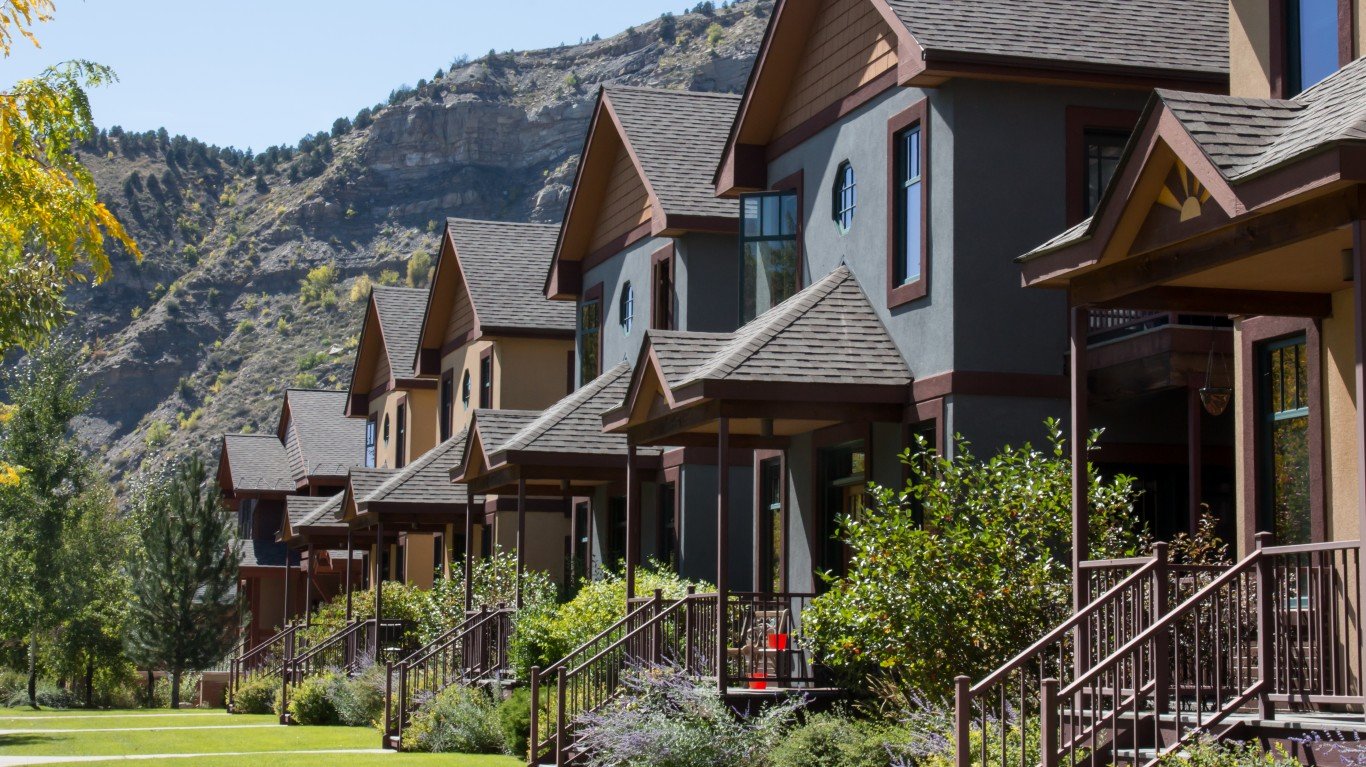
49. Durango, Colorado
> Population: 17,986
> 5 yr. population change: +6.2%
> Median household income: $60,521
> Five-year unemployment rate: 3.4%
Durango, a small city in southwestern Colorado, is the only city in the state to rank among the best places to live. A relatively safe place, Durango’s 2017 violent crime rate of 234 incidents per 100,000 people is well below the national rate of 383 per 100,000.
Due to its location, Durango offers easy access to places to ski, hiking, and mountain biking. The city also boasts a number of museums and art galleries and far greater than typical concentration of bars and restaurants.
[recirclink id=531551]
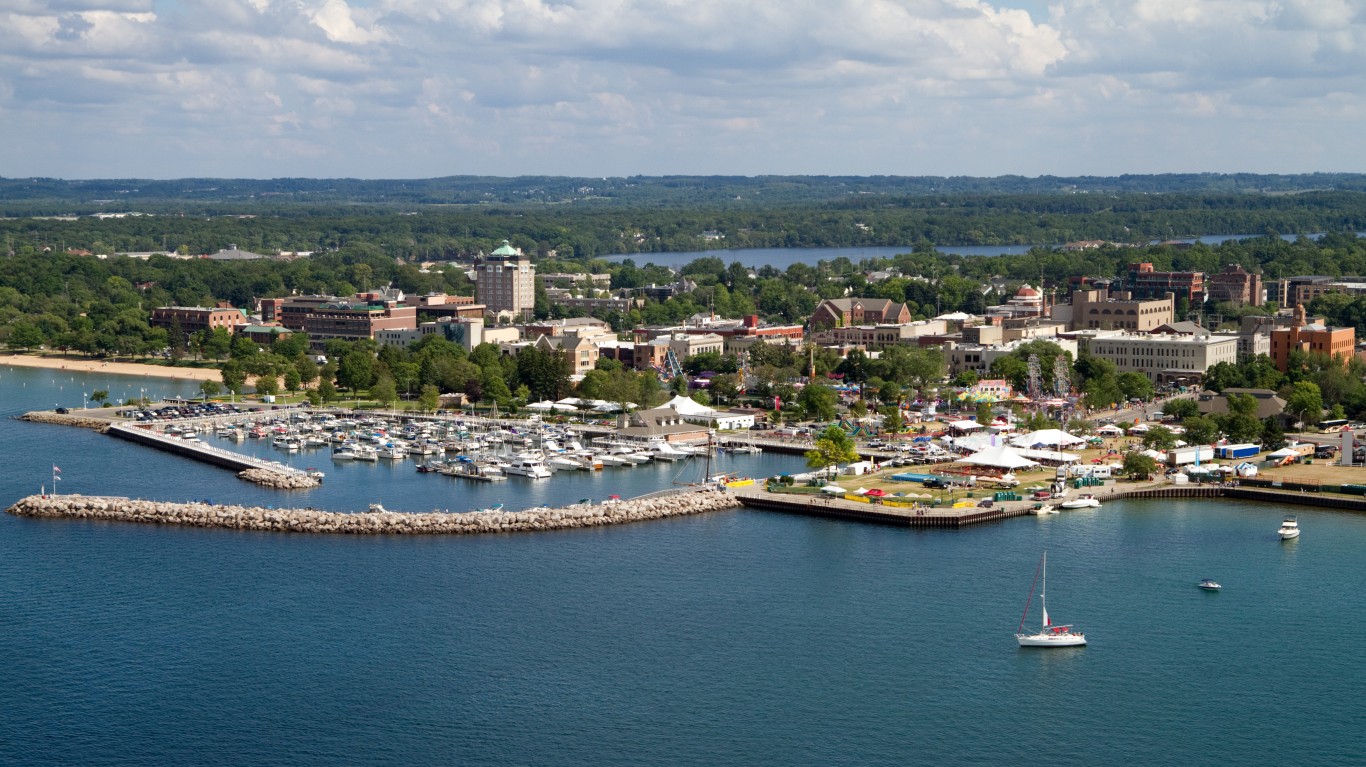
48. Traverse City, Michigan
> Population: 15,550
> 5 yr. population change: +5.8%
> Median household income: $53,237
> Five-year unemployment rate: 3.2%
Incomes in Traverse City, Michigan, are slightly below the national median, but due to the area’s relatively low cost of living, and after adjusting for inflation, incomes are roughly in line with the national median household income. Traverse City’s poverty rate is also below the national figure.
While Traverse City does not rank as highly as some of the other best U.S. cities to live in several of the economic factors, it has one of the highest concentrations of community facilities and amenities in the country — such as museums, movie theaters, fitness centers, restaurants and more — relative to most American Cities.
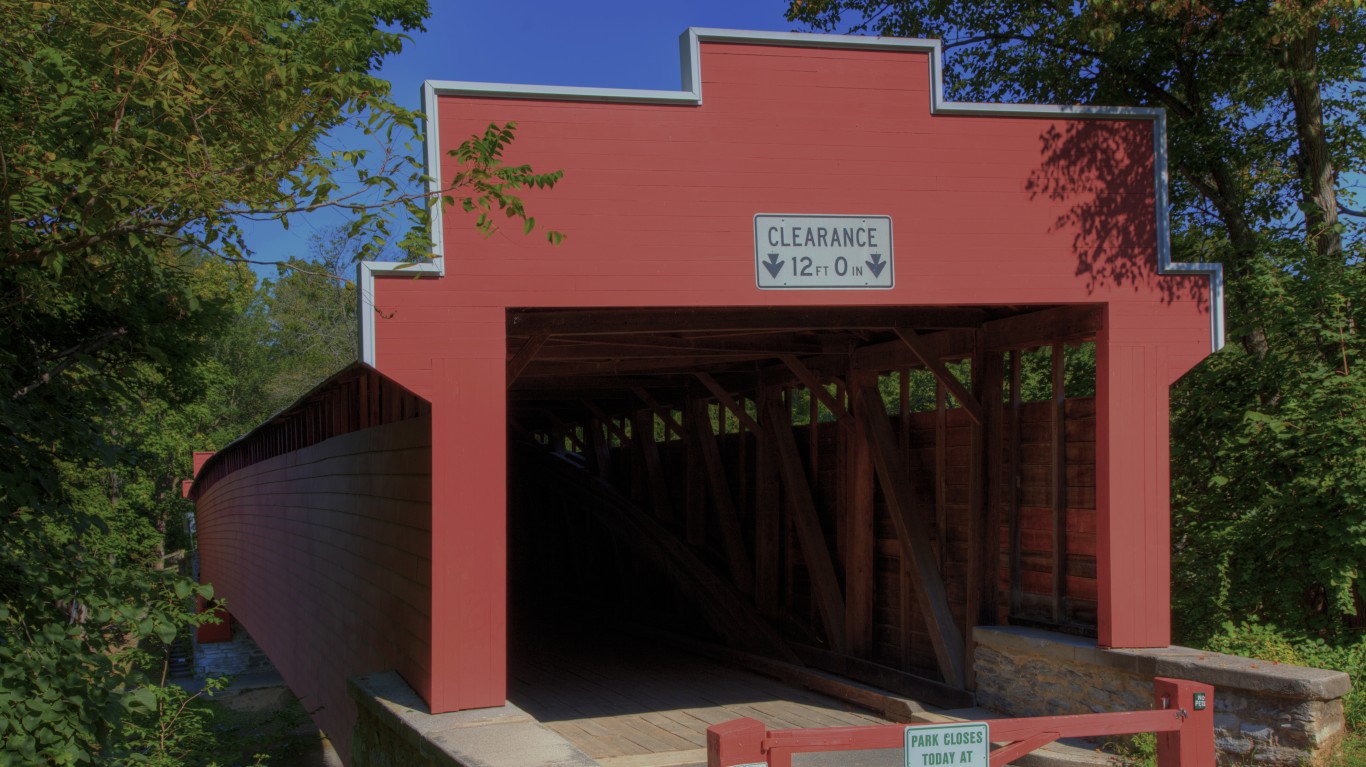
47. Wyomissing, Pennsylvania
> Population: 10,452
> 5 yr. population change: -0.4%
> Median household income: $78,792
> Five-year unemployment rate: 2.8%
Wyomissing is a small borough just outside of Reading, Pennsylvania, in the eastern part of the state. It is one of the better-educated places in the country, as more than half of the residents over 25 have at least a bachelor’s degree. Nationwide, only 30.9% of 25 and older Americans do.
Wyomissing residents have many more options for recreational activities than those in the vast majority of other American cities. The city has a far greater that typical concentration of movie theaters, libraries, recreational centers, and restaurants.
[in-text-ad-2]

46. South Jordan, Utah
> Population: 65,523
> 5 yr. population change: +28.2%
> Median household income: $99,856
> Five-year unemployment rate: 1.5%
South Jordan, located just south of Salt Lake City, is the only Utah city to rank among the 50 best to live in America. The median annual household income in South Jordan of nearly $100,000 is well beyond the U.S. median of $57,652. The city also has a strong job market, with an unemployment rate of just 1.5%, less than half the overall U.S. unemployment rate.
The low unemployment rate and high incomes are likely some of the reasons why people are flocking to South Jordan. The city went from having just over 51,000 residents to more than 65,500 in the last five years, an increase of over 28%.
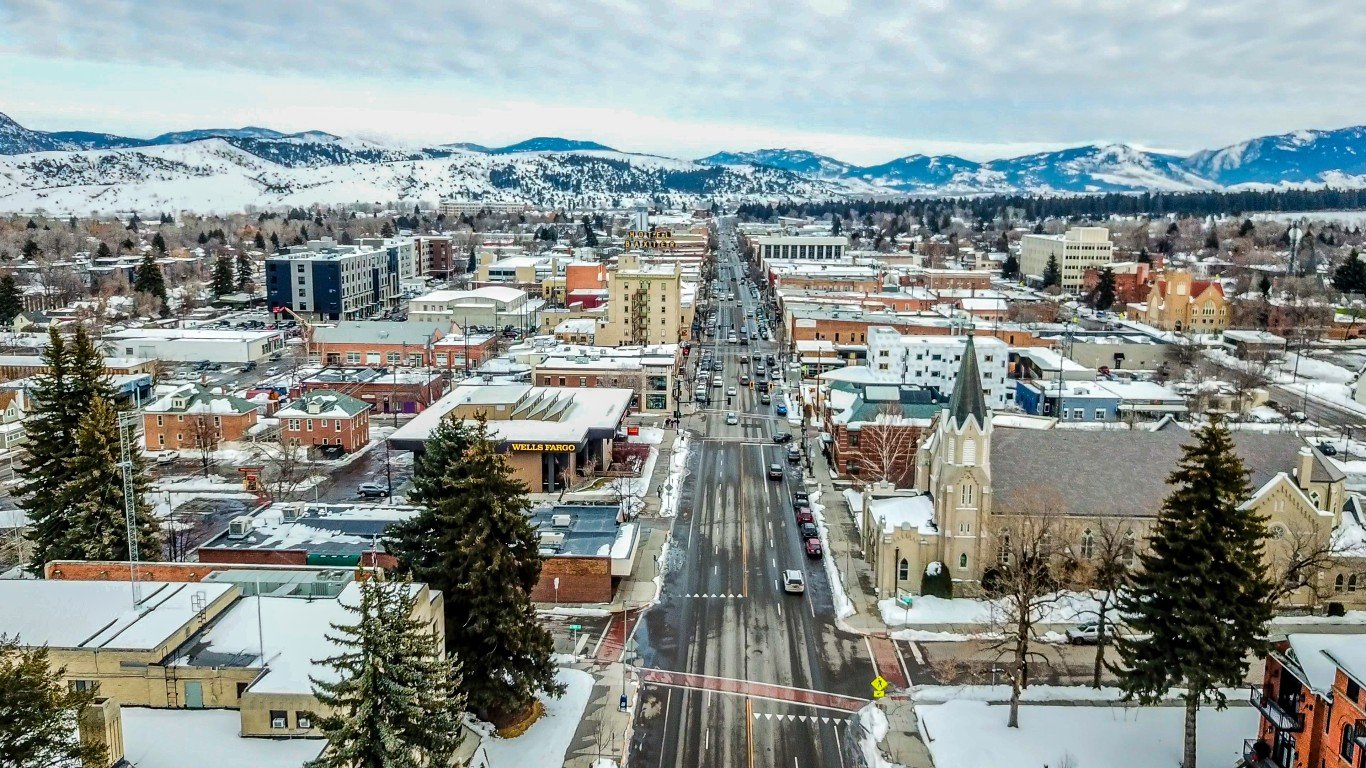
45. Bozeman, Montana
> Population: 43,132
> 5 yr. population change: +14.7%
> Median household income: $49,217
> Five-year unemployment rate: 3.8%
Bozeman’s population is on the rise, increasing by 14.7% in the last five years, compared to the U.S. population growth rate of 3.8% over the same period. Bozeman is the only city in the state where the population has increased by more than 10%. Population growth is often tied to job growth in an improving economy. And Bozeman’s employment increased by 21.7% over the same period.
For those who work in Bozeman, the average commute to work is one of the shortest in the country, and 14.2% of commuters bike or walk to work every day, compared to 3.3% of all American commuters.
[in-text-ad]
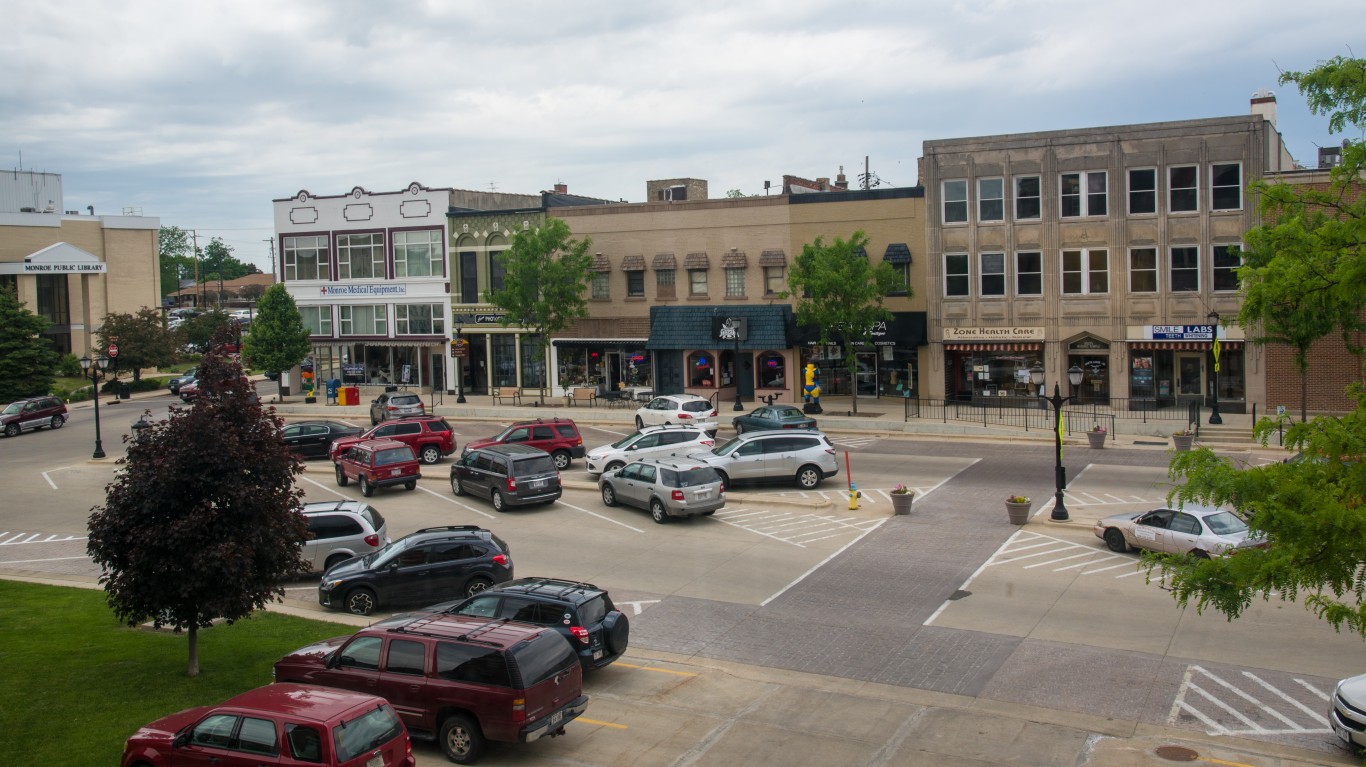
44. Monroe, Wisconsin
> Population: 10,688
> 5 yr. population change: -1.4%
> Median household income: $44,857
> Five-year unemployment rate: 1.9%
Monroe, which is known regionally as the “Swiss Cheese Capital of the U.S.A.” is a relatively small city of just over 10,000 people located in the southern part of Wisconsin, just north of the Illinois Border. Incomes in Monroe are not particularly high — the typical household income of $44,857 is well below the national figure of $57,652. Even adjusting for the relatively low cost of living in the city, the typical household income is worth less than the national figure. But very few people in the city are out of a job. Over the past five years, Monroe has had one of the lowest average unemployment rates in the country, at 1.9%, according to the U.S. Census Bureau.
[recirclink id=544777]
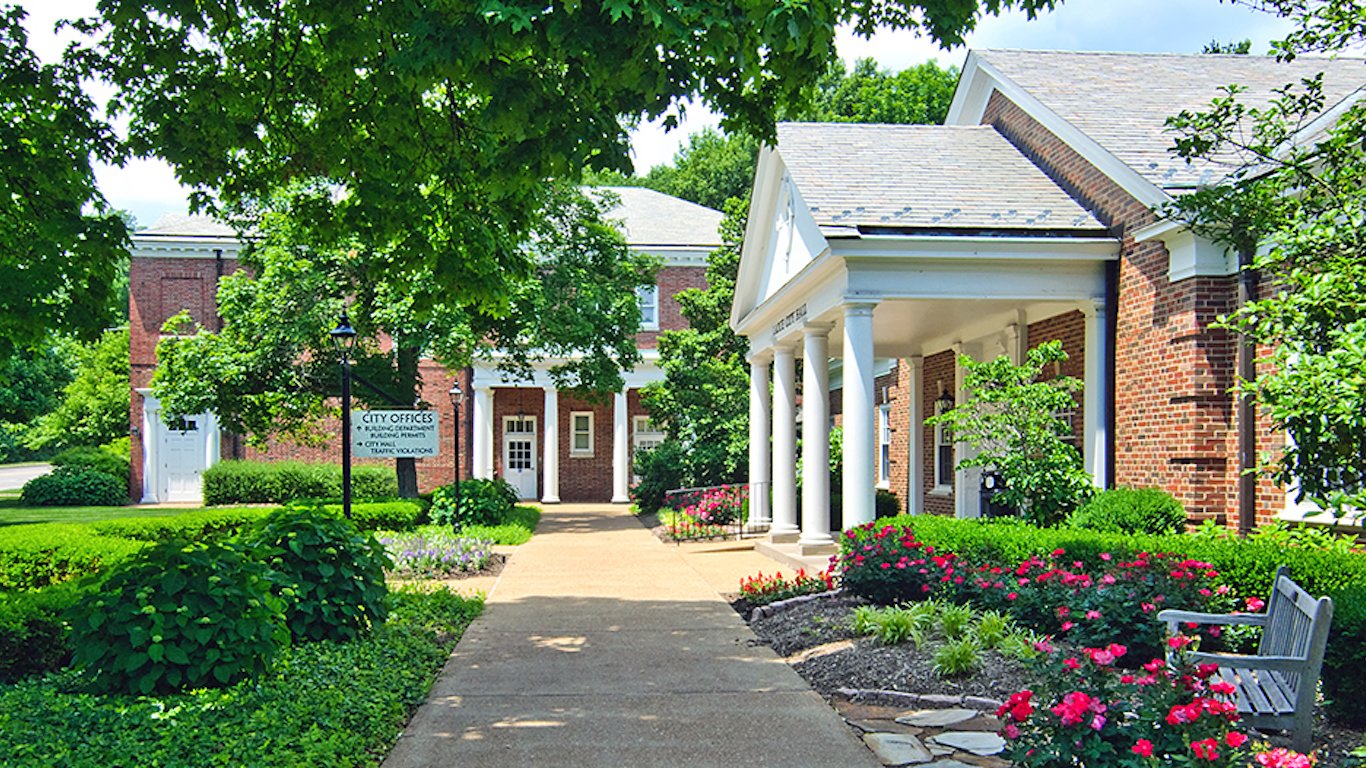
43. Montgomery, Ohio
> Population: 10,587
> 5 yr. population change: +3.6%
> Median household income: $115,489
> Five-year unemployment rate: 1.7%
Montgomery, Ohio, is a relatively affordable place to live. Goods and services cost, on average, 15 cents less on the dollar compared to the national average. The typical household earns $115,489 a year, which is well above the national figure of $57,652. Accounting for the low cost of living, those high incomes are worth even more.
Montgomery residents are among the least likely in the country to live in poverty. Just 3.5% of the population lives in poverty, compared to a national poverty rate of 14.6%.

42. North Canton, Ohio
> Population: 17,400
> 5 yr. population change: -0.1%
> Median household income: $57,003
> Five-year unemployment rate: 2.2%
North Canton ranks among the best cities to live in part because of how affordable it is. In the Ohio city, goods and services cost about 14% less than they would, on average, nationwide. The city’s unemployment rate of 2.2% is nearly half of the nation’s jobless rate of 4.1%.
North Canton also ranks as one of the best cities because it is among the safest. The violent crime rate of just 69 incidents per 100,000 residents is a fraction of the U.S. crime rate of 383 per 100,000.
[in-text-ad-2]

41. Sturgeon Bay, Wisconsin
> Population: 8,917
> 5 yr. population change: -2.6%
> Median household income: $51,332
> Five-year unemployment rate: 3.0%
Sturgeon Bay residents are less likely to face serious economic challenges than the typical American. The Wisconsin city has an unemployment rate of 3.0%, below the U.S. rate of 4.1%. It also has a poverty rate of 10.6%, 4 percentage points lower than the national poverty rate.
Sturgeon Bay also ranks among the safest places in the country. The violent crime rate of 68 incidents per 100,000 residents is a fraction of the U.S. rate. Residents also face relatively little property crime, at 1,059 incidents per 100,000 residents — well below the national rate of 2,362 per 100,000.
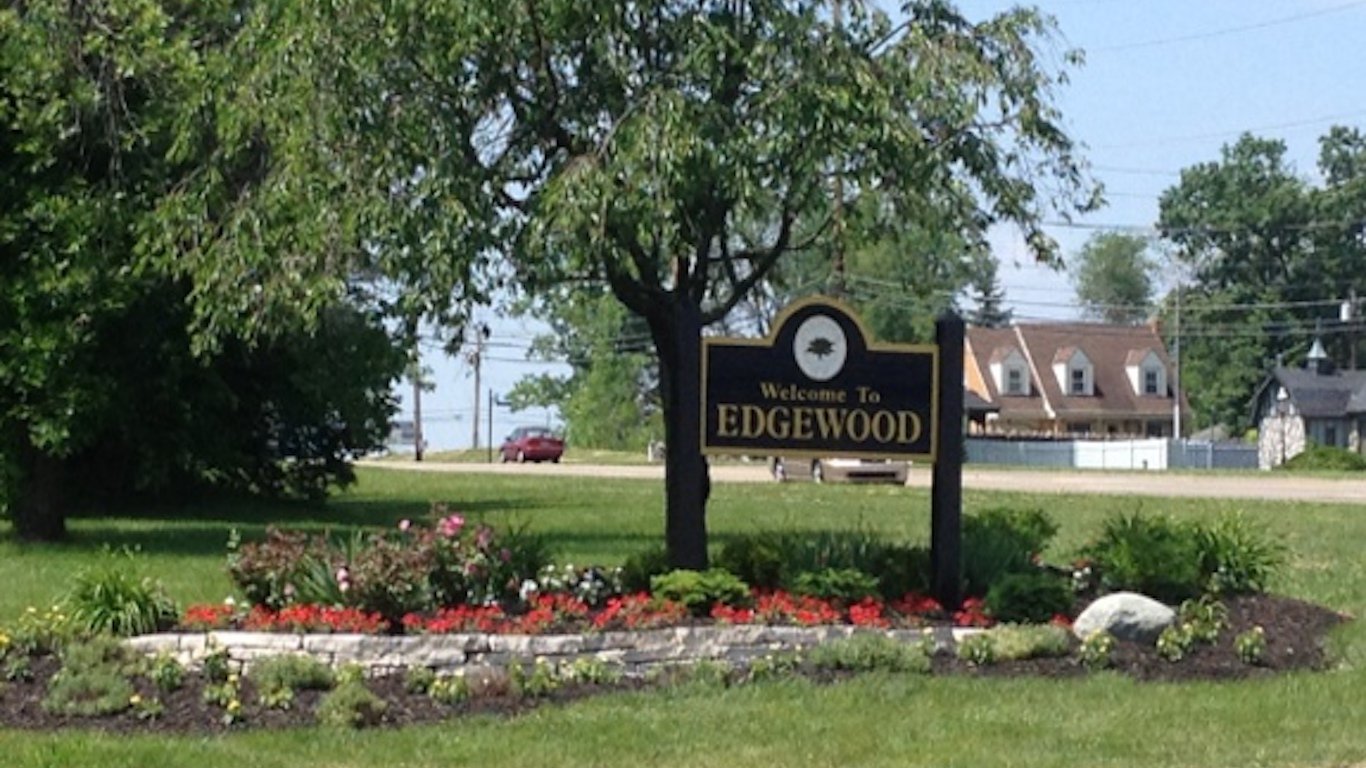
40. Edgewood, Kentucky
> Population: 8,688
> 5 yr. population change: +0.4%
> Median household income: $93,958
> Five-year unemployment rate: 1.5%
The best city to live in in Kentucky, Edgewood, is both wealthy and affordable. The typical household earns $93,958 a year, nearly double the median income of $57,652 across the state as a whole. Additionally, goods and services are about 11% less expensive in Edgewood than they are nationwide, on average.
Edgewood has two large public parks and an easily accessible hospital and medical care center within city limits, factors contributing to quality of life. Located about 7 miles south of Cincinnati across the Ohio River, Edgewood — like many cities on this list — is within commuting distance of a major metropolitan area.
[in-text-ad]

39. Stevens Point, Wisconsin
> Population: 26,526
> 5 yr. population change: -0.6%
> Median household income: $44,333
> Five-year unemployment rate: 3.5%
Stevens Point, Wisconsin, located in the central part of the state, is within close proximity to a relatively high number of attractions for a city of its size. The city in particular has an above average concentration of fitness and recreation centers, hotels, bars, and restaurants.
Stevens Point is also one of the safer communities in the country, with a property crime rate well below the national figure and a violent crime rate less than half the national rate. The relatively safe streets may be one reason so many residents choose to walk to work. Nationally, 2.7% of commuters walk to their places of employment, but in Stevens Point, 14% walk to work.
[recirclink id=546683]

38. Andover, Kansas
> Population: 12,661
> 5 yr. population change: +8.0%
> Median household income: $85,655
> Five-year unemployment rate: 2.3%
Andover is the only Kansas city to rank among America’s 50 best places to live. It compares better than the majority of U.S. cities in a number of economic indicators. The city’s median annual household income of $85,655 is nearly $28,000 higher than the U.S. median. Andover residents are likely better qualified for high-income jobs because of their high educational attainment rate. More than 48% of residents over 25 have at least a bachelor’s degree.
Not only are incomes higher in Andover, but also a dollar goes farther in the city than on average nationwide. The cost of living is more than 10% lower than it is nationwide.
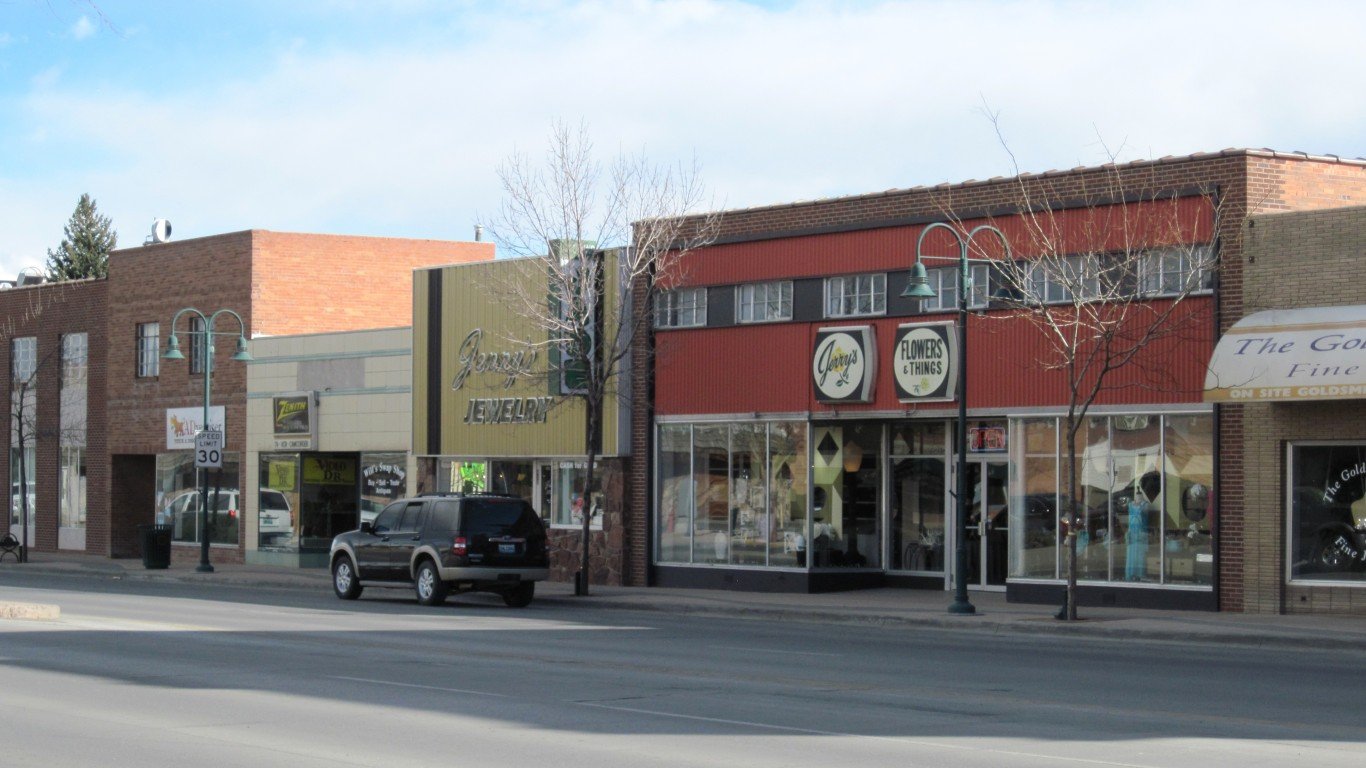
37. Riverton, Wyoming
> Population: 11,113
> 5 yr. population change: +4.4%
> Median household income: $51,102
> Five-year unemployment rate: 3.1%
Riverton, Wyoming, is one of America’s most affordable cities. Goods and services cost, on average, 13.5% less than they do on average nationwide. The city also has a strong job market with an unemployment rate below the national figure and total employment growth of 12.2% in the past five years, double the rate of nationwide growth in the same time period.
Riverton ranks as a good city to live in also because residents generally do not have to deal with long commutes as many Americans do. The average commute time for Riverton residents is less than 15 minutes, about half as long as the average American commute time.
[in-text-ad-2]
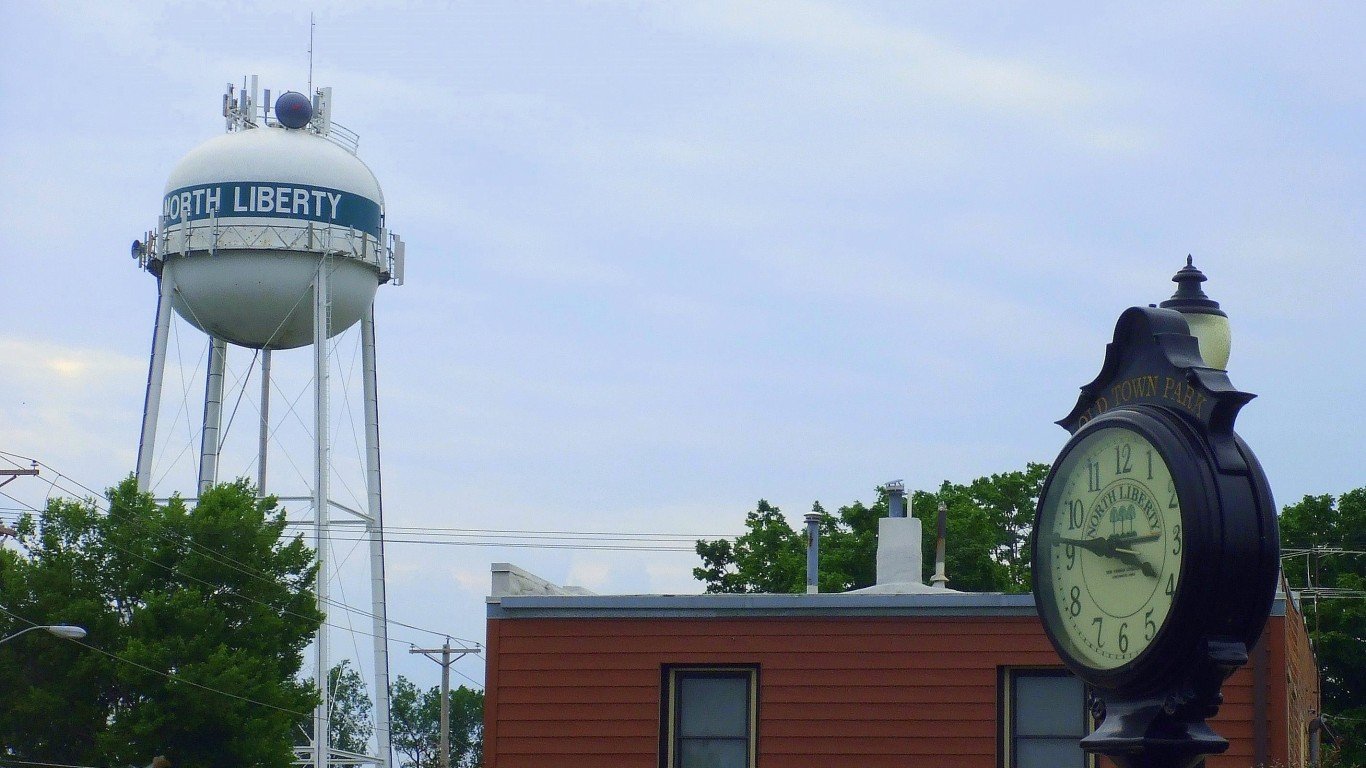
36. North Liberty, Iowa
> Population: 17,721
> 5 yr. population change: +32.9%
> Median household income: $80,426
> Five-year unemployment rate: 1.0%
North Liberty is a small city of about 17,700 people located just south of Cedar Rapids. Over half of all residents have a bachelor’s degree, well above the national degree attainment rate of 30.9%. The high share of adults with a college degree may be in part due to the city’s close proximity to the University of Iowa, which is just to the south of the city. People with a college education are much more likely to have higher incomes and lead healthier, longer lives.
Highly educated adults are more likely to have steady employment, and in North Liberty, virtually the entire workforce is employed. Over the past five years, the unemployment rate has averaged around 1%, compared to a national average unemployment rate of 4.1%.

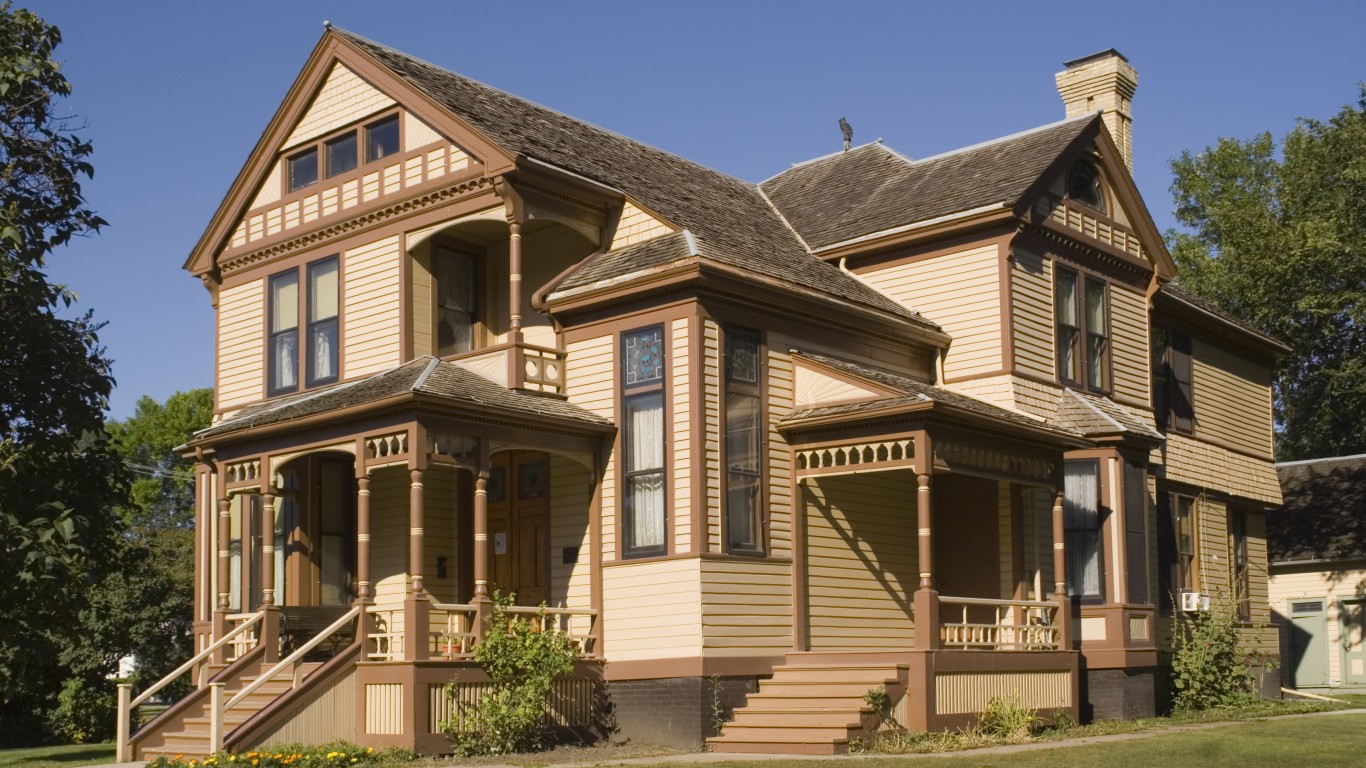
35. Aberdeen, South Dakota
> Population: 27,925
> 5 yr. population change: +6.7%
> Median household income: $47,506
> Five-year unemployment rate: 1.6%
Though the median annual household income in Aberdeen is around $10,000 lower than the U.S. median, goods and services in the town are relatively inexpensive, at around 15% less than average. Accounting for the cost of living, the typical Aberdeen household has roughly as much purchasing power as the median U.S. household.
Aberdeen workers are among the least likely to be out of a job. The city’s unemployment rate of just 1.6% is less than half the U.S. unemployment rate of 4.1%.
[in-text-ad]

34. Sartell, Minnesota
> Population: 16,749
> 5 yr. population change: +7.7%
> Median household income: $74,391
> Five-year unemployment rate: 2.0%
Sartell is a small city of about 17,000 in the St. Cloud, Minnesota, metro area. Sartell is a safe city. There were just 115 violent crimes for every 100,000 people in the city in 2017, less than a third of the national violent crime rate of 383 per 100,000. A number of amenities — including 28 parks, two golf courses, and 48 miles of trail — also improve quality of life for city residents.
Like many of the best cities to live in, Sartell is growing rapidly. In the last five years, the number of people living in the central Minnesota city increased by 7.7%, more than double the national population growth rate over the same period.
[recirclink id=555564]

33. Mammoth Lakes, California
> Population: 8,092
> 5 yr. population change: -1.1%
> Median household income: $62,308
> Five-year unemployment rate: 0.7%
Mammoth Lakes is a small town located in east-central California. Nearly everyone in the town who wants a job can find one as the unemployment rate is a staggeringly low 0.7%. Jobs in the area tend to be relatively well paying, too, as the typical area household earns $62,308 a year, about $5,000 more than the typical American household.
Getting around town is relatively easy, considering that the majority of commuters either walk, bike, or take public transit to work. Additionally, the average commute time for workers in the area is just 12 minutes, less than half the 26 minute average nationwide.

32. Kirkland, Washington
> Population: 86,772
> 5 yr. population change: +76.8%
> Median household income: $104,319
> Five-year unemployment rate: 3.3%
Kirkland is a relatively wealthy city in the Seattle metro area. The typical Kirkland household earns $104,319 a year, well above the $57,652 median income nationwide. Additionally, Kirkland’s poverty rate of 6.5% is less than half the national poverty rate of 14.6%.
Kirkland appears to have a reliable and effective public transit system as over 9% of workers commute using public transit, nearly double the 5.1% national share. The area is also safe. There were just 84 violent crimes reported for every 100,000 city residents in 2017, a fraction of the 383 per 100,000 national violent crime rate. Kirkland also has a higher than typical concentration of restaurants, fitness and recreation centers, and parks.
[in-text-ad-2]
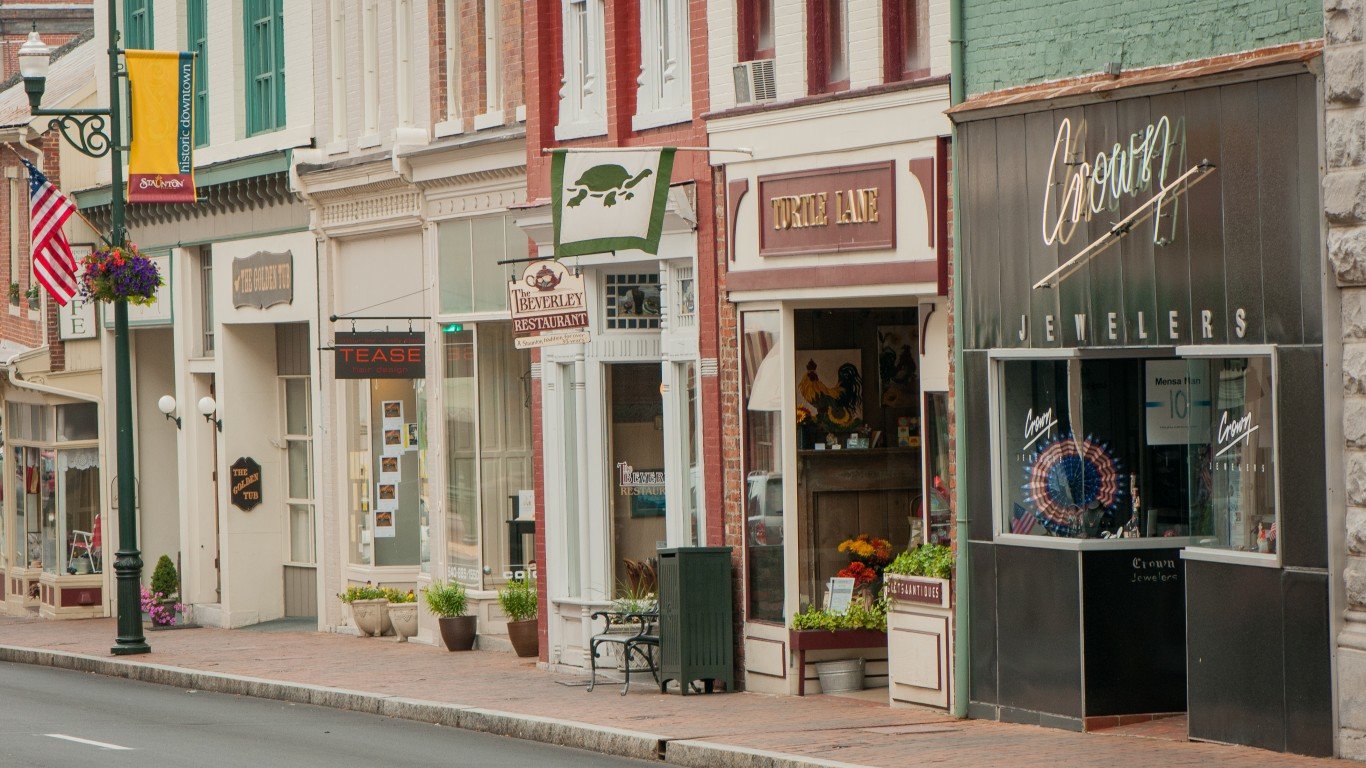
31. Staunton, Virginia
> Population: 24,273
> 5 yr. population change: +1.5%
> Median household income: $46,435
> Five-year unemployment rate: 2.4%
Staunton, located in the northern part of the state, near the West Virginia border, ranks as the best city to live in Virginia and one of the best places to live in the country. The city has a below average poverty rate and an extremely low food insecurity among area families. Over the past five years, the unemployment rate has been about half the national unemployment figure.
The city also has a relatively high concentration of regional attractions nearby for a city of its size, including restaurants, theater companies, and museums.
30. Williston, North Dakota
> Population: 25,072
> 5 yr. population change: +61.2%
> Median household income: $91,359
> Five-year unemployment rate: 1.6%
Willison, North Dakota, is one of the fastest growing cities in the country. Over the last five years, the city’s population climbed by a staggering 61.2%. Fueled largely by natural gas drilling in the Bakken formation, the city also has a strong job market. Just 1.6% of the area’s labor force is unemployed, well below the comparable 4.1% national unemployment rate. Jobs in Williston also tend to be high paying as the typical area household earns over $91,000 a year, nearly $34,000 more than the typical American household.
Area residents also benefit from a greater concentration of bars, restaurants, recreation centers, golf courses, and movie theaters than typical.
[in-text-ad]

29. Lititz, Pennsylvania
> Population: 9,269
> 5 yr. population change: -1.0%
> Median household income: $58,375
> Five-year unemployment rate: 2.5%
Lititz is a small town of less than 10,000 in Lancaster County, Pennsylvania. Surrounded by farmland, Lititz has a farmer’s market every Thursday evening from the spring through the fall. Residents also benefit from far greater than typical concentration of bars and restaurants.
Supported by a strong job market, city residents tend to be relatively financially secure. Fewer than 5% of area residents live below the poverty line, about one-third the 14.6% national poverty rate. The unemployment rate in the town is just 2.5%, well below the 4.1% national rate.
[recirclink id=531551]

28. Solana Beach, California
> Population: 13,362
> 5 yr. population change: +3.3%
> Median household income: $103,864
> Five-year unemployment rate: 2.4%
Solana Beach is a small coastal city in southern California. It is a wealthy area, with the typical Solana Beach household earns over $100,000 a year. Solana Beach is also safe. There were just 96 violent crimes for every 100,000 city residents in 2017, a fraction of the 383 per 100,000 national violent crime rate.
As is the case in many communities on this list, city residents have easy access to jobs and cultural and entertainment attractions in a major metropolitan area. Solana Beach is just a 30 minute drive from downtown San Diego.

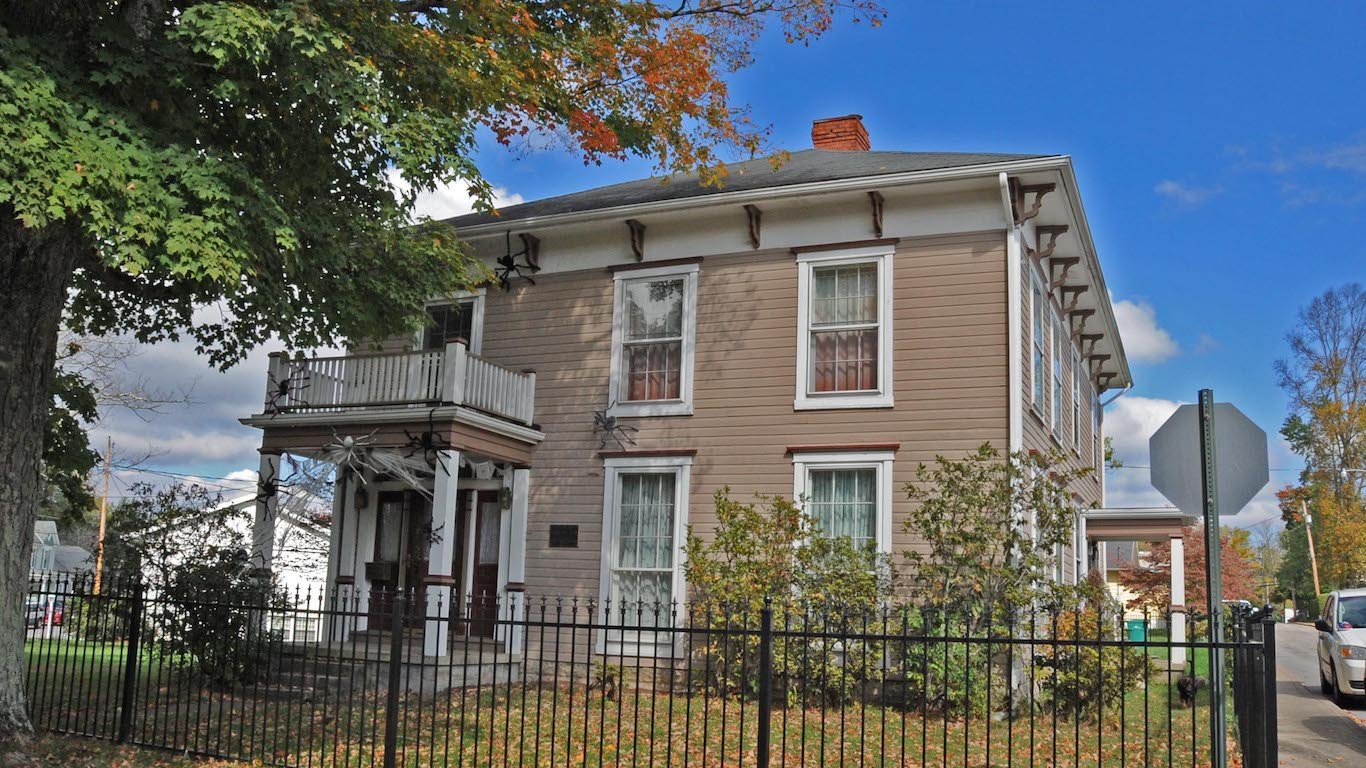
27. St. Marys, Ohio
> Population: 8,143
> 5 yr. population change: -1.2%
> Median household income: $48,661
> Five-year unemployment rate: 2.0%
St. Marys is a historic Ohio city that boasts newly renovated walkways along the Erie and Miami Canal in addition to several parks. It is one of several Ohio cities to rank on this list. As in other high ranking Ohio cities, city residents benefit from a low cost of living. Goods and services in the area are about 8% less expensive than they are on average nationwide.
St. Marys is also a safe city. There were just 37 violent crimes for every 100,000 people in the city in 2017, a fraction of the 383 per 100,000 national violent crime rate.
[in-text-ad-2]
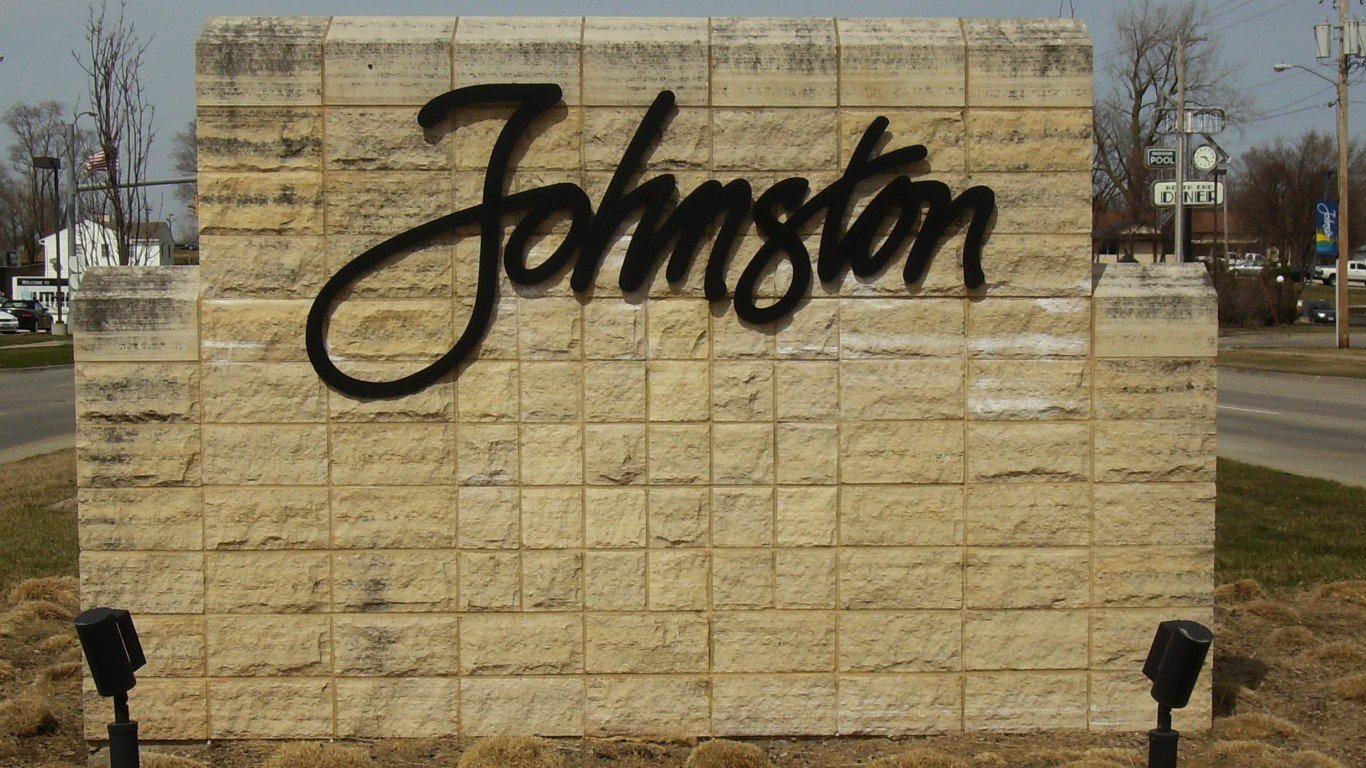
26. Johnston, Iowa
> Population: 20,172
> 5 yr. population change: +16.5%
> Median household income: $94,539
> Five-year unemployment rate: 2.8%
Johnston is a small city about 10 miles north of downtown Des Moines. The city boasts a high concentration of attractions like bars, movie theatres, and golf courses, and it has a farmers market every Tuesday afternoon from spring through the fall. Johnston is a safe city with a violent crime rate of 147 incidents per 100,000 people, less than half the 383 per 100,000 national violent crime rate.
Like many cities on this list, Johnston is growing rapidly. In the last five years, the number of people living in the city increased by 16.5%, more than quadruple the 3.8% national population growth over the same period.
25. Brandon, South Dakota
> Population: 9,731
> 5 yr. population change: +10.0%
> Median household income: $80,727
> Five-year unemployment rate: 1.8%
Brandon, South Dakota, is a small city of less than 10,000 located about 10 miles northeast of downtown Sioux Falls. Not only are incomes high in the area, but also Brandon residents benefit from a low cost of living. The typical area household earns $80,727 a year, about $23,000 more than the national median, and goods and services in the city are about 12% less expensive on average than they are nationwide.
The relatively higher than typical median income is partially because nearly anyone who wants a job in the city can get one. According to the U.S. Census Bureau, the city’s unemployment rate stands at just 1.8%, less than half the comparable 4.1% national rate.
[in-text-ad]
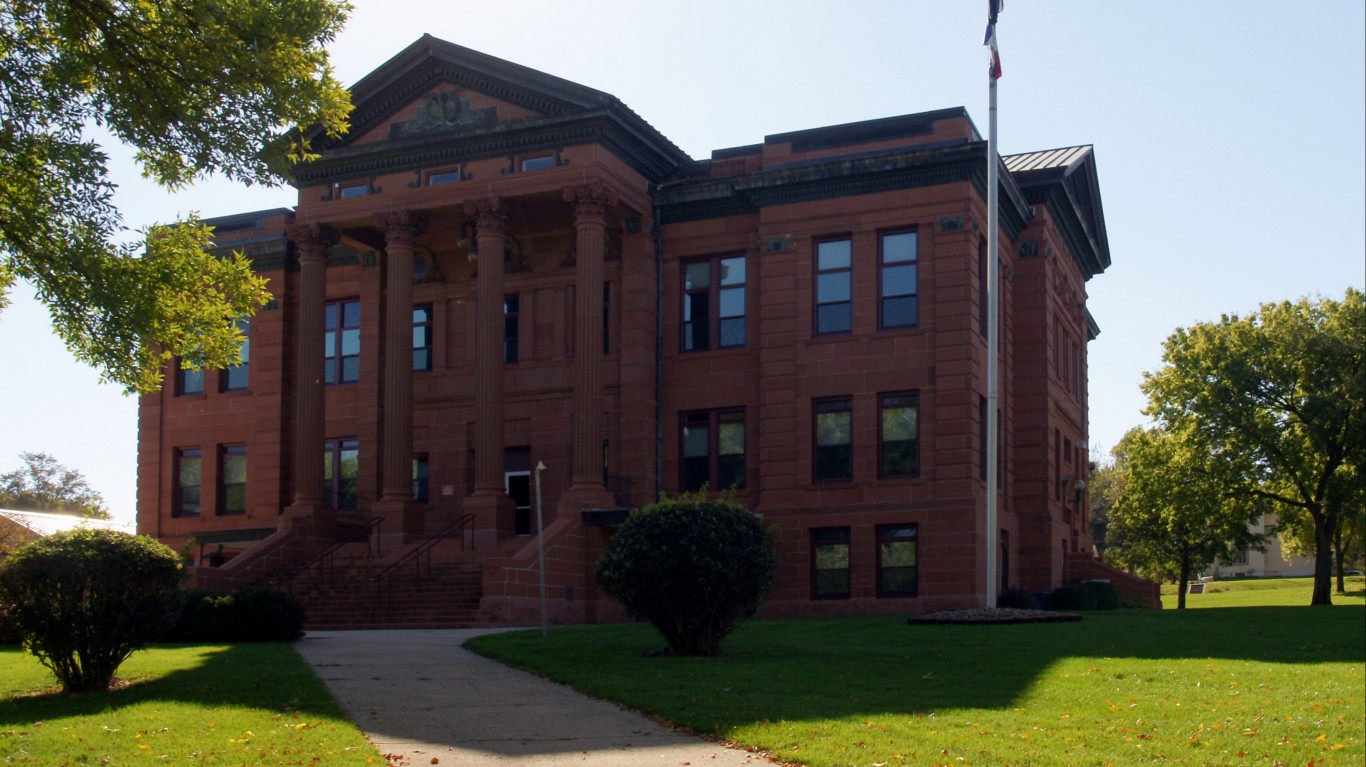
24. Carroll, Iowa
> Population: 9,937
> 5 yr. population change: -1.2%
> Median household income: $44,561
> Five-year unemployment rate: 1.5%
Carroll, Iowa, is one of the least expensive parts of the country. Goods and services in the area are about 16% less expensive than they are nationwide, on average. The city is also relatively safe. There were just 20 violent crimes for every 100,000 people in 2017, a fraction of the 383 per 100,000 national violent crime rate.
Carroll residents have plenty of local amenities to take advantage of. The city boasts an 18-hole municipal golf course, a park with tennis, basketball, and volleyball courts, an aquatic center open to the public, a skate park, and a recreational trial connecting two state parks.
[recirclink id=544777]
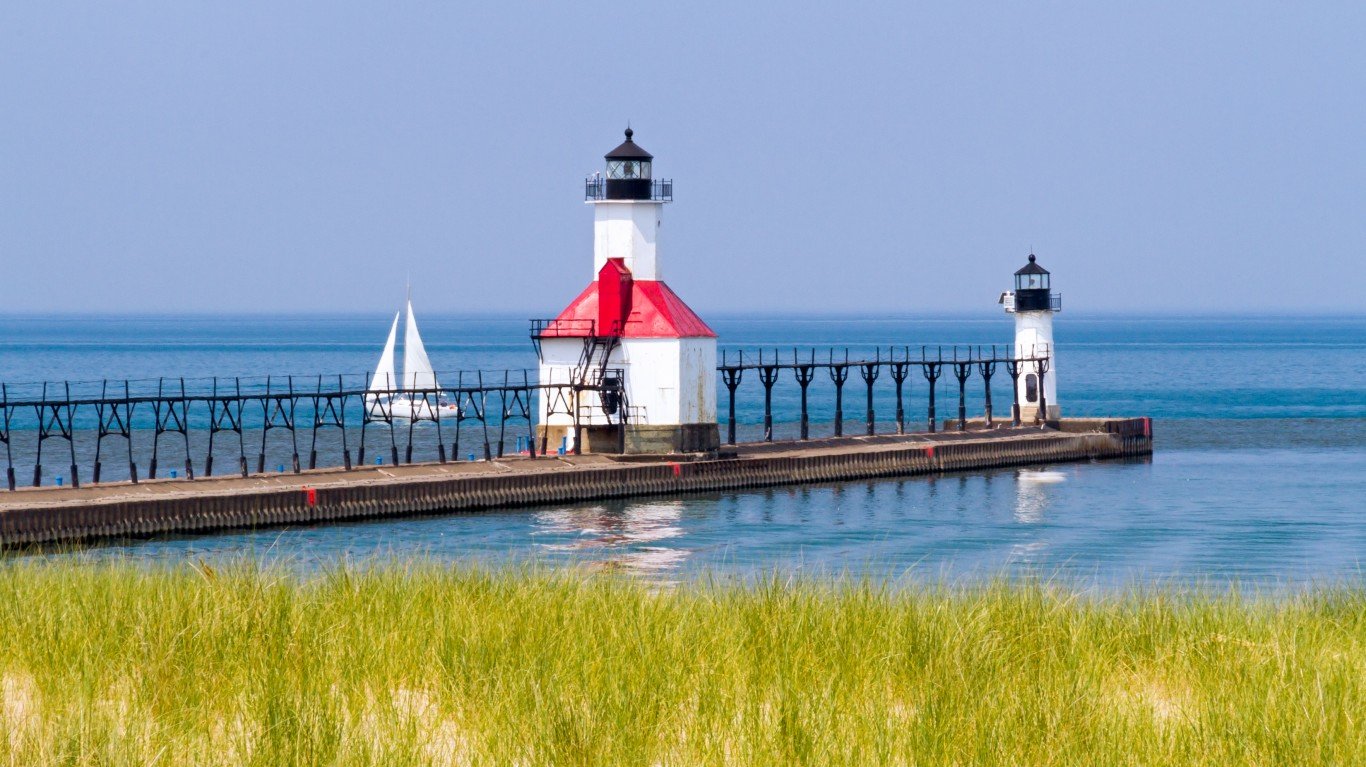
23. St. Joseph, Michigan
> Population: 8,301
> 5 yr. population change: -0.7%
> Median household income: $55,975
> Five-year unemployment rate: 2.6%
St. Joseph is a small city of just over 8,000 in southwestern Michigan along the shore of Lake Michigan. Area residents have access to a far greater than typical concentration of bars, restaurants, recreation centers, and museums. The area’s high quality of life is further supported by the relative scarcity of property and violent crimes and a healthy job market. Just 2.6% of the city’s labor force is out of a job, well below the 4.1% national unemployment rate.
For all it has to offer, St. Joseph is also affordable. The typical home in the city is worth about three times the median income. Nationwide, the median home value is 3.4 times greater than the annual median household income.
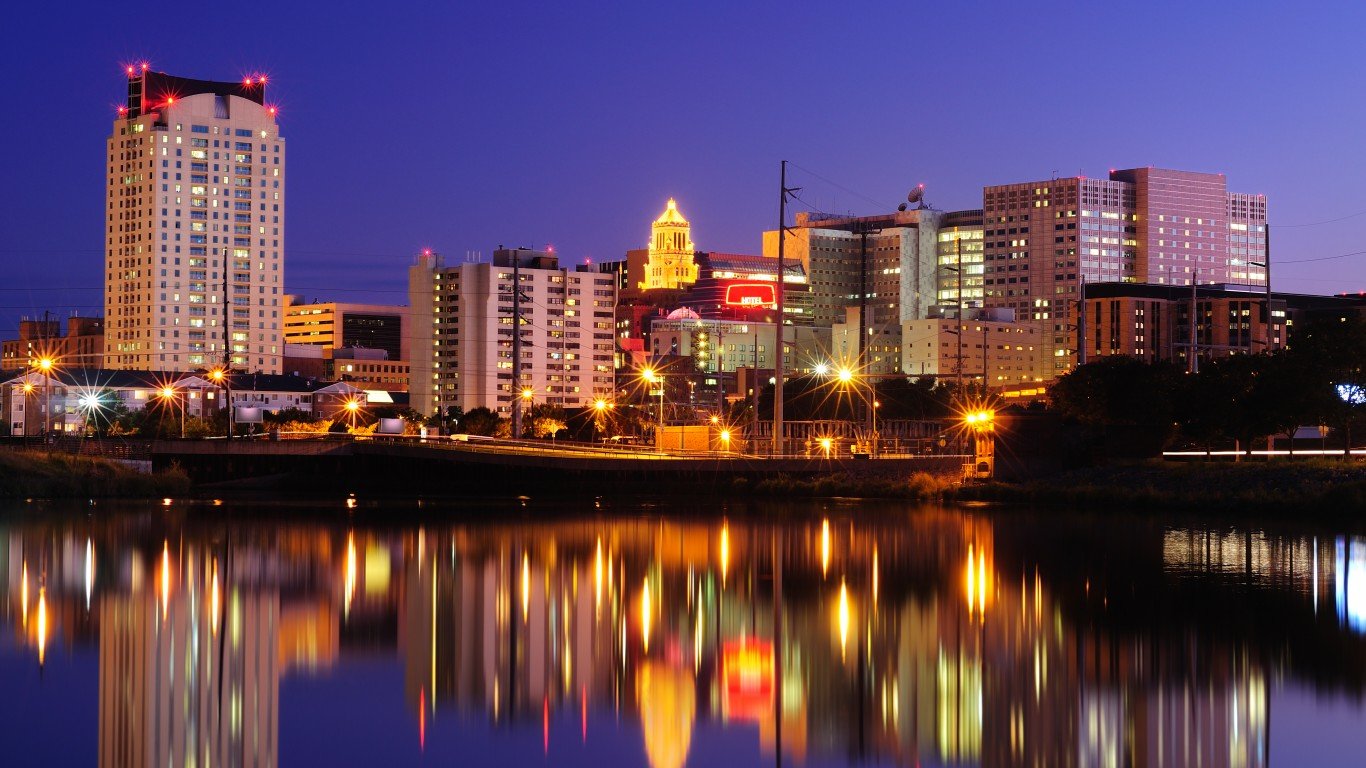
22. Rochester, Minnesota
> Population: 112,683
> 5 yr. population change: +5.4%
> Median household income: $68,574
> Five-year unemployment rate: 3.5%
Following a 5.4% five-year population growth, Rochester, Minnesota, is home to nearly 113,000 people — the largest city on this list. The city covers about 54 square miles and boasts 3,500 acres of park land and over 85 miles of paved trails.
Rochester is also a safe city. There were just 194 reported violent crimes in the city for every 100,000 people in 2017, roughly half the 383 per 100,000 national violent crime rate.
[in-text-ad-2]
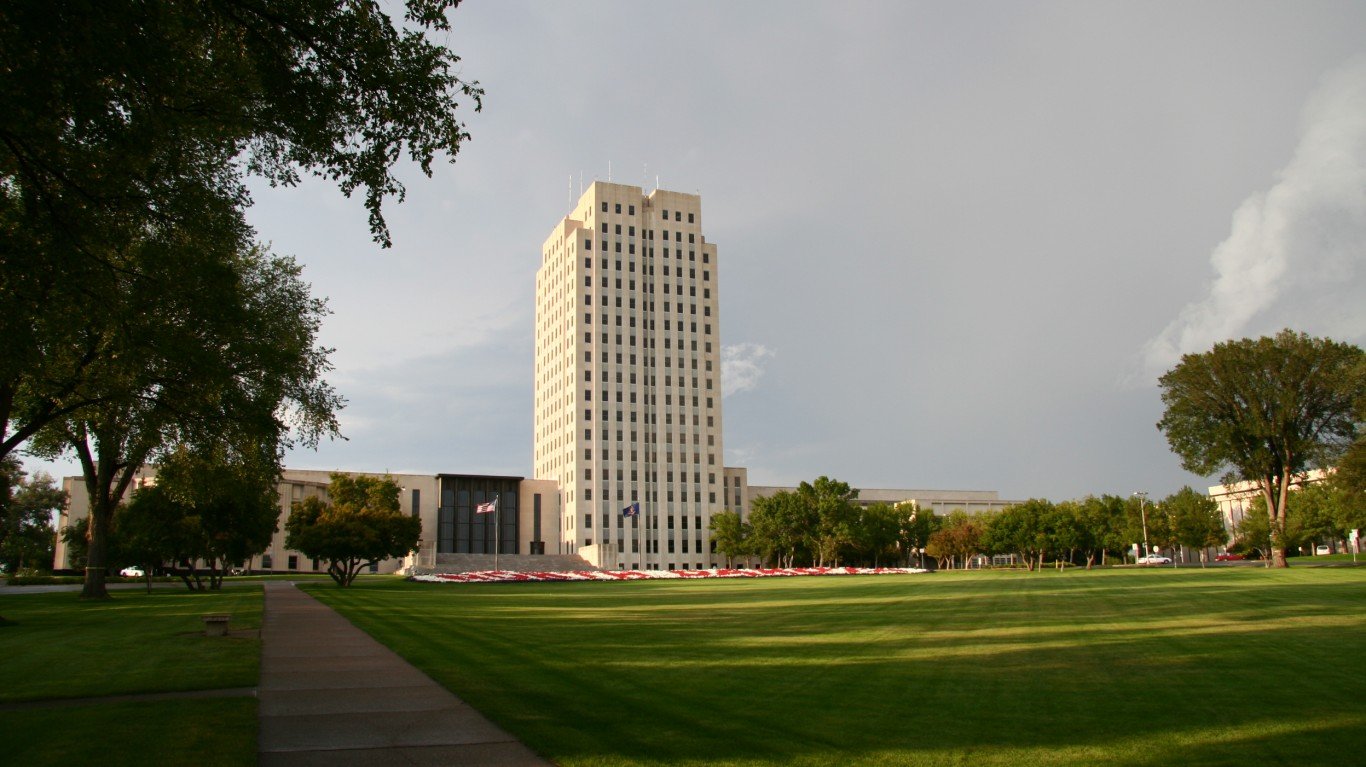
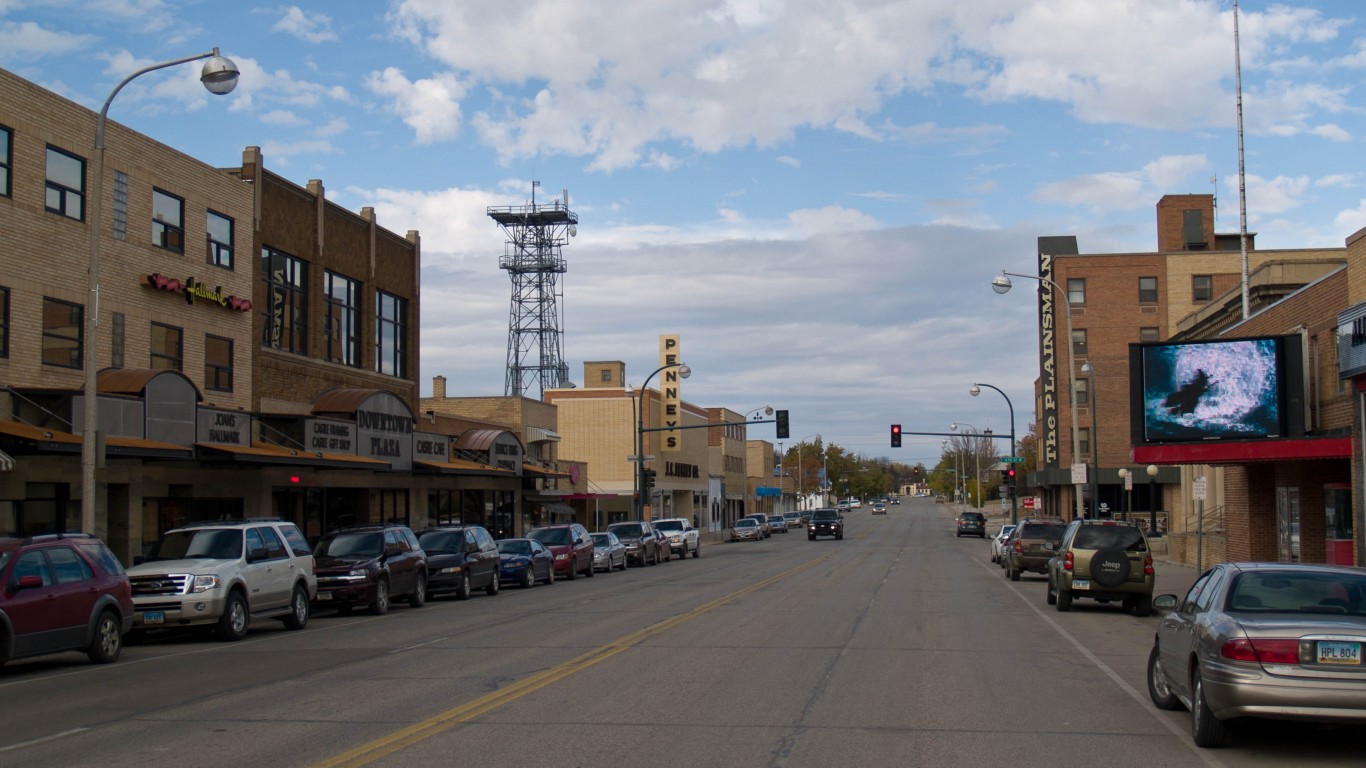
21. Bismarck, North Dakota
> Population: 70,536
> 5 yr. population change: +13.9%
> Median household income: $61,477
> Five-year unemployment rate: 1.2%
Over the last five years, people have poured into North Dakota’s capital city of Bismarck. The population grew by 13.9%, compared to a 3.8% nationwide population growth during the same period. People commonly move to find work, and Bismarck’s population influx is no exception.
Likely fueled in part by North Dakota’s oil boom, the number of people employed in the city grew by 12.9% in the last half decade, more than double the U.S. employment growth rate. Bismarck’s workers tend to be well compensated, as the city has a median household income of $61,477. Further, goods and services are also relatively inexpensive in the area, costing nearly 13% less than the average nationwide.
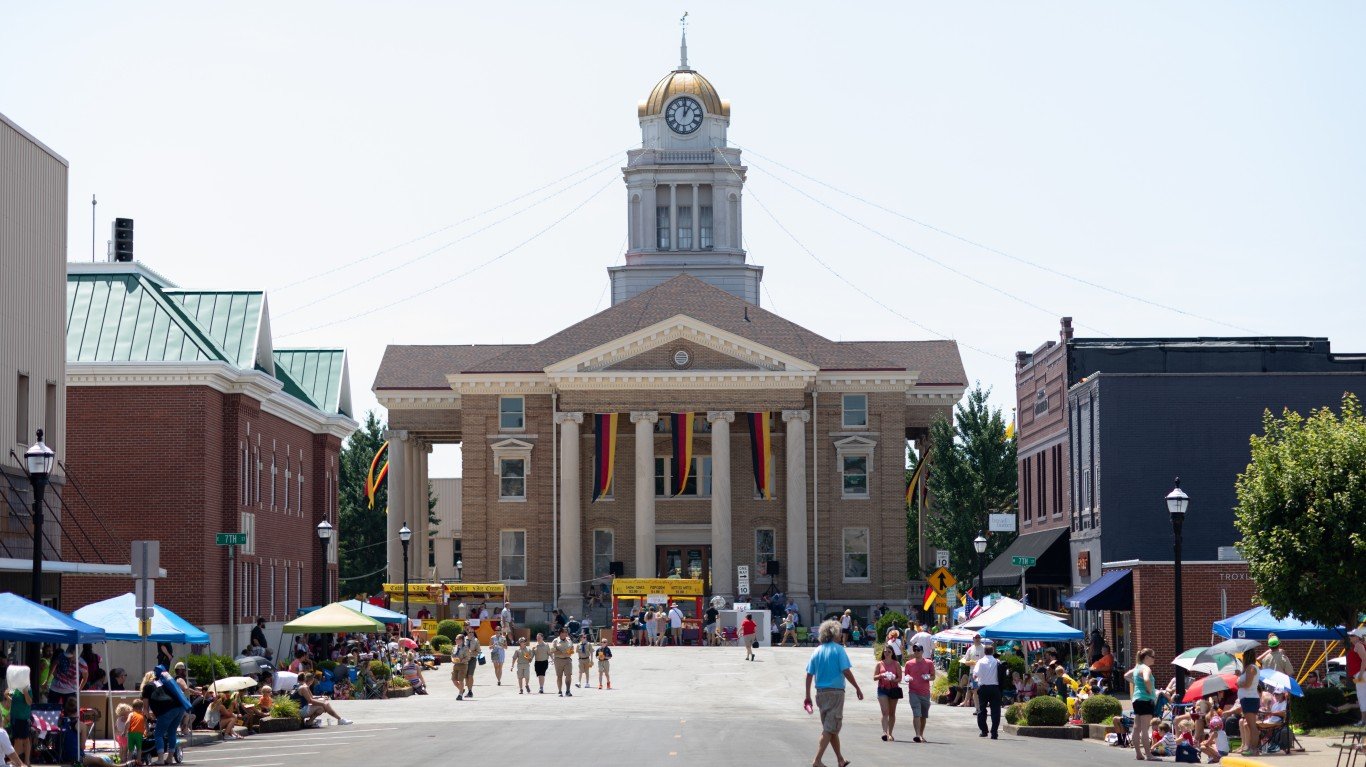
20. Jasper, Indiana
> Population: 15,716
> 5 yr. population change: +4.9%
> Median household income: $55,878
> Five-year unemployment rate: 2.6%
Jasper is one of the most affordable places to live in the nation. The cost of goods and services is just 83.6% of the average cost nationwide. The low cost of living gives residents a relatively high amount of purchasing power, even though the median household income in Jasper of $55,878 is lower than the U.S. median.
Jasper residents are much less likely to struggle with money than the average American. Nationwide, 14.6% of U.S. residents live in poverty. In Jasper, the poverty rate is 11.0%.
[in-text-ad]

19. New Albany, Ohio
> Population: 10,253
> 5 yr. population change: +28.2%
> Median household income: $187,200
> Five-year unemployment rate: 3.0%
New Albany, Ohio, is one of the most affluent cities in the country. The median annual household income of $187,200 is one of the five highest of U.S. cities. Wealthier areas tend to have a number of advantages over low-income cities, including lower crime rates. There were less than 37 violent crimes reported per 100,000 residents in New Albany, less than a 10th of the nationwide crime rate.
There are a number of factors that can draw people to certain towns, including jobs, schools, and amenities. New Albany ranks highly in many of these aspects, and its population growth rate reflects that. The town’s population grew by more than 28% over the past five years, compared to the national growth rate of just 3.8%.
[recirclink id=546683]
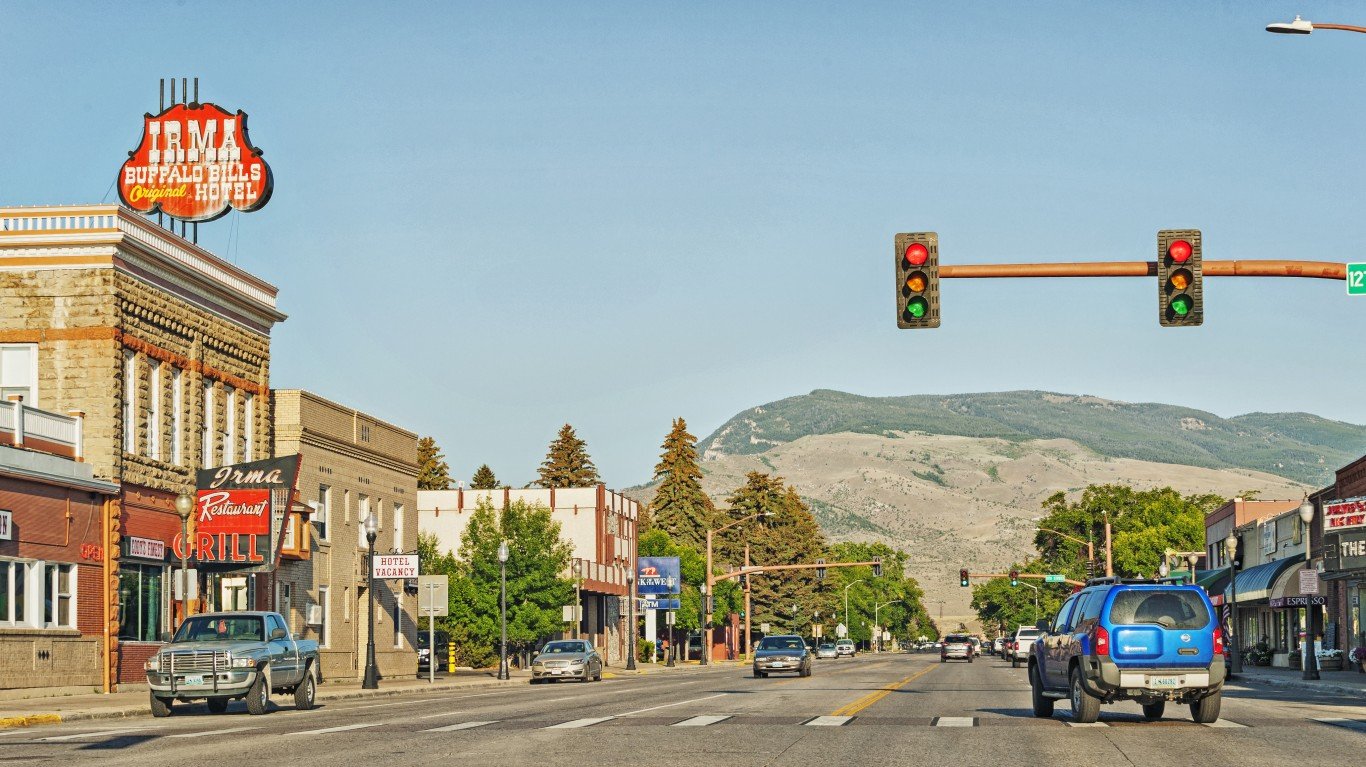
18. Cody, Wyoming
> Population: 9,826
> 5 yr. population change: +3.1%
> Median household income: $56,356
> Five-year unemployment rate: 1.0%
Cody is one of two Wyoming cities to rank among the best places to live in America, and its residents are among the least likely to face serious financial hardship. The city’s poverty rate of just 7.7% is well below the U.S. poverty rate of 14.6%.
One of the driving factors behind the low poverty rate is the city’s low unemployment rate. Just 1.0% of Cody’s labor force is unemployed, less than a quarter of the national unemployment rate.
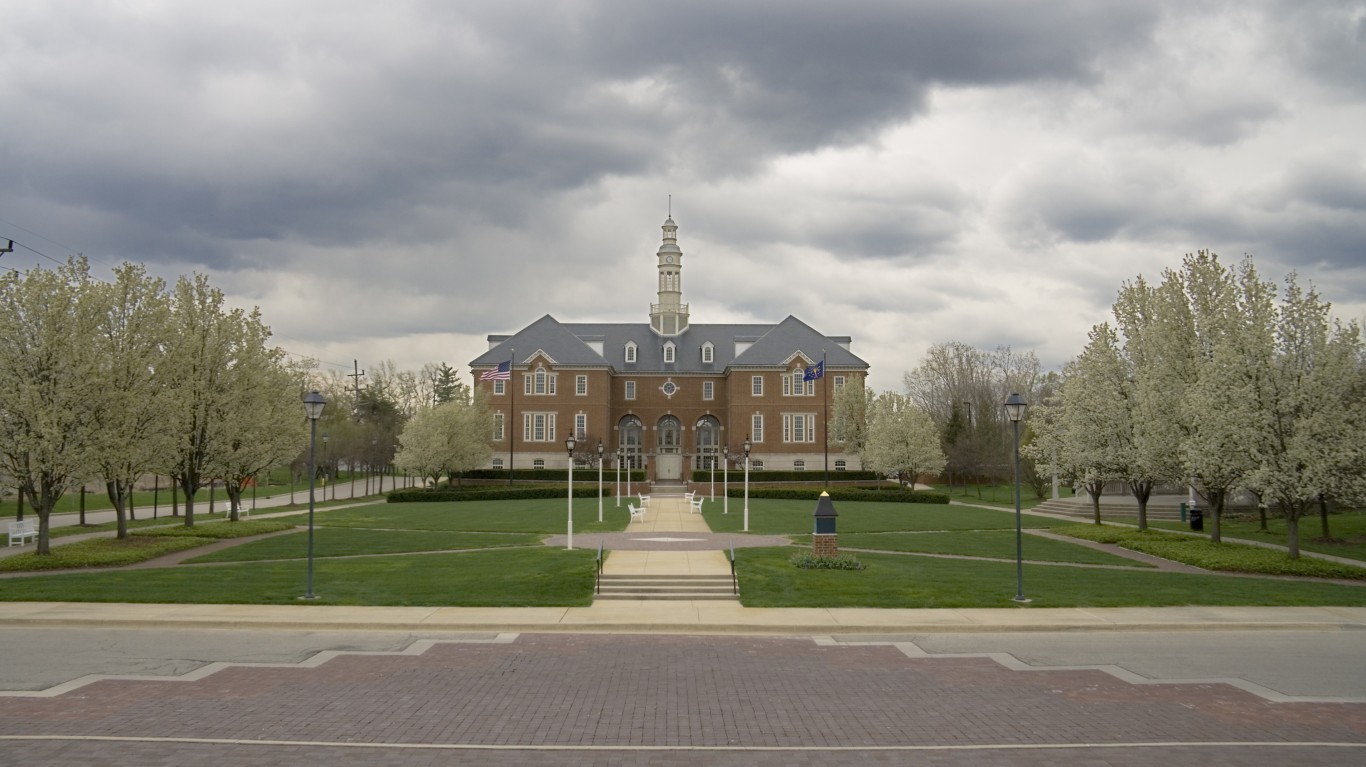
17. Carmel, Indiana
> Population: 88,595
> 5 yr. population change: +10.7%
> Median household income: $109,201
> Five-year unemployment rate: 2.1%
People with a college degree tend to have higher incomes and better health outcomes than those without a degree. In Carmel, Indiana, 71.0% of adults 25 and older have a bachelor’s degree. Nationwide, the college degree attainment rate is 30.9%.
With such a high educational attainment rate, Carmel adults are more likely to be qualified for high-income jobs. This is likely why the city has a six-figure median household income, one of the highest in the country. Carmel also has a 3.7% poverty rate, a fraction of the 14.6% U.S. rate.
[in-text-ad-2]
16. Bridgeport, West Virginia
> Population: 8,382
> 5 yr. population change: +2.5%
> Median household income: $82,359
> Five-year unemployment rate: 2.4%
In Bridgeport, 50.5% of adults 25 and older have graduated from college, compared to 30.9% of American adults in that age group. The high college attainment rate has likely contributed to the town’s relatively high median household income of $82,359 a year. Not only is Bridgeport wealthy, but it is also inexpensive. Goods and services are about 15% less expensive than they are nationwide, on average.
When it comes to culture and entertainment, Bridgeport residents have options. The city is home to a far higher concentration of restaurants, bars, recreation centers, golf courses, and movie theatres than is typical nationwide.
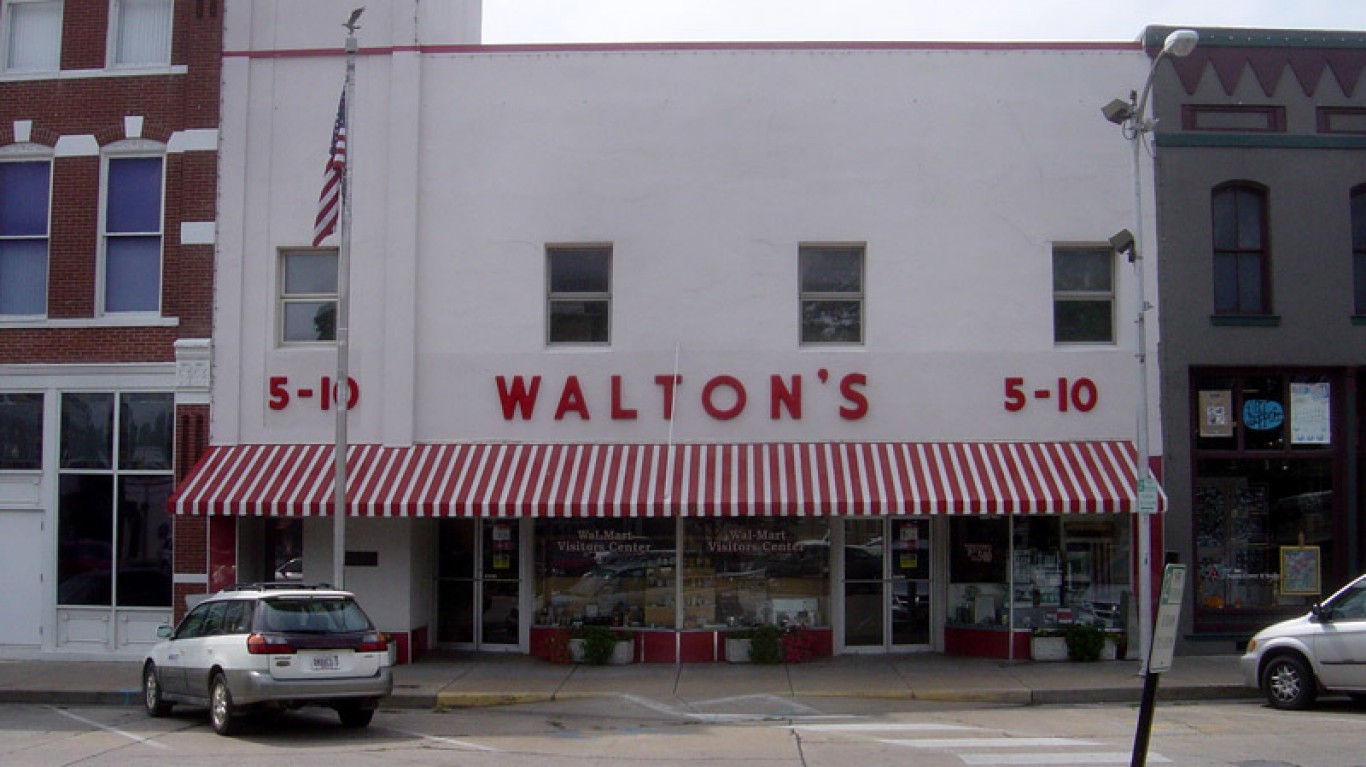
15. Bentonville, Arkansas
> Population: 44,601
> 5 yr. population change: +25.2%
> Median household income: $79,259
> Five-year unemployment rate: 1.7%
Bentonville, Arkansas, is perhaps best known as the home of Walmart, America’s largest private employer. The massive retail chain provides close to 22,000 jobs in Bentonville, both in its stores and at the corporate level, and is likely part of the reason the city’s unemployment rate is so low, at 1.7%.
Bentonville’s job market has improved dramatically over the last five years. The total number of people with jobs in the city increased by 31.0% from 2012 to 2017 — more than five times the employment growth rate in the U.S. as a whole.
[in-text-ad]
14. Moorhead, Minnesota
> Population: 41,801
> 5 yr. population change: +9.7%
> Median household income: $56,516
> Five-year unemployment rate: 2.2%
The population of Moorhead, a city immediately to the east of Fargo, has increased by nearly 10% in the past five years, roughly three times the national population growth over the same period.
A growing population is often a sign of a healthy economy, and Moorhead’s five-year average unemployment rate of 2.2% is about half the national unemployment rate over the same period. Employment in the city has increased by about 10% over that period, compared to a national employment growth of 6.1%.
[recirclink id=555564]

13. Winnetka, Illinois
> Population: 12,504
> 5 yr. population change: +2.4%
> Median household income: $216,875
> Five-year unemployment rate: 1.3%
Winnetka is a small village that sits on the shores of Lake Michigan about 15 miles north of downtown Chicago. One of the wealthiest cities in the country, the typical Winnetka household earns $216,875 a year. Winnetka residents working in Chicago have options when it comes to transit, and over one-quarter of commuters use public transportation — an alternative most Americans do not have.
Winnetka boasts several beaches, a boat launch, parks, a tennis center, a golf course, and an ice rink, all open to the public.

12. Paradise Valley, Arizona
> Population: 13,961
> 5 yr. population change: +7.2%
> Median household income: $175,673
> Five-year unemployment rate: 1.4%
Most houses in Paradise Valley, Arizona, are worth over $1.4 million, more than seven times the U.S. median home value. Paradise Valley residents are able to afford such expensive houses because of their relatively high incomes. The typical household in the city earns $175,673 a year, one of the highest median household incomes in the country.
Paradise Valley lives up to its name as a popular destination to relax. The town is home to several resorts and a number of golf courses. Located just north of Phoenix and Scottsdale, it is also known for its high-end dining and nightlife.
[in-text-ad-2]

11. West Fargo, North Dakota
> Population: 33,089
> 5 yr. population change: +28.3%
> Median household income: $76,925
> Five-year unemployment rate: 1.2%
West Fargo, which borders North Dakota’s largest city of Fargo, provides residents with access to a wide range of jobs in the city, and many of them are high paying. The median annual household income in West Fargo is nearly $77,000, and after factoring in the area’s low cost of living, the median income is equivalent to over $88,000.
Like many other North Dakota cities, the number of jobs available to West Fargo residents is skyrocketing. From 2012 to 2017, the employed population grew by 23.5%, as compared to a 6.1% increase nationwide.
10. Le Mars, Iowa
> Population: 9,861
> 5 yr. population change: +1.0%
> Median household income: $58,063
> Five-year unemployment rate: 2.0%
Le Mars, Iowa, is among the most affordable cities in the United States. Goods and services in the city cost about 15% less on average than they do nationwide. So although the median household income that is slightly above the comparable U.S. median, Le Mars residents have more purchasing power than those in most other U.S. cities.
The city also has its share of attractions. Home to a Blue Bunny ice cream manufacturing plant, Le Mars churns out more ice cream from a single city than any other company, earning the nickname “The Ice Cream Capital of the World.”
[in-text-ad]

9. Whitefish Bay, Wisconsin
> Population: 14,099
> 5 yr. population change: +0.3%
> Median household income: $111,069
> Five-year unemployment rate: 1.5%
Whitefish Bay, a village close to Milwaukee along the shore of Lake Michigan, ranks as the best place to live in Wisconsin. The high quality of life in Whitefish Bay is partially the result of a strong job market. The area’s average unemployment rate over the last five years is just 1.5% — less than half the comparable nationwide rate of 4.1%.
Whitefish Bay is also one of the safest communities in the country, with a violent crime rate of just 36 incidents per 100,000 people. For reference, there were 383 violent crimes per 100,000 people nationwide in 2017.
[recirclink id=531551]
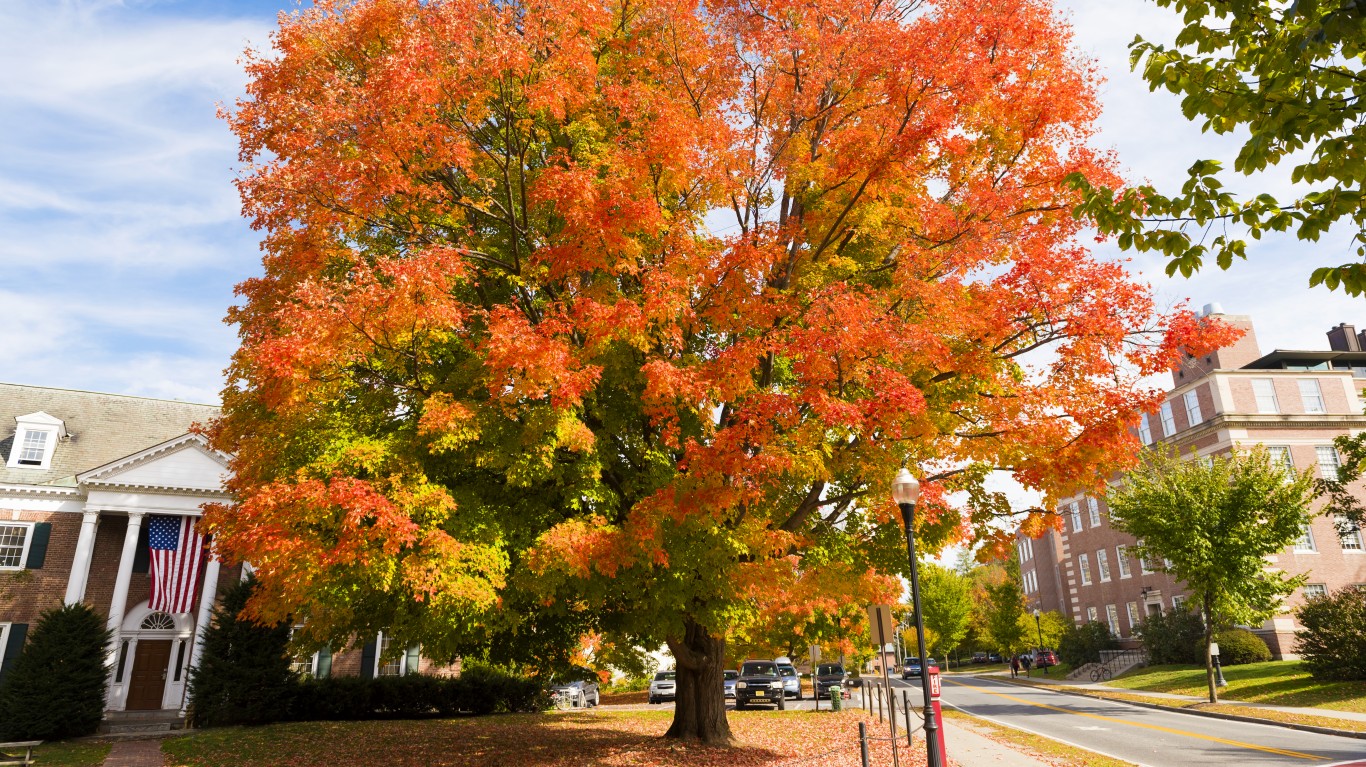
8. Hanover, New Hampshire
> Population: 8,495
> 5 yr. population change: -1.3%
> Median household income: $97,422
> Five-year unemployment rate: 1.2%
Hanover has numerous advantages over other places in New Hampshire and the country as a whole. Its median household income of $97,422 is nearly $40,000 higher than the U.S. median. Hanover is also the best educated place in the country as 81.7% of adults hold at least a bachelor’s degree.
With a population of 8,495, Hanover is a smaller city. As such, many residents are able to walk to and from work. Walking not only provides numerous health benefits, but it also helps decrease road traffic and reduce pollution. Nearly 38% of Hanover residents commute by walking — one of the highest shares among U.S. cities.
7. Ladue, Missouri
> Population: 8,591
> 5 yr. population change: +0.8%
> Median household income: $203,250
> Five-year unemployment rate: 0.7%
One of the wealthiest cities in Missouri, Ladue’s median household income of $203,250 a year is almost quadruple the national median income of $57,652. Not only is Ladue a wealthy city, but it is also inexpensive. Goods and services are 11% cheaper on average in Ladue than they are typically nationwide.
With easy access to jobs in nearby St. Louis, Ladue residents who want a job generally have no trouble finding one. Over the last five years, unemployment stood at just 1.8% in the city, a fraction of the national rate of 4.1%. In addition to cultural attractions and entertainment venues in St. Louis, Ladue residents enjoy a greater than typical concentration of restaurants, fitness and recreation centers, and movie theaters within their own city limits.
[in-text-ad-2]
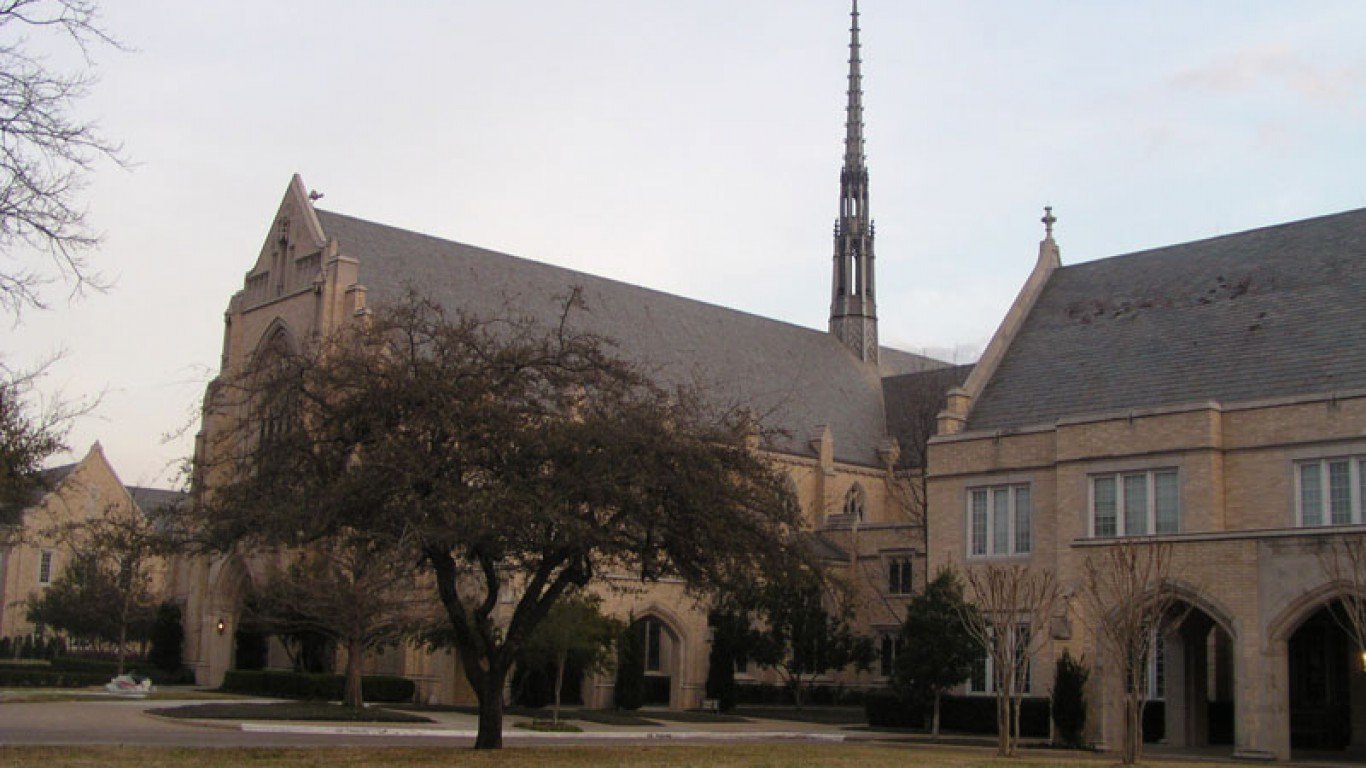
6. University Park, Texas
> Population: 24,692
> 5 yr. population change: +6.2%
> Median household income: $211,741
> Five-year unemployment rate: 1.8%
University Park is a college town — home to Southern Methodist University — in the Dallas-Fort Worth metro area. Nearly everyone in the city who wants a job can get one, as the city’s 1.8% unemployment rate is less than half the comparable 4.1% national rate. University Park is also a safe city with only 44 violent crimes reported for every 100,000 people in 2017, compared to the U.S. violent crime rate of 383 per 100,000.
Like many other American college towns, University Park boasts a wide range of amenities and cultural and entertainment options. There is a greater than typical concentration of restaurants, gyms, and movie theaters per capita in the city.
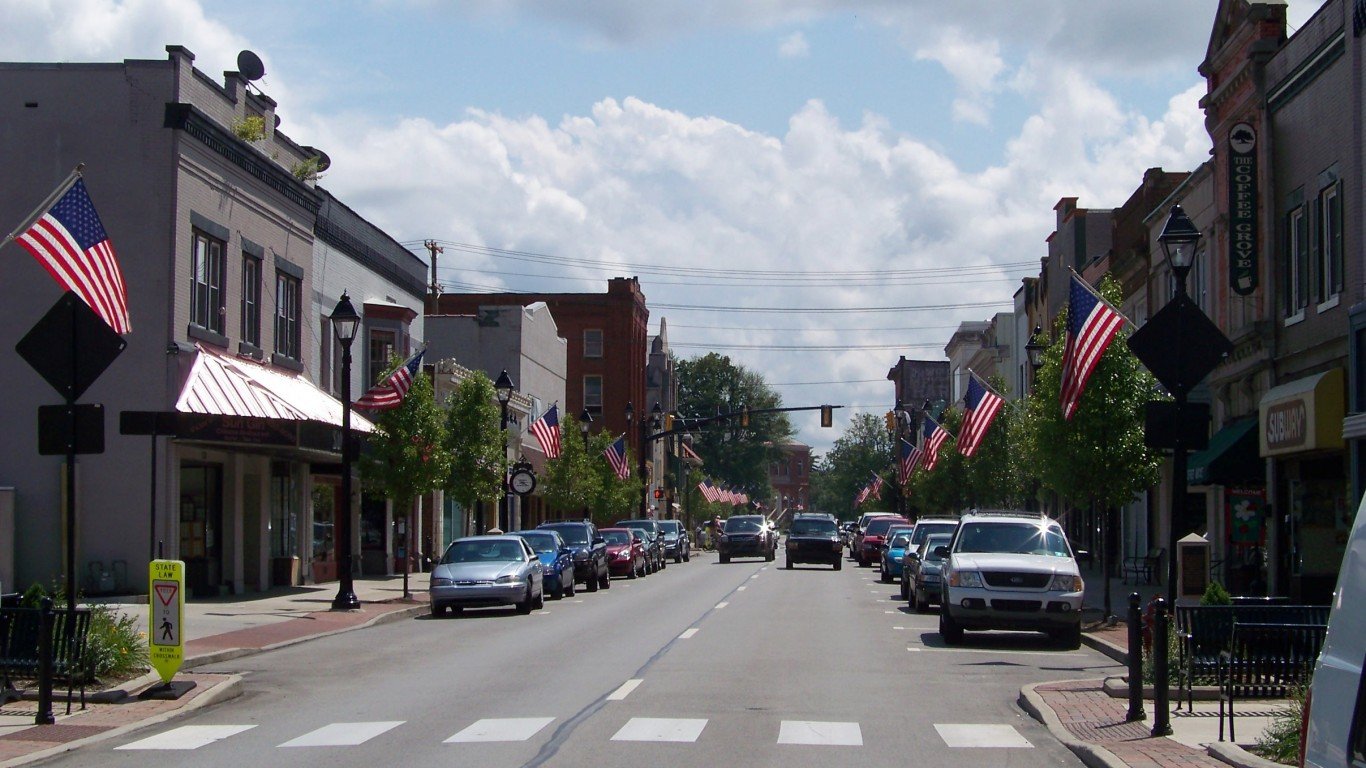
5. Grove City, Pennsylvania
> Population: 8,123
> 5 yr. population change: -1.9%
> Median household income: $46,792
> Five-year unemployment rate: 0.9%
Grove City, Pennsylvania, is a small borough of roughly 8,100 people in the western part of the state. The borough is one of the most affordable places to live in the country, with goods and services costing about 80% of average prices across the country. Unemployment in the borough is one of the lowest in the country, with a five-year average of 0.9%, compared to the national five-year unemployment rate of 4.1%.
[in-text-ad]

4. Montecito, California
> Population: 8,984
> 5 yr. population change: +5.2%
> Median household income: $146,250
> Five-year unemployment rate: 4.1%
Americans with a college degree tend to lead healthier lives, have higher incomes, and be more steadily employed than their peers with less education. In Montecito, 71.8% of adults have a bachelor’s degree, compared to 30.9% of adults nationwide. Montecito, an unincorporated community just east of Santa Barbara, has a median household income nearly triple the national figure and a poverty rate of 8.0%, which is just over half the national rate.
[recirclink id=544777]
3. Pella, Iowa
> Population: 10,243
> 5 yr. population change: -1.2%
> Median household income: $64,527
> Five-year unemployment rate: 2.4%
Pella which can be found southeast of Des Moines near Lake Red Rock, ranks as the best city to live in Iowa and one of the best in the country. The city has an annual violent crime rate of 186 incidents per 100,000 people, less than half the national violent crime rate of 383 incidents per 100,000 people. The property crime rate in Pella is also low.
The typical household income in Pella is about $6,800 higher than the national median household income, and the cost of living is quite low. Adjusting for the cost of living, the typical household in Pella earns about $20,000 more than the typical American household.

2. Beverly Hills, California
> Population: 34,506
> 5 yr. population change: +0.9%
> Median household income: $103,698
> Five-year unemployment rate: 3.5%
Beverly Hills is synonymous with glitz, glamour, and wealth. It has inspired movies, TV shows, and songs about what a great place it is, so it should come as no surprise the city ranks as the second best place to live in America. The Southern California city is wealthy and highly educated. More than 62% of residents 25 and older have at least a bachelor’s degree, and the median annual household income is over $103,000. Nationwide, about half of adults have a bachelor’s degree, and the median income is just over $57,000.
The economy of Beverly Hills caters to people with plenty of disposable income. The city has several times more movie theaters, museums, rec centers, hotels, and restaurants per capita than the typical American city.
[in-text-ad-2]
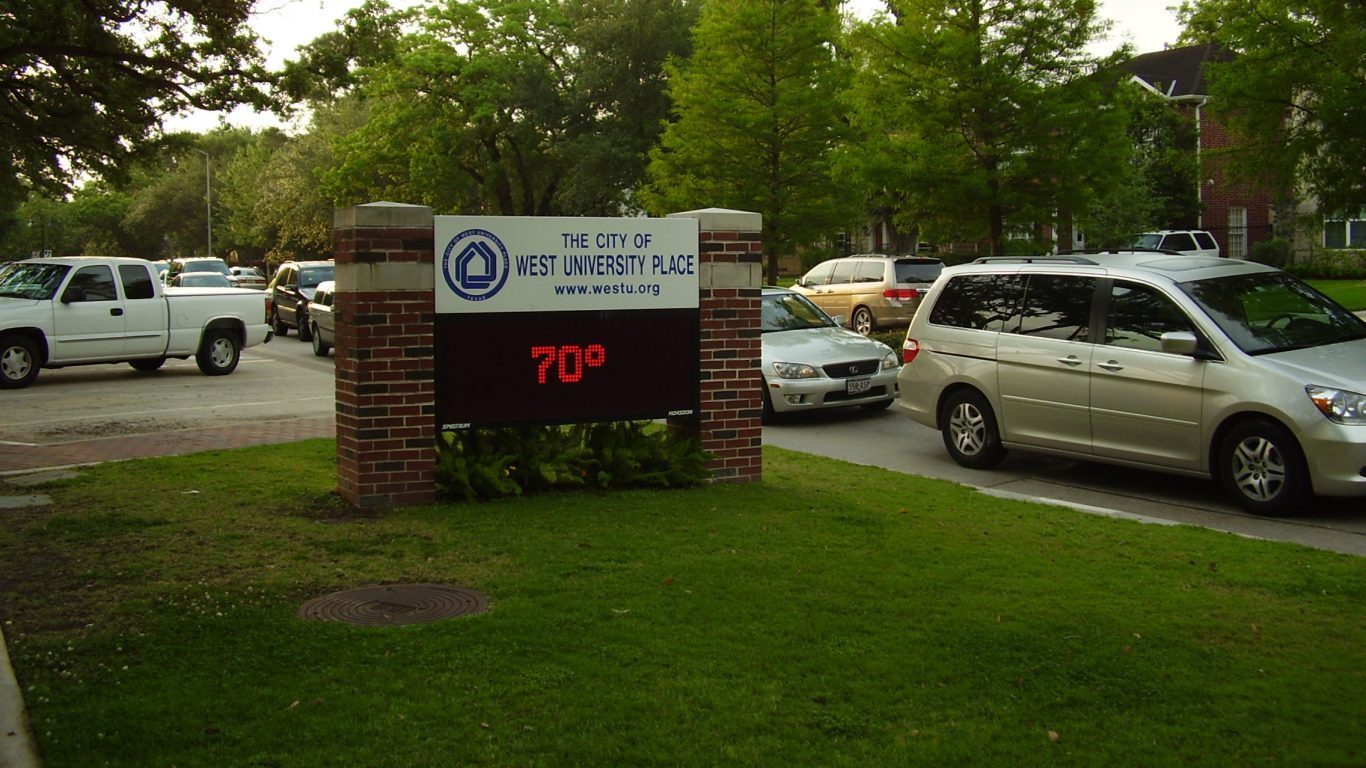
1. West University Place, Texas
> Population: 15,477
> 5 yr. population change: +4.1%
> Median household income: $243,226
> Five-year unemployment rate: 1.4%
A wealthy suburb of Houston, West University Place ranks as the best city to live in Texas and the United States. A wealthy city, the median household income of over $243,000 a year is over four times the national median. A dollar also goes far in the city as goods and services are about 5% less expensive than they are nationwide on average. In addition to entertainment and culture in nearby Houston, West University Place has a far greater concentration of restaurants, bars, fitness centers, museums and theatre companies than is typical nationwide.
West University is also a safe city with a strong job market. The city’s violent crime rate of 64 incidents for every 100,000 people is among the lowest in the nation, as is the five-year average unemployment rate of 2.7%.
Methodology
To identify the best cities to live in, 24/7 Wall St. created a weighted index of 25 measures that fall into one of four categories: affordability, economy, quality of life, and community.
In the affordability category, the ratio of the median home value to the median income was given full weight. More affordable cities were ranked higher. Cost of living, as determined by the average cost of goods and services in an area relative to average prices across the nation as a whole, was given a full weight. Property taxes are largely levied at the local level, and cities where residents pay more property taxes as a percentage of their home value were penalized. Property taxes were given a one-quarter weighting.
In the economy category, the unemployment rate was also given a full weight. We used five-year average unemployment due to lack of comparable annual data at local levels. Five-year employment growth and the share of the total working-age population with a job were each given a half weight, favoring areas with greater employment and growing job opportunities.
In the quality of life category, the poverty rate was given a full weight, penalizing cities where poverty is more common. The share of the population that struggles to put food on the table due to distance from a grocery store, known as the food insecurity rate, was given full weight. A city’s mortality rate, calculated as the number of people who died while in hospital care per hospital by city, was also given full weight. In cases where city-level data was not available, mortality rates were imputed from county level data.
The drug overdose mortality rate was given a one-quarter weighting, as was the hospital readmission rate, or the share of those released from the hospital who were readmitted within 30 days. Distance from the center of the city to the nearest hospital was given full weight.
The number of hospitalizations that would have been prevented by regularly-scheduled doctor visits for every 1,000 Medicare enrollees — known as the preventable hospitalization rate — was given half weighting.
Measures used in the community category included the average travel time to work, which was given full weight. The violent crime rate — the total number of rapes, robberies, murders, and aggravated assaults adjusted per 100,000 residents per year— was given full weight. So, too, was the property crime rate, which is the total number of burglaries, larcenies, motor vehicle thefts, and incidents of arson per 100,000 residents per year.
The share of commuters either walking, cycling, or taking public transit to work was given half weight. The total number of restaurants, bars, museums, theater companies, movie theaters, libraries, and parks per capita were each given a one-quarter weighting.
To avoid geographic clustering, we only took the top-ranking city in a given county. Our list includes cities, towns, villages, boroughs, and Census designated places. We did not include places with fewer than 8,000 residents in our analysis.
Median household income, median home value, average travel time to work, poverty rate, population, employment-to-population ratio, median property taxes paid, and average unemployment rate are all five-year estimates from the U.S. Census Bureau’s American Community Survey for the 2013-2017 period. Overall cost of living is for 2014 and comes from data analysis and aggregation company ATTOM Data Solutions.
The population-adjusted number of entertainment and cultural venues like restaurants and museums comes from the Census Bureau’s County Business Patterns data set, and is for 2016.
Violent and property crime rates are from the FBI’s 2017 Uniform Crime Report. Drug overdose mortality rates are from the Centers for Disease Control and Prevention and are for the years 2014 to 2016. Mortality rates and hospital readmission rates are from the Centers for Medicare and Medicaid Services and are as of June 2015. Preventable hospitalizations are from the latest release of County Health Rankings & Roadmaps, a Robert Wood Johnson Foundation and University of Wisconsin Population Health Institute joint program.
Contact [email protected] for any questions or corrections.