[cnxvideo id=”911420″ placement=”ros”]
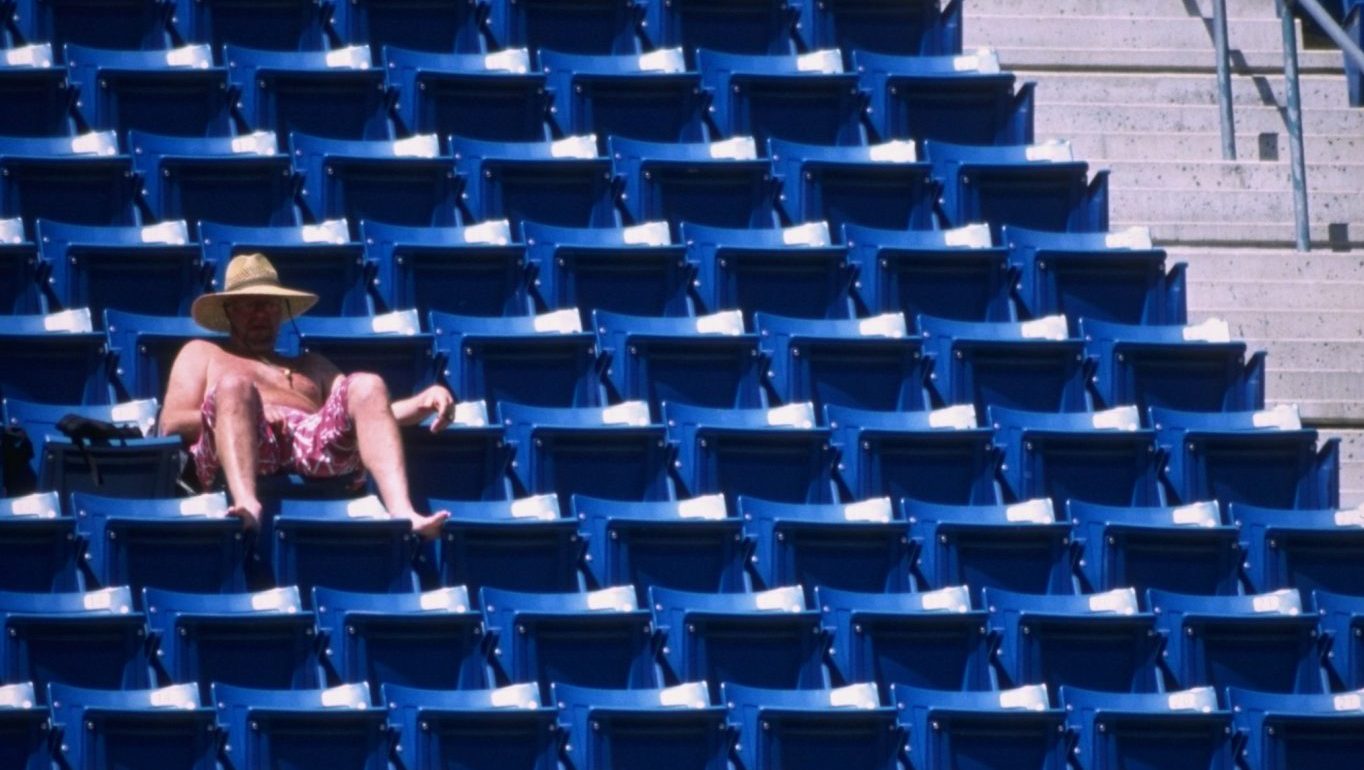
For sports fans, few things are as exciting as putting on your favorite jersey and going to a game in person to root for your favorite team. But going to a game is expensive, and it can be hard to convince fans to keep showing up if the team seems likely to lose.
Home game attendance is a good proxy for overall fan engagement. If a team has been bad for a long time, fans may stop buying tickets to their games and may even not bother to watch their games on TV. But if the team rebuilds and starts winning again, attendance is all but guaranteed to increase.
24/7 Wall St. reviewed ESPN data on the changes in average attendance between 2008 and 2018 at regular season home games for the NHL, NBA, MLB, and NFL to determine the teams adding the most fans.
Teams that have consistently competed for titles are generally not among the teams adding the most fans — they’ve never lost their fans. Supporters of the New England Patriots packed Gillette Stadium to capacity for each game in 2018, just as they did in 2008.
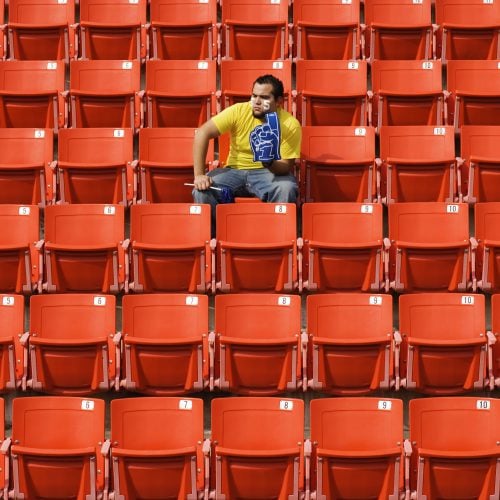
But few franchises can operate on a level of consistent success like the Patriots — most are in a constant state of ebb and flow. Some teams that competed for titles a decade ago have seen their championship window close and now have to rebuild. The fanbases that once cheered those teams to victory are now less inclined to go see their games in person. These are the teams losing the most fans.
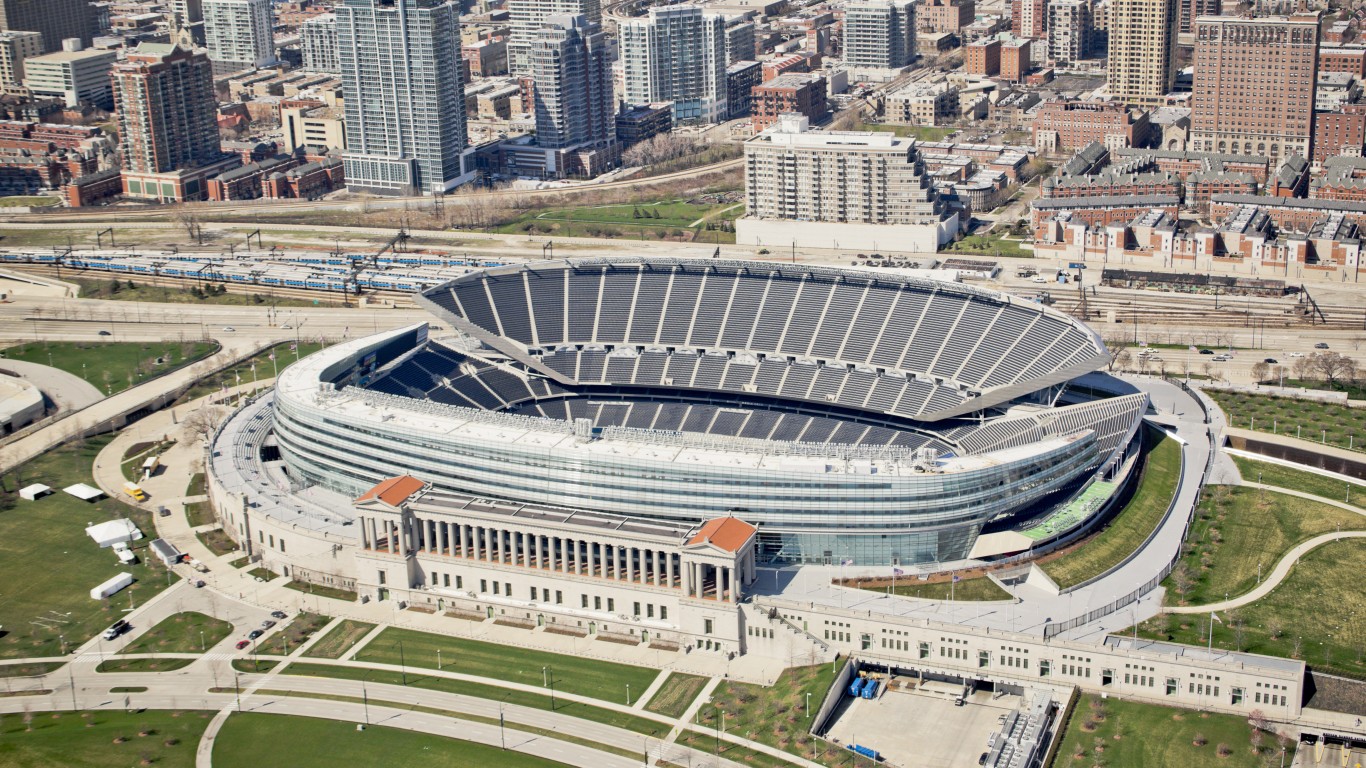
When determining the teams adding the most fans, we excluded teams that moved to significantly larger stadiums or increased the seating capacity at their existing stadium. The Green Bay Packers added 7,000 seats to Lambeau Field in 2013, leading to increased attendance totals. Yet Lambeau was 95.6% full for the average 2018 home game, compared to 96.9% a decade earlier. The Dallas Cowboys average home attendance increased by nearly 45% from 2008 to 2018 because the team moved into AT&T Stadium — a state of the art billion dollar arena that can fit up to 100,000 fans. These are the most expensive stadiums in the world.
To determine the teams adding the most fans, 24/7 Wall St. reviewed 10-year percentage changes in average attendance at regular season home games in the NHL, NBA, MLB, and NFL. Attendance figures are from ESPN and are as of the most recent completed season — the 2018-2019 season for the NHL and NBA, and the 2018 seasons for the NFL and MLB — and the season 10 years prior. Teams that significantly increased their attendance capacity either by expanding their current stadium or moving to a new, larger stadium were not considered. Several NBA teams moved arenas, but their total seating capacity remained essentially the same, so those teams were still considered.
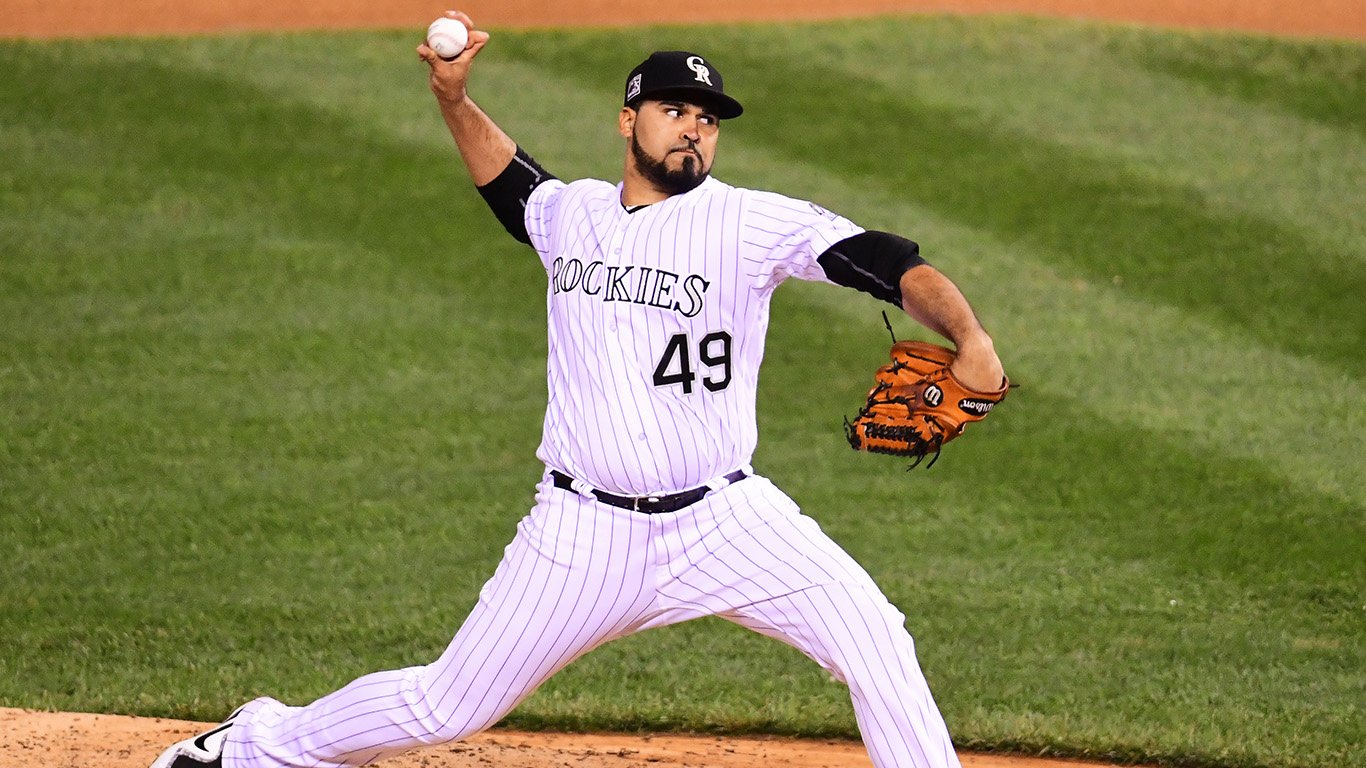
10. Colorado Rockies
> Avg. home attendance change 2008-2018: +12.4%
> 2008 avg. home game attendance (pct. capacity): 33,127 (65.7%)
> 2008 record: 74-88
After making their first World Series appearance in 2007, the Colorado Rockies fell flat in 2008. The team’s season record was 74-88, and Coors Field was only 65.7% full for the average home game, which ranked 16th out of 30 teams.
[in-text-ad]
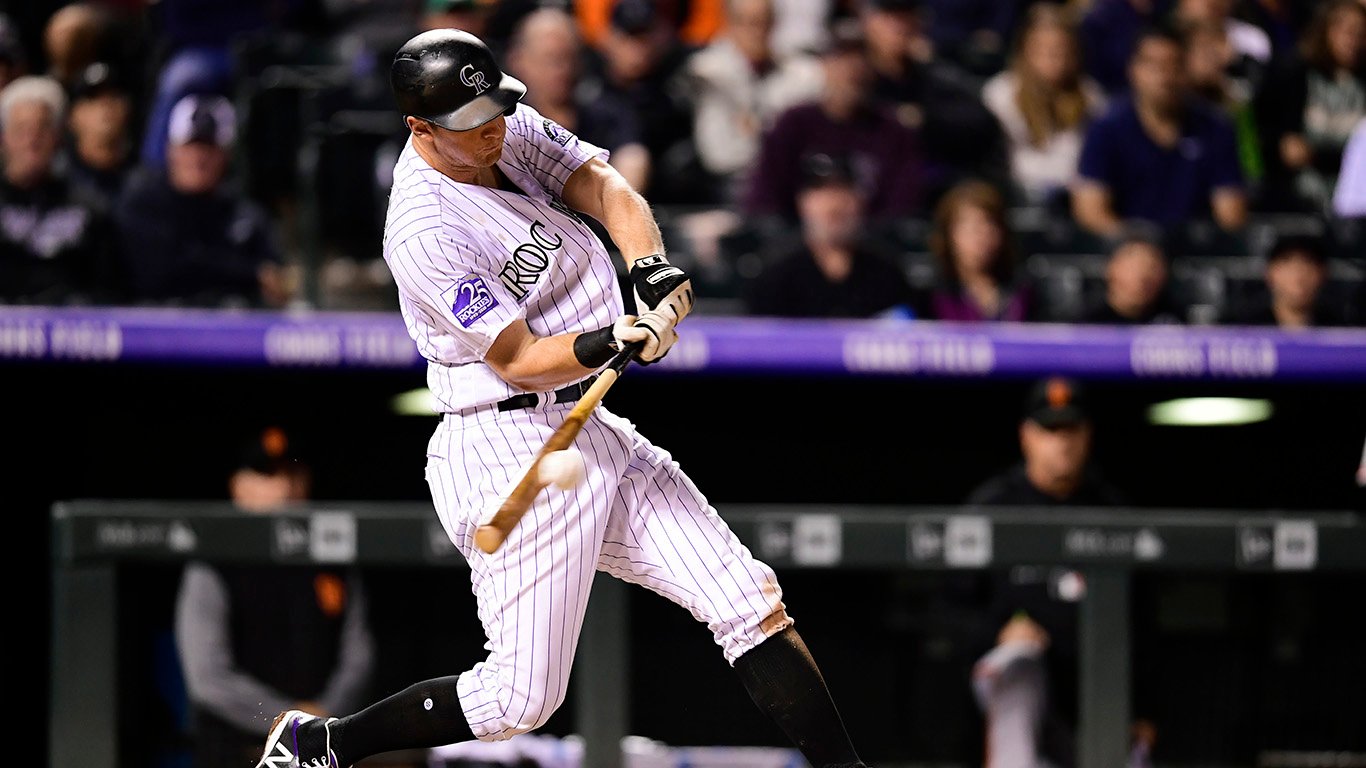
10. Colorado Rockies
> Avg. home attendance change 2008-2018: +12.4%
> 2018 avg. home game attendance (pct. capacity): 37,233 (73.7%)
> 2018 record: 91-72
The 2018 season marked the first time that the Colorado Rockies hosted more than 3 million fans at Coors Field in a season since 2001. This may be because the Rockies posted their second straight winning season and made the playoffs again, though they lost in the NLDS to the Milwaukee Brewers.
[recirclink id=559068]
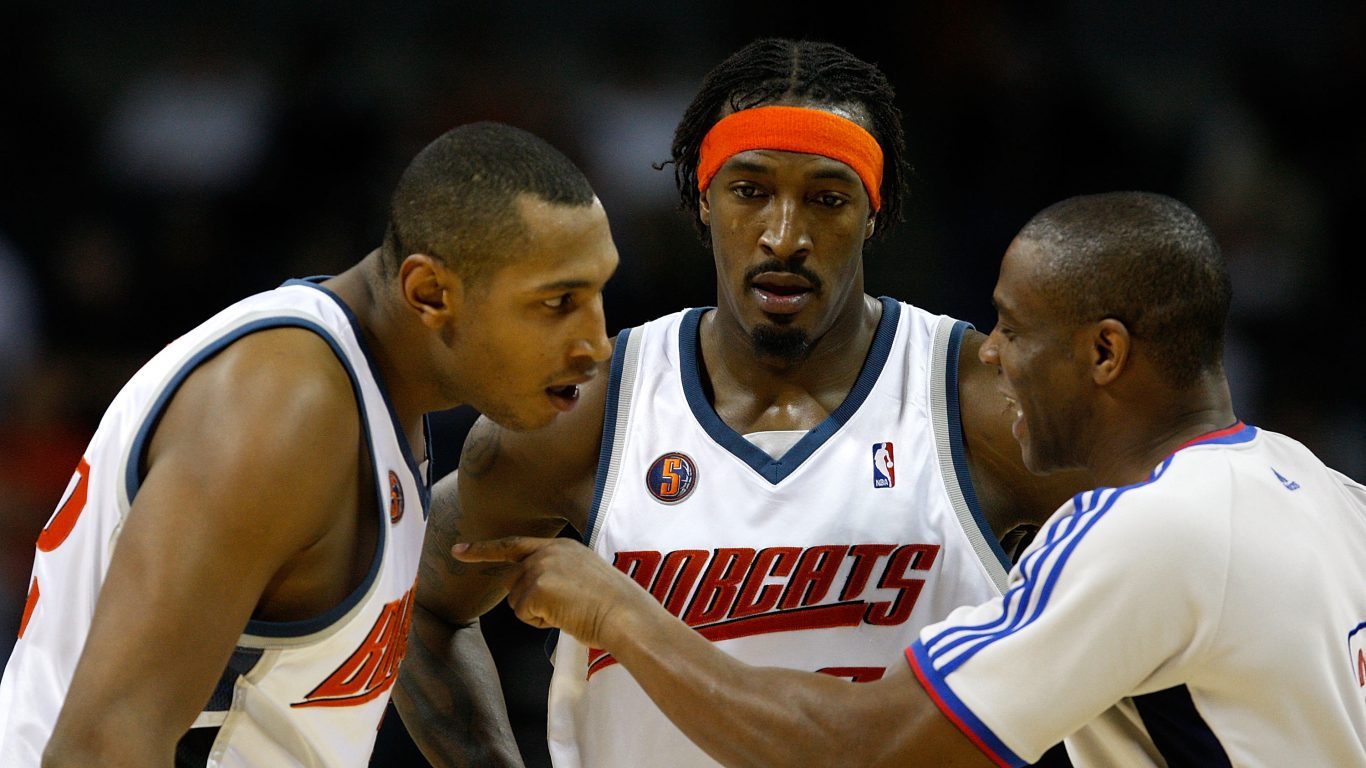
9. Charlotte Hornets (Bobcats)
> Avg. home attendance change 2008-2018: +13.6%
> 2008-2009 avg. home game attendance (pct. capacity): 14,526 (76.3%)
> 2008-2009 record: 35-47
The 2008-2009 season was another forgettable one for the Charlotte Bobcats. They missed the playoffs for the fifth straight year, playing for their third coach in as many seasons. The team lacked star power and played a slow brand of basketball that failed to excite fans. The Bobcats scored just 93.6 points per game, the lowest average in the NBA. Charlotte finished in the bottom five in both total attendance and percent of home arena capacity filled for that season.
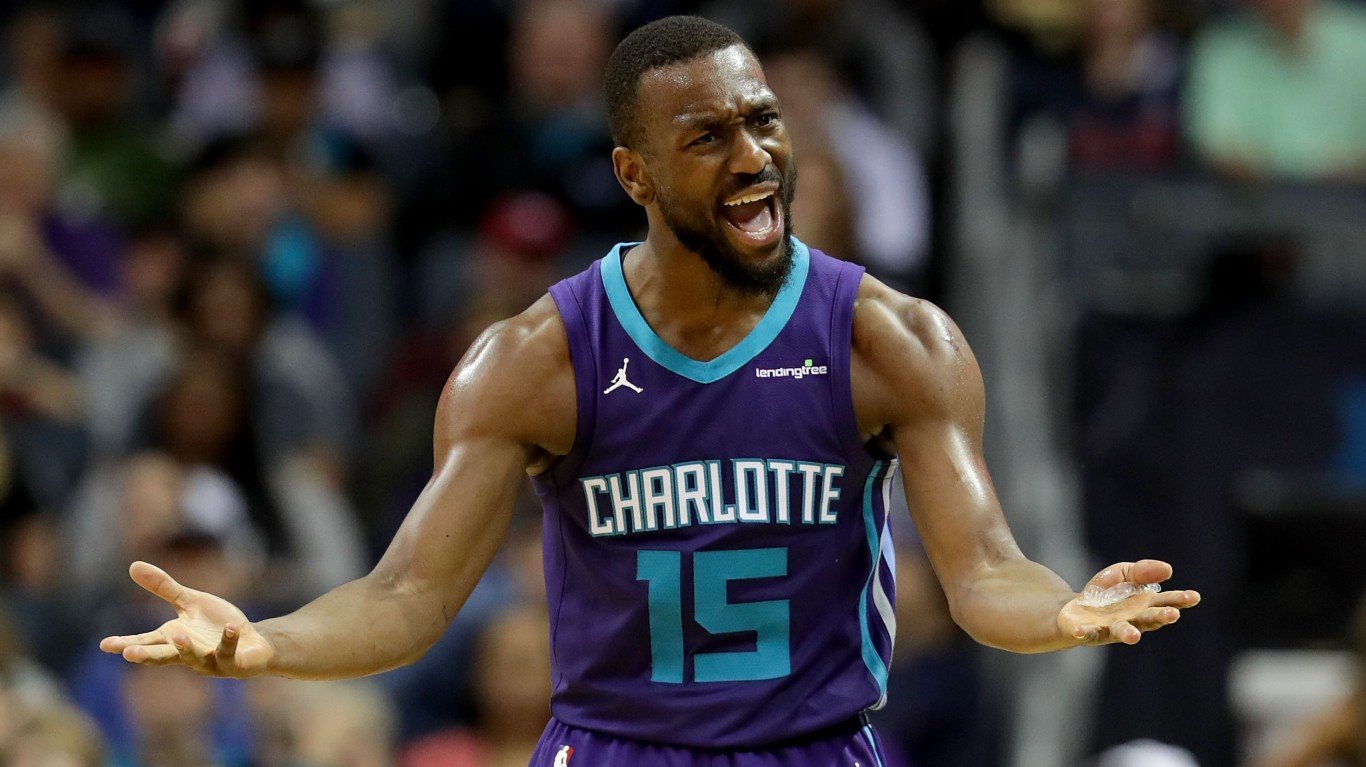
9. Charlotte Hornets
> Avg. home attendance change 2008-2018: +13.6%
> 2018-2019 avg. home game attendance (pct. capacity): 16,501 (86.5%)
> 2018-2019 record: 39-43
Though the Charlotte Hornets again failed to post a winning record in the 2018-2019 season, many more fans came to their games that season. Total attendance increased by nearly 2,000 fans per game over the past decade, and the Spectrum Center was noticeably fuller. This could be due to the fact that the team had a much better offense, led by three-time All-Star Kemba Walker. The team was also in the playoff hunt, narrowly missing out on the eighth seed in the Eastern Conference.
[in-text-ad-2]
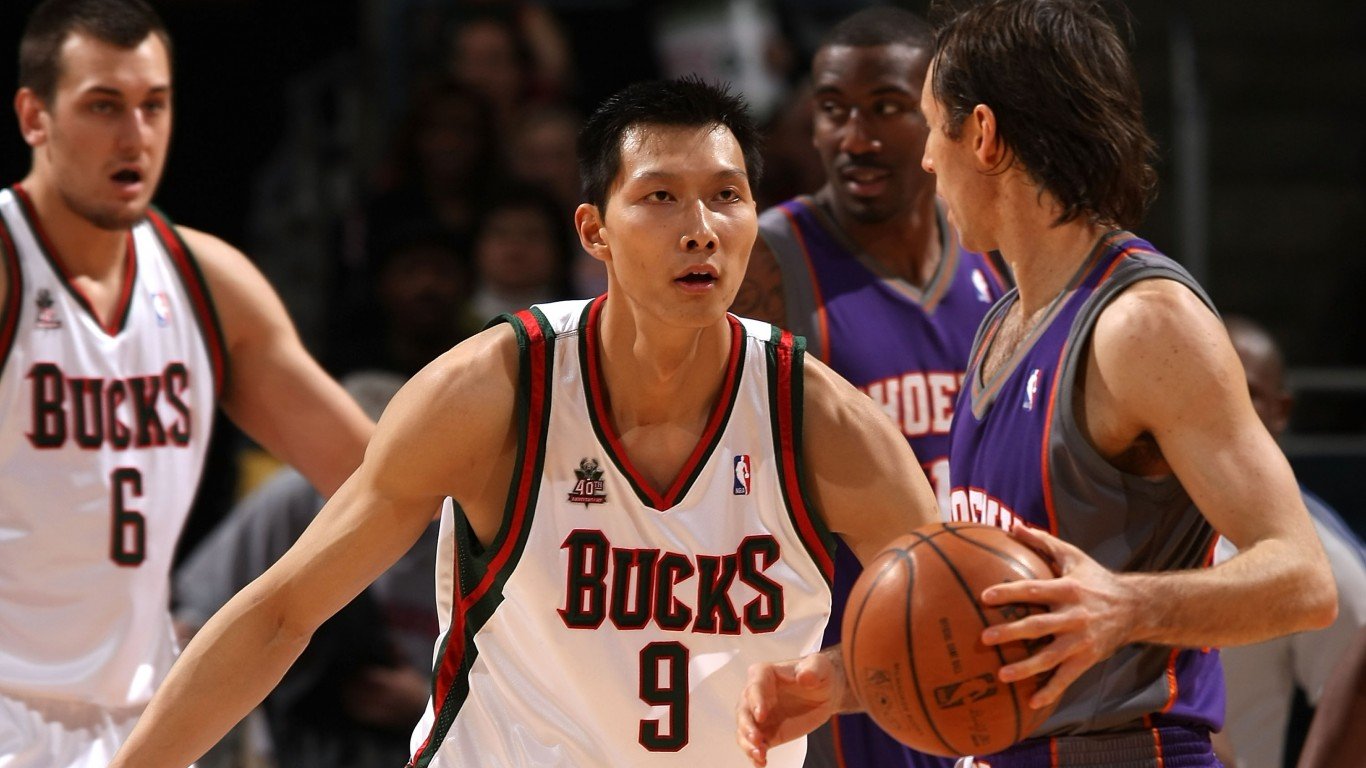
8. Milwaukee Bucks
> Avg. home attendance change 2008-2018: +14.4%
> 2008-2009 avg. home game attendance (pct. capacity): 15,389 (82.2%)
> 2008-2009 record: 34-48
During the 2008-2009 season, the Milwaukee Bucks were one of just eight teams that averaged less than 16,000 fans at home games. That season, most NBA arenas were over 95% full on average, but the Bucks could only manage 82.2% attendance. The team finished at the bottom of their division and never really seemed like a threat to make the playoffs.
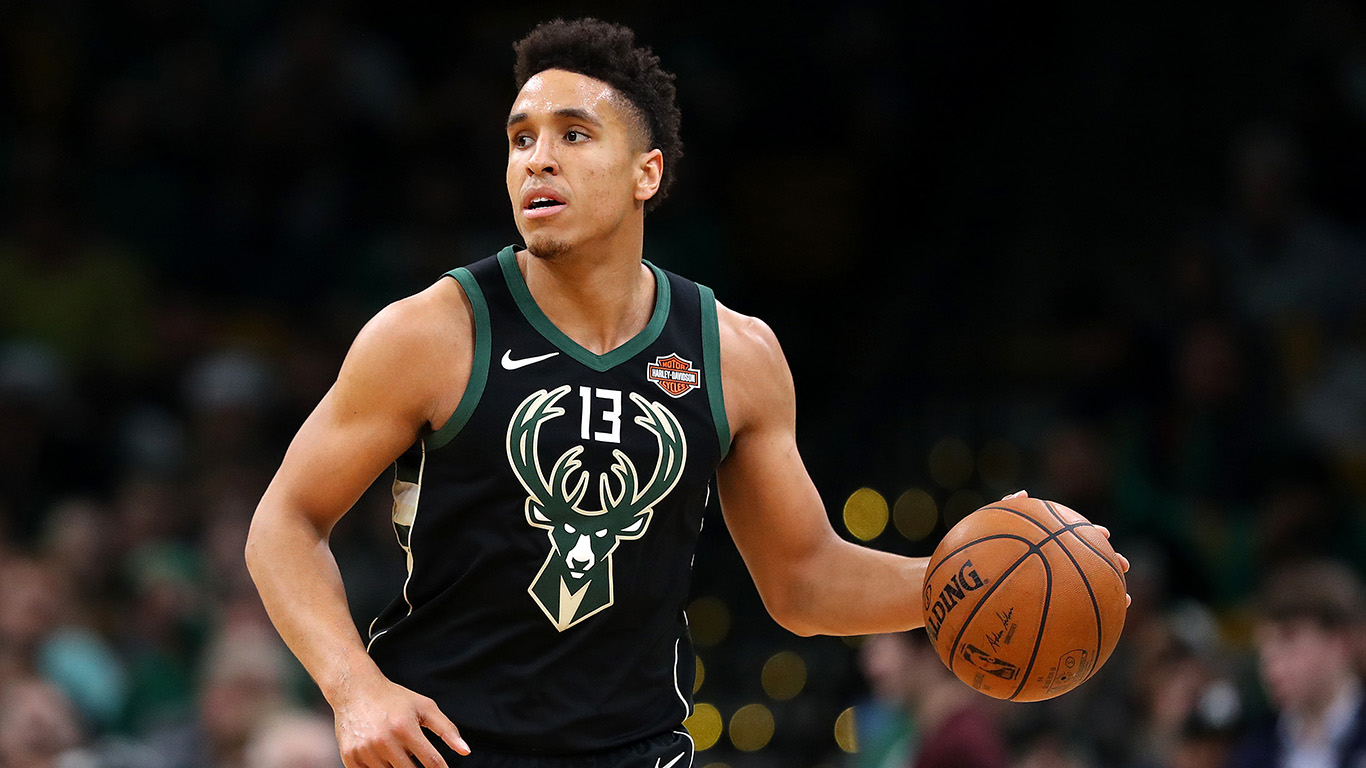
8. Milwaukee Bucks
> Avg. home attendance change 2008-2018: +14.4%
> 2018-2019 avg. home game attendance (pct. capacity): 17,602 (101.5%)
> 2018-2019 record: 60-22
The 2018-2019 season was the best Milwaukee has had in decades. Giannis Antetokounmpo blossomed into a superstar, winning NBA MVP and leading the Bucks to the best record in the NBA. The Bucks were fun to watch, and fans packed the Fiserv Forum beyond capacity for the average game. Their 101.5% of capacity filled ranked second in the NBA that season. Though the Bucks lost to the eventual champion Toronto Raptors in the playoffs, Milwaukee fans have a lot to be excited for.
[in-text-ad]
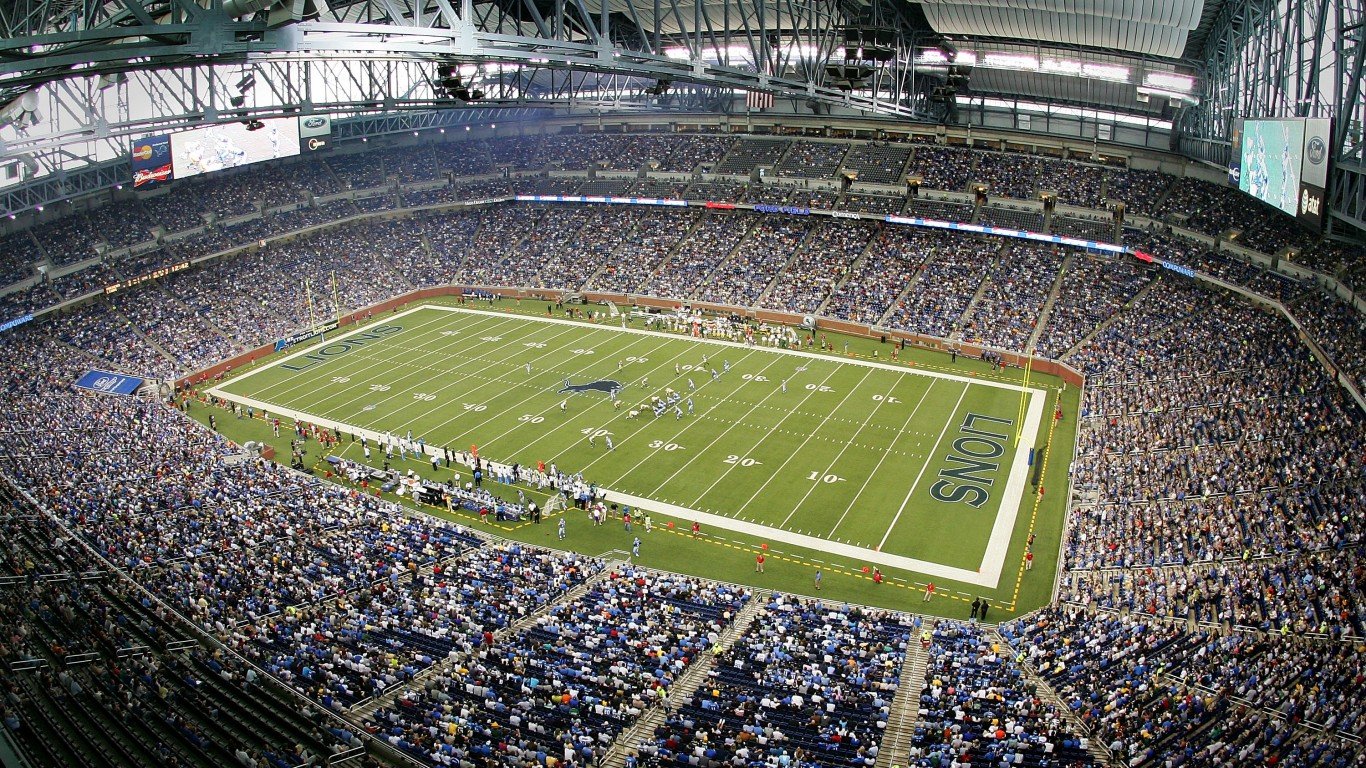
7. Detroit Lions
> Avg. home attendance change 2008-2018: +15.2%
> 2008 avg. home game attendance (pct. capacity): 54,497 (84.5%)
> 2008 record: 0-16
The 2008 Detroit Lions may have been the worst team in NFL history. They were the first team to ever go 0-16, a feat that has only been replicated once since, by the 2017 Cleveland Browns. Detroit lost each game by an average of 15.6 points, and fans had no interest in watching the team. The Lions average attendance of 54,497 fans per game and average percentage of seats filled at home games of 84.5% were both dead last in the NFL.
[recirclink id=414257]
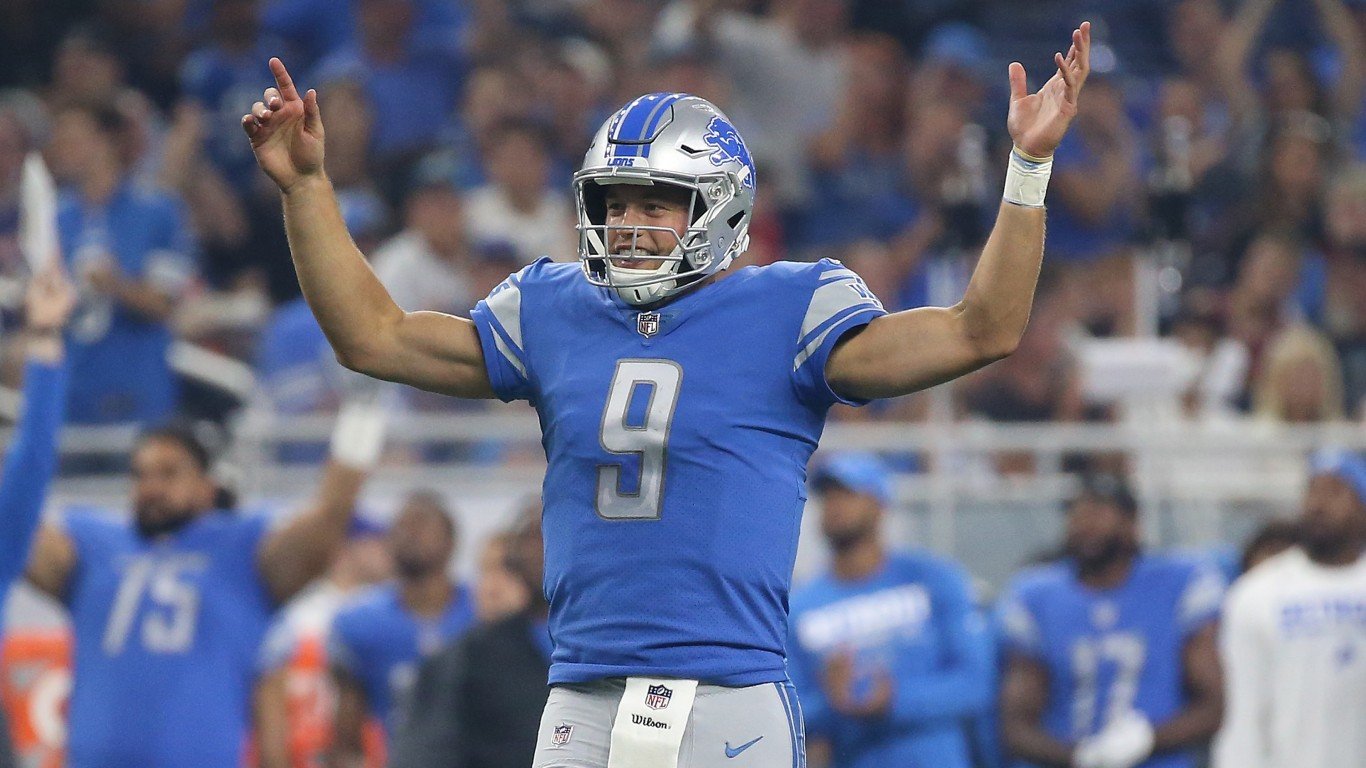
7. Detroit Lions
> Avg. home attendance change 2008-2018: +15.2%
> 2018 avg. home game attendance (pct. capacity): 62,795 (97.4%)
> 2018 record: 6-10
Lions fans had many reasons for optimism going into 2018 — the team finished the previous two seasons with a winning record, and new head coach Matt Patricia seemed poised to revamp Detroit’s defense. This optimism likely helped boost attendance to over 97% of Ford Field’s capacity. Though the Lions finished the season with a losing record, they were at least able to keep attendance up by winning some of their games.

6. Tampa Bay Lightning
> Avg. home attendance change 2008-2018: +15.7%
> 2008-2009 avg. home game attendance (pct. capacity): 16,497 (85.6%)
> 2008-2009 record: 24-40-18
Florida is not exactly a hotbed of hockey, so a last-place Tampa Bay Lightning team struggled to attract fans in the 2008-2009 season. The team was a mess, firing head coach Barry Melrose after just 16 games in charge. Tampa Bay’s arena was just 85.6% full for the average home game, which ranked 26th among the 30 NHL teams that season.
[in-text-ad-2]
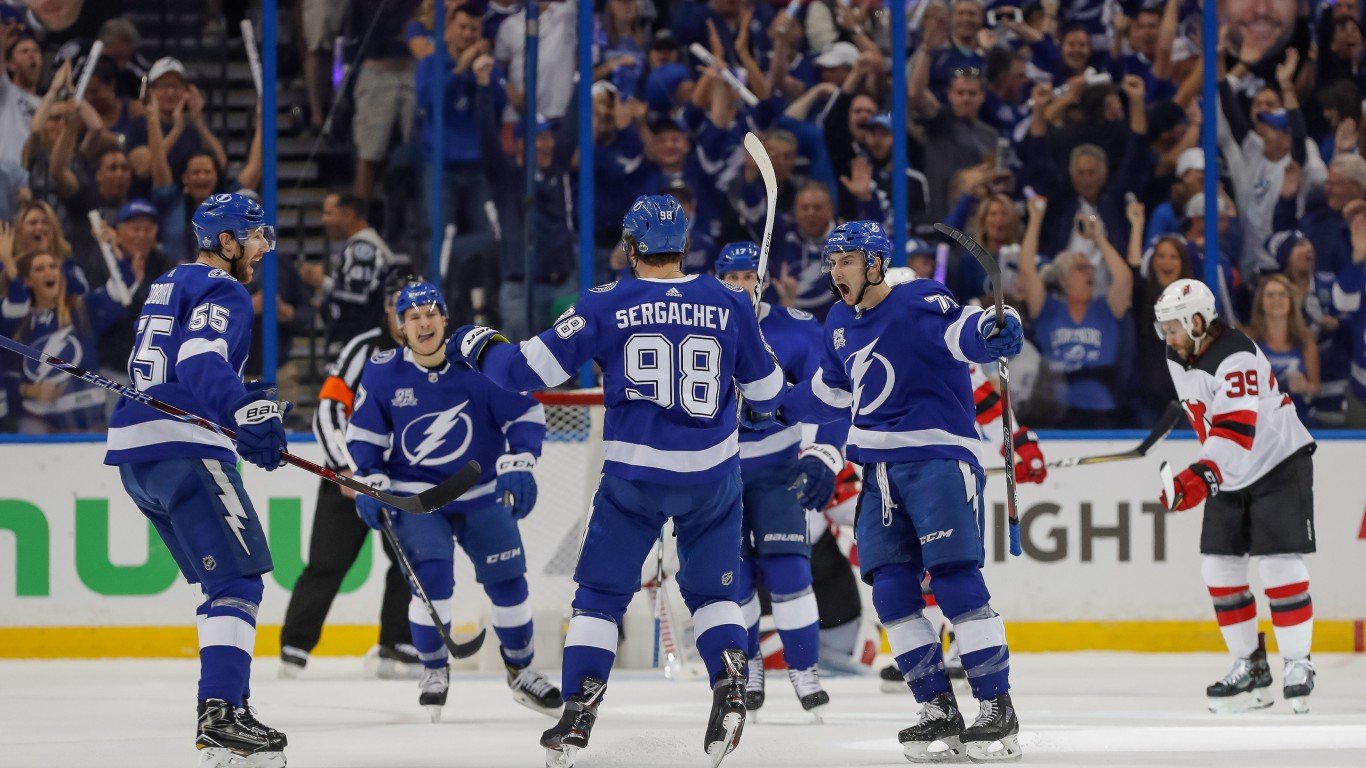
6. Tampa Bay Lightning
> Avg. home attendance change 2008-2018: +15.7%
> 2018-2019 avg. home game attendance (pct. capacity): 19,092 (100.0%)
> 2018-2019 record: 62-16-4
Current Lightning head coach Jon Cooper took Tampa Bay from punching bag to powerhouse. Since he took over in 2013, the Lightning made the playoffs five of his six full seasons at the helm. In the 2018-2019 season, Tampa posted by far the best regular season record. Fans love a winner, and Amalie Arena was packed to capacity for every game. Though Tampa suffered a shock first round defeat to the Columbus Blue Jackets, the team will likely be a top Stanley Cup Contender in 2020.
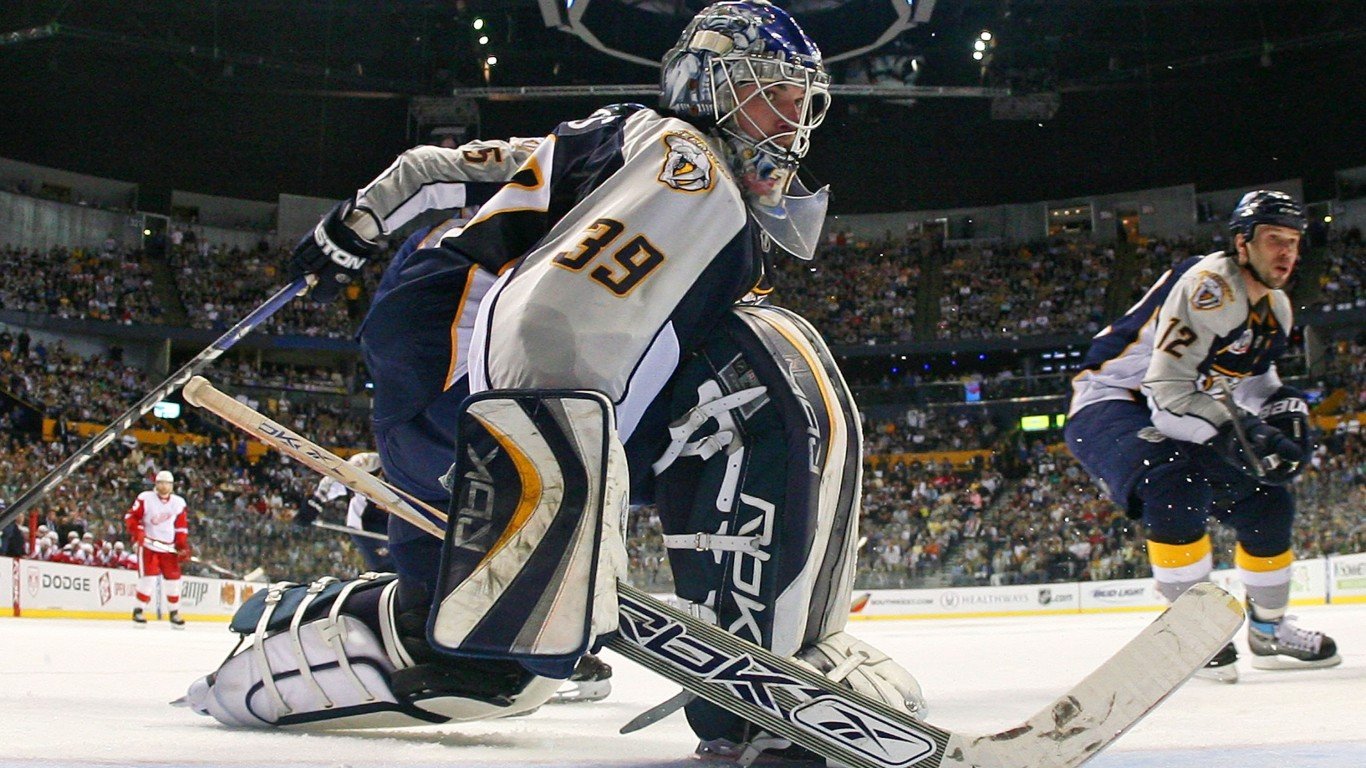
5. Nashville Predators
> Avg. home attendance change 2008-2018: +16.2%
> 2008-2009 avg. home game attendance (pct. capacity): 15,010 (87.7%)
> 2008-2009 record: 40-34-8
Despite their winning record in the 2008-2009 season, the Predators’ four-season playoff streak was snapped. Nashville finished near the bottom of the NHL in terms of average total attendance for home games and average percentage of capacity filled.
[in-text-ad]
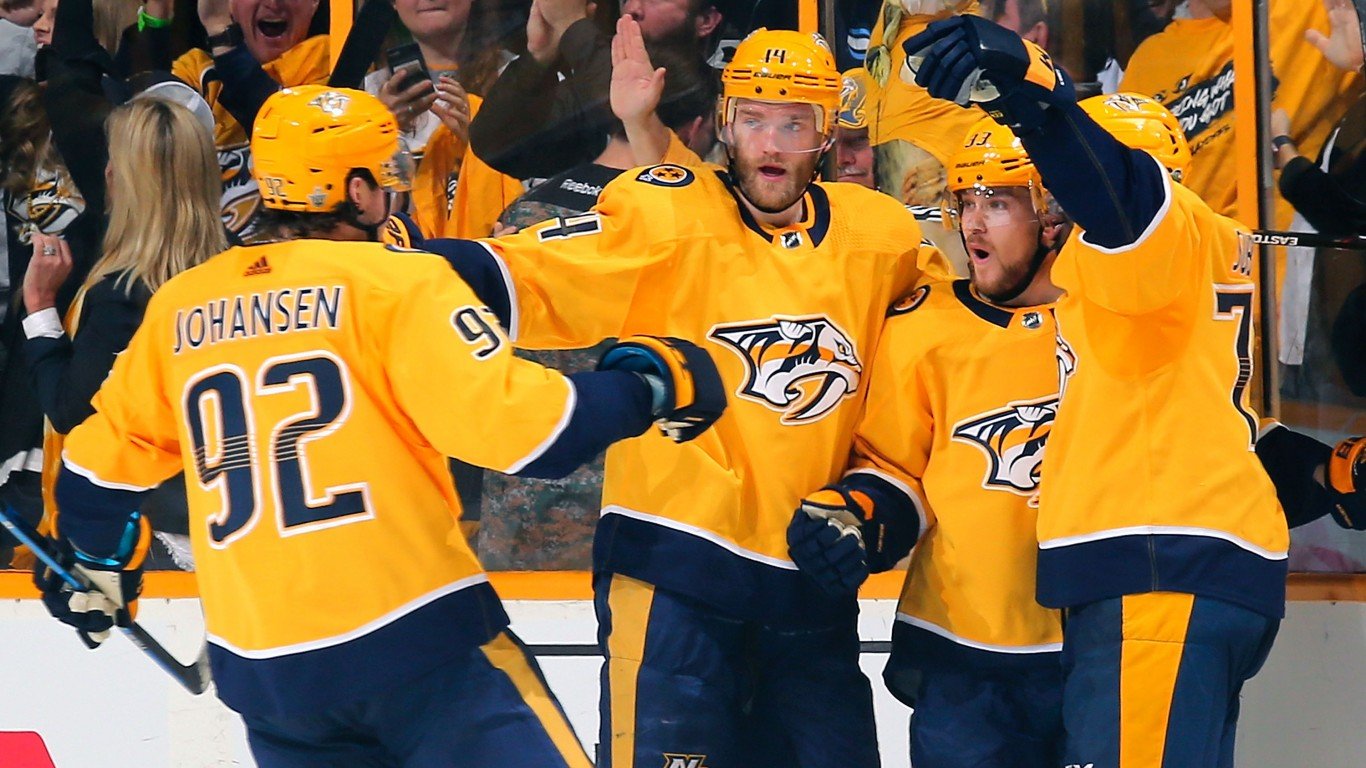
5. Nashville Predators
> Avg. home attendance change 2008-2018: +16.2%
> 2018-2019 avg. home game attendance (pct. capacity): 17,445 (101.9%)
> 2018-2019 record: 47-29-6
The 2018-2019 Nashville Predators were so popular that their home, Bridgestone Arena, was typically packed beyond capacity. It was one of just seven NHL arenas to average over 100% With one of the best defenses in the NHL, the Preds finished atop the Central Division. It was their fifth consecutive playoff appearance.
[recirclink id=526202]
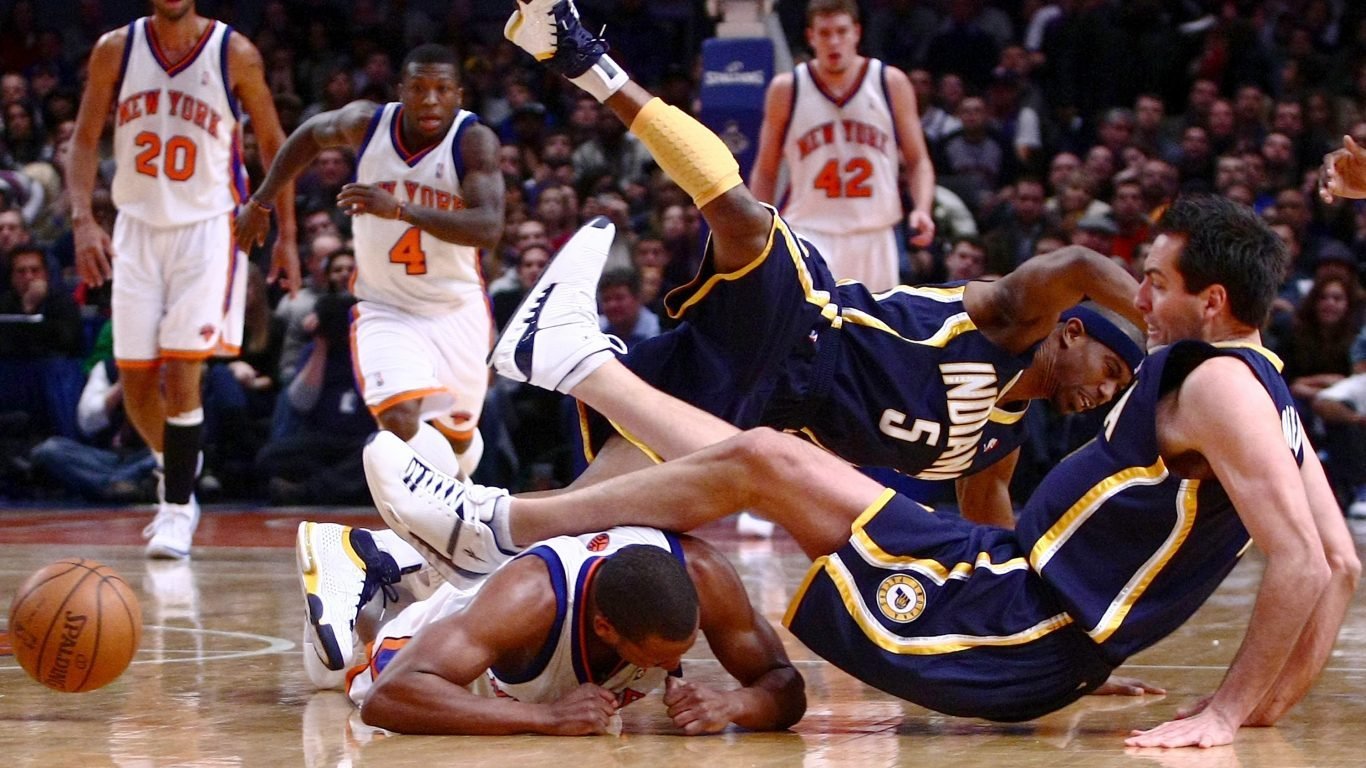
4. Indiana Pacers
> Avg. home attendance change 2008-2018: +18.5%
> 2008-2009 avg. home game attendance (pct. capacity): 14,182 (78.1%)
> 2008-2009 record: 36-46
The state of Indiana is crazy for basketball, but the Pacers gave fans little to cheer for in the 2008-2009 season. The team posted a 36-46 record, missing the playoffs for the third straight season. The Pacers’ average home attendance of just over 14,000 fans was third-lowest in the NBA that season.
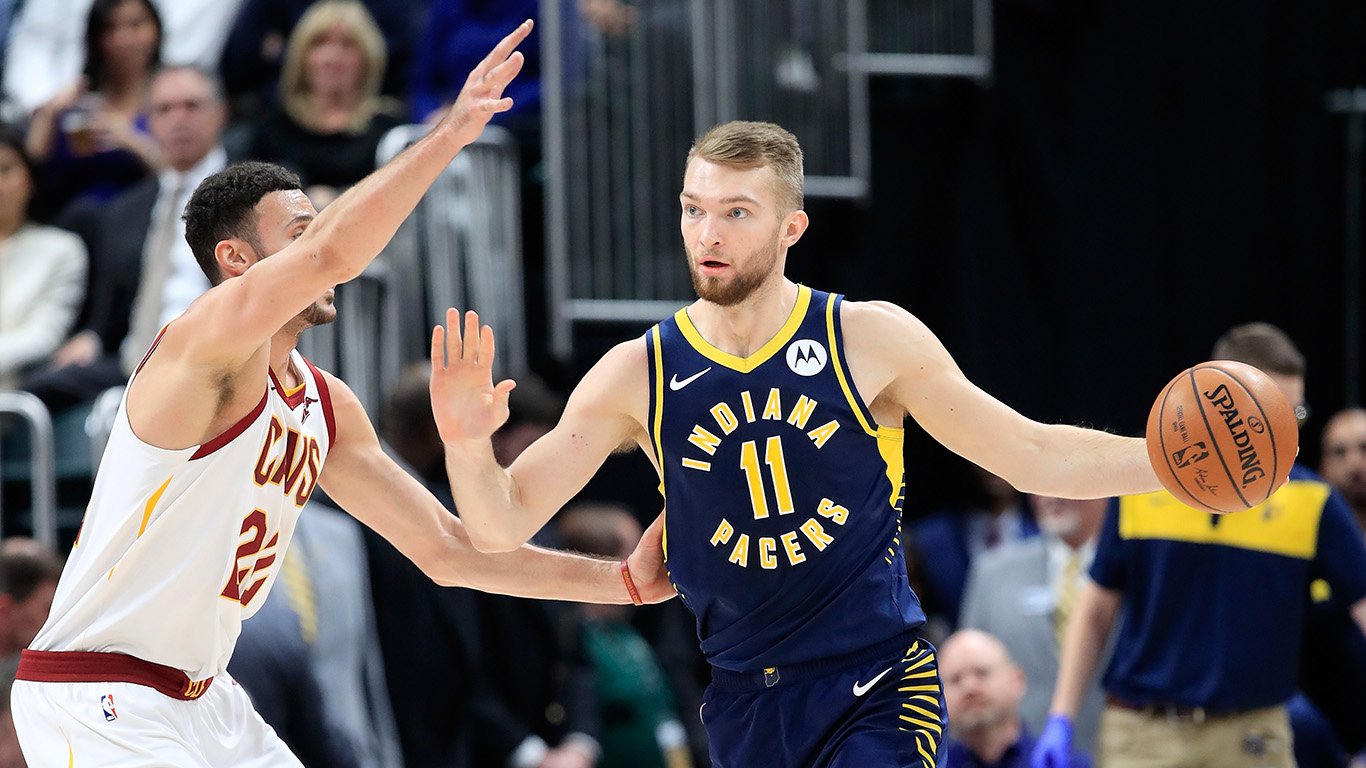
4. Indiana Pacers
> Avg. home attendance change 2008-2018: +18.5%
> 2018-2019 avg. home game attendance (pct. capacity): 16,812 (92.6%)
> 2018-2019 record: 48-34
With the Pacers winning again, Indiana fans are once again packing into Bankers Life Fieldhouse to watch their team. The Pacers made the playoffs for the fourth straight season in 2019, vaulting their attendance capacity percentage from under 80% a decade prior to over 92%.
[in-text-ad-2]
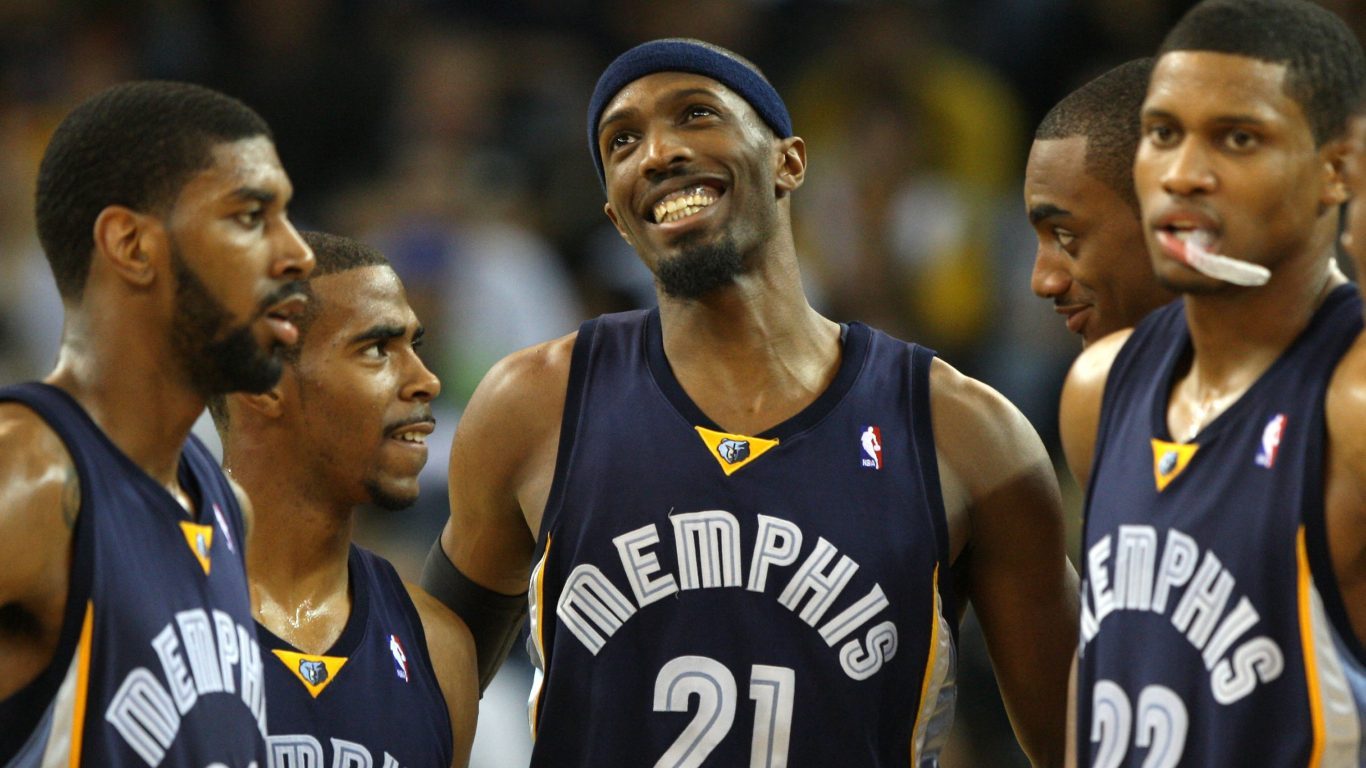
3. Memphis Grizzlies
> Avg. home attendance change 2008-2018: +22.2%
> 2008-2009 avg. home game attendance (pct. capacity): 12,745 (70.3%)
> 2008-2009 record: 24-58
The 2008-2009 Memphis Grizzlies had by far the lowest percentage of their arena filled among all NBA teams that season, at 70.3%. Memphis, along with the Sacramento Kings, was one of just two teams that failed to host at least 14,000 fans per home game. In fact, they fell well short, with an average attendance of 12,745. The Grizzlies were dead last in their division with a 24-58 record, which likely kept fans away.
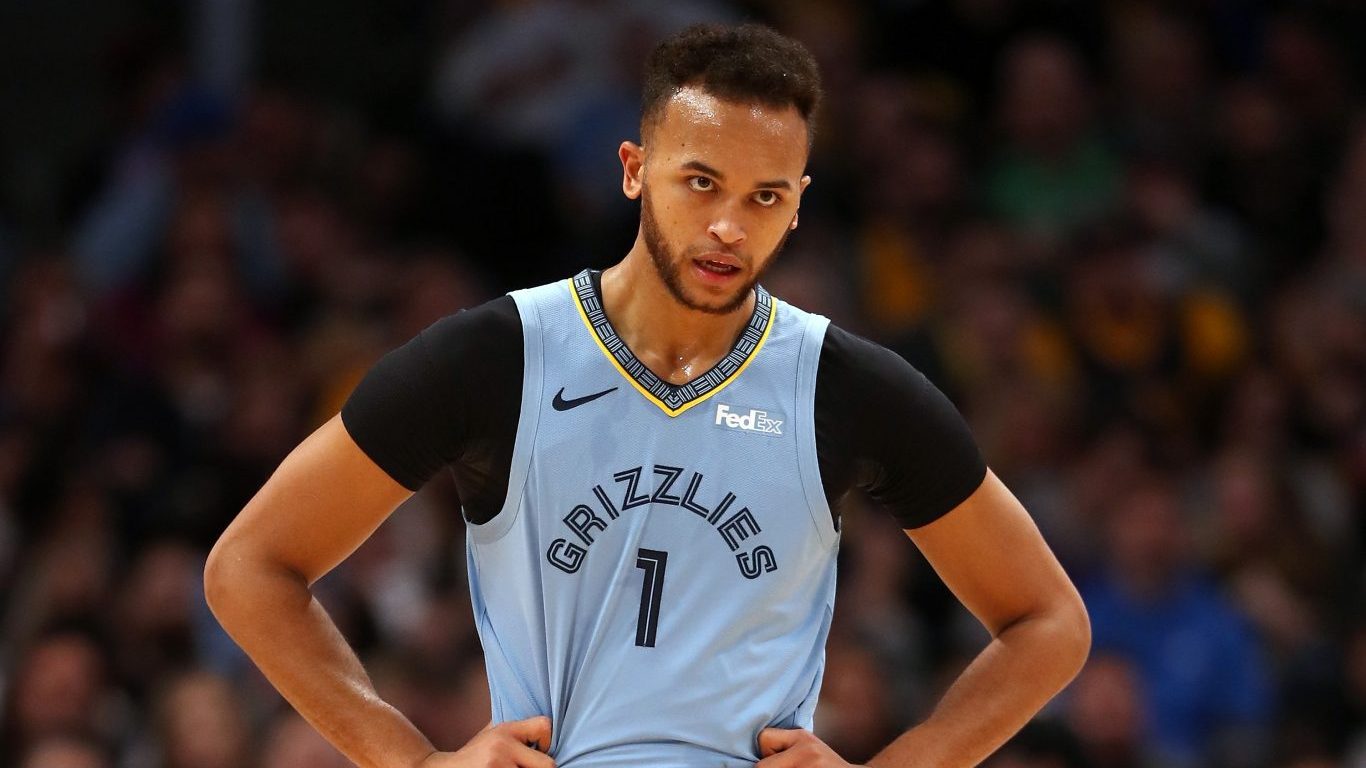
3. Memphis Grizzlies
> Avg. home attendance change 2008-2018: +22.2%
> 2018-2019 avg. home game attendance (pct. capacity): 15,578 (86.0%)
> 2018-2019 record: 33-49
The 2018-2019 Memphis Grizzlies attracted an average of 2,800 more fans to their home games compared to a decade before. The team no longer ranks in the bottom five NBA franchises in terms of total attendance or percentage of capacity filled. The team still is not great, at 33-49, but it is improving and has a tough, gritty identity that mirrors the city it represents.
[in-text-ad]
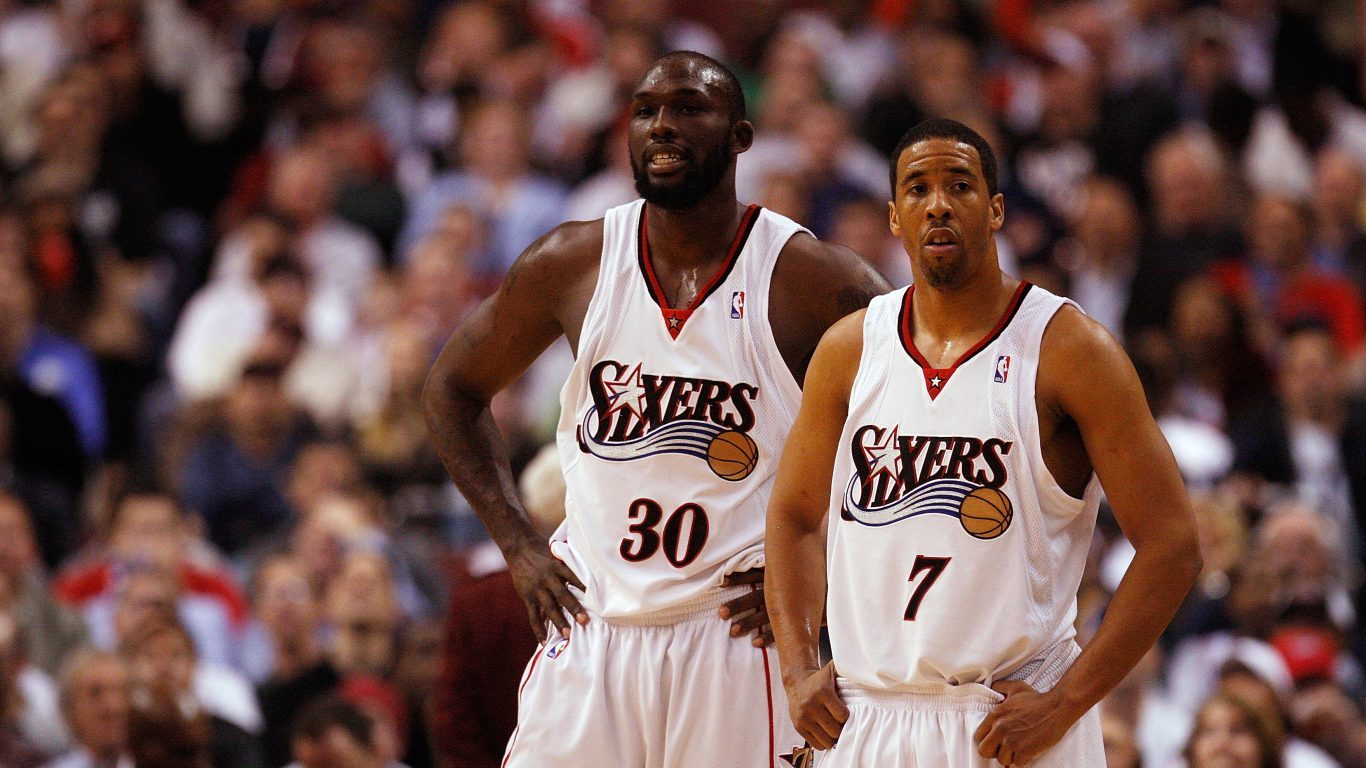
2. Philadelphia 76ers
> Avg. home attendance change 2008-2018: +29.4%
> 2008-2009 avg. home game attendance (pct. capacity): 15,802 (79.7%)
> 2008-2009 record: 41-41
Even though the 2008-2009 Philadelphia 76ers were a playoff team, fans were not interested in the team. The 76ers were one of seven NBA teams that did not fill up at least 80% of their stadium on average that season.
[recirclink id=572383]
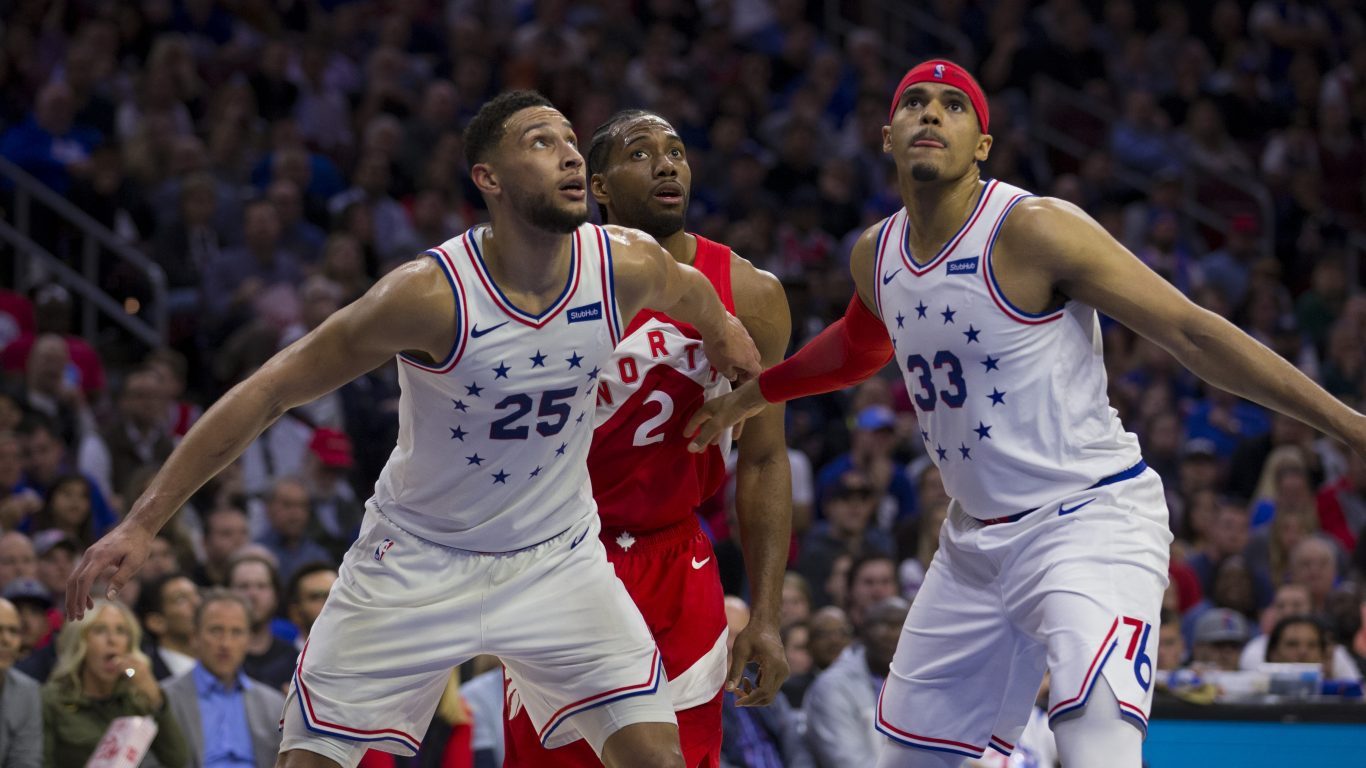
2. Philadelphia 76ers
> Avg. home attendance change 2008-2018: +29.4%
> 2018-2019 avg. home game attendance (pct. capacity): 20,441 (100.6%)
> 2018-2019 record: 51-31
The 76ers have changed a lot in the last decade. The team suffered through some abysmal seasons in the early 2010s, accumulating high draft picks and young talent that is beginning to blossom. Philly fans filled Wells Fargo Center beyond capacity for the average game to watch homegrown stars like Joel Embiid and Ben Simmons. Philly is a serious title contender — their playoff run ended on a wild, last second Kawhi Leonard buzzer-beater in Game 7 of their matchup with the eventual champion Toronto Raptors.
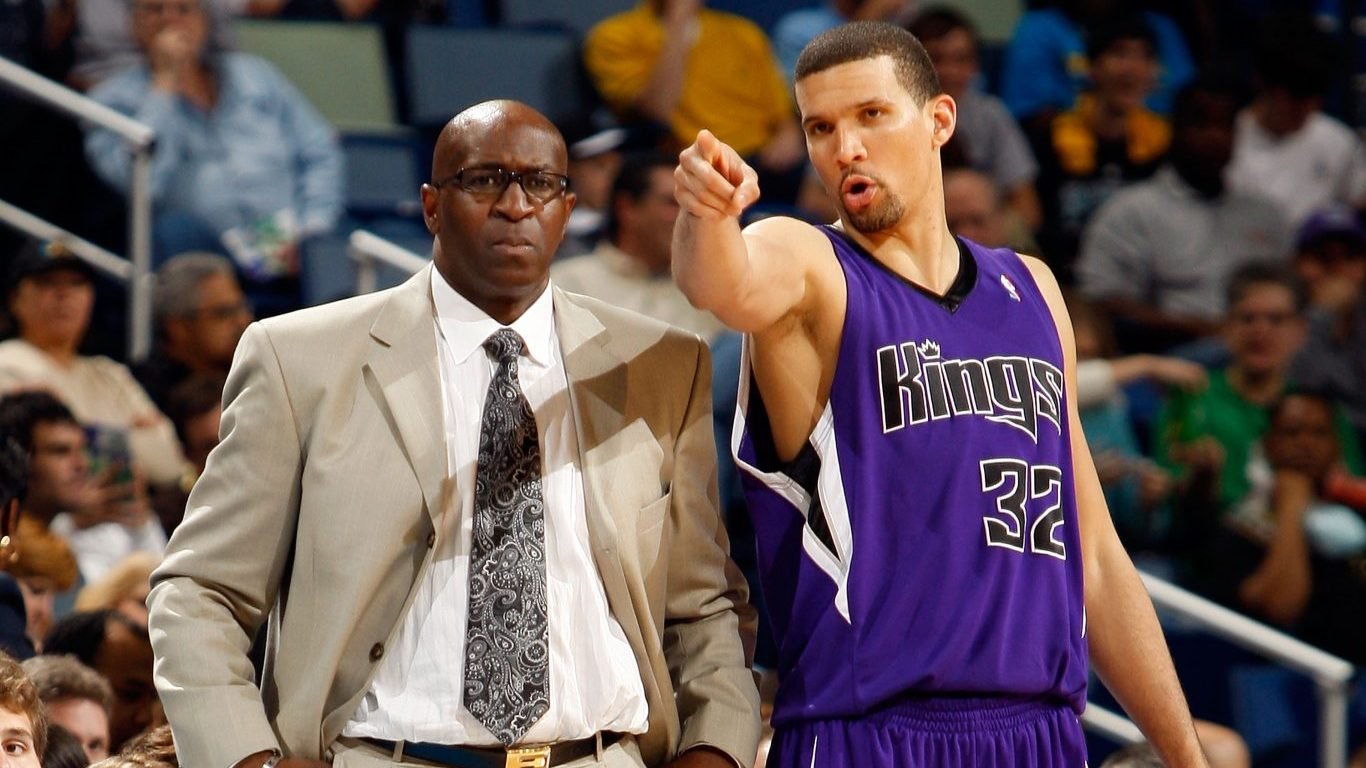
1. Sacramento Kings
> Avg. home attendance change 2008-2018: +36.0%
> 2008-2009 avg. home game attendance (pct. capacity): 12,571 (72.6%)
> 2008-2009 record: 17-65
The Sacramento Kings had some good teams in the early 2000s, but those days were officially gone by 2008. The 2008-2009 Kings were by far the worst team in the NBA, at 17-65. This losing certainly seemed to have had an impact on fan enthusiasm. With an average of just 12,571 attendees, no team had fewer fans at their home games.
[in-text-ad-2]
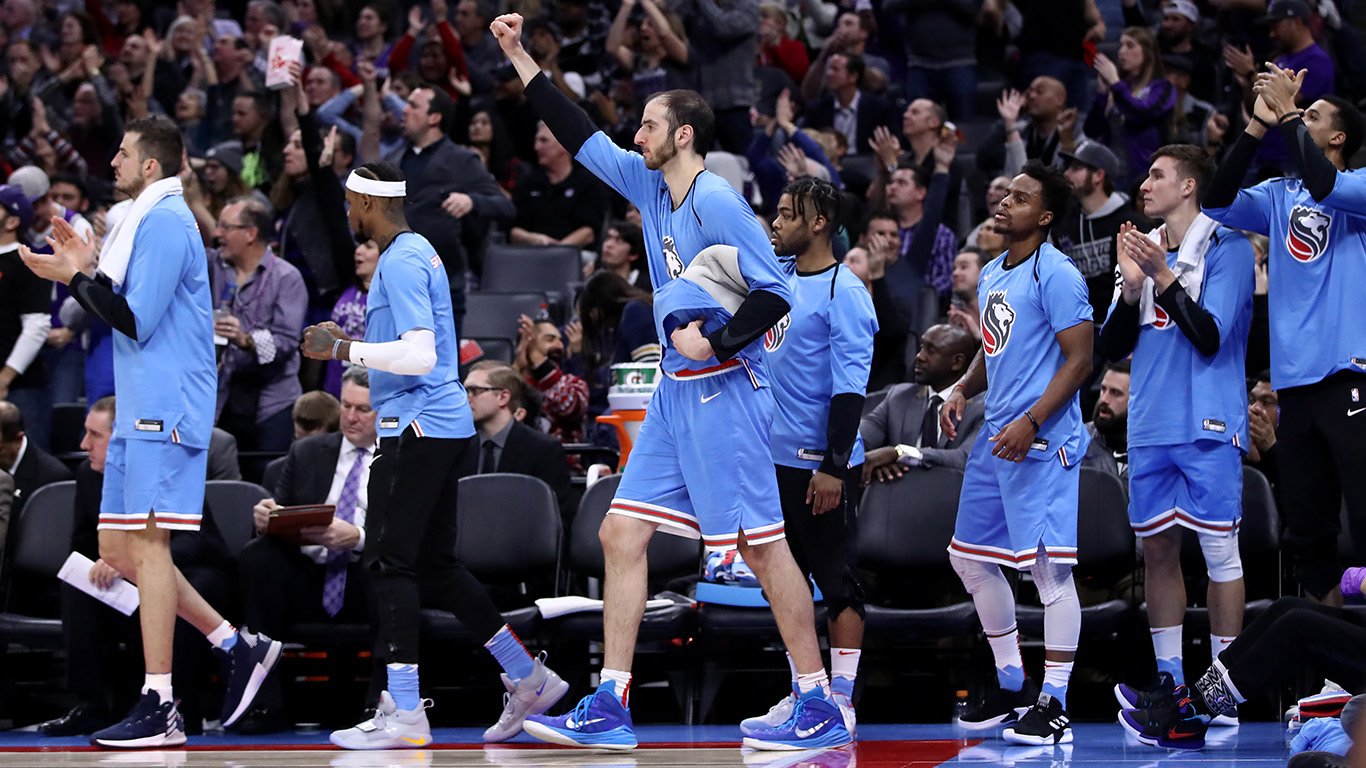
1. Sacramento Kings
> Avg. home attendance change 2008-2018: +36.0%
> 2018-2019 avg. home game attendance (pct. capacity): 17,096 (97.7%)
> 2018-2019 record: 39-43
Though 2019 was the 13th consecutive year the Kings missed the postseason, the franchise is showing signs of life. Sacramento’s 39-43 record was its best since the 2005-2006 season. The Kings have some exciting young players — like Marvin Bagley, Buddy Hield, and De’Aaron Fox — that they can build around in their quest to get back in the playoffs. Kings games were, on average, 97.7% full in the 2018-2019 season, a percentage that ranks among the top half of NBA teams and marks an impressive increase from where the Kings were a decade prior.
Contact [email protected] for any questions or corrections.