[cnxvideo id=”509523″ placement=”ros”]
More than 30 million Americans moved between 2018 and 2019, according to the U.S. Census bureau. People move for various reasons, but the most common are related to work or family.
No matter the reason, moving is an expensive undertaking — especially for those relocating to certain cities.
Using data from the U.S. Census Bureau and Move, Inc., a relocation planning resource, 24/7 Wall St. identified the 35 most expensive cities to move to or within. Cities were ranked based on the average estimated cost of professional mover fees to move household goods, in addition to median monthly rent and a security deposit — equal to a month’s rent — for a three bedroom apartment.
It is important to note that we did not include transportation costs, such as fuel, as these can vary considerably, depending on where new residents are coming from and how far they are moving. We did not include packing fees in our calculation.
Not surprisingly, many of the most expensive places to move to are in general expensive places to live. Among the cities on this list, goods and services can cost as much as 30% more than their cost on average nationwide. In fact, Mount Vernon-Anacortes, Washington, is the only metro area on this list with a lower than average overall cost of living. Here is a complete list of the most expensive city in each state.
Despite the high costs associated with moving to metro areas on this list, the vast majority of these cities are bringing in new residents relatively rapidly. Between 2010 and 2018, all but nine metro areas on this list reported a net population increase due to migration alone (this figure excludes population change due to birth or death.) In 20 of these places, the increase was greater than the comparable 2.5% national population growth attributable to net-migration. Here is a list of America’s fastest growing cities.
Click here to see the 25 most expensive places to move
Click here to read our methodology
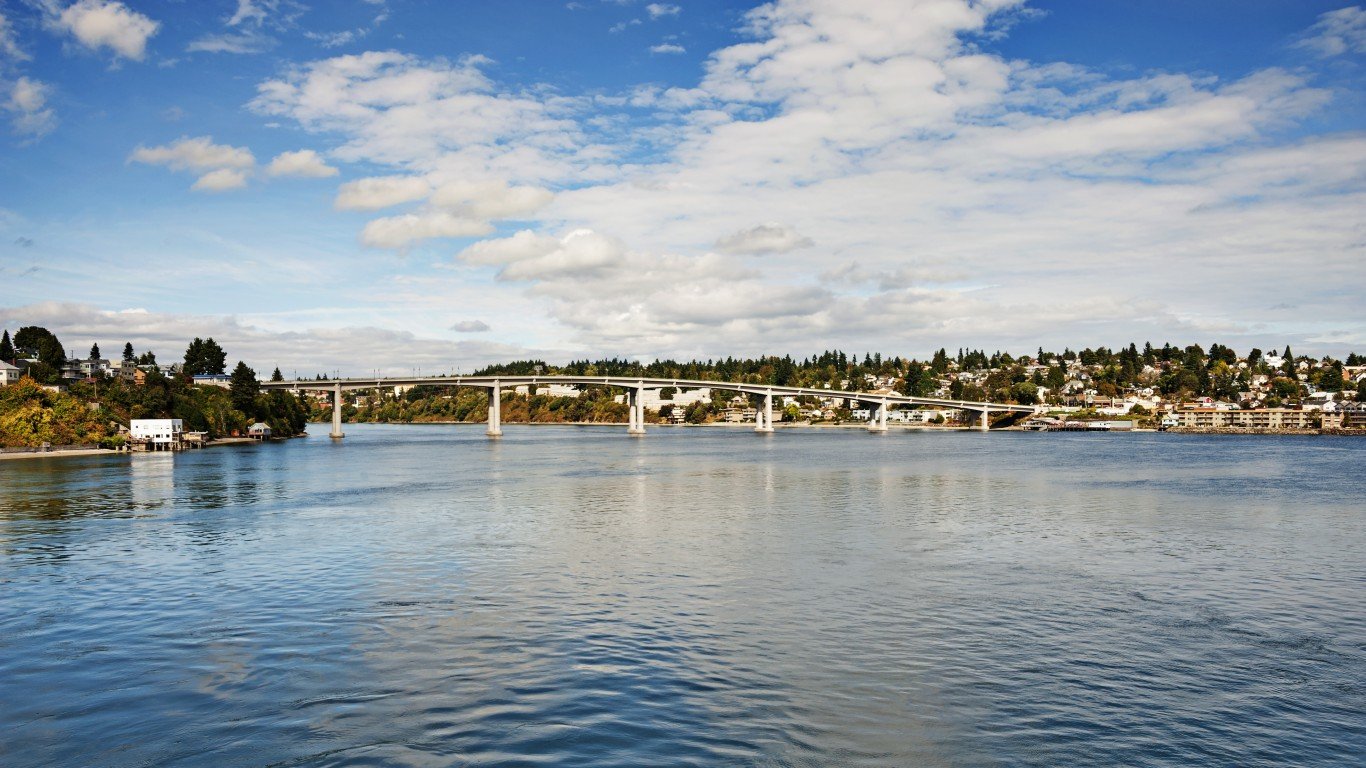
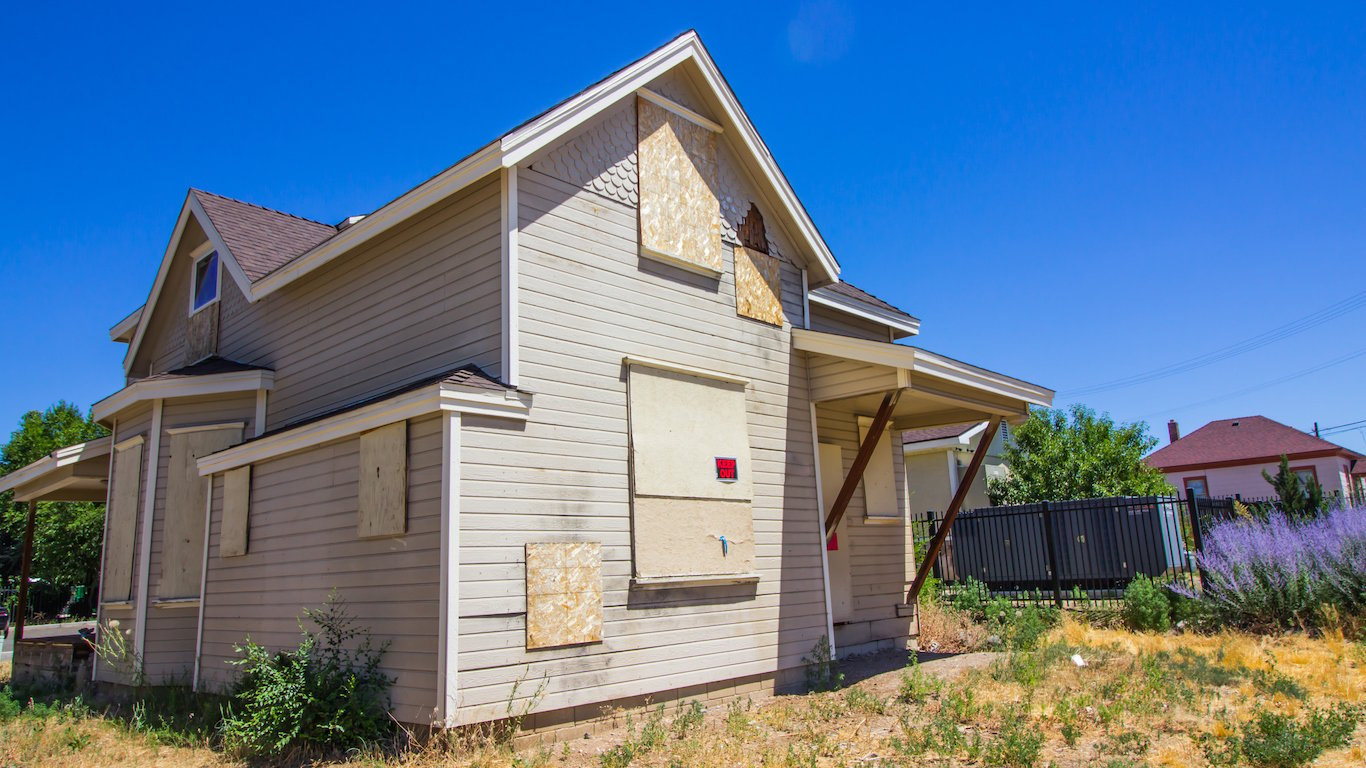
35. Bremerton-Silverdale, WA metro area
> Avg. total moving cost: $5,707
> 1st month’s rent: $1,498
> Median household income: $76,945
> Population change from migration (2010-2018): +4.4%
[in-text-ad]

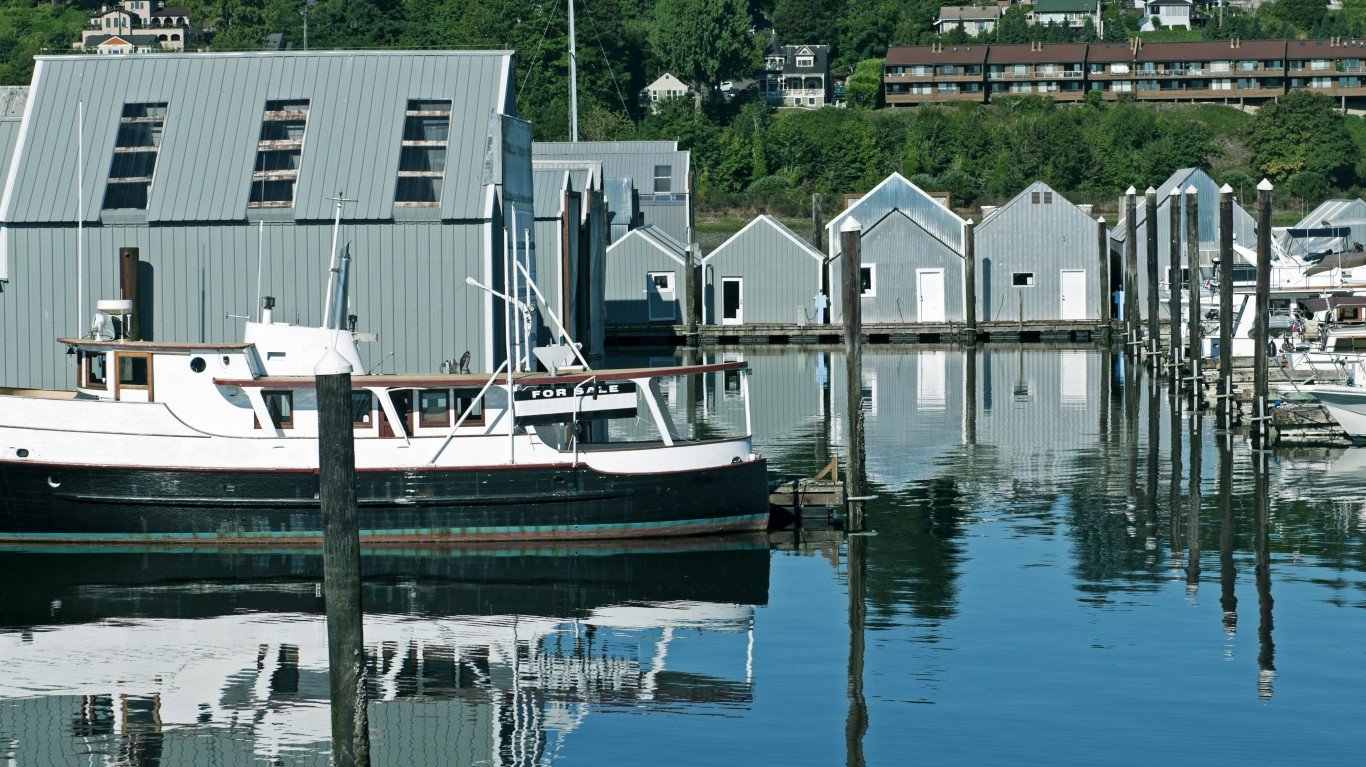
34. Mount Vernon-Anacortes, WA metro area
> Avg. total moving cost: $5,736
> 1st month’s rent: $1,536
> Median household income: $73,206
> Population change from migration (2010-2018): +7.6%
[recirclink id=577072]
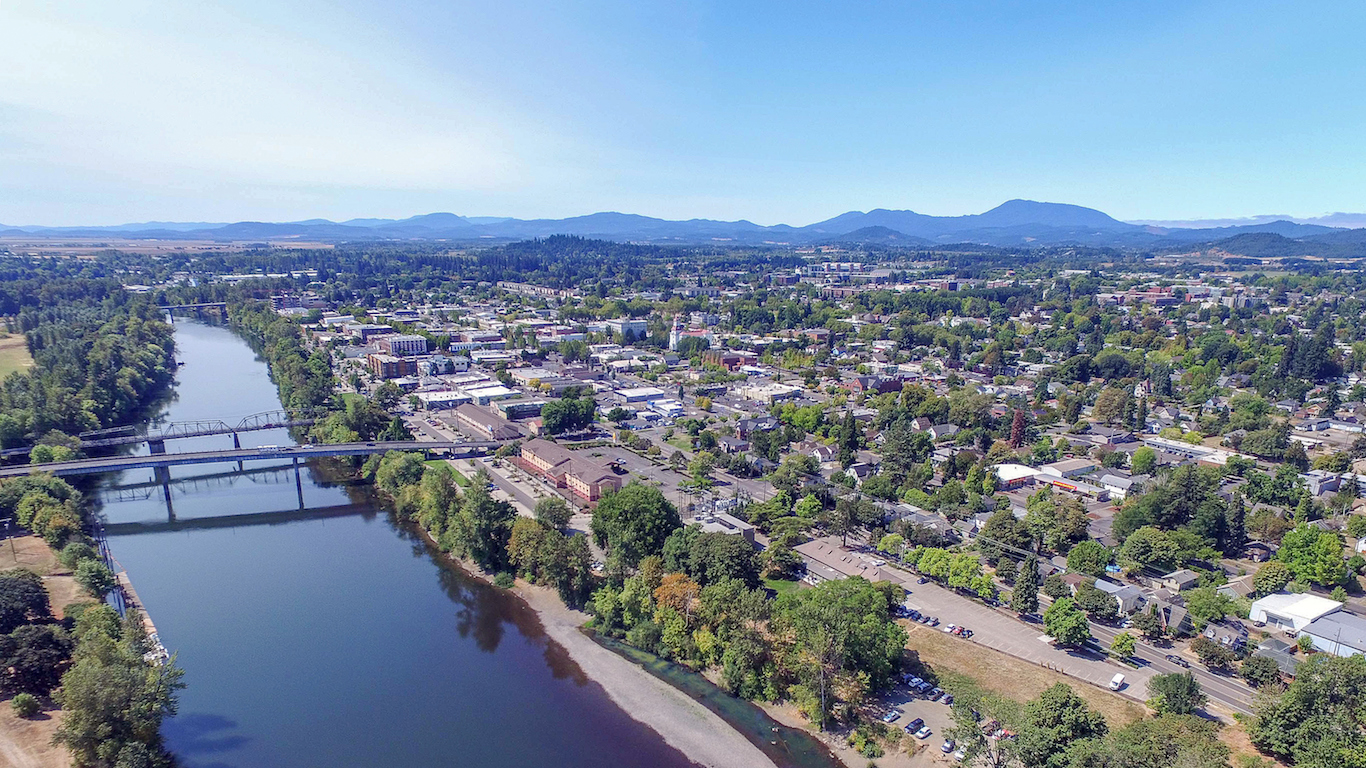
33. Corvallis, OR metro area
> Avg. total moving cost: $5,746
> 1st month’s rent: $1,503
> Median household income: $63,773
> Population change from migration (2010-2018): +5.9%

32. Atlantic City-Hammonton, NJ metro area
> Avg. total moving cost: $5,751
> 1st month’s rent: $1,497
> Median household income: $61,212
> Population change from migration (2010-2018): -4.7%
[in-text-ad-2]

31. Midland, TX metro area
> Avg. total moving cost: $5,797
> 1st month’s rent: $1,606
> Median household income: $80,747
> Population change from migration (2010-2018): +15.7%
30. Olympia-Tumwater, WA metro area
> Avg. total moving cost: $5,803
> 1st month’s rent: $1,546
> Median household income: $72,703
> Population change from migration (2010-2018): +10.2%
[in-text-ad]

29. Trenton, NJ metro area
> Avg. total moving cost: $5,809
> 1st month’s rent: $1,416
> Median household income: $80,632
> Population change from migration (2010-2018): -2.3%
[recirclink id=545465]

28. Baltimore-Columbia-Towson, MD metro area
> Avg. total moving cost: $5,831
> 1st month’s rent: $1,568
> Median household income: $80,469
> Population change from migration (2010-2018): +0.5%
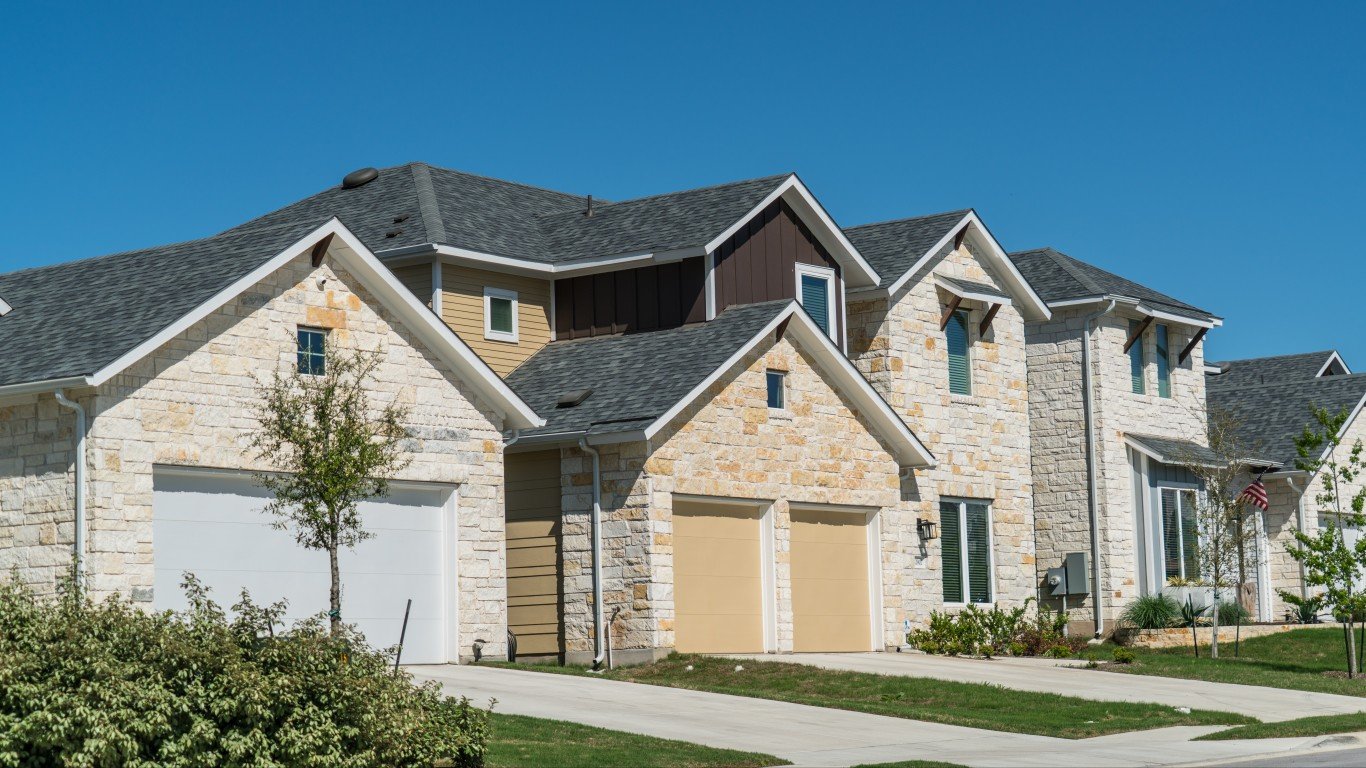
27. Austin-Round Rock, TX metro area
> Avg. total moving cost: $5,833
> 1st month’s rent: $1,601
> Median household income: $76,925
> Population change from migration (2010-2018): +18.1%
[in-text-ad-2]
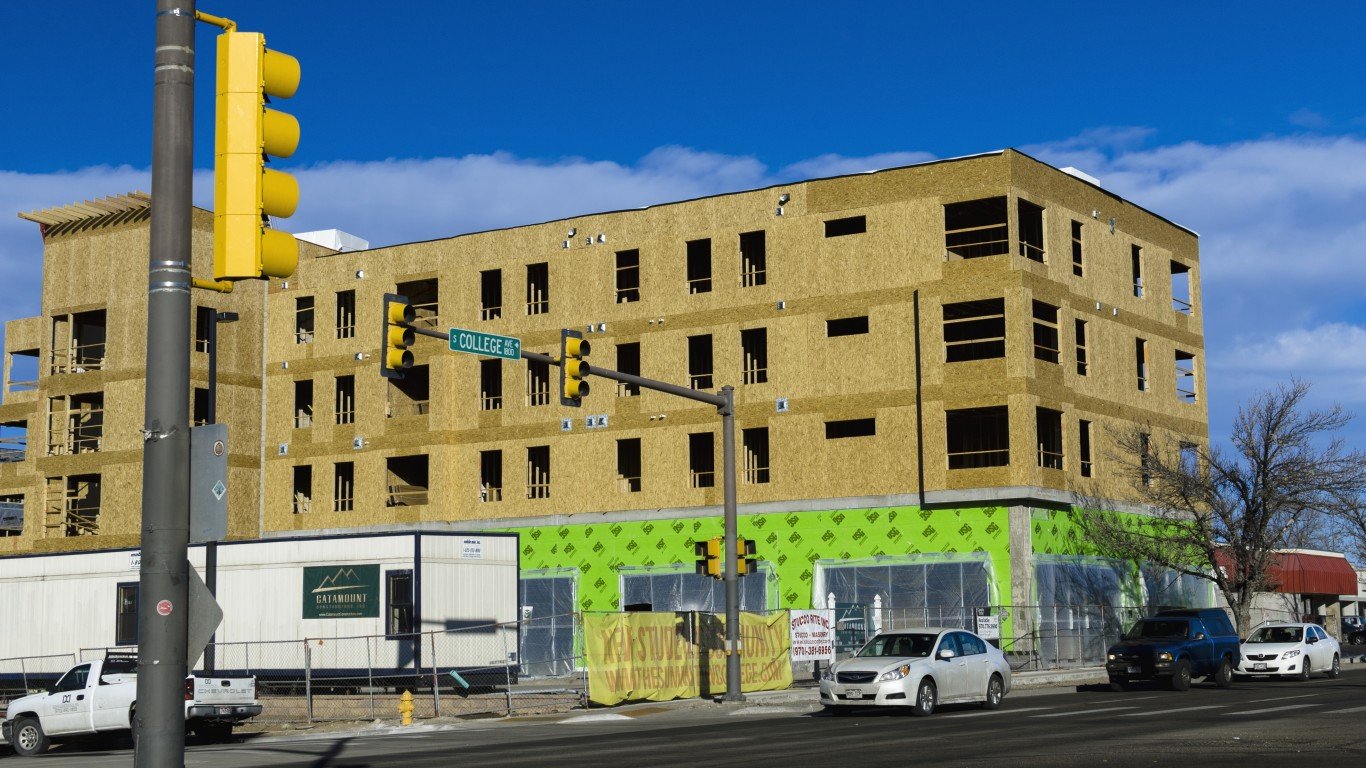
26. Fort Collins, CO metro area
> Avg. total moving cost: $5,954
> 1st month’s rent: $1,632
> Median household income: $71,091
> Population change from migration (2010-2018): +13.2%
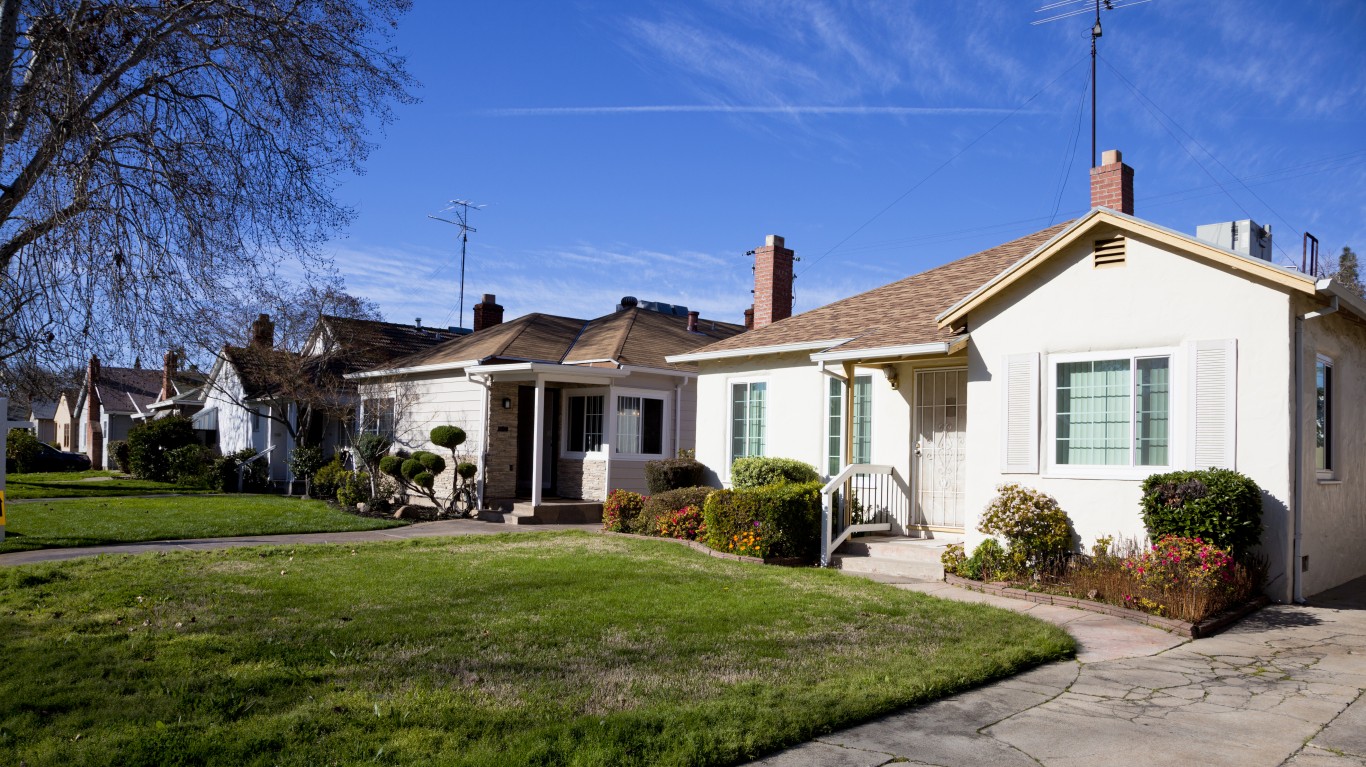
25. Sacramento–Roseville–Arden-Arcade, CA metro area
> Avg. total moving cost: $5,972
> 1st month’s rent: $1,647
> Median household income: $73,142
> Population change from migration (2010-2018): +5.1%
[in-text-ad]
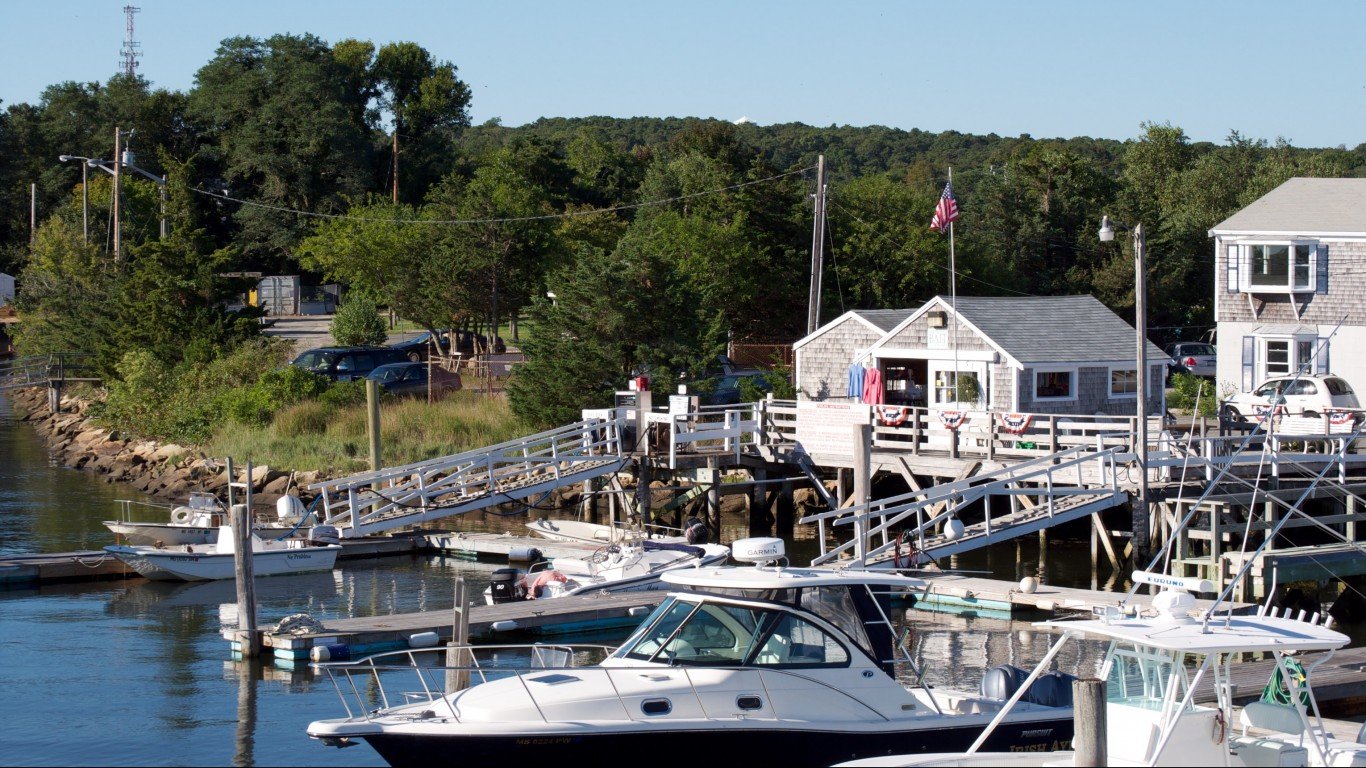
24. Barnstable Town, MA metro area
> Avg. total moving cost: $5,976
> 1st month’s rent: $1,645
> Median household income: $68,902
> Population change from migration (2010-2018): +4.0%
[recirclink id=570248]
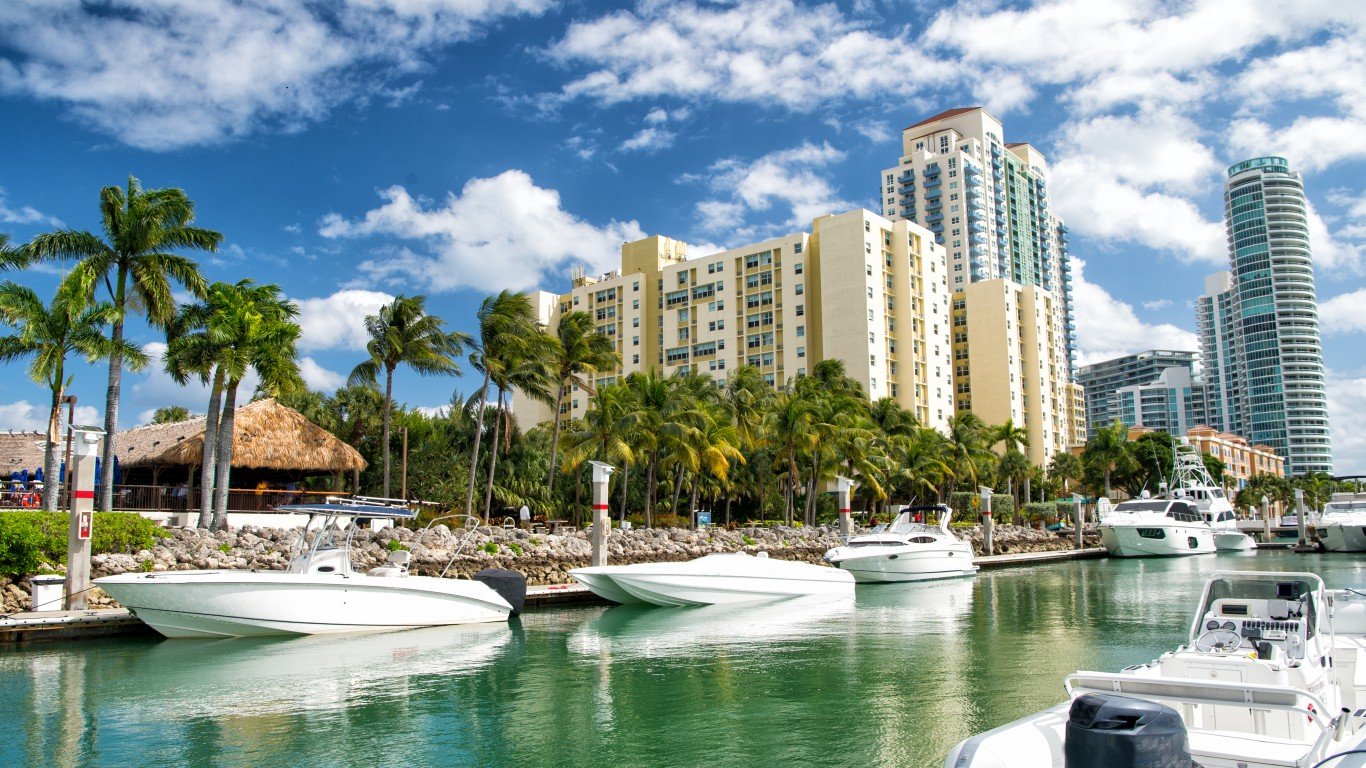
23. Miami-Fort Lauderdale-West Palm Beach, FL metro area
> Avg. total moving cost: $6,068
> 1st month’s rent: $1,700
> Median household income: $56,328
> Population change from migration (2010-2018): +8.5%

22. Portland-Vancouver-Hillsboro, OR-WA metro area
> Avg. total moving cost: $6,084
> 1st month’s rent: $1,672
> Median household income: $75,599
> Population change from migration (2010-2018): +7.3%
[in-text-ad-2]
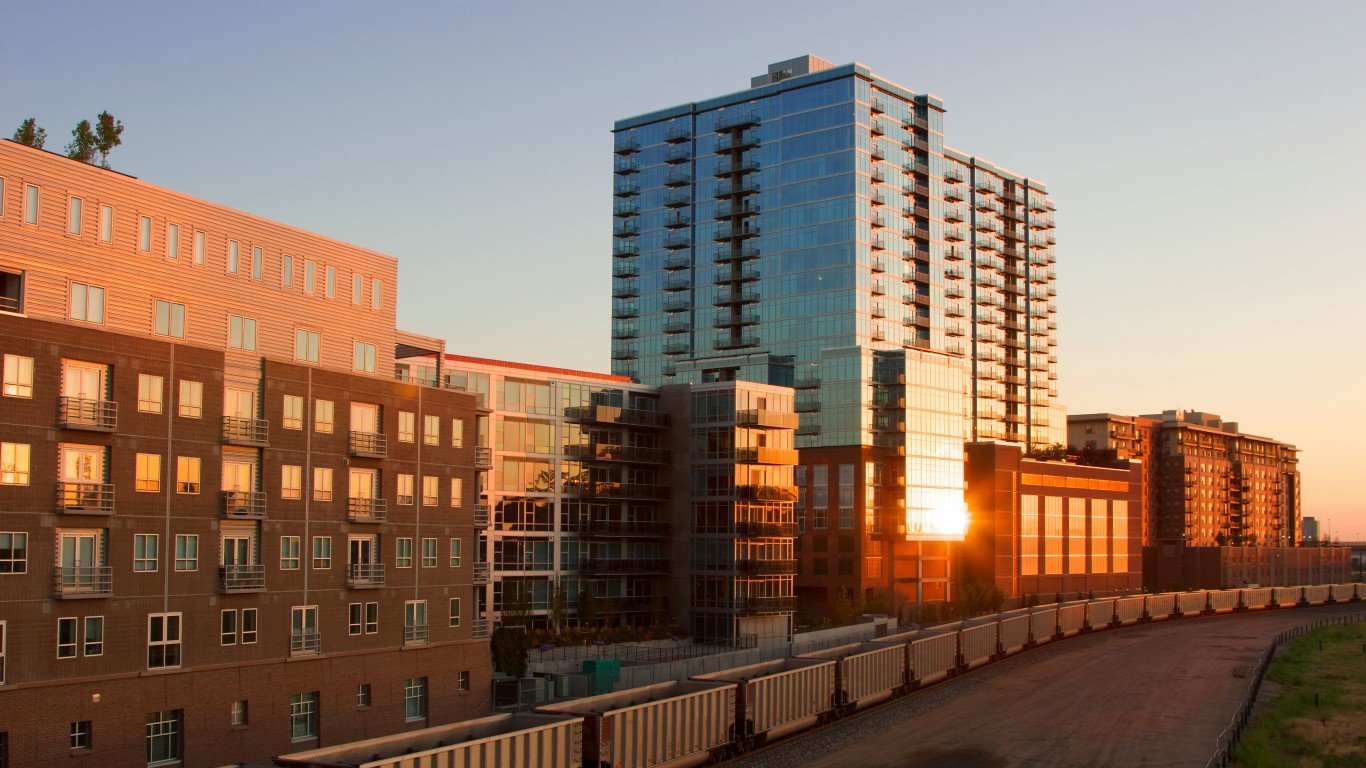
21. Denver-Aurora-Lakewood, CO metro area
> Avg. total moving cost: $6,271
> 1st month’s rent: $1,786
> Median household income: $79,478
> Population change from migration (2010-2018): +9.3%

20. Boston-Cambridge-Newton, MA-NH metro area
> Avg. total moving cost: $6,288
> 1st month’s rent: $1,761
> Median household income: $88,711
> Population change from migration (2010-2018): +4.3%
[in-text-ad]
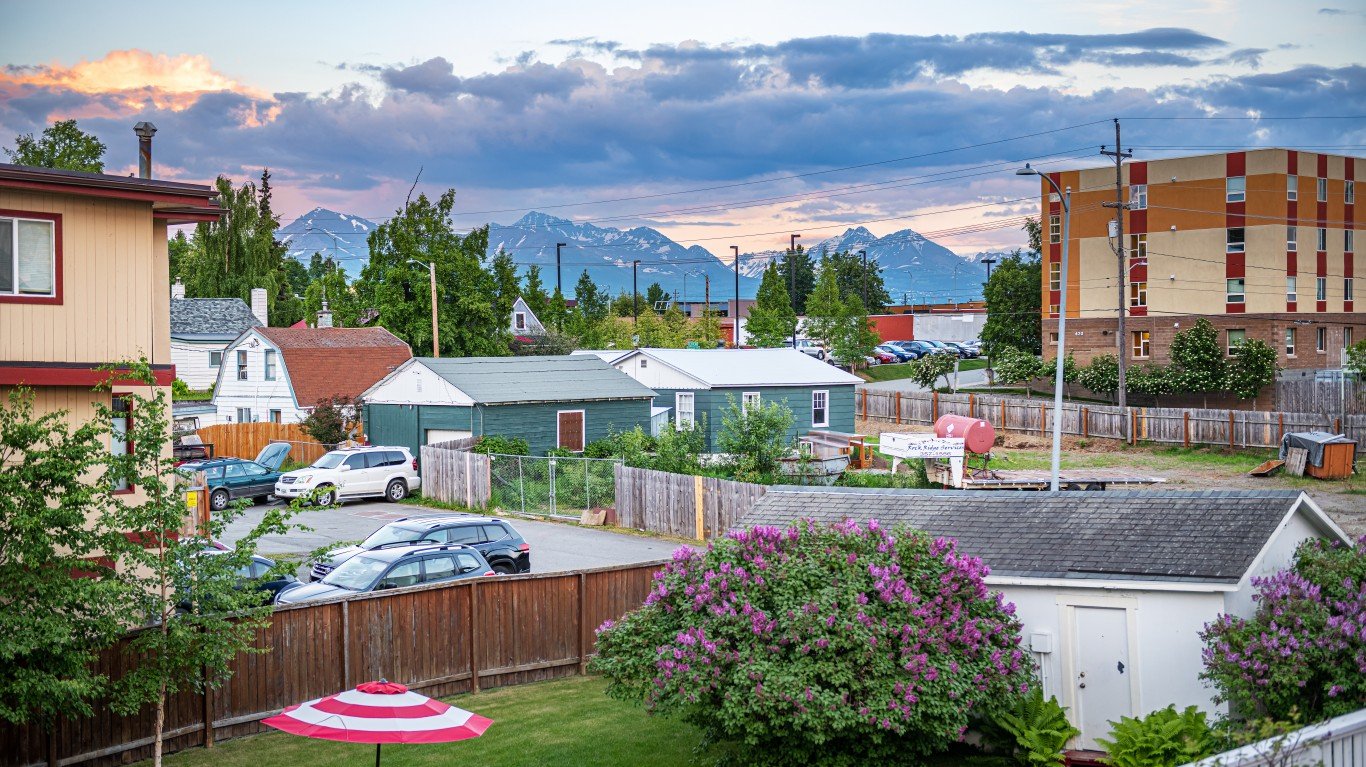
19. Anchorage, AK metro area
> Avg. total moving cost: $6,305
> 1st month’s rent: $1,674
> Median household income: $81,037
> Population change from migration (2010-2018): -3.6%
[recirclink id=515366]

18. Salinas, CA metro area
> Avg. total moving cost: $6,421
> 1st month’s rent: $1,854
> Median household income: $70,681
> Population change from migration (2010-2018): -3.0%
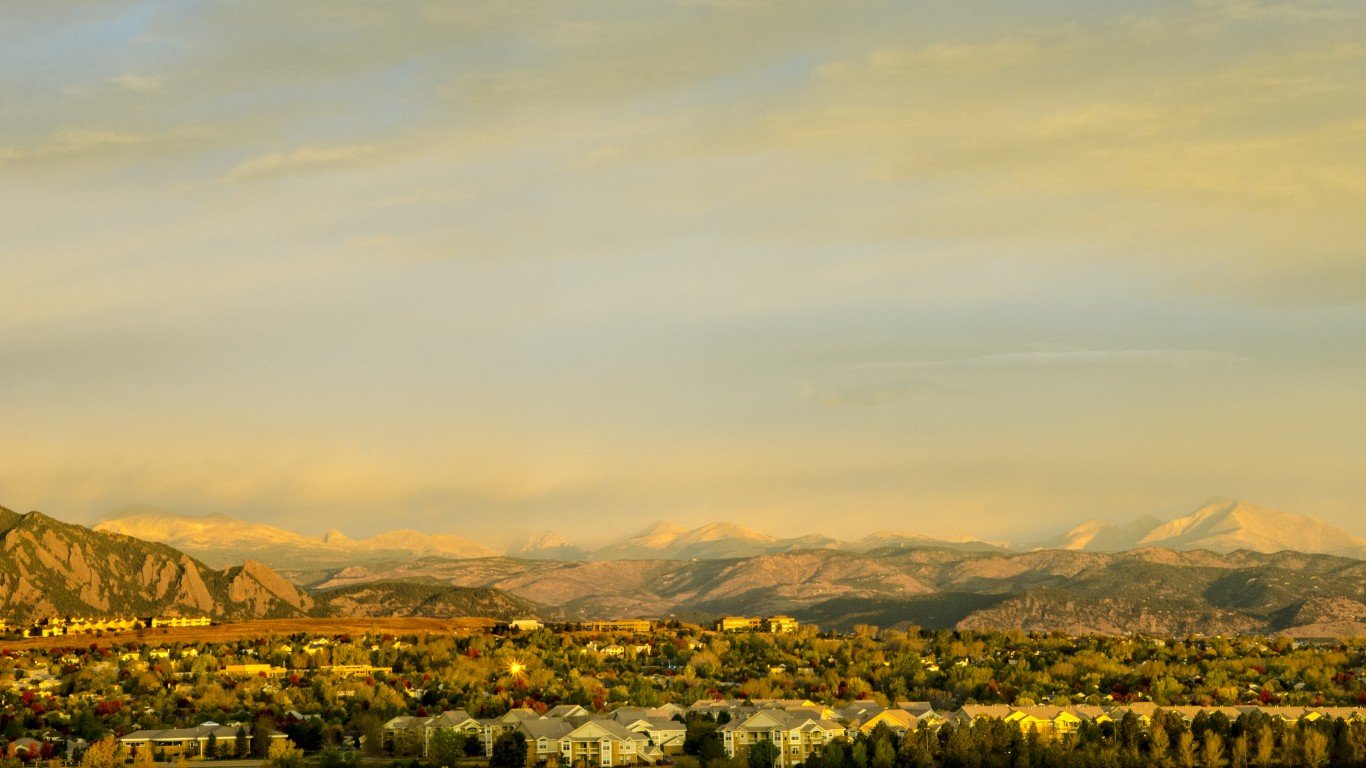
17. Boulder, CO metro area
> Avg. total moving cost: $6,432
> 1st month’s rent: $1,871
> Median household income: $83,755
> Population change from migration (2010-2018): +7.4%
[in-text-ad-2]

16. Seattle-Tacoma-Bellevue, WA metro area
> Avg. total moving cost: $6,448
> 1st month’s rent: $1,862
> Median household income: $87,910
> Population change from migration (2010-2018): +9.2%
15. Bridgeport-Stamford-Norwalk, CT metro area
> Avg. total moving cost: $6,479
> 1st month’s rent: $1,751
> Median household income: $91,079
> Population change from migration (2010-2018): -0.1%
[in-text-ad]

14. Washington-Arlington-Alexandria, DC-VA-MD-WV metro area
> Avg. total moving cost: $6,544
> 1st month’s rent: $1,904
> Median household income: $102,180
> Population change from migration (2010-2018): +4.0%
[recirclink id=562217]
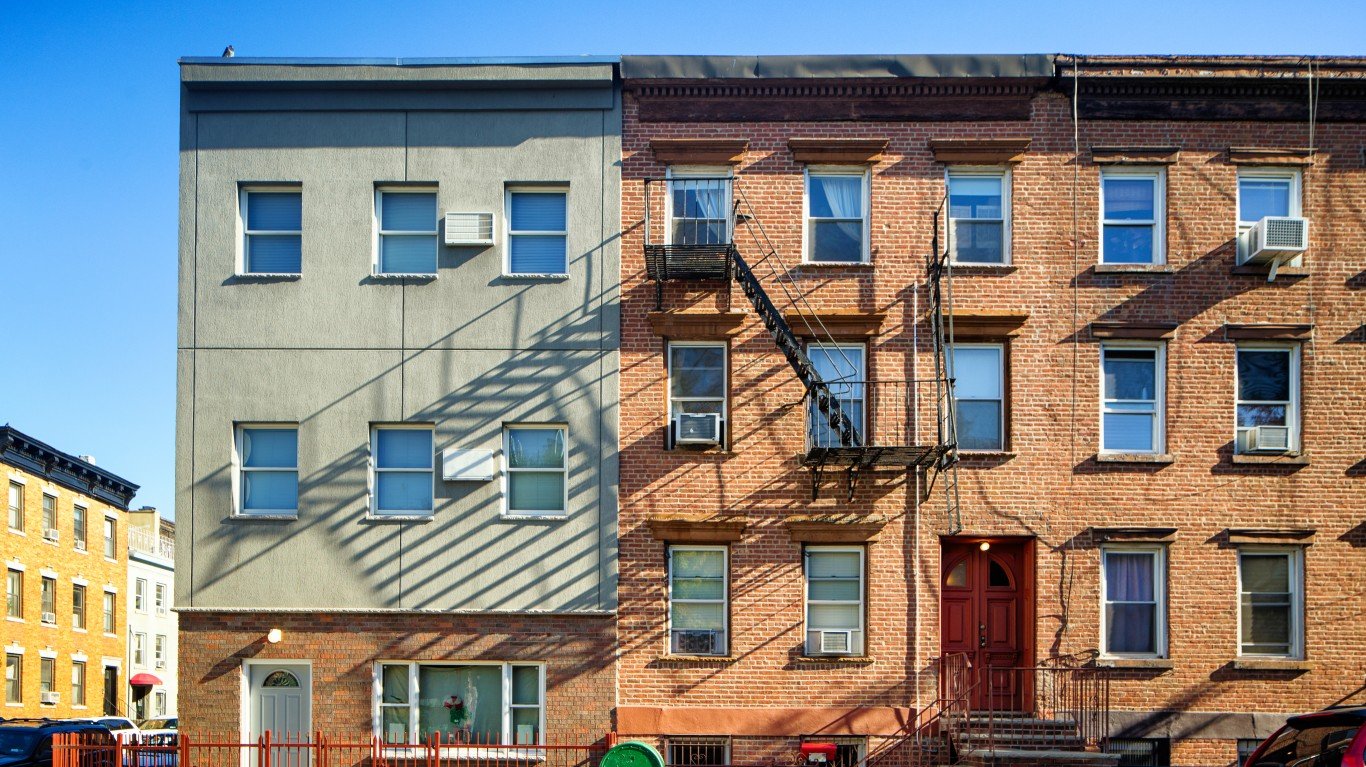
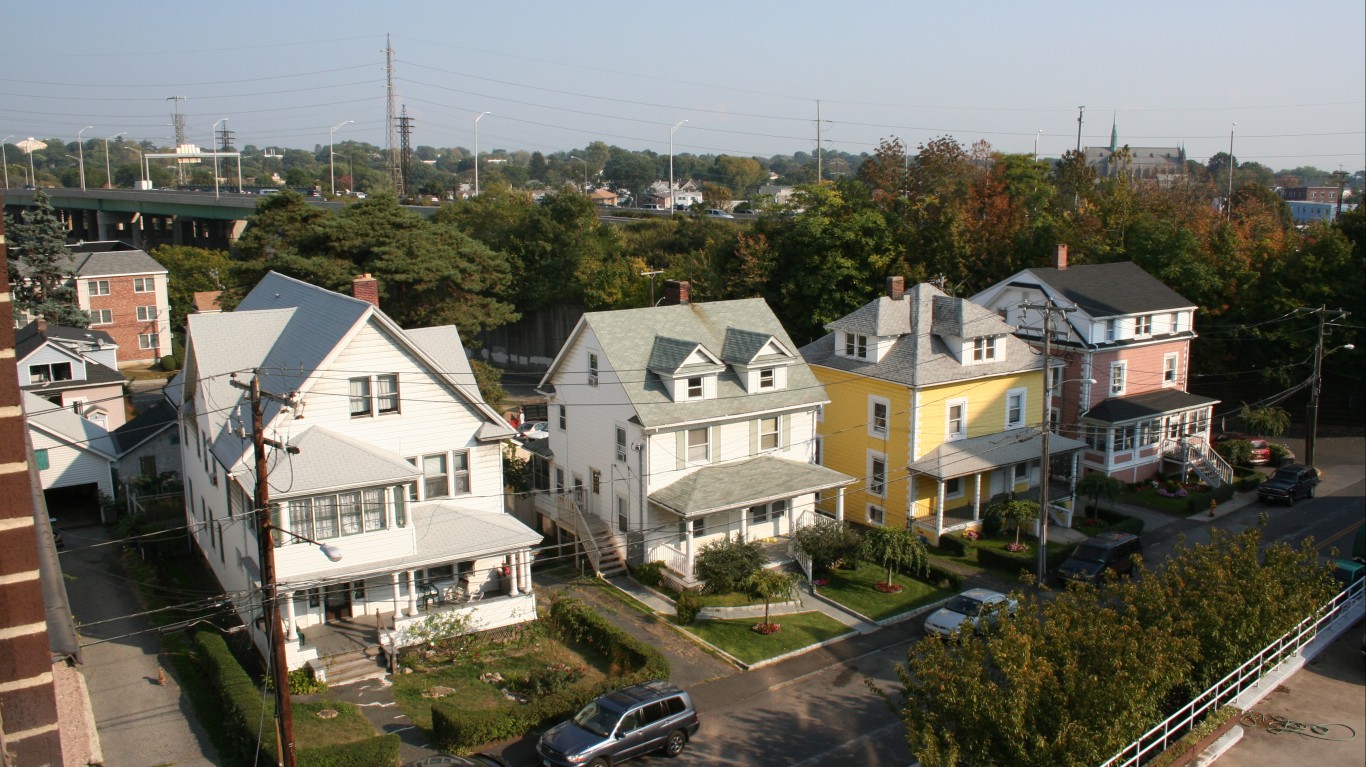
13. New York-Newark-Jersey City, NY-NJ-PA metro area
> Avg. total moving cost: $6,554
> 1st month’s rent: $1,698
> Median household income: $78,478
> Population change from migration (2010-2018): -2.3%
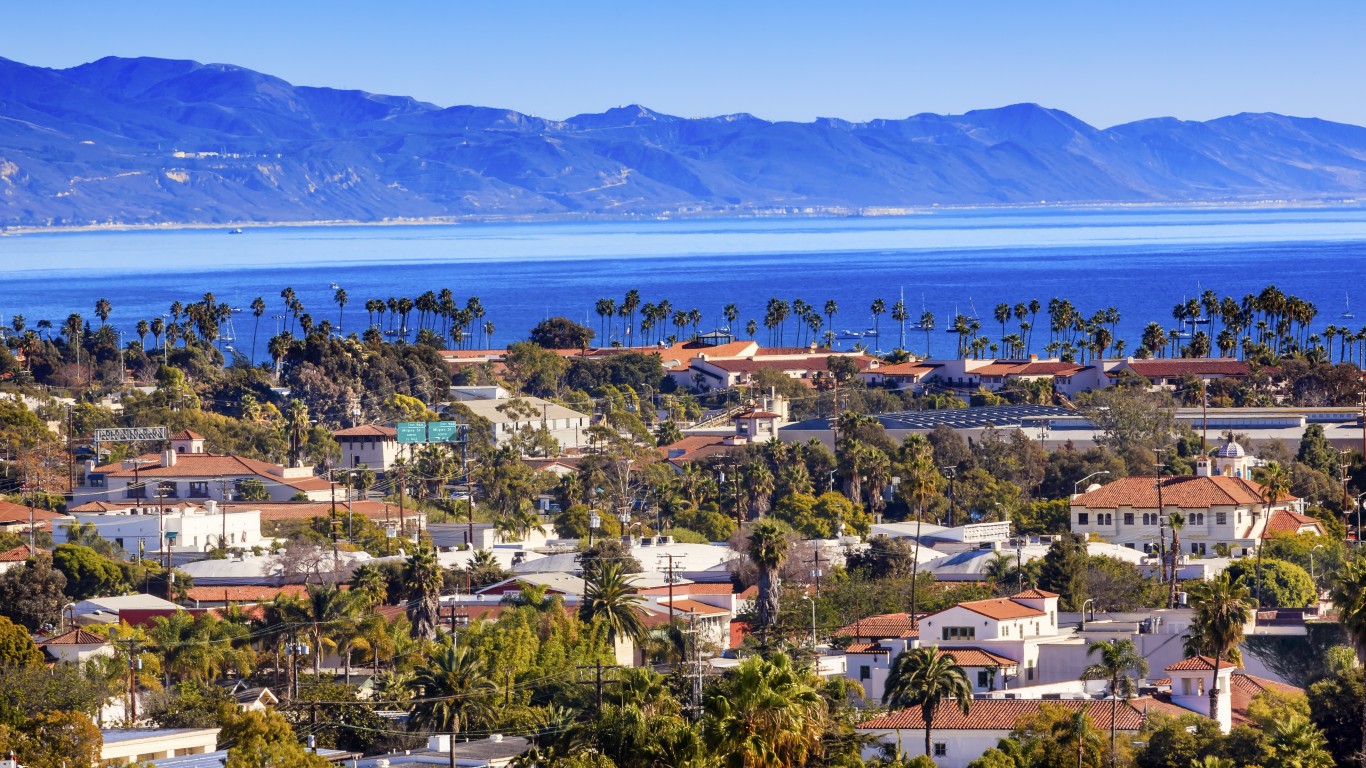
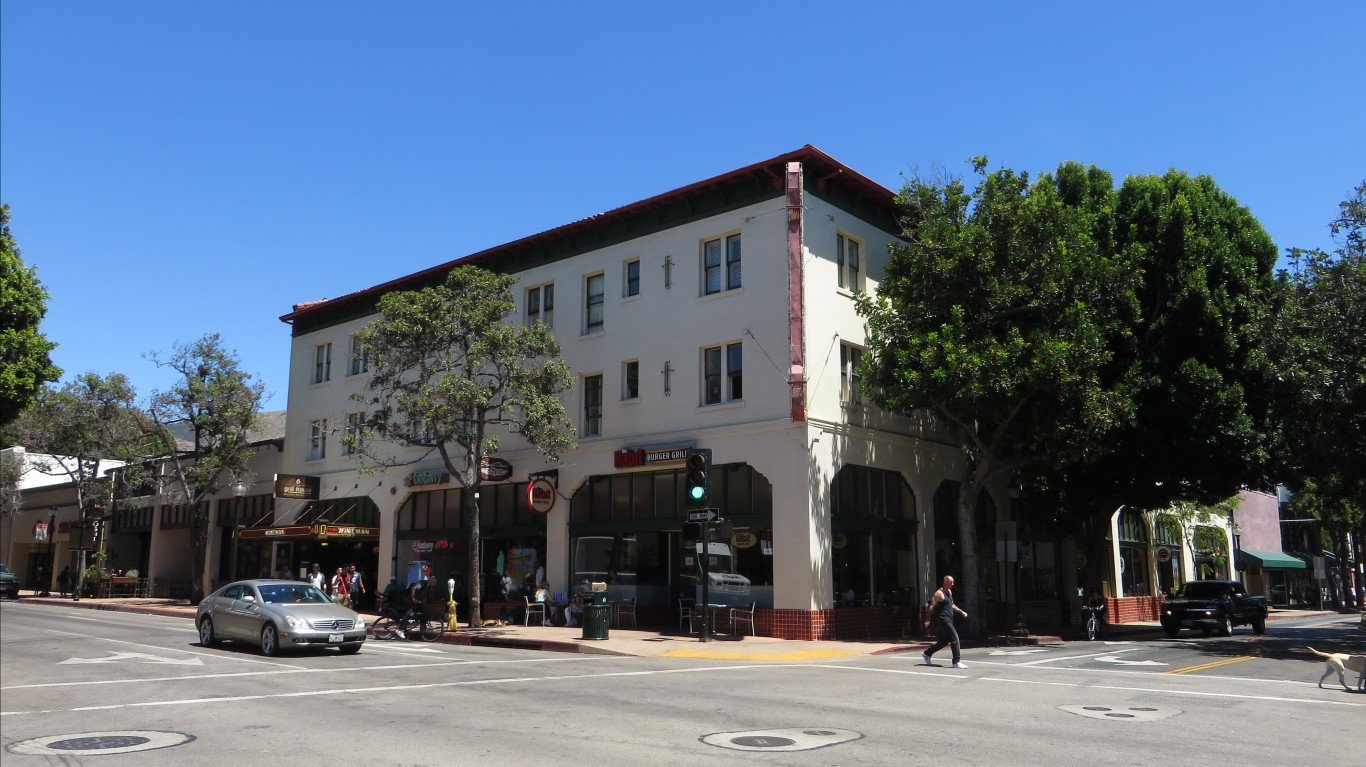
12. Santa Maria-Santa Barbara, CA metro area
> Avg. total moving cost: $6,561
> 1st month’s rent: $1,898
> Median household income: $77,472
> Population change from migration (2010-2018): +0.3%
[in-text-ad-2]
11. San Luis Obispo-Paso Robles-Arroyo Grande, CA metro area
> Avg. total moving cost: $6,643
> 1st month’s rent: $1,939
> Median household income: $71,148
> Population change from migration (2010-2018): +4.5%
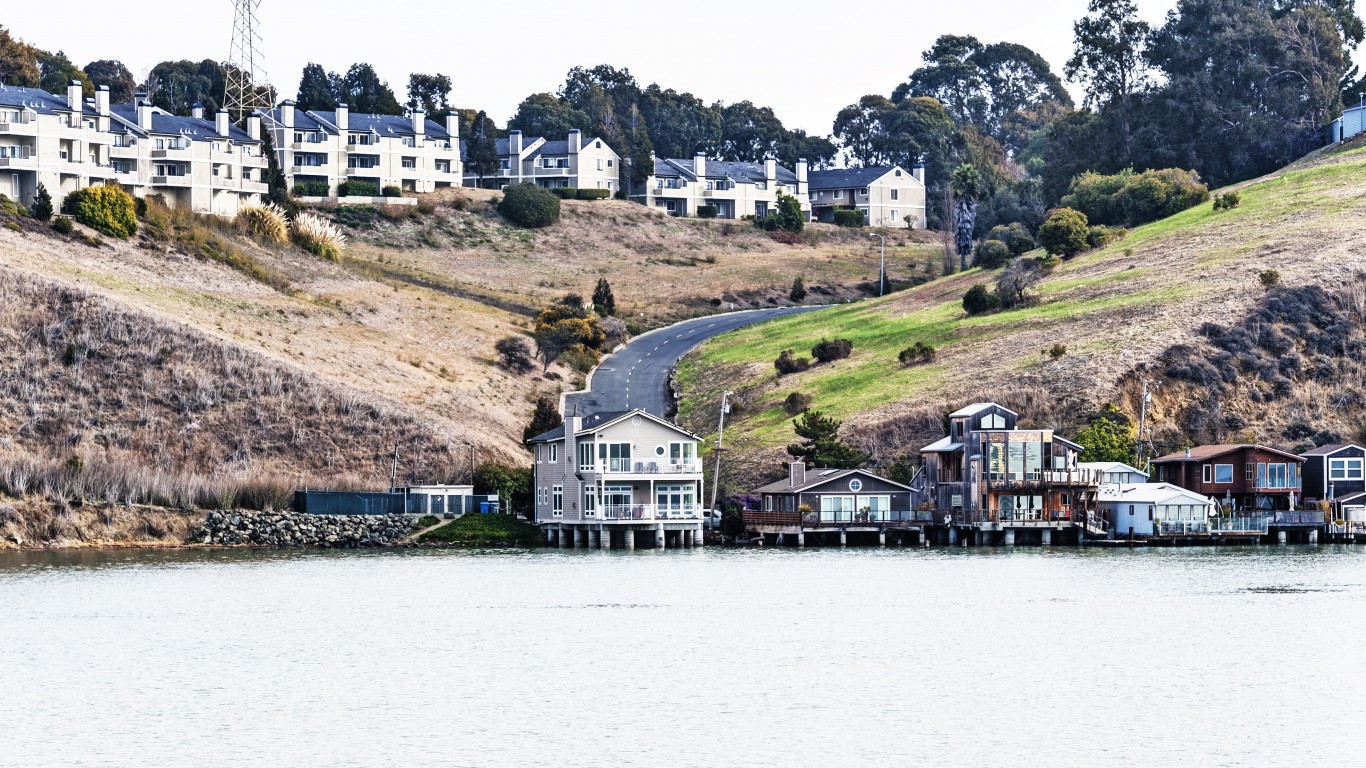
10. Vallejo-Fairfield, CA metro area
> Avg. total moving cost: $6,652
> 1st month’s rent: $1,946
> Median household income: $84,395
> Population change from migration (2010-2018): +4.1%
[in-text-ad]

9. Fairbanks, AK metro area
> Avg. total moving cost: $6,669
> 1st month’s rent: $1,856
> Median household income: $75,448
> Population change from migration (2010-2018): -9.0%
[recirclink id=577072]
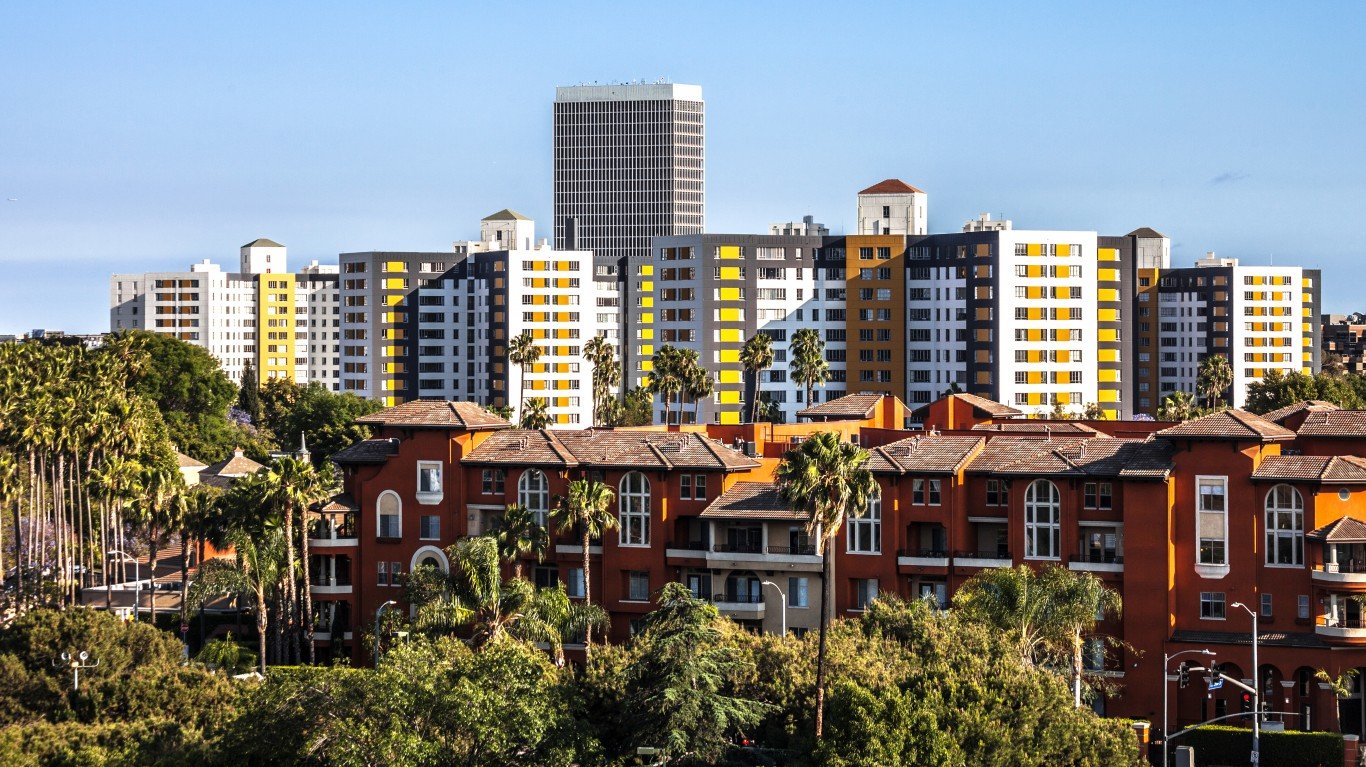
8. Los Angeles-Long Beach-Anaheim, CA metro area
> Avg. total moving cost: $6,808
> 1st month’s rent: $2,023
> Median household income: $72,563
> Population change from migration (2010-2018): -1.8%

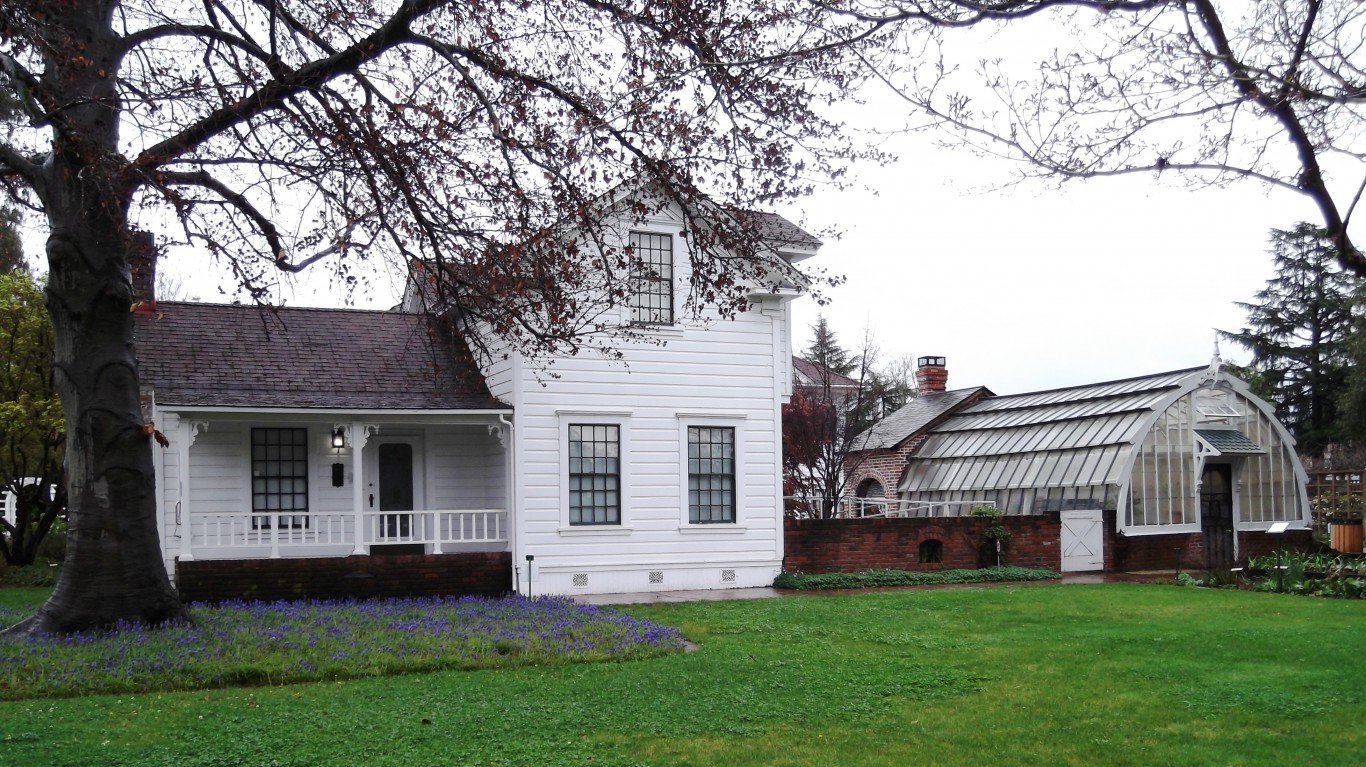
7. Santa Cruz-Watsonville, CA metro area
> Avg. total moving cost: $6,852
> 1st month’s rent: $2,046
> Median household income: $86,941
> Population change from migration (2010-2018): +0.8%
[in-text-ad-2]

5. Napa, CA metro area
> Avg. total moving cost: $6,968
> 1st month’s rent: $2,104
> Median household income: $87,025
> Population change from migration (2010-2018): +0.8%
5. Santa Rosa, CA metro area
> Avg. total moving cost: $6,968
> 1st month’s rent: $2,104
> Median household income: $81,395
> Population change from migration (2010-2018): +1.7%
[in-text-ad]
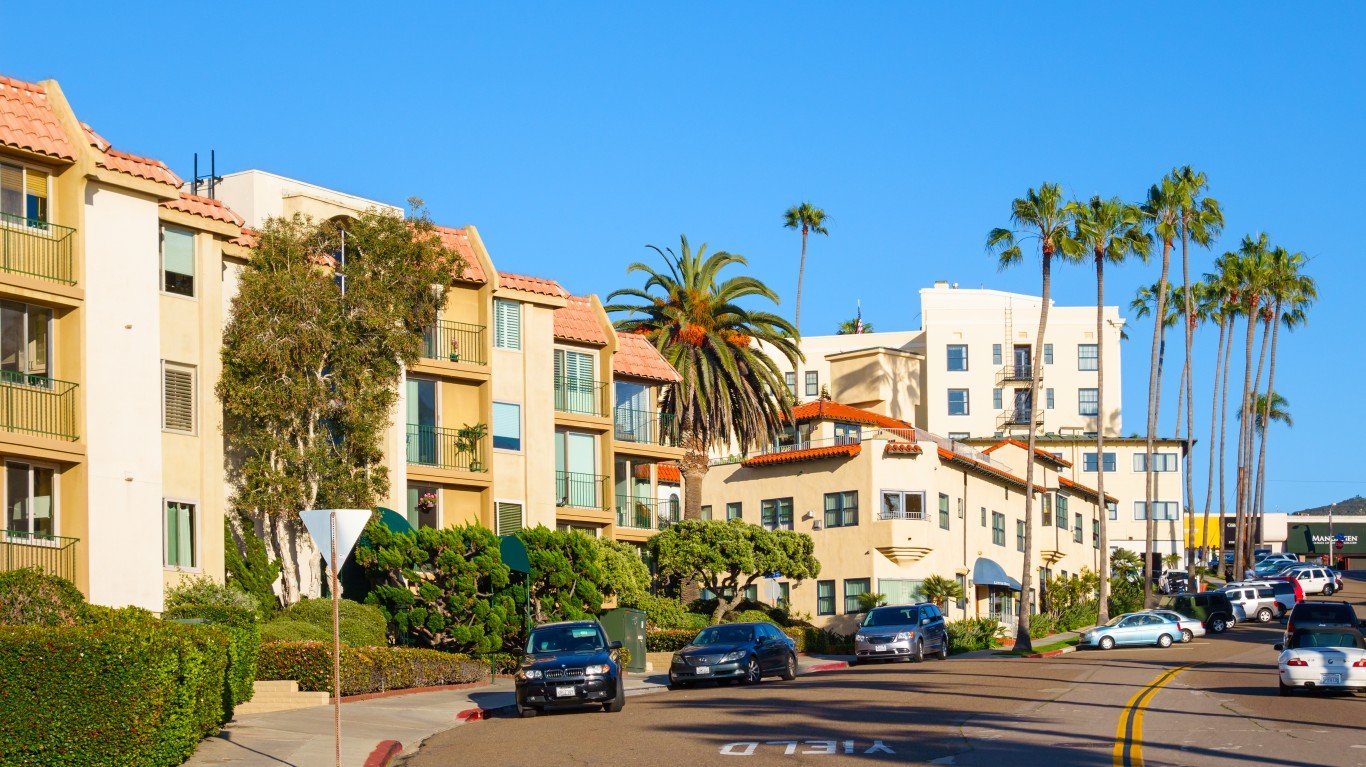
4. San Diego-Carlsbad, CA metro area
> Avg. total moving cost: $7,068
> 1st month’s rent: $2,136
> Median household income: $79,079
> Population change from migration (2010-2018): +2.1%
[recirclink id=545465]
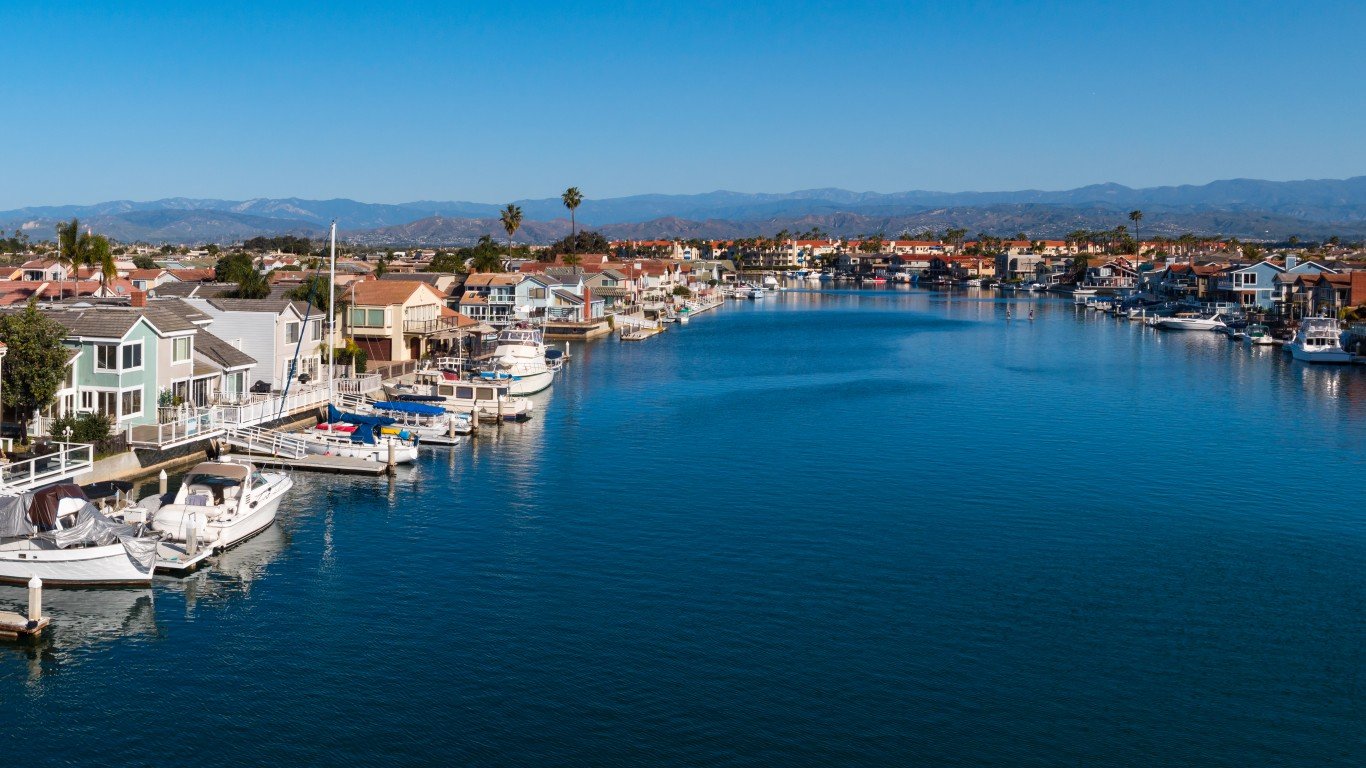
3. Oxnard-Thousand Oaks-Ventura, CA metro area
> Avg. total moving cost: $7,089
> 1st month’s rent: $2,162
> Median household income: $84,566
> Population change from migration (2010-2018): -1.3%

2. San Francisco-Oakland-Hayward, CA metro area
> Avg. total moving cost: $7,513
> 1st month’s rent: $2,374
> Median household income: $107,898
> Population change from migration (2010-2018): +4.9%
[in-text-ad-2]
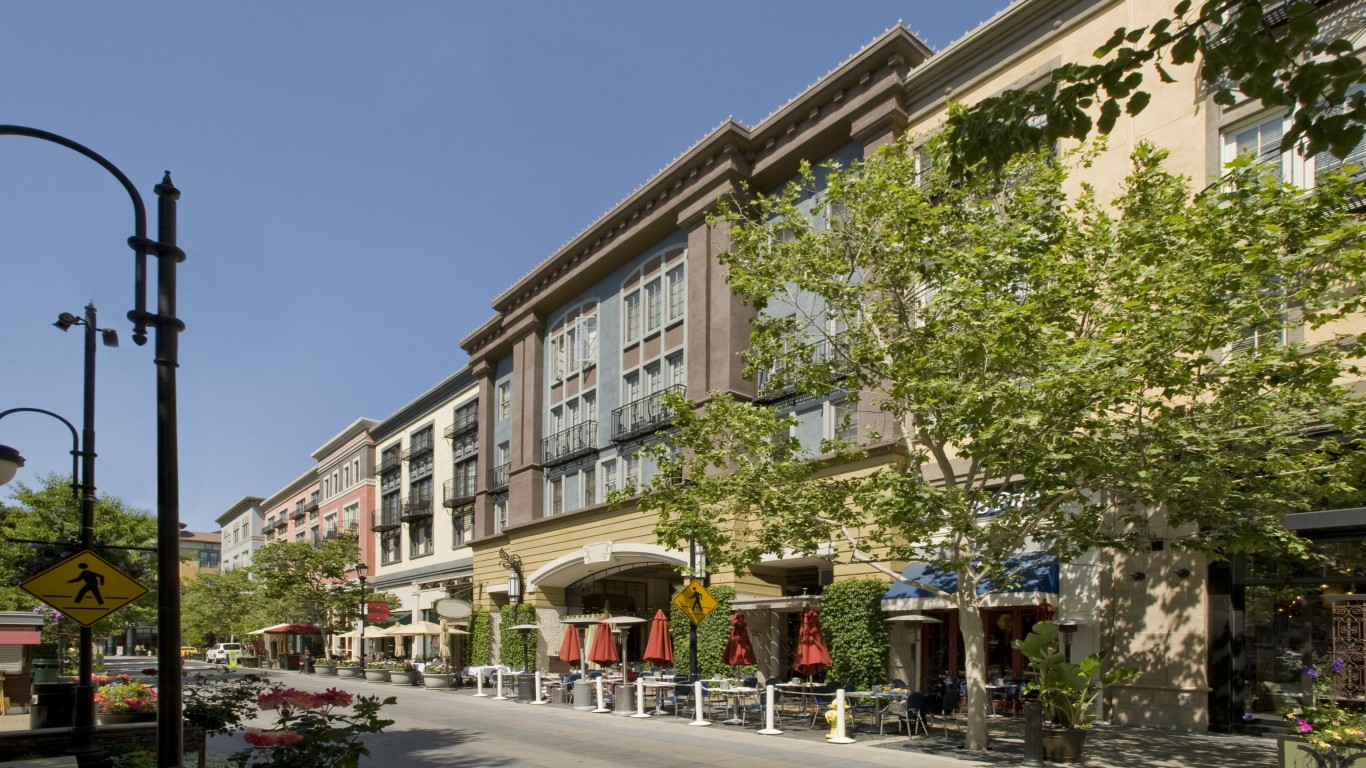
1. San Jose-Sunnyvale-Santa Clara, CA metro area
> Avg. total moving cost: $8,402
> 1st month’s rent: $2,821
> Median household income: $124,696
> Population change from migration (2010-2018): +2.7%
Methodology
To determine the 35 most expensive cities to move, 24/7 Wall St. calculated the total cost of moving, one month’s rent, and a security deposit for all U.S. metropolitan statistical areas. Data on estimated moving cost with two-week’s’ notice for a three-bedroom housing unit as of Jan. 30, 2020, came from HomeFair, a part of Move, Inc., a relocation planning resource, and is for the most populous zip code in the most populous principal city of each metro area. Packing costs were not included in the estimate. Data on the median price of rent for a three-bedroom housing unit, which was used as a proxy for both the cost of one month’s rent and security deposit, came from the U.S. Census Bureau’s 2018 American Community Survey and is at the MSA level. Data on median annual household income and population change due to net migration from 2010 to 2018 also came from the Census Bureau. No moving data was available for Hawaii MSAs.
Contact [email protected] for any questions or corrections.