[cnxvideo id=”893014″ placement=”ros”]
Starting a business can be very challenging. According to the U.S. Small Business Administration, about half of all new businesses fail within their first five years. There are countless factors that can undermine a company’s chances for success and ultimately doom it. While most of these factors — such as those related to product quality, pricing, and planning — can be blamed on poor management, a business’s chances for success can also depend on outside factors.
Across the United States, the environment in which businesses operate can vary considerably. Factors like regional policy, tax codes, infrastructure reliability, availability of skilled workers, and operation costs, among others, differ from one state to the next.
24/7 Wall St. created a weighted index of 42 measures to identify the best and worst states for business. These measures fall into one of eight categories: economic conditions, business costs, state infrastructure, the availability and skill level of the workforce, quality of life, regulations, technology and innovation, and cost of living. Data sources include the Bureau of Economic Analysis, the Bureau of Labor Statistics, and the Tax Foundation, a tax policy research organization.
While some states rank better than others for their overall business climate, every state has room for improvement, and usually states that share strengths in certain parts of our index also tend to also have weaknesses in other aspects of our index. For example, while a state like Massachusetts may have a skilled talent pool as measured by educational attainment, it also has a high cost of living that can force employers to pay more for that talent. These are America’s most and least educated states.
Click here to see the best and worst states for business
Click here to read our methodology

1. Massachusetts
> 1-yr. real GDP change: +3.1% (13th best)
> Avg. earnings per job: $75,637 (2nd highest)
> Adults with a bachelor’s degree: 44.5% (the highest)
> 2018 venture capital deals: 9.6 per 100,000 people (the most)
With a well-educated workforce and a high concentration of innovative startups, Massachusetts ranks as the best state for business. Of all adults 25 or older in the state, 44.5% have a bachelor’s degree or higher. Additionally, there were 660 venture capital deals in the state in 2018, or 9.6 for every 100,000 people, the highest rate of VC deals per capita of any state.
Massachusetts-based businesses and organizations were also granted over 7,600 patents in 2018, or 111.4 per 100,000 people, the most of any state and well above the national average rate of 49.5 patents per 100,000.
[in-text-ad]

2. Utah
> 1-yr. real GDP change: +3.7% (8th best)
> Avg. earnings per job: $52,364 (14th lowest)
> Adults with a bachelor’s degree: 34.9% (13th highest)
> 2018 venture capital deals: 3.4 per 100,000 people (8th most)
Four of the top five states for business are located west of the Mississippi River, and of them, Utah ranks the highest. Startup companies in the state are also drawing far more venture capital investment than those in most other states. Utah companies drew in nearly $1.2 billion in VC funding in 2018, equal to $369 per state resident, more per capita than all but four other states.
[recirclink id=557787]

3. Colorado
> 1-yr. real GDP change: +3.5% (10th best)
> Avg. earnings per job: $61,617 (15th highest)
> Adults with a bachelor’s degree: 41.7% (2nd highest)
> 2018 venture capital deals: 5.0 per 100,000 people (4th most)
Colorado ranks just behind its neighbor, Utah, among the best states for business. As one of the top states, Colorado boasts a highly-educated workforce. Nearly 42% of adults in the state have a bachelor’s degree or higher, well above the 32.6% share of adults nationwide. There will also not likely be a shortage of labor in the state anytime soon. Over the next decade, the number of working-age state residents is projected to climb by 10.5%, more than double the comparable projected national growth rate of 4.6%.

4. Washington
> 1-yr. real GDP change: +5.8% (the best)
> Avg. earnings per job: $71,390 (5th highest)
> Adults with a bachelor’s degree: 36.7% (10th highest)
> 2018 venture capital deals: 4.9 per 100,000 people (6th most)
Businesses in Washington likely benefit from lower costs of operation in some areas. For example, the average price of electricity in the state is 8 cents per kilowatt-hour, less than in all but two other states. The tax climate in the state is also more favorable to businesses than in most other states, according to analysis conducted by the Tax Foundation.
Washington’s economy expanded by 5.8% between 2017 and 2018, more than any other state economy in the country. The state’s tech sector likely was partially responsible for this growth. There were about 99 patents granted in the state for every 100,000 people in 2018, nearly double the comparable national rate of 50 per 100,000.
[in-text-ad-2]

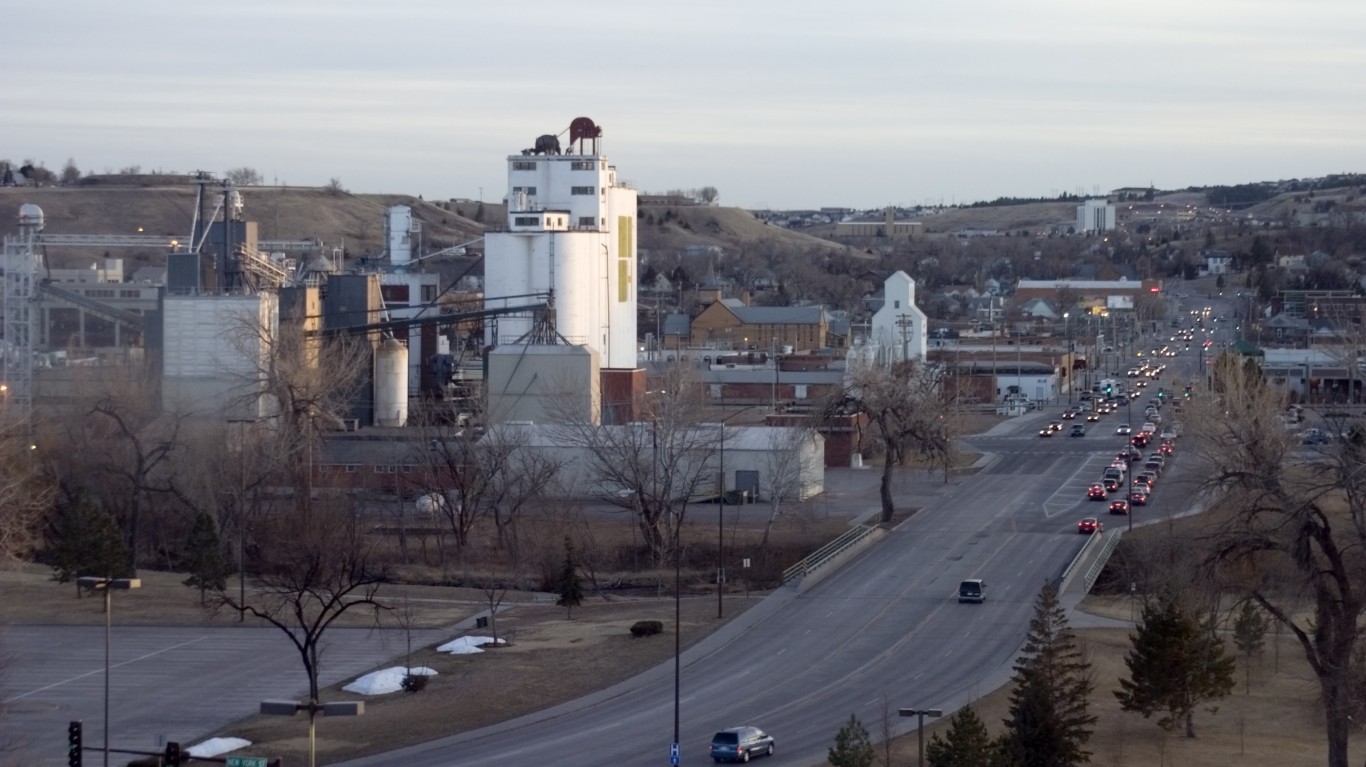
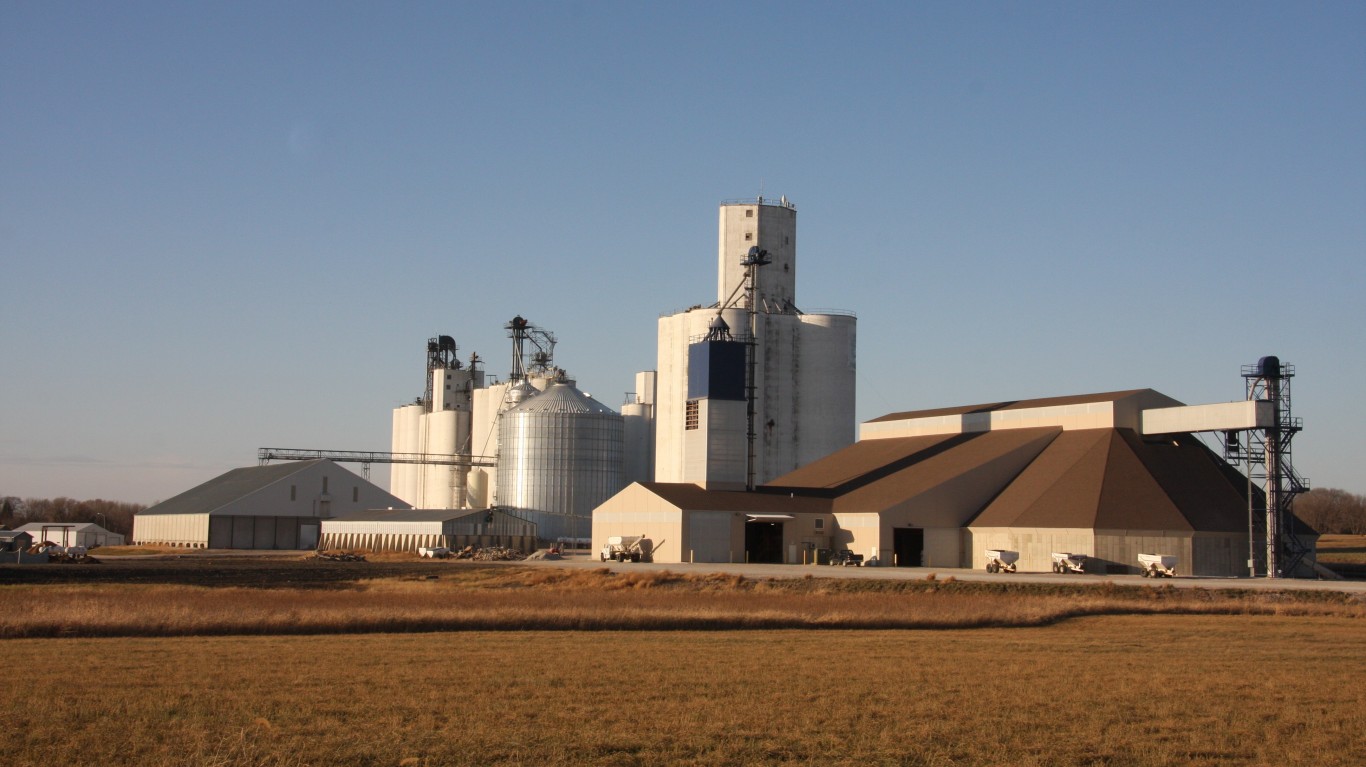
5. North Dakota
> 1-yr. real GDP change: +3.6% (9th best)
> Avg. earnings per job: $56,681 (23rd highest)
> Adults with a bachelor’s degree: 29.7% (21st lowest)
> 2018 venture capital deals: 0.9 per 100,000 people (14th fewest)
North Dakota ranks as the best state for business in the Midwest and fifth best nationwide. Businesses in the state benefit from reliable infrastructure. Just 7.8% of roads are in poor condition, well below the 21.8% share nationwide. Additionally, roadway congestion is less costly to the trucking industry in North Dakota than it is in all but a handful of other states.
According to the U.S. Chamber Institute for Legal Reform’s 2019 Lawsuit Climate Survey, businesses consider North Dakota’s liability systems to be one of the most favorable.

6. North Carolina
> 1-yr. real GDP change: +2.4% (25th best)
> Avg. earnings per job: $55,086 (21st lowest)
> Adults with a bachelor’s degree: 31.9% (20th highest)
> 2018 venture capital deals: 1.8 per 100,000 people (18th most)
North Carolina ranks as the best state for business in the South and the sixth best nationwide. Part of the reason the state ranks so highly is the relatively low cost of doing business. The average retail price of electricity per kilowatt-hour is lower than in most other states and, according to the Tax Foundation, North Carolina has a more favorable business tax climate than most states.
[in-text-ad]

7. Idaho
> 1-yr. real GDP change: +4.0% (6th best)
> Avg. earnings per job: $47,812 (4th lowest)
> Adults with a bachelor’s degree: 27.7% (13th lowest)
> 2018 venture capital deals: 1.5 per 100,000 people (21st most)
Rapid economic growth is partially why Idaho ranks among the top 10 best states for business. Between 2017 and 2018, Idaho’s economy expanded by 4.0%, faster than all but five other states and the comparable national economic growth of 2.9%. Typical earnings for workers in Idaho are relatively low, which means the state may be less attractive to potential workers, but also could mean lower costs for some business owners.
[recirclink id=531165]

8. Virginia
> 1-yr. real GDP change: +2.6% (18th best)
> Avg. earnings per job: $63,281 (11th highest)
> Adults with a bachelor’s degree: 39.3% (6th highest)
> 2018 venture capital deals: 1.7 per 100,000 people (19th most)
Virginia ranks as one of the best states for business thanks in part to its regulatory environment and the presence of technology and innovation in the state. Nearly 9% of workers in the state are employed in STEM fields, the fourth highest share of any state. Virginia also has some of the highest bachelor’s and professional degree attainment rates of any state.

9. Maryland
> 1-yr. real GDP change: +2.5% (24th best)
> Avg. earnings per job: $68,242 (8th highest)
> Adults with a bachelor’s degree: 40.8% (3rd highest)
> 2018 venture capital deals: 2.3 per 100,000 people (12th most)
Employers in Maryland benefit from access to one of the most skilled labor forces in the country. Nearly 41% of adults in the state have a bachelor’s degree or higher, a larger share than in all but two other states. Similarly, 18.9% of adults in Maryland have a graduate or professional degree, the second largest share of any state after Massachusetts.
[in-text-ad-2]

10. Wyoming
> 1-yr. real GDP change: +0.1% (2nd worst)
> Avg. earnings per job: $55,122 (22nd lowest)
> Adults with a bachelor’s degree: 26.9% (9th lowest)
> 2018 venture capital deals: 0.9 per 100,000 people (12th fewest)
Like several of the top 10 best states for business, Wyoming’s high ranking on this list is due in large part to its business costs. The Tax Foundation ranked the state as having the most favorable tax climate for businesses in the country. The state’s infrastructure is also a positive for businesses and workers alike. Wyoming has the shortest average commute time to work, and among the lowest cost to the trucking industry from road congestion.

11. Vermont
> 1-yr. real GDP change: +1.2% (6th worst)
> Avg. earnings per job: $50,054 (6th lowest)
> Adults with a bachelor’s degree: 38.7% (7th highest)
> 2018 venture capital deals: 3.8 per 100,000 people (7th most)
Operating in a state where workers are happy and would be more likely to choose to live there if recruited is important for businesses, and Vermont ranks as the second best state in measures of quality of life. The state has a high concentration of arts, entertainment, and recreation establishments. It also has the second lowest share of residents who lack health insurance and the second lowest violent crime rate.
[in-text-ad]

12. Delaware
> 1-yr. real GDP change: +0.0% (the worst)
> Avg. earnings per job: $61,817 (13th highest)
> Adults with a bachelor’s degree: 31.3% (25th highest)
> 2018 venture capital deals: 5.0 per 100,000 people (5th most)
Delaware’s business climate ranks higher than most states due in part to several measures of innovation. Companies in Delaware drew in 48 venture capital deals in 2018, equal to five for every 100,000 people, more than in all but four other states. Delaware also has some of the most favorable corporate laws in the country. The majority of Fortune 500 companies are incorporated in the state.
[recirclink id=563869]

13. California
> 1-yr. real GDP change: +4.3% (2nd best)
> Avg. earnings per job: $73,815 (4th highest)
> Adults with a bachelor’s degree: 34.2% (15th highest)
> 2018 venture capital deals: 7.7 per 100,000 people (2nd most)
California ranks as the second best state in the country after only Massachusetts in the technology and innovation component of the index. There were over 3,000 venture capital deals in the state in 2018, and even after adjusting for the state’s nation-leading population, California had the second most venture capital deals per capita. The state also had the most total venture capital monetary investment per capita and the second most patent grants awarded per capita that year.
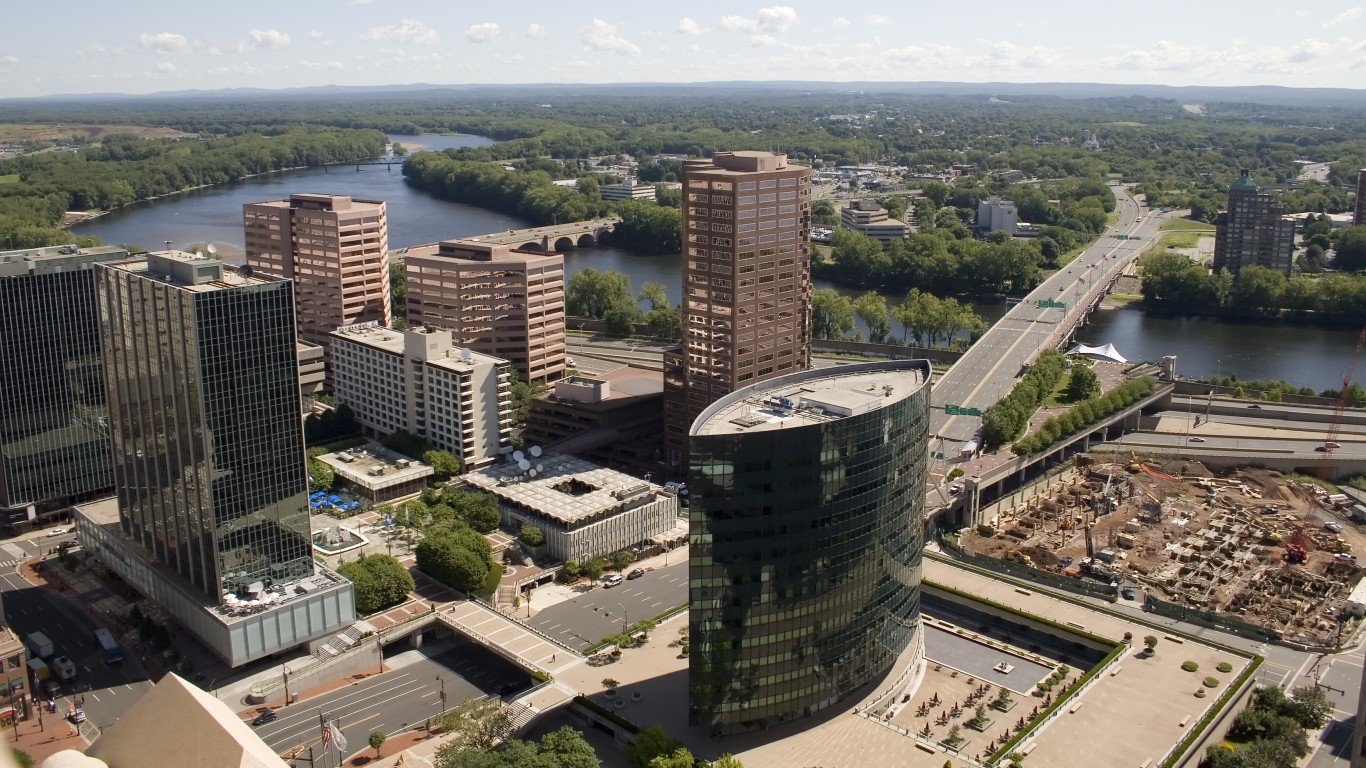
14. Connecticut
> 1-yr. real GDP change: +0.5% (3rd worst)
> Avg. earnings per job: $75,497 (3rd highest)
> Adults with a bachelor’s degree: 39.6% (5th highest)
> 2018 venture capital deals: 2.5 per 100,000 people (9th most)
Connecticut ranks worse than most states in business costs thanks to its business tax climate and utilities prices. But the state ranks as one of the best in terms of quality of life for workers, as well as for having one of the most highly educated workforces, with above average shares of adults with bachelor’s and professional degrees.
[in-text-ad-2]
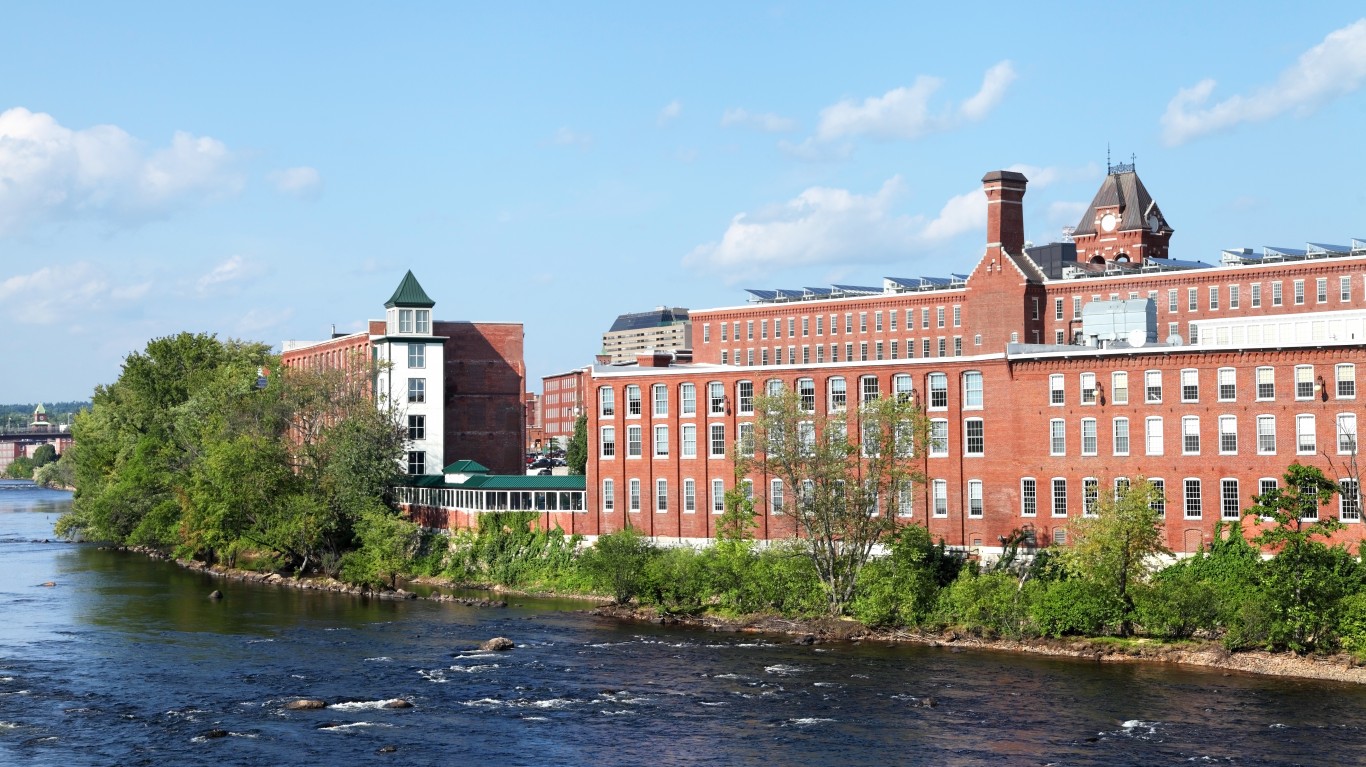
15. New Hampshire
> 1-yr. real GDP change: +2.3% (21st worst)
> Avg. earnings per job: $61,626 (14th highest)
> Adults with a bachelor’s degree: 36.8% (9th highest)
> 2018 venture capital deals: 2.4 per 100,000 people (11th most)
A high quality of life in New Hampshire contributes to the state’s better than average business environment. One of the safest states in the country, New Hampshire has a violent crime rate of just 173 incidents per 100,000 people, the third lowest in the country and well below the national rate of 381 violent crimes per 100,000.

16. Minnesota
> 1-yr. real GDP change: +2.6% (16th best)
> Avg. earnings per job: $61,415 (16th highest)
> Adults with a bachelor’s degree: 36.7% (10th highest)
> 2018 venture capital deals: 2.2 per 100,000 people (14th most)
Minnesota ranks in our index as one of the states where workers are the most likely to be healthy and happy. The state ranks seventh overall in United Health Foundation’s health rankings in 2019, which is likely related to the high health insurance coverage in the state. Just 4.4% of state residents lack health insurance, the fifth smallest share among states and less than half the national share of 8.9%.
[in-text-ad]
17. South Dakota
> 1-yr. real GDP change: +1.9% (13th worst)
> Avg. earnings per job: $50,991 (12th lowest)
> Adults with a bachelor’s degree: 29.2% (17th lowest)
> 2018 venture capital deals: 0.3 per 100,000 people (5th fewest)
Businesses and workers alike in South Dakota benefit from the state’s low cost of living. Goods and services in the state are about 12% less expensive than they are nationwide, on average.
[recirclink id=562217]

18. Texas
> 1-yr. real GDP change: +4.0% (5th best)
> Avg. earnings per job: $61,875 (12th highest)
> Adults with a bachelor’s degree: 30.3% (24th lowest)
> 2018 venture capital deals: 1.5 per 100,000 people (20th most)
The business climate in Texas ranks better than that of most states due largely to pro-business regulations. A so-called right-to-work state, Texas has a lower union membership rate than all but three other states. Additionally, the Texas tax code is more business friendly than that of most other states, according to the Tax Foundation.

19. Montana
> 1-yr. real GDP change: +2.6% (15th best)
> Avg. earnings per job: $46,321 (2nd lowest)
> Adults with a bachelor’s degree: 31.7% (23rd highest)
> 2018 venture capital deals: 1.1 per 100,000 people (22nd fewest)
According to the Tax Foundation’s 2020 State Business Tax Climate Index, Montana has the fifth most favorable tax climate for businesses. The state also ranks relatively well in categories like infrastructure and quality of life. However, the state ranks below average in some measures of technology and innovation, with relatively little venture capital investment in the state, even after adjusting for the state’s small population.
[in-text-ad-2]

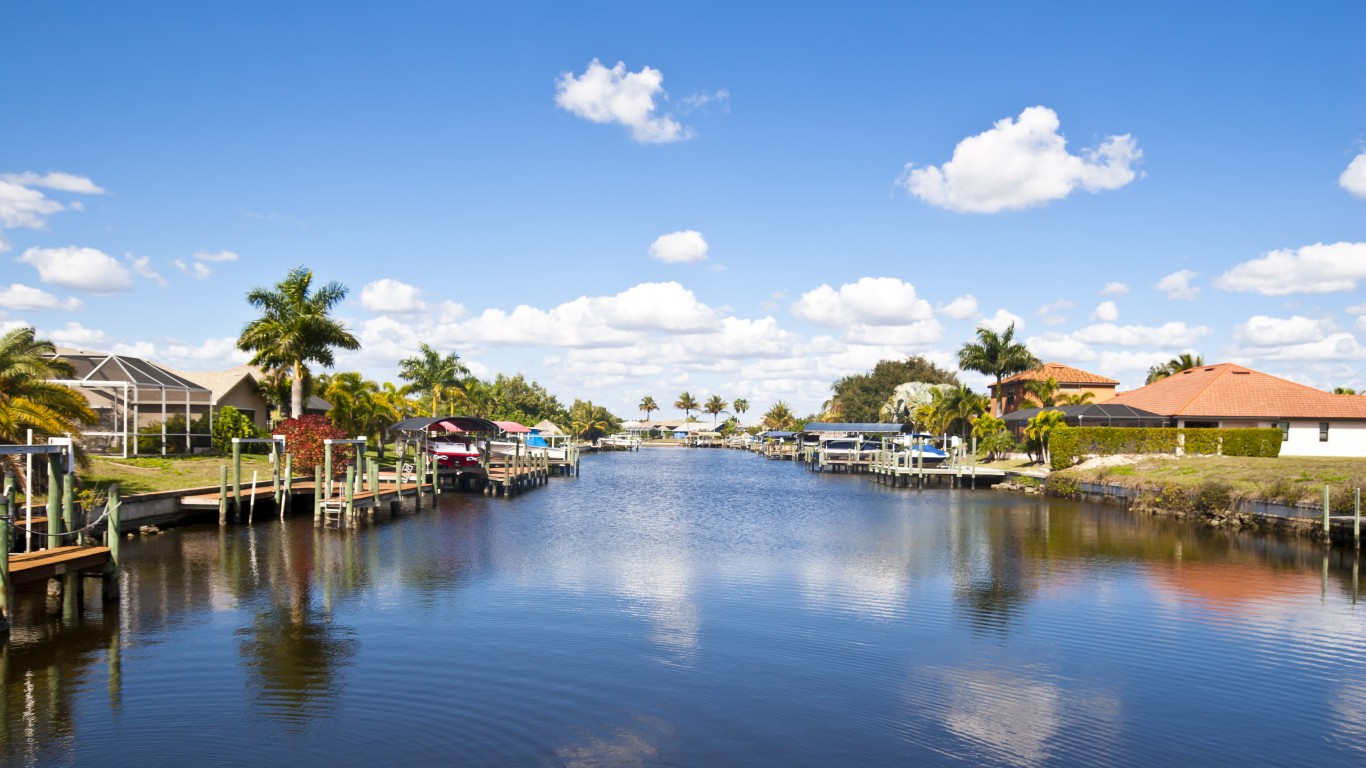
20. Florida
> 1-yr. real GDP change: +3.2% (11th best)
> Avg. earnings per job: $50,879 (10th lowest)
> Adults with a bachelor’s degree: 30.4% (25th lowest)
> 2018 venture capital deals: 1.1 per 100,000 people (19th fewest)
According to the Tax Foundation, Florida has one of the most business friendly tax policies of any state. Employers also benefit from having more control over their workforce. Florida is a right-to-work state, and just 5.6% of the labor force belongs to unions, well below the comparable national share of 10.6%.
21. Iowa
> 1-yr. real GDP change: +2.2% (17th worst)
> Avg. earnings per job: $52,556 (15th lowest)
> Adults with a bachelor’s degree: 29.0% (16th lowest)
> 2018 venture capital deals: 1.1 per 100,000 people (18th fewest)
Iowa has a relatively low cost of living, which both can reduce the cost of doing business and also make the state more attractive to potential employees. Homeownership costs as a percentage of the median household income ranks second lowest among states. Workers also benefit from shorter average commute times and good road quality.
[in-text-ad]
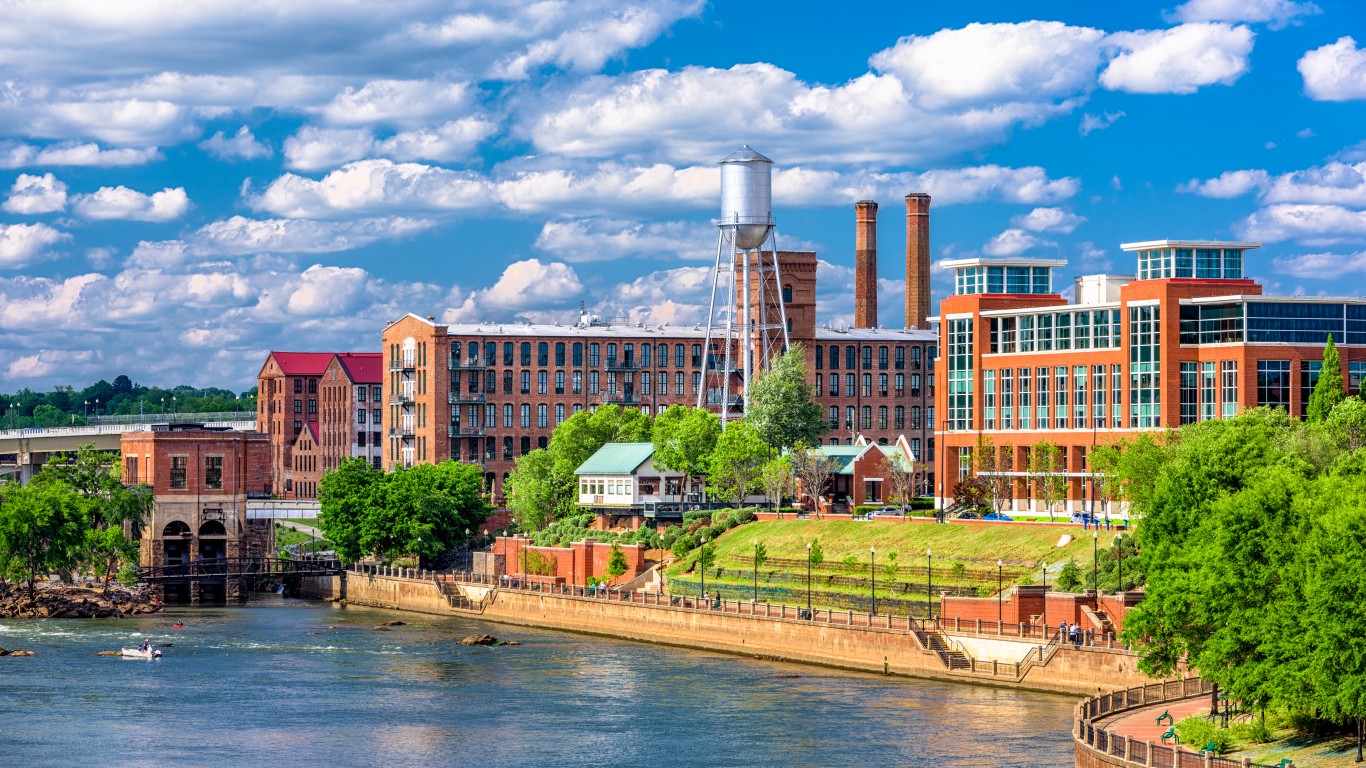
22. Georgia
> 1-yr. real GDP change: +2.4% (24th worst)
> Avg. earnings per job: $56,843 (22nd highest)
> Adults with a bachelor’s degree: 31.9% (20th highest)
> 2018 venture capital deals: 1.1 per 100,000 people (23rd fewest)
Georgia ranks among the top 10 states in the economy component of our index, thanks to rapidly falling unemployment and relatively strong growth in the number of businesses in the state. The state does not rank as well in measures of quality of life. Georgia has a relatively low concentration of arts, entertainment, and recreation centers, and also has the third-worst rate of health insurance coverage in the country.
[recirclink id=557787]

23. Oregon
> 1-yr. real GDP change: +3.8% (7th best)
> Avg. earnings per job: $58,347 (19th highest)
> Adults with a bachelor’s degree: 34.0% (16th highest)
> 2018 venture capital deals: 2.4 per 100,000 people (10th most)
Like neighbors California and Washington, Oregon ranks relatively well in the technology and innovation component of our index. The state ranks among the top 10 in patent grants and venture capital deals per capita. It also ranks 10th in the Milken Institute’s 2018 State Tech and Science Index ranking. It ranks less favorably for businesses in matters of regulation and state infrastructure, which pushes the state down the ranking.

24. Arizona
> 1-yr. real GDP change: +4.1% (4th best)
> Avg. earnings per job: $55,254 (23rd lowest)
> Adults with a bachelor’s degree: 29.7% (21st lowest)
> 2018 venture capital deals: 1.2 per 100,000 people (25th fewest)
Arizona ranks better than the majority of states in the economy component of our index, thanks in part to recent healthy GDP growth and growth in the number of businesses in the state. The state compares less favorably to others in the quality of life component of our index thanks to a low concentration of arts, entertainment, and recreation establishments as well as a relatively high property and violent crime rates.
[in-text-ad-2]

25. New York
> 1-yr. real GDP change: +1.2% (7th worst)
> Avg. earnings per job: $79,182 (the highest)
> Adults with a bachelor’s degree: 37.2% (8th highest)
> 2018 venture capital deals: 5.4 per 100,000 people (3rd most)
The Tax Foundation ranks New York’s tax climate as the second least favorable for business. The state also boasts the highest average earnings per job in the country, which is good for workers but less favorable for the companies that must pay the salaries. Cost of living is also quite high in the state. New York rates much more favorably for business in areas like technology and innovation and state economy.

26. Nevada
> 1-yr. real GDP change: +4.2% (3rd best)
> Avg. earnings per job: $53,543 (17th lowest)
> Adults with a bachelor’s degree: 24.9% (6th lowest)
> 2018 venture capital deals: 1.3 per 100,000 people (25th most)
Nevada’s business climate ranks towards the middle of all states. While certain conditions, like a far higher than average violent crime rate, can discourage new businesses from coming to an area and reduce overall quality of life, Nevada excels in other areas. For example, between 2017 and 2018, the state’s economy expanded by 4.2%, faster than all but two other states.
[in-text-ad]

27. Nebraska
> 1-yr. real GDP change: +0.9% (5th worst)
> Avg. earnings per job: $56,544 (25th highest)
> Adults with a bachelor’s degree: 32.4% (19th highest)
> 2018 venture capital deals: 1.0 per 100,000 people (17th fewest)
Economic growth has been relatively slow in Nebraska in recent years. Between 2013 and 2018, the state’s economy grew by just 8.7%, slower than the comparable 13.0% national growth rate.
[recirclink id=531165]

28. Michigan
> 1-yr. real GDP change: +2.5% (22nd best)
> Avg. earnings per job: $57,748 (20th highest)
> Adults with a bachelor’s degree: 29.6% (19th lowest)
> 2018 venture capital deals: 1.1 per 100,000 people (20th fewest)
Economic growth has not been particularly strong in Michigan. Between 2017 and 2018, the state’s GDP expanded by just 2.5%, slightly slower than the comparable 2.9% national economic growth over the same period.
While weak economic growth is not ideal, employers in the state benefit from factors like the state tax code. According to the Tax Foundation, Michigan’s tax structure is better for business than that of the majority of other states.

29. Alaska
> 1-yr. real GDP change: +0.7% (4th worst)
> Avg. earnings per job: $68,844 (7th highest)
> Adults with a bachelor’s degree: 30.2% (23rd lowest)
> 2018 venture capital deals: 0.4 per 100,000 people (6th fewest)
According to the Tax Foundation, Alaska has a more favorable business tax climate than all but two other states. While businesses in Alaska may get a break on their tax bill, many other expenses are higher than average in the state. For example, the average retail price of electricity in the state is about 19 cents per kilowatt-hour, nearly double the average national price.
[in-text-ad-2]
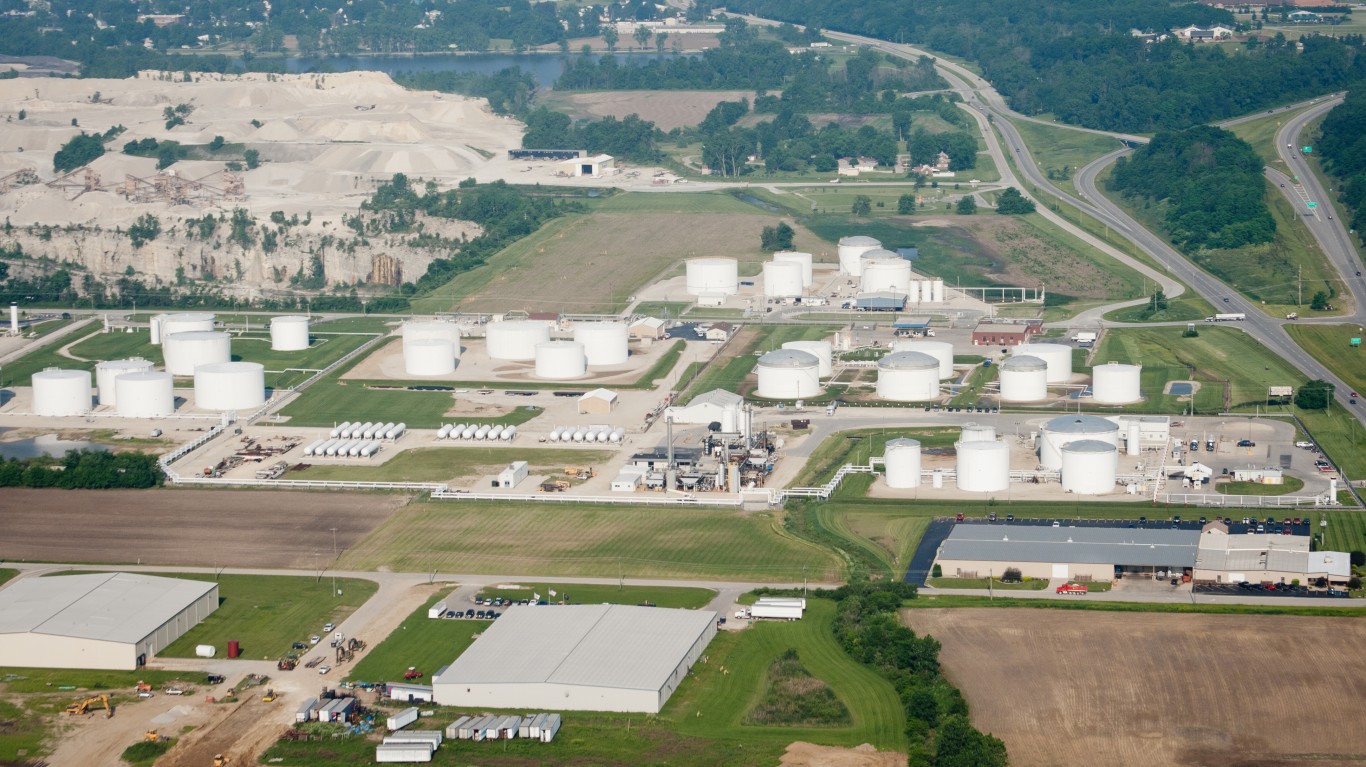
30. Indiana
> 1-yr. real GDP change: +2.0% (14th worst)
> Avg. earnings per job: $55,600 (24th lowest)
> Adults with a bachelor’s degree: 27.1% (10th lowest)
> 2018 venture capital deals: 1.4 per 100,000 people (22nd most)
Employers in Indiana benefit from a low cost of living. Goods and services in the state are about 10% less expensive than average. Some other conditions in the state are not as favorable for certain kinds of businesses, however. For example, finding qualified workers may not be as easy as in many other states, as just 27.1% of adults in the state have a bachelor’s degree or higher, a smaller share than the 32.6% share of adults nationwide.

31. South Carolina
> 1-yr. real GDP change: +2.6% (17th best)
> Avg. earnings per job: $50,893 (11th lowest)
> Adults with a bachelor’s degree: 28.3% (14th lowest)
> 2018 venture capital deals: 0.8 per 100,000 people (10th fewest)
As a right-to-work state, South Carolina has the second lowest union membership rate of any state. Just 2.8% of the labor force is in a union, well below the 10.6% national union membership rate. While this gives some employers in the state more control over their workers, other factors related to the state’s labor force and human capital might not. For example, just 28.3% of adults in the state have a bachelor’s degree or higher, below the 32.6% national share. This may make it more difficult for some employers to find qualified workers.
[in-text-ad]

32. New Jersey
> 1-yr. real GDP change: +2.2% (19th worst)
> Avg. earnings per job: $71,228 (6th highest)
> Adults with a bachelor’s degree: 40.8% (3rd highest)
> 2018 venture capital deals: 1.0 per 100,000 people (16th fewest)
Roadway congestion is a considerable problem for many businesses in New Jersey. Traffic delays cost the trucking industry more on a per mile basis in New Jersey than they do in any other state. There are also several advantages for businesses operating New Jersey, however. One of them is the relatively skilled talent pool for employers to draw from. Over 40% of adults in the state have at least a bachelor’s degree, and over 90% have a high school diploma, each higher than the respective 32.6% and 88.3% national shares.
[recirclink id=563869]

33. Tennessee
> 1-yr. real GDP change: +3.1% (12th best)
> Avg. earnings per job: $56,656 (24th highest)
> Adults with a bachelor’s degree: 27.5% (11th lowest)
> 2018 venture capital deals: 1.2 per 100,000 people (24th fewest)
High crime rates can reduce overall quality of life and make an area less attractive to new businesses. In Tennessee, there were 624 violent crimes for every 100,000 people in 2018, the third highest rate of any state and well above the national rate of 381 violent crimes per 100,000. Still, economic growth has been strong in the state. Between 2017 and 2018, Tennessee’s economy grew by 3.1%, faster than most states and the 2.9% national GDP growth rate.

34. Wisconsin
> 1-yr. real GDP change: +2.4% (22nd worst)
> Avg. earnings per job: $55,896 (25th lowest)
> Adults with a bachelor’s degree: 30.0% (22nd lowest)
> 2018 venture capital deals: 1.3 per 100,000 people (23rd most)
New and growing businesses in Wisconsin may face hiring difficulties in the coming years. Over the next decade, Wisconsin’s working-age population is projected to contract by 1.3%, even as the number of Americans between the ages of 15 and 55 is projected to expand by 4.6%. Still, a larger share of workers in Wisconsin meets basic prerequisite for employment as 92.1% of adults in the state have a high school diploma, a larger share than the 88.3% share of adults nationwide.
[in-text-ad-2]
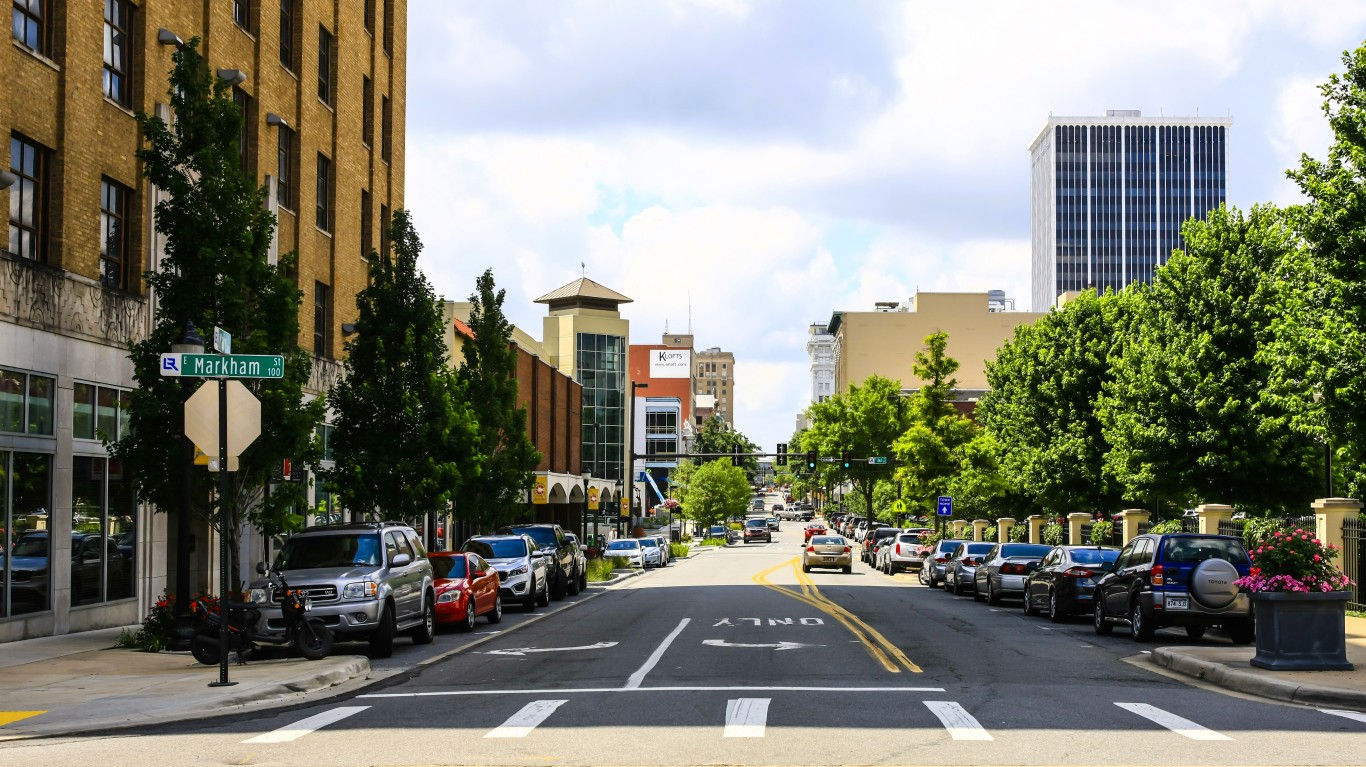
35. Arkansas
> 1-yr. real GDP change: +1.7% (11th worst)
> Avg. earnings per job: $47,272 (3rd lowest)
> Adults with a bachelor’s degree: 23.3% (3rd lowest)
> 2018 venture capital deals: 0.9 per 100,000 people (15th fewest)
Economic growth has been relatively sluggish in Arkansas. Between 2017 and 2018, the state’s GDP expanded by just 1.7%, slower than most states and below the 2.9% national GDP growth. Finding qualified workers may not be as easy as in many other states, as just 23.3% of adults in the state have a bachelor’s degree or higher, a much smaller share than the 32.6% share of adults nationwide.

36. Rhode Island
> 1-yr. real GDP change: +1.2% (8th worst)
> Avg. earnings per job: $58,670 (18th highest)
> Adults with a bachelor’s degree: 34.4% (14th highest)
> 2018 venture capital deals: 2.2 per 100,000 people (13th most)
Rhode Island is the second most densely populated state in the country after only New Jersey. Partially as a result, roadway congestion is a significant liability for certain businesses in the state. Traffic delays cost the trucking industry more on a per mile basis in the state than in every other state except New Jersey. Economic growth is also sluggish in Rhode Island. In the last year, the state’s economy grew by just 1.2%, well below the comparable 2.9% national GDP growth.
[in-text-ad]

37. Kansas
> 1-yr. real GDP change: +2.1% (15th worst)
> Avg. earnings per job: $54,727 (20th lowest)
> Adults with a bachelor’s degree: 33.8% (17th highest)
> 2018 venture capital deals: 0.7 per 100,000 people (9th fewest)
High crime rates can reduce overall quality of life and make an area less attractive to new businesses. In Kansas, there were 439 violent crimes for every 100,000 people in 2018, a higher rate than in most states and above the comparable national rate of 381 violent crimes per 100,000. Also, the state’s 2.1% GDP growth between 2017 and 2018 was relatively modest compared to the 2.9% national GDP growth.
[recirclink id=562217]

38. Maine
> 1-yr. real GDP change: +2.2% (18th worst)
> Avg. earnings per job: $50,247 (8th lowest)
> Adults with a bachelor’s degree: 31.5% (24th highest)
> 2018 venture capital deals: 1.8 per 100,000 people (17th most)
New and growing businesses in Maine may face hiring difficulties in the coming years. Over the next decade, the state’s working-age population is projected to contract by 6.1%, even as the number of Americans between the ages of 15 and 55 is projected to expand by 4.6%. Additionally, according to the Tax Foundation, Maine’s tax code is not as business friendly as that of the majority of other states.

39. Oklahoma
> 1-yr. real GDP change: +2.6% (20th best)
> Avg. earnings per job: $54,282 (18th lowest)
> Adults with a bachelor’s degree: 25.6% (8th lowest)
> 2018 venture capital deals: 0.3 per 100,000 people (4th fewest)
For certain businesses in Oklahoma, finding qualified candidates may be more challenging than it would be in many other states. Just 25.6% of adults in the state have a bachelor’s degree, and 9.0% have a graduate or professional degree, below the comparable 32.6% and 12.6% national shares, respectively.
High crime rates can reduce quality of life and potentially make an area less attractive to business. In Oklahoma, there were 466 violent crimes for every 100,000 people in 2018, well above the national violent crime rate of 381 per 100,000.
[in-text-ad-2]

40. Pennsylvania
> 1-yr. real GDP change: +2.6% (19th best)
> Avg. earnings per job: $63,578 (10th highest)
> Adults with a bachelor’s degree: 31.8% (22nd highest)
> 2018 venture capital deals: 2.1 per 100,000 people (15th most)
Pennsylvania ranks poorly on this list due to a number of measures of growth. The state ranks poorly in recent business growth and building permits issued, and is one of only 13 states with projected declines in working-age populations between 2020 and 2030. This may make hiring difficult for new and growing businesses.

41. Ohio
> 1-yr. real GDP change: +1.9% (12th worst)
> Avg. earnings per job: $57,319 (21st highest)
> Adults with a bachelor’s degree: 29.0% (16th lowest)
> 2018 venture capital deals: 1.3 per 100,000 people (24th most)
Economic growth has been sluggish in Ohio. Over the last year, the state’s economy expanded by just 1.9%, well below the comparable 2.9% national GDP growth. Many businesses are also at a slight disadvantage in Ohio as the state does not have right-to-work laws on the books. Partially as a result, 12.7% of the state’s labor force belongs to a union, a larger share than the 10.6% national share.
[in-text-ad]

42. Illinois
> 1-yr. real GDP change: +2.1% (16th worst)
> Avg. earnings per job: $66,044 (9th highest)
> Adults with a bachelor’s degree: 35.1% (12th highest)
> 2018 venture capital deals: 2.0 per 100,000 people (16th most)
Illinois does not compare well to other states in measures of growth. While nationwide the working-age population is projected to increase by 4.6% between 2020 and 2030, it is expected to decrease by 3.9% in Illinois, the fifth-largest decrease among states. The state also ranks below average in measures of recent growth in the number of establishments and in new building permits issued.
[recirclink id=557787]

43. Kentucky
> 1-yr. real GDP change: +1.4% (10th worst)
> Avg. earnings per job: $50,682 (9th lowest)
> Adults with a bachelor’s degree: 24.8% (5th lowest)
> 2018 venture capital deals: 0.9 per 100,000 people (11th fewest)
Kentucky’s one year GDP growth of 1.4% is less than half the comparable 2.9% national economic growth rate. For certain businesses in Kentucky, finding qualified candidates may be more challenging than it would be in many other states. Just 24.8% of adults in the state have a bachelor’s degree, and 10.3% have a graduate or professional degree, below the comparable 32.6% and 12.6% national shares, respectively.

44. Alabama
> 1-yr. real GDP change: +2.8% (14th best)
> Avg. earnings per job: $50,165 (7th lowest)
> Adults with a bachelor’s degree: 25.5% (7th lowest)
> 2018 venture capital deals: 0.5 per 100,000 people (8th fewest)
The cost of doing business and the cost of living in Alabama are relatively low, likely partly because of the relatively low cost of goods and services in the state. However, Alabama ranks relatively poorly in many other measures, including technology and innovation and quality of life. The state’s workforce is also less likely to have a bachelor’s degree or a professional degree than the workforces in most other states.
[in-text-ad-2]
45. Missouri
> 1-yr. real GDP change: +2.4% (25th worst)
> Avg. earnings per job: $54,349 (19th lowest)
> Adults with a bachelor’s degree: 29.5% (18th lowest)
> 2018 venture capital deals: 1.1 per 100,000 people (21st fewest)
Missouri ranks as the worst state for business in the Midwest. Part of the reason for the low ranking is the major decline in the number of state businesses in recent years. The number of establishments in the state fell by 6.2% in 2017, the largest decline of any state. The state’s working-age population is expected to increase by just 0.9% in the next decade, less than the majority of states and well below the 4.6% national increase in the working-age population.

46. Mississippi
> 1-yr. real GDP change: +1.3% (9th worst)
> Avg. earnings per job: $43,769 (the lowest)
> Adults with a bachelor’s degree: 23.2% (2nd lowest)
> 2018 venture capital deals: 0.2 per 100,000 people (3rd fewest)
Mississippi’s low ranking is partially due to the fact that it has the worst score of any state in the technology and innovation component of our index. Just 3.2% of all jobs in the state are in STEM fields, and total venture capital invested in the state in 2018 comes to just $3.21 per capita, each the smallest figures of any state. The Milken institute gives the state the lowest ranking in its State Tech and Science report.
[in-text-ad]

47. New Mexico
> 1-yr. real GDP change: +2.5% (23rd best)
> Avg. earnings per job: $49,530 (5th lowest)
> Adults with a bachelor’s degree: 27.7% (13th lowest)
> 2018 venture capital deals: 0.9 per 100,000 people (13th fewest)
In our index, New Mexico ranks poorly in measures of the skill and size of the state’s labor force, as well as quality of life in the state. New Mexico has among the highest property and violent crime rates in the country, as well as a low concentration of arts, entertainment, and recreation establishments per capita. Additionally, just 27.7% of adults in the state have a bachelor’s degree, one of the smaller shares among states.
[recirclink id=531165]

48. Hawaii
> 1-yr. real GDP change: +2.4% (23rd worst)
> Avg. earnings per job: $59,573 (17th highest)
> Adults with a bachelor’s degree: 33.5% (18th highest)
> 2018 venture capital deals: 0.4 per 100,000 people (7th fewest)
The cost of goods and services in Hawaii are higher than in any other state, meaning the state is one of the most expensive to live and do business, which may deter some workers from choosing to live in the state for work. Hawaii also ranks relatively poorly in measures of technology and innovation, with among the lowest STEM employment as a share of total employment of any state, as well as among the fewest patents granted or venture capital deals per capita in 2018.
49. Louisiana
> 1-yr. real GDP change: +2.6% (21st best)
> Avg. earnings per job: $53,239 (16th lowest)
> Adults with a bachelor’s degree: 24.3% (4th lowest)
> 2018 venture capital deals: 0.2 per 100,000 people (2nd fewest)
Compared to many states, Louisiana is a relatively inexpensive state to do business. It has the lowest electricity prices in the country and workers are paid less on average compared to workers nationwide.
However, in other measures the state ranks among the worst for business. For example, the state ranks among the 10 worst states in every measure considered in the technology and innovation component of our index, including STEM employment, and per capita venture capital deals and patents. Quality of life is also relatively poor in the state — the state has one of the least healthy populations in the United States as well as among the highest property and violent crime rates.
[in-text-ad-2]
50. West Virginia
> 1-yr. real GDP change: +2.3% (20th worst)
> Avg. earnings per job: $51,099 (13th lowest)
> Adults with a bachelor’s degree: 21.3% (the lowest)
> 2018 venture capital deals: 0.1 per 100,000 people (the fewest)
West Virginia ranks as the worst state for business because of poor ranking n a number of different categories in our index, including the economy, infrastructure, and labor and human capital measures. The state has the smallest share of adults who have a bachelor’s degree. It also is one of just a handful of states with a projected population decline over the next decade, as well as one of the largest expected declines in working-age residents. The state has the second highest annual unemployment rate in the country.
Methodology
To determine the best and worst states for business, 24/7 Wall St. compiled 42 measures into eight categories: economic conditions, business costs, state infrastructure, the availability and skill level of the workforce, quality of life, regulations, technology and innovation, and cost of living. Each category aims to capture essential elements that businesses consider when deciding where to locate and operate.
Each category consists of several measures. We created an index for each category using a geometric mean. We then used the geometric mean of each index score to calculate the overall score.
Two categories — labor and human capital and technology and innovation — received double weight, and quality of life and cost of living were given half weights. Cost of business, infrastructure, economy, and regulation received full weight.
The business costs index includes business expenses that can vary between states, such as taxes and salaries. A state’s ranking in the Tax Foundation’s 2020 State Business Tax Climate Index was included to capture the impact of state-level taxes on business. We also looked at 2018 average commercial prices of electricity from the Energy Information Administration. From the Bureau of Economic Analysis, we included average compensation per job in 2018 as well as other forms of compensation, like retirement and insurance benefits as a percentage of salaries and wages per job.
The cost of living index considers costs to both households and businesses. We included a housing affordability ratio, calculated using median annual homeownership costs as a percentage of median household income. Both measures are from the U.S. Census Bureau’s 2018 American Community Survey. Also included are regional price parity, a measure of the cost of living for 2017 from the BEA, and the average state and local tax burden as a percentage of per capita income from the Tax Foundation. Tax Foundation figures are for the 2012 fiscal year.
Economy is the broadest category and was designed to measure each state’s productivity, growth potential, and labor market. We included both one- and five-year growth rates — 2017 and 2013 through 2018 — in real GDP from the BEA, as well as one- and five-year changes in the annual unemployment rate from the Bureau of Labor Statistics. We also included data on the number of population-adjusted building permits issued in 2018 from the Department of Housing and Urban Development.
The economy index includes state poverty rate and the individual earnings gap between men and women, both from the 2018 ACS. We added the growth of non-government establishments between 2016 and 2017 from County Business Patterns. Both datasets are produced by the Census. The total number of small business loans $1 million or less and the total amount of small business lending activity per small business employee come from the Small Business Administration and are for the year 2016, the most recent data available. Data on population density come from the Census Bureau’s 2010 Decennial Census. Finally, we included data on each state’s most recent credit rating and outlook from Moody’s Investor Service.
The infrastructure index captures the cost and efficiency of transportation to businesses and employees. From the Federal Highway Administration we looked at the percentage of roads in poor condition in 2018. Poor was defined as rural roads with an International Roughness Index score greater than 170 and urban roads with an International Roughness Index score greater than 220. We also included the estimated costs to commercial trucking due to traffic congestion in 2018 from the American Transportation Research Institute. We also included the number of public-use airports per 1,000 square miles of land area from the Federal Aviation Administration. Lastly, we used workers’ average commute time in each state from the 2018 ACS.
The labor and human capital index offers a look at the quality of a state’s labor force. We included data on high school, bachelor’s, and graduate educational attainment rates from the 2018 ACS. We also looked at per-pupil education expenditures in each state for 2016 from Education Week. Finally, we incorporated our own population growth projections from 2020 through 2030, using both the growth in total population as well as the projected growth in the working-age population. Population growth projections were calculated using the cohort component method and used population data from the ACS and birth and survival rates from the Centers for Disease Control and Prevention.
The quality of life index was constructed to offer insight into why employees may decide to reside in particular areas. We included each state’s 2018 violent crime rate from the FBI and the percentage of people without health insurance in 2018 from the ACS. We also used each state’s overall score from the United Health Foundation’s 2019 America’s Health Rankings report. From the Department of Education, we incorporated the number of primarily associates degree-granting and primarily bachelor’s degree-granting colleges and universities per 100,000 residents in each state. We also looked at the number of art, entertainment, and recreation establishments per 100,000 state residents in 2017 from the CBP.
The regulation index includes each state’s status as a so-called right-to-work state as well as the share of non-agricultural workers who were union members as of 2018 from UnionStats. Additionally, the index includes each state’s score from the Institute for Legal Reform’s 2019 Lawsuit Climate Survey, an indication of how fair and reasonable a state’s legal system is perceived to be by businesses.
The technology and innovation index includes data on the amount of venture capital investment per capita in each state as well as the frequency of venture capital deals. Both metrics are from the National Venture Capital Association and are for 2018. From the U.S. Patent and Trade Office, we included the number of patents issued per every 100,000 state residents in 2018. We used the Milken Institute’s 2018 State Technology and Science Index and the number of science, technology, engineering, and mathematics (STEM) jobs as a share of all jobs calculated from 2018 BLS occupation data.
Contact [email protected] for any questions or corrections.