[cnxvideo id=”928075″ placement=”ros”]
For most of us, where we live is determined by only a few factors, including our proximity to family and friends, career demands, and where we have history.
While some of these less objective factors can be difficult to measure, there are a number of ways to quantify a place’s appeal — and based on those criteria, a number of U.S. cities clearly stand out as less desirable places to live.
Using data from sources including the U.S. Census Bureau, the Centers for Disease Control and Prevention, and the FBI, 24/7 Wall St. created a weighted index of 22 measures indicative of desirability and overall quality of life to determine the 50 worst cities to live in. Our index includes data related to the economy, such as unemployment and poverty, as well as measures of community, including proximity to grocery stores, access to parks, reliable public transportation, and the concentration of cultural attractions and entertainment options.
Though we considered all towns, villages, cities, and Census designated places home to at least 8,000 people, in order to ensure geographic diversity only the lowest ranking community in each county was included in our analysis.
Although educational attainment rates were not included in our index, adults in most communities on this list are less likely than the typical American over age 25 to have a high school diploma or a bachelor’s degree. This is likely no coincidence as higher educational attainment typically leads to improved job prospects and greater financial security. Every city and town on this list, however, has higher than average poverty and unemployment rates. Here is a look at the most educated city in every state.
Though not all index components used to create this list are related to economic conditions, the prevailing narrative in the 50 worst cities is widespread joblessness and financial hardship. Many of these communities rank among the poorest places in the country. Here is a look at the poorest city in every state.
Click here to see America’s 50 worst cities to live
Click here to see America’s 50 best cities to live
Click here to read our methodology
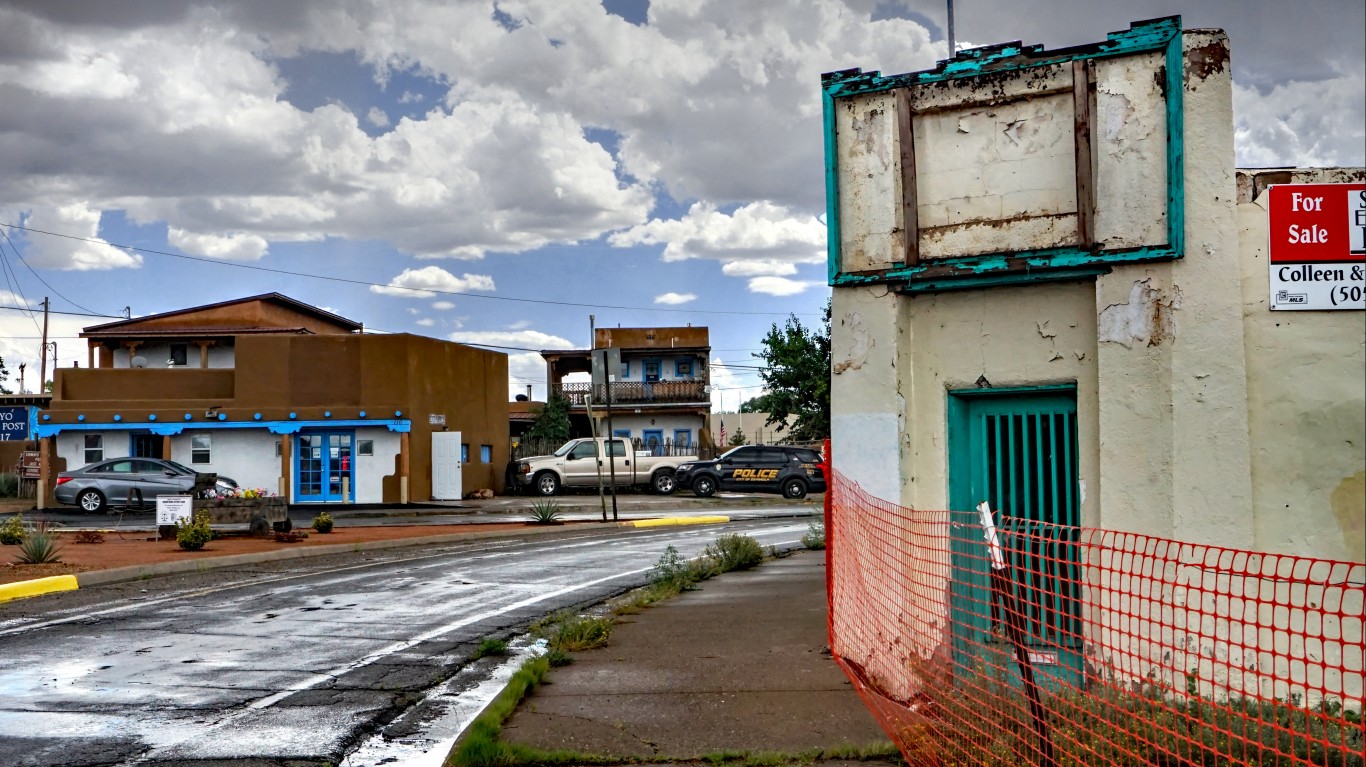
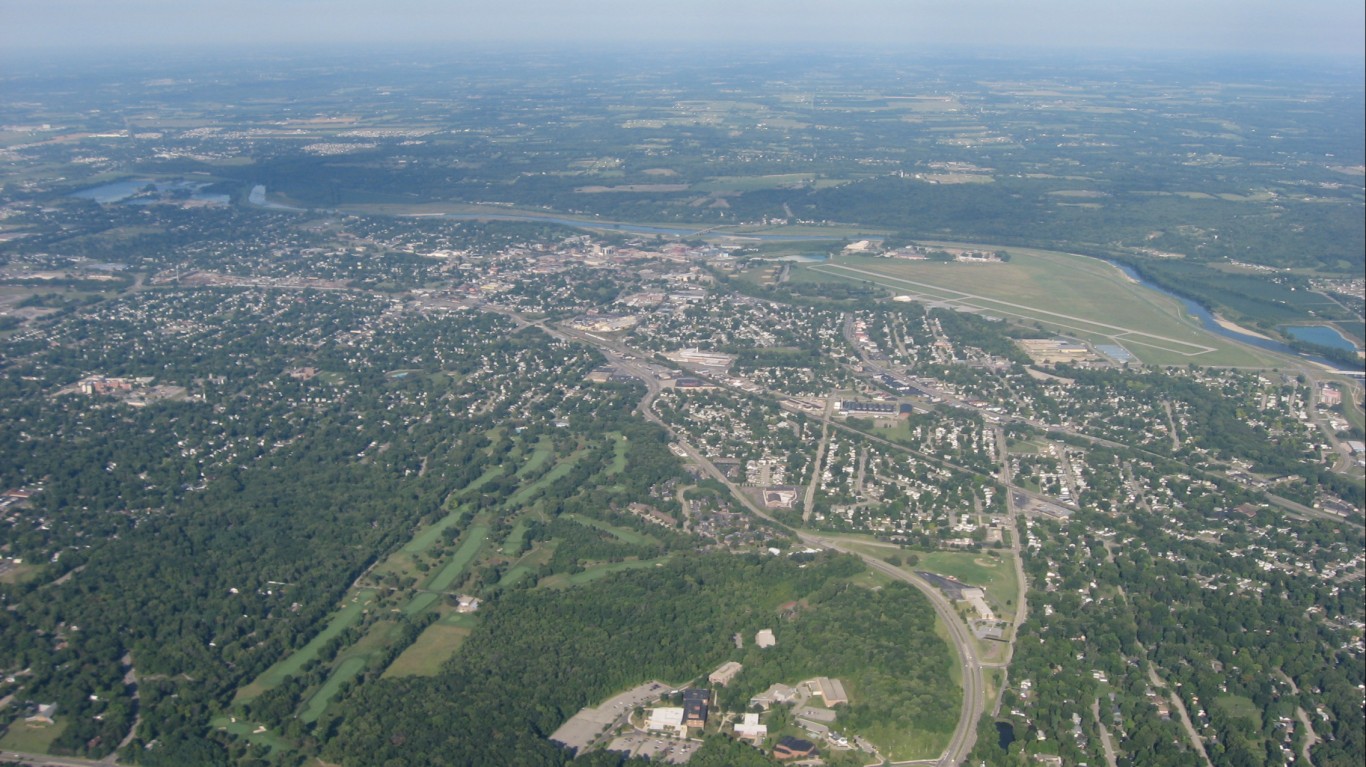
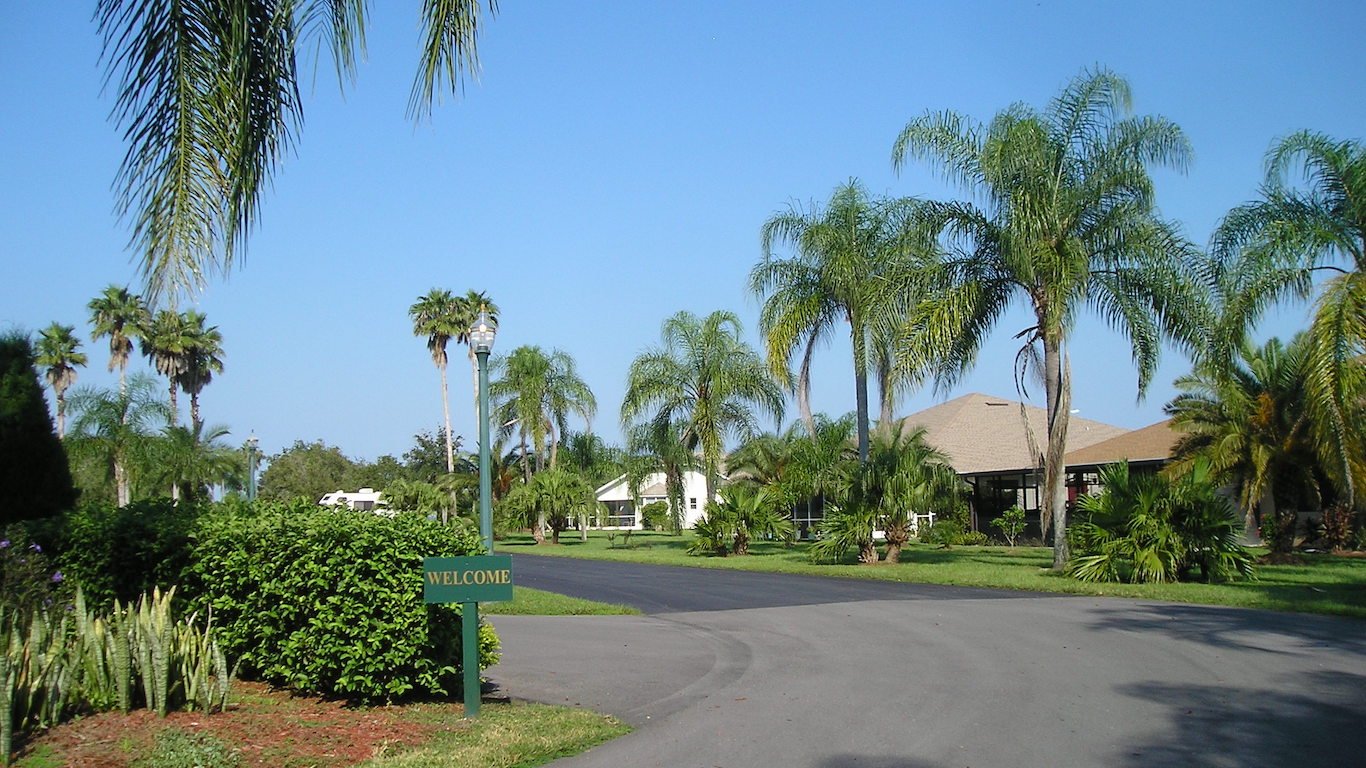
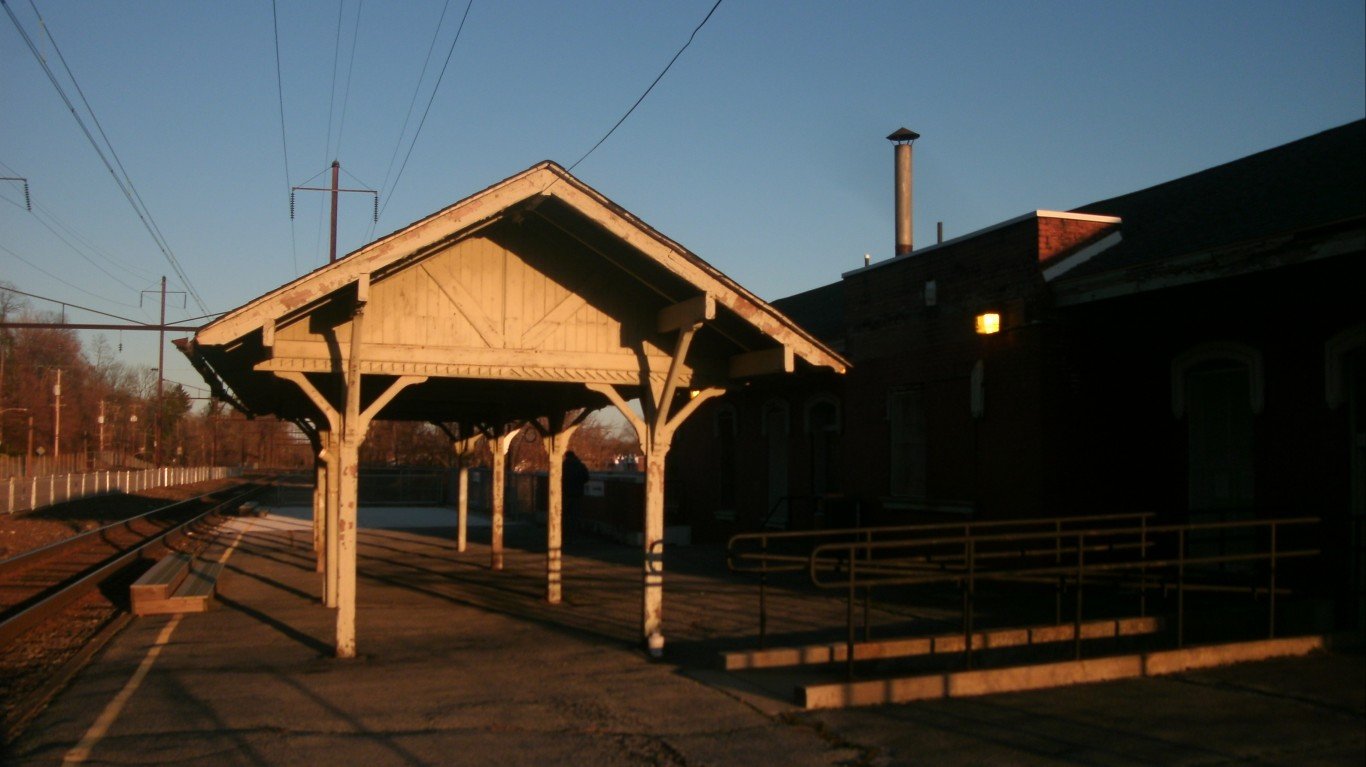
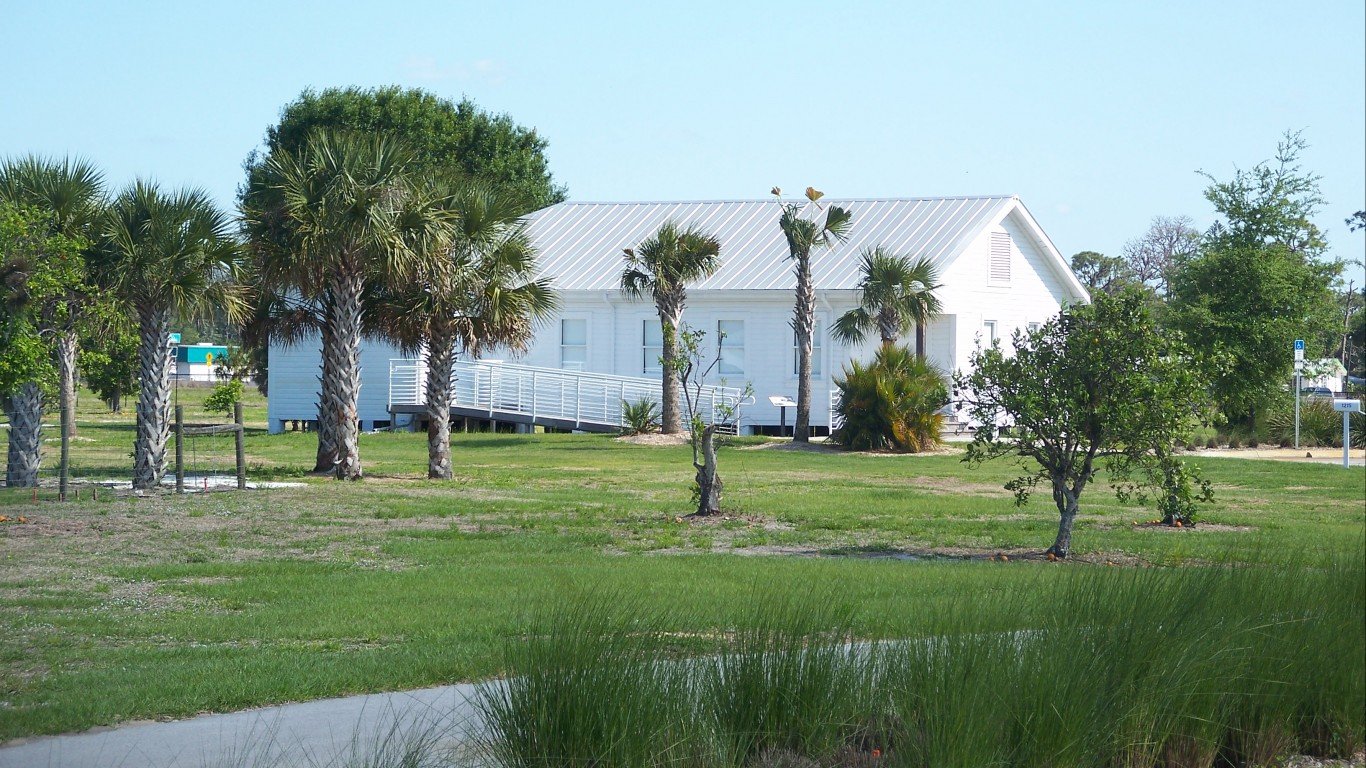
50. Piney Green, North Carolina
> Population: 13,573
> Median home value: $144,600
> Unemployment rate: 6.9%
> Poverty rate: 18.3%
Piney Green, a small Census designated place in eastern North Carolina, is one of two places in the state to rank on this list. According to the U.S. Census Bureau’s five-year unemployment rate figure, 6.9% of the area’s labor force is unemployed, a full percentage point above the comparable national five year rate. Area residents are also more likely to be struggling financially than most Americans as the poverty rate of 18.3% in Piney Green is well above the comparable 14.1% national rate.
A reliable public transit system can improve quality of life in an area, giving commuters more options and allowing those who are unable to drive to maintain independence. Piney Green, however, appears to be lacking in public transit options as 0% workers use it public transit for commuting, according to the census.
[in-text-ad]
49. Oskaloosa, Iowa
> Population: 11,505
> Median home value: $96,700
> Unemployment rate: 6.2%
> Poverty rate: 20.4%
Oskaloosa, Iowa, is a small city about an hour drive southeast of Des Moines. Financial hardship is relatively common in the city as one in every five residents live below the poverty line, well above the national poverty rate of 14.1%. A stronger job market would likely reduce the poverty rate, as the unemployment rate stands at 6.2%, higher than the 5.9% national rate. In the last five years, overall employment in the city fell by 1.5%.
Real estate values can be indicative of an area’s desirability. In Oskaloosa, the typical home is worth just $96,700, less than half the national median of $204,900. Over the last five years, the number of people living in the city declined by 0.2%.
[recirclink id=562217]
48. West Pensacola, Florida
> Population: 21,243
> Median home value: $60,800
> Unemployment rate: 11.6%
> Poverty rate: 19.4%
West Pensacola, a census designated place located near the coast on Florida’s panhandle, is one of several places in the state rank on this list. Unemployment is widespread in the area as 11.6% of West Pensacola’s labor force is unemployed, nearly double the comparable national five-year unemployment rate. For those residents who are working, salaries appear to be generally low. The typical household in the has an income of just $35,374 a year — about $25,000 less than the median household income nationwide of $60,293.
Real estate values tend to be lower in areas that are not as desirable, and in West Pensacola, the typical home is worth $60,800, a fraction of the national median of $204,900.

47. Greenville, Mississippi
> Population: 31,319
> Median home value: $75,800
> Unemployment rate: 14.5%
> Poverty rate: 35.1%
Greenville, Mississippi, is one of the poorest cities in the United States. Over a third of residents live below the poverty line, more than double the 14.1% share of Americans nationwide who do. The widespread financial insecurity is due in part to a weak job market. According to the Census, 14.5% of Greenville’s labor force is unemployed, well more than double the comparable 5.9% national unemployment rate.
A weak economy may be pushing many out of Greenville. The number of people living in the city declined by 7.7% in the last five years.
[in-text-ad-2]

46. Moss Point, Mississippi
> Population: 13,487
> Median home value: $88,500
> Unemployment rate: 10.2%
> Poverty rate: 23.1%
Moss Point is a small city in the southeast corner of Mississippi. One of the poorest cities in the country, Moss Point has a median annual household income of just $38,210, well below the national median of $60,293. An estimated 14.0% of households in the city earn less than $10,000 a year. Nationwide, 6.3% of households do. Like many cities on this list, Moss Point is shrinking. In the last five years, the city’s population contracted by 1.9%.
45. Middletown, Ohio
> Population: 48,449
> Median home value: $97,000
> Unemployment rate: 9.7%
> Poverty rate: 25.4%
Middletown is a small Ohio city located about 40 miles north of downtown Cincinnati. One of several Rust Belt cities on this list, Middletown once had several hydro-powered paper mills throughout the 19th century and a steel mill in the 20th century. However, the steel production company moved its headquarters out of the city in the early 1990s.
Today, MIddletown is a relatively poor area, with a majority of households earning less than $40,000 a year and 11.5% earning less than $10,000. The city has also been hit especially hard by the opioid epidemic. From 2015 through 2017 there were an average of 62 drug-related fatalities per year across the city and surrounding county for every 100,000 people.
[in-text-ad]

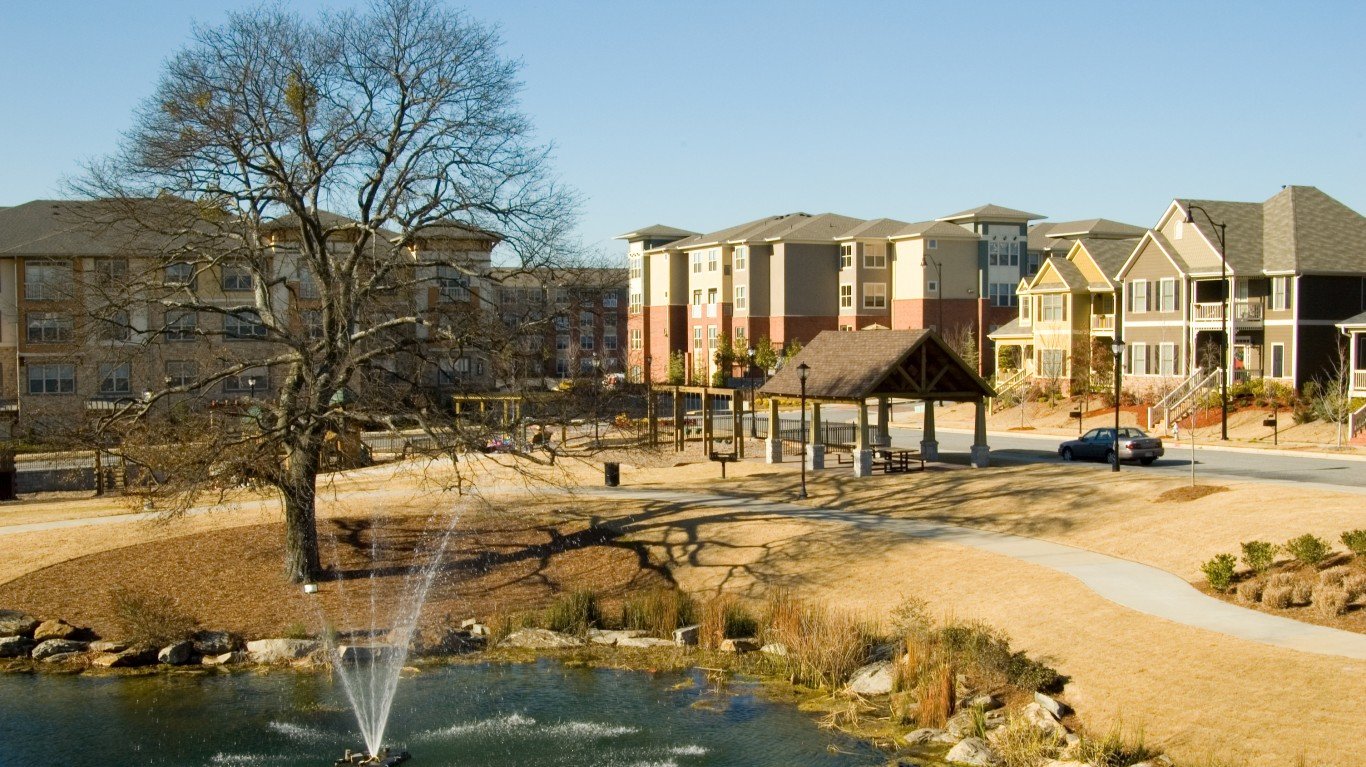
44. Augusta-Richmond County, Georgia
> Population: 196,807
> Median home value: $104,600
> Unemployment rate: 10.3%
> Poverty rate: 23.5%
Augusta is a city in Georgia that has a consolidated government with Richmond County. More than one out of every 10 workers in the area are unemployed, and more than one in every five residents live below the poverty line. Quality of life is further reduced for many in the area by the lack of places such as public parks and recreation centers. Just 73% of area residents have access to such places, well below the 84% national average.
As is often the case in areas with struggling economies and limited amenities, property values are low in Augusta-Richmond County. The typical home in the area is worth just $104,600, about half the median home value nationwide.
[recirclink id=554829]

43. Bay St. Louis, Mississippi
> Population: 12,465
> Median home value: $170,400
> Unemployment rate: 8.4%
> Poverty rate: 25.1%
Bay St. Louis is one of several poor Mississippi cities to tank on this list. More than one in every four city residents live below the poverty line, and the unemployment rate stands at 8.4%.
Access to places for physical activity such as parks or recreation centers can greatly improve quality of life and increase the likelihood area residents are physically active. In the Bay St. Louis area, just 47% of the population has access to such places, well below the 84% national average. Bay St. Louis residents are also more likely than most Americans to lead sedentary lives. Some 35.6% of area adults get no exercise beyond going to work — a far larger share than the 22.0% of adults nationwide who are not physically active.

42. Lithia Springs, Georgia
> Population: 17,216
> Median home value: $111,600
> Unemployment rate: 6.3%
> Poverty rate: 20.0%
Lithia Springs, Georgia, is a small census designated place located about 20 miles northwest of Atlanta. While the proximity to such a large city offers residents access to entertainment, culture, and job opportunities, access to such places is relatively limited in Lithia Springs itself. Lithia Springs has a smaller than average concentration of places like restaurants, bars, and fitness and recreation centers. Also, over 70% of area residents have limited access to grocery stores, well above the 42.1% share of Americans nationwide who do.
[in-text-ad-2]
41. DeRidder, Louisiana
> Population: 11,050
> Median home value: $134,800
> Unemployment rate: 9.6%
> Poverty rate: 23.6%
DeRidder is a small city in western Louisiana where the overall quality of life appears to be affected by the area’s weak economy. The city’s unemployment rate is nearly 10%, and partially as a result, many city residents are struggling financially. The city’s poverty rate of 23.6% is well above the comparable 14.1% national rate.
Far larger than typical shares of area residents also have poor access to important amenities. For example, over 80% of people in DeRidder have limited access to a grocery store, and only about 66% of residents have easy access to a park or recreation center, compared to the national shares of 42% and 84%, respectively.
40. Denison, Iowa
> Population: 8,358
> Median home value: $90,700
> Unemployment rate: 10.7%
> Poverty rate: 16.0%
Denson, a small city in Western Iowa, is one of two cities in the state to rank on this list. With an unemployment rate of 10.7%, the city has an especially weak job market. Over the last five years, overall employment has fallen by 4.1%, even as the overall population grew by 0.4%. A high school education is a basic prerequisite for most jobs, and in Denison, only 63.3% of adults have a high school diploma, a far smaller share than the 87.7% of adults nationwide.
As is often the case among the cities and towns on this list, property values are low in Denison. The typical home in the city is worth just $90,700, less than half the national median of $204,900.
[in-text-ad]
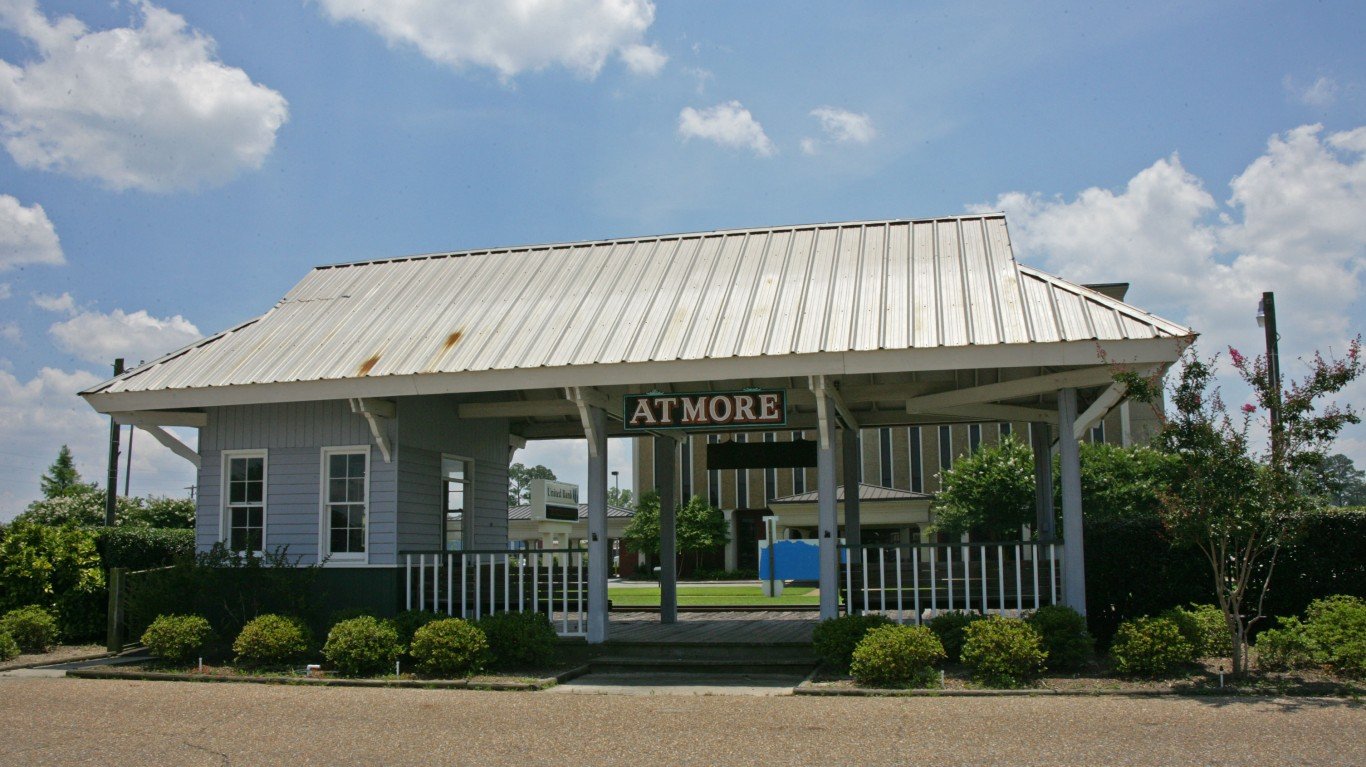
39. Atmore, Alabama
> Population: 9,746
> Median home value: $96,100
> Unemployment rate: 19.9%
> Poverty rate: 32.2%
Atmore is located southwestern Alabama along the state’s border with Florida. Industry in the area has long been dominated by agriculture. The city is also currently home to several companies in metal fabrication and textiles industries, and it has a casino. Still, Atmore’s job market is suffering. In the last five years, overall employment in the city fell by a staggering 21.3%, and the five year unemployment rate now stands at 19.9%, more than triple the comparable 5.9% five year national rate.
Atmore also appears to have been affected more than most cities nationwide by the opioid epidemic. There were 31 drug deaths for every 100,000 people on average in the city each year between 2015 and 2017 compared to the national overdose death rate of 20 drug deaths per 100,000.
[recirclink id=592084]

38. Pahrump, Nevada
> Population: 36,174
> Median home value: $152,400
> Unemployment rate: 9.8%
> Poverty rate: 16.6%
Pahrump is an unincorporated place in southern Nevada along the California state border. Its ranking on this list is due in large part to poor performance in several measures of quality of life. For example, there were 38 drug deaths for every 100,000 people in the area between 2015 and 2017 compared to the national overdose death rate of 20 per 100,000.
The area’s job market is also relatively weak. Nearly one in every 10 workers in Pahrump are unemployed, well above the comparable 5.9% national unemployment rate.
37. Lakeland Village, California
> Population: 13,170
> Median home value: $249,700
> Unemployment rate: 12.9%
> Poverty rate: 20.6%
Lakeland Village is an unincorporated place in southern California. The area’s job market is relatively weak, as 12.9% of the area’s labor force are unemployed, more than double the comparable 5.9% national five year rate.
Those who are working in the area are more likely to spend more of their day getting to and from work than the typical American. The average commute time in Lakeland Village is about 40 minutes, well above the 27 minute national average. Over the course of a typical work week, this adds up to over an hour of additional commute time.
[in-text-ad-2]

36. Makaha, Hawaii
> Population: 8,740
> Median home value: $383,200
> Unemployment rate: 16.7%
> Poverty rate: 28.0%
Makaha, an unincorporated town in Hawaii, is the only place in the state to rank on this list. While most cities on this list are relatively affordable, Makaha is an expensive place to live. Goods and services in the town are 61.4% more expensive than they are nationwide on average.
Area incomes are not sufficiently high to compensate for the higher cost of living. The typical household in Makaha earns $52,097 a year, well below the national median of $60,293. Financial hardship is also relatively common in Makaha, as the area’s poverty rate of 28.0% is nearly double the national rate of 14.1%.
35. Lehigh Acres, Florida
> Population: 119,205
> Median home value: $140,800
> Unemployment rate: 6.9%
> Poverty rate: 20.2%
Lehigh Acres is an unincorporated area in southwestern Florida. Though the cost of living in the area is slightly higher than average, incomes are not high enough to offset the higher cost of living. The typical area household has an annual income of $46,816, far less than the income of $60,293 for the typical American household. Additionally, more than one in every five area residents live below the poverty line, compared to 14.1% of Americans.
The overall financial well-being of area residents would likely improve with a stronger job market. Currently, the unemployment rate in Lehigh Acres is 6.9%, a full percentage point higher than the national rate.
[in-text-ad]
34. Artesia, New Mexico
> Population: 12,202
> Median home value: $168,100
> Unemployment rate: 6.0%
> Poverty rate: 21.7%
Artesia is a small city in the southeast corner of New Mexico. A relatively large share of Artesia residents may struggle to obtain fresh, healthy food, for several reasons. An estimated 81% of residents live in low access areas, meaning that they live at least a mile from the nearest grocery store in urban areas and at least 10 miles in rural areas. The poverty rate in Artesia stands at 21.7%, well above the comparable 14.1% national poverty rate.
[recirclink id=563869]
33. Arizona City, Arizona
> Population: 11,761
> Median home value: $102,000
> Unemployment rate: 9.3%
> Poverty rate: 20.9%
Arizona City is a small unincorporated city in southern Arizona between Phoenix and Tucson. Over the last five years, the area’s employment — the number of people working — declined by 0.6%. Also, the unemployment rate stands at 9.3%, far higher than the comparable national five year rate of 5.9%.
The area has a far lower than typical concentration of places like restaurants and bars. Arizona City residents are also far more likely than most Americans to have to travel long distances to get to the nearest grocery store.

32. Bacliff, Texas
> Population: 10,649
> Median home value: $99,700
> Unemployment rate: 7.6%
> Poverty rate: 23.3%
Bacliff, Texas, is a small unincorporated town located about 40 miles southeast of downtown Houston. After World War II, the town expanded as a home for workers in a local petrochemical plant, and in recent decades, it has been plagued by gang activity. Joblessness is widespread in Bacliff as the town’s unemployment rate stands at 7.6%.
Like other places on this list, Bacliff is a poor community. Most households have an income of less than $40,000 a year, and 23.3% of the population live below the poverty line.
[in-text-ad-2]
31. Earlimart, California
> Population: 8,790
> Median home value: $131,300
> Unemployment rate: 14.3%
> Poverty rate: 41.6%
Earlimart is a small unincorporated town in central California, located between Fresno and Bakersfield. With a poverty rate of 41.6%, Earlimart is one of the poorest areas in the United States. The area’s financial hardship is due in part to the weak job market. Unemployment rate stands at 14.3%, nearly quadruple the comparable 5.9% national rate. The weak job market is also likely discouraging labor force participation as only 36.7% of the population are employed, well below the 47.3% national average.
Earlimart is also lacking in establishments that can improve overall quality of life. There are far fewer places like restaurants, bars, and gyms on a per capita basis in the town than there are nationwide.
30. Coatesville, Pennsylvania
> Population: 13,147
> Median home value: $117,800
> Unemployment rate: 11.8%
> Poverty rate: 28.2%
Coatesville is a small city in southeastern Pennsylvania. It ranks on this list due in large part to a high poverty rate and widespread joblessness. Job growth has been sluggish in Coatesville in recent years, and more than one in every 10 area households live on an income of less than $10,000 a year.
Homeownership is not only one of the most practical ways to build wealth, but it also can give residents a more deeply rooted stake in community affairs and an interest in positive development. In Coatesville, the homeownership rate stands at just 38.0%, well below the 63.8% national rate. Population growth, another indicator of an area’s desirability, is also stagnant in Coatesville. In the last five years, the number of people living there increased by just 0.3%, compared to the 3.6% national population growth over the same period.
[in-text-ad]
29. Perry, Georgia
> Population: 16,031
> Median home value: $145,900
> Unemployment rate: 14.4%
> Poverty rate: 18.9%
More than three in every four residents of Perry, Georgia, have limited access to grocery stores — meaning they live at least a mile from the nearest grocery store in urban areas and at least 10 miles in rural areas. Access to fresh and healthy food in the area is also limited for many by income, as 18.9% of the population live below the poverty line, well above the 14.1% national poverty rate.
Employment in the small central Georgia city has surged in recent years, climbing by 13.3% in the last five years. Still, the new jobs have not been enough curb widespread unemployment. According to the U.S. Census Bureau, 14.4% of Perry’s labor force are unemployed, more than double the comparable 5.9% national unemployment rate.
[recirclink id=562217]
28. Bessemer, Alabama
> Population: 26,759
> Median home value: $83,500
> Unemployment rate: 14.7%
> Poverty rate: 28.1%
Joblessness is widespread in Bessemer, one of two Alabama cities to rank on this list. The area’s unemployment rate of 14.7% is nearly triple the 5.9% national five year unemployment rate. The weak job market is also likely discouraging labor force participation as only 36.8% of the population are employed, well below the 47.3% national participation rate.
The weak job market also helps explain the area’s low incomes. The majority of households in the city have an income of less than $32,000 a year, and nearly 14% of households live on less than $10,000 a year. These conditions may be driving people out of Bessemer. In the last five years, the city’s population fell by 2.1%.

27. Stockbridge, Georgia
> Population: 28,648
> Median home value: $171,300
> Unemployment rate: 8.5%
> Poverty rate: 15.4%
According to the Census, the five year jobless rate in Stockbridge, Georgia, stands at 8.5%, well above the comparable 5.9% national five year unemployment rate. Stockbridge residents are also more likely to live in poverty and less likely to own their home than the typical American. The area’s low income residents face some additional financial strain due to a slightly higher cost of living. Goods and services in Stockbridge and across the surrounding county are about 3% more expensive than average.
Access to fresh, nutritious food is relatively limited in Stockbridge. Over 70% of area residents live far from a grocery store — defined as 1 mile in an urban area and 10 miles in a rural area — well above the 42.1% share of Americans who live in low access areas.
[in-text-ad-2]
26. Brooksville, Florida
> Population: 8,027
> Median home value: $49,000
> Unemployment rate: 9.8%
> Poverty rate: 19.4%
Brooksville is a small city in western Florida, less than 60 miles north of Tampa. Low property values often indicate low demand for housing, which can happen if an area is a particularly undesirable place to live. In Brooksville, the typical home is worth just $49,000, less than a quarter of the national median home value of $204,900.
Brooksville’s weak job market is one of the reasons the city ranks among the worst places to live. With stagnant employment growth in recent years, the area’s unemployment rate of 9.8% is far higher than the 5.9% national rate. The weak job market is also likely discouraging labor force participation as only 30.3% of the population are employed, well below the 47.3% national average.
25. Avon Park, Florida
> Population: 10,386
> Median home value: $68,400
> Unemployment rate: 19.9%
> Poverty rate: 33.0%
Avon Park, Florida, ranks among the worst cities to live in largely due to weak economic conditions. Though employment in the small central Florida city has surged in recent years, climbing by 14.4% in the last half decade, the new jobs have not been enough curb the area’s widespread unemployment. According to the U.S. Census Bureau, 19.9% of Avon Park’s labor force are unemployed, more than double the 5.9% national five year unemployment rate.
Partially due to the weak job market, many in Avon are struggling financially. Nearly one-third of the city’s population live below the poverty line, and more than one in every 10 households earn less than $10,000 a year.
[in-text-ad]

24. Lawrenceville, Georgia
> Population: 29,401
> Median home value: $162,200
> Unemployment rate: 6.8%
> Poverty rate: 21.5%
A relatively large share of people living in Lawrenceville, Georgia, may be struggling to obtain fresh, healthy food for several reasons. First, 78% of residents live in low access areas, meaning they live at least a mile from the nearest grocery store in urban areas and at least 10 miles in rural areas. Another hurdle for many residents is affordability. The area’s poverty rate stands at 21.5%, well above the 14.1% national poverty rate.
Conditions are even worse for low-income Lawrenceville residents than they are for poor Americans in other parts of the country due to a relatively high cost of living. Goods and services in the county are about 6% more expensive on average than they are nationwide.
[recirclink id=554829]
23. Winton, California
> Population: 11,761
> Median home value: $154,300
> Unemployment rate: 20.7%
> Poverty rate: 24.9%
Over the last five years, the number of people working in Winton, California, fell by 4.8%, even as nationwide overall employment climbed by 6.5% over the same period. As of 2018, Winton’s five-year unemployment rate stands at a staggering 20.7%, nearly quadruple the comparable 5.9% national five year rate, according to the Census. Greater availability of jobs would likely go a long way in reducing financial hardship in the area. Currently, about one in every four Winton residents live below the poverty line.
Higher educational attainment can lead to improved job security and reduce the likelihood of financial insecurity. In Winton, only 53% of adults have a high school diploma, and 6.2% have a bachelor’s degree.

22. Phelan, California
> Population: 15,532
> Median home value: $207,800
> Unemployment rate: 14.7%
> Poverty rate: 18.5%
Workers in Phelan, California, are nearly three times more likely to be unemployed than the typical American worker. The area’s five year unemployment rate stands at 14.7%, compared to the 5.9% national rate.
Quality of life in Phelan is further affected by a lower than average concentration of arts and entertainment options. There are far fewer places like restaurants, bars, museums, and theater companies in the city than there are nationwide relative to the population size. Even more importantly, for many area residents, it may take longer than average to obtain emergency medical services as the closest hospital is over 13 miles from the center of town.
[in-text-ad-2]
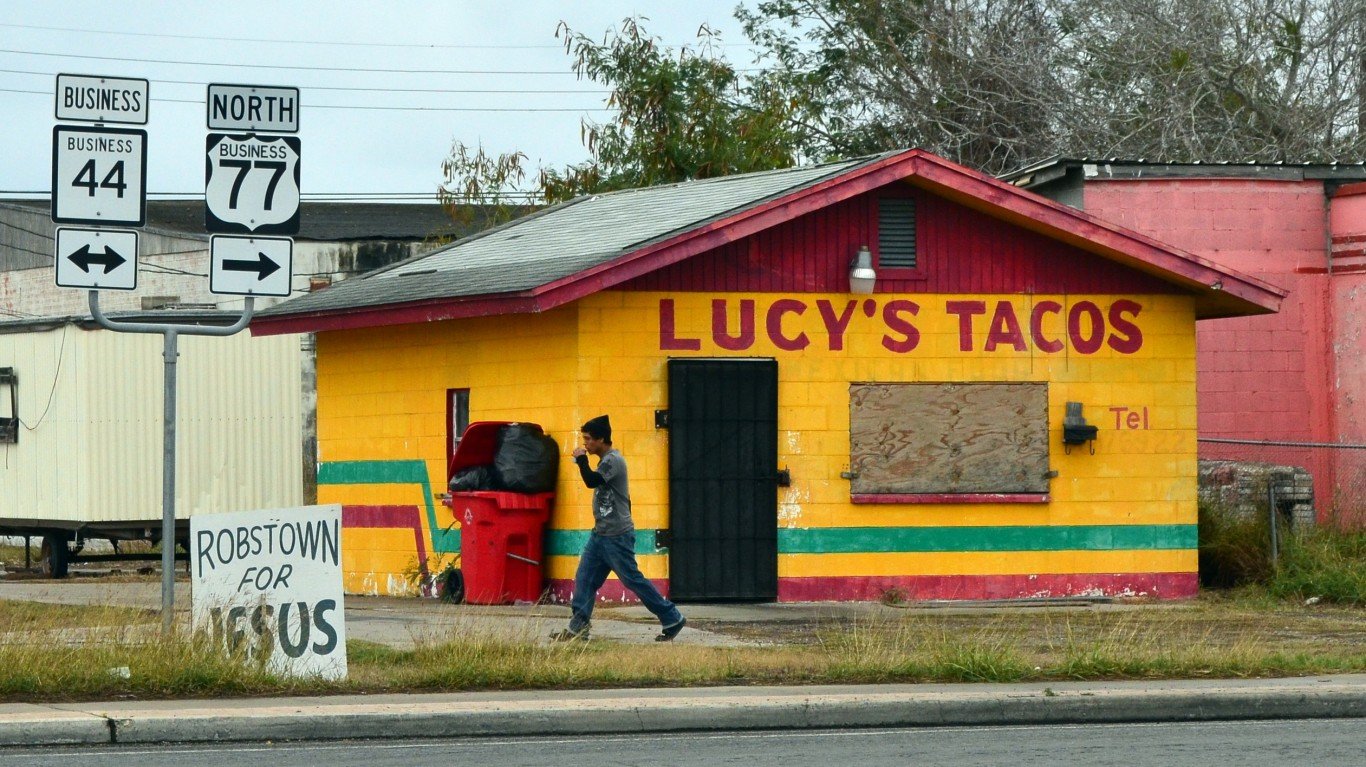
21. Robstown, Texas
> Population: 11,494
> Median home value: $52,900
> Unemployment rate: 20.0%
> Poverty rate: 41.1%
Robstown, Texas, has one of the worst job markets of any U.S. city. The city’s five year unemployment rate of 20% is nearly quadruple the comparable 5.9% national rate. The high jobless rate has likely contributed to the widespread poverty in the city. Robstown’s poverty rate is a staggering 41.1%.
Close proximity to a hospital can mean the difference between life and death for many who may need emergency medical services. However, the nearest hospital from the center of Robstown is nearly 17 miles away.

20. Douglas, Arizona
> Population: 16,453
> Median home value: $94,500
> Unemployment rate: 12.3%
> Poverty rate: 29.3%
Douglas, a small city in southern Arizona along the U.S.-Mexico border, is one of the poorest places in the United States. The city’s 29.3% poverty rate is more than double the comparable national rate of 14.1%. Additionally, 13.3% of households in Douglas live on an income of less than $10,000 a year, more than double the 6.3% share of households nationwide.
Population decline is more common in less desirable parts of the country. In Douglas, the population contracted by 4.8% in the last five years. Falling population can also mean reduced demand for housing and depressed real estate values. The area’s typical home is worth just $94,500, less than half the national median home value of $204,900.
[in-text-ad]
19. Buenaventura Lakes, Florida
> Population: 34,085
> Median home value: $163,100
> Unemployment rate: 8.5%
> Poverty rate: 16.1%
Buenaventura Lakes is an unincorporated town located about 16 miles south of downtown Orlando. The area’s median household income of $47,216 is well below the national median of $60,293. Many low-income area residents are likely affected by the area’s high cost of living. Goods and services in the town are about 9% more expensive on average than they are nationwide.
A relatively large share of Buenaventura Lakes residents may struggle to obtain fresh, healthy food. An estimated 82% of residents live in low access areas, meaning they live at least a mile from the nearest grocery store in urban areas and at least 10 miles in rural areas.
[recirclink id=592084]
18. Chaparral, New Mexico
> Population: 14,793
> Median home value: $71,200
> Unemployment rate: 12.4%
> Poverty rate: 43.7%
Chaparral is a small unincorporated town in south-central New Mexico along the Texas state border. One of the poorest places in the country, Chaparral’s poverty rate of 43.7% is more than triple the 14.1% national poverty rate. Despite slightly faster than average job growth in recent years, Chaparral’s unemployment rate of 12.4% is more than double the comparable five-year national rate of 5.9%.
Close proximity to a hospital can mean the difference between life and death for many who may need emergency medical services. However, the nearest hospital from the center of Chaparral is 11 miles away.
17. Immokalee, Florida
> Population: 26,773
> Median home value: $110,700
> Unemployment rate: 12.0%
> Poverty rate: 42.4%
Immokalee is an unincorporated city located in southern Florida. One of the poorest places in the country, Immokalee’s poverty rate is a staggering 42.4%, three times the 14.1% U.S. poverty rate. The negatives outcomes associated with poverty is likely worsened for many of the area’s poorest residents due to a relatively high cost of living. Goods and services are 8.5% more expensive in Immokalee than they are nationwide on average.
[in-text-ad-2]
16. Lancaster, South Carolina
> Population: 9,150
> Median home value: $136,200
> Unemployment rate: 15.0%
> Poverty rate: 34.3%
Lancaster is a relatively poor city located in northern South Carolina. Nearly 14% of households in the city live on an income of $10,000 or less per year, and at least half of all households earn less than $31,000 a year. As is the case in many cities and towns on this list, places for physical exercise like parks or recreation centers are relatively scarce in Lancaster. Just 60.9% of people in the city and surrounding county have reasonable access to such places, well below the 84.0% of Americans.
15. Micco, Florida
> Population: 8,956
> Median home value: $84,900
> Unemployment rate: 12.0%
> Poverty rate: 14.5%
Micco, Florida, is a small unincorporated place along the Indian River in eastern Florida. The area has been particularly hard hit by the opioid epidemic. In Micco and across the broader county, between 2015 and 2017 there were 35 drug overdose deaths on average each year for every 100,000 people, well above the 20 per 100,000 national rate.
Financial hardship is also more common in Micco than it is nationwide. Half of all households in Micco earn an income of less than $36,000 a year. Meanwhile, most households nationwide earn over $60,000 a year. Not only are incomes low in the town, but it also has a high cost of living, meaning a dollar does not go as far as it might elsewhere. Goods and services in Micco are 8% more expensive on average than they are nationwide.
[in-text-ad]
14. Berea, South Carolina
> Population: 14,923
> Median home value: $110,200
> Unemployment rate: 9.3%
> Poverty rate: 25.0%
Berea, an unincorporated place in northwestern South Carolina, just outside of Greenville, ranks on this list largely because its poor ranking in several quality of life measures. For example, 25.0% of the population live below the poverty line, well above the 14.1% national poverty rate. For many area residents, money is not the only factor limiting access to fresh, nutritional food. An estimated 72% of Berea residents live at least a mile from the nearest grocery store in urban areas and at least 10 miles in rural areas.
[recirclink id=563869]
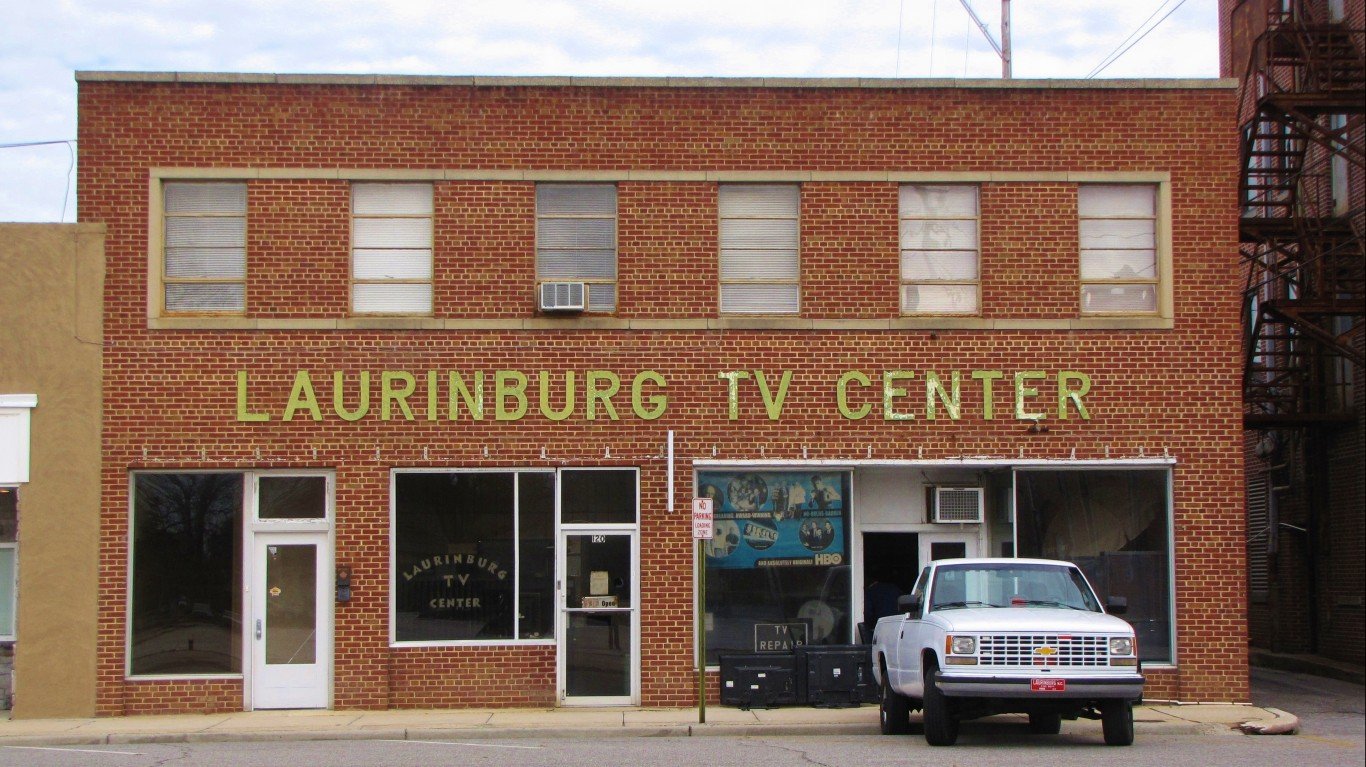
13. Laurinburg, North Carolina
> Population: 15,253
> Median home value: $102,400
> Unemployment rate: 14.2%
> Poverty rate: 34.0%
Laurinburg, a small city in southern North Carolina, ranks among the worst cities to live in largely for economic reasons. Over a third of Laurinburg residents live below the poverty line, more than double the 14.1% national poverty rate. Half of all area households earn less than $30,000 a year, and 17% of all households earn less than $10,000. Poverty in Laurinburg would likely be somewhat alleviated with a stronger job market. The city’s unemployment rate of 14.2% is more than double the comparable 5.9% national rate.
12. Beverly Hills, Florida
> Population: 9,381
> Median home value: $69,800
> Unemployment rate: 13.4%
> Poverty rate: 28.1%
Beverly Hills, Florida, is one of several southern cities, towns, and unincorporated areas on this list where a large share of the population are struggling financially. The majority of households in Beverly Hills have an income of less than $30,000 a year, and more than one in every four area residents live below the poverty line. Joblessness is also widespread as unemployment stands at 13.4%, more than double the comparable 5.9% national five year unemployment rate.
Real estate values tend to be lower in less desirable areas. In Beverly Hills, the typical home is worth just $69,800 — about one-third the value of the typical home nationwide.
[in-text-ad-2]
11. Silver Springs Shores, Florida
> Population: 8,966
> Median home value: $79,100
> Unemployment rate: 16.0%
> Poverty rate: 28.5%
Silver Springs Shores is a small unincorporated community in north-central Florida. It ranks on this list due in large part to weak economic indicators. The area’s five year unemployment rate of 16.0% is nearly triple the comparable 5.9% national rate. A weak job market is also likely discouraging labor force participation as only 34.4% of the population are employed, well below the 47.3% national average.
Quality of life in the area is reduced for many by limited access to emergency health care services. The nearest hospital to Silver Springs Shores is nearly 10 miles away.
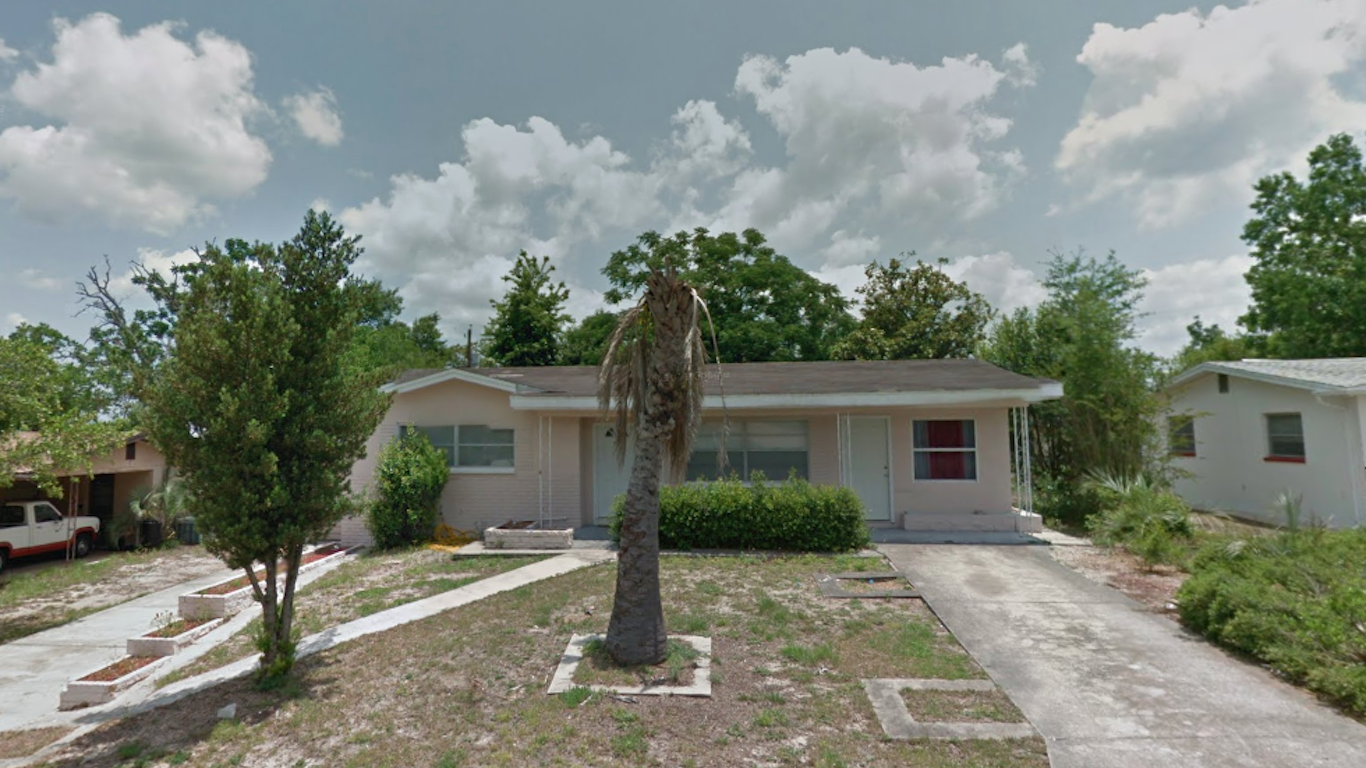
10. Shady Hills, Florida
> Population: 12,435
> Median home value: $120,000
> Unemployment rate: 9.3%
> Poverty rate: 22.8%
Shady Hills, Florida, is a small unincorporated place about 40 miles north of downtown Tampa. As is the case in many communities on this list, access to medical care in urgent situations may be difficult for those living there, as the nearest hospital is located 9.1 miles from the town. Town residents are also more likely than most Americans to have limited access to fresh, nutritious food as 60.0% of the population live far from a grocery store, compared to 42.1% of Americans nationwide.
Every corner of the country has been affected by the opioid epidemic, but Shady Hills has been affected more than most places. From 2015 to 2017, there were an annual average of 29.7 drug poisoning deaths per year in the community for every 100,000 people, well above the 20 per 100,000 national fatal overdose rate.
[in-text-ad]
9. La Homa, Texas
> Population: 12,054
> Median home value: $66,400
> Unemployment rate: 18.1%
> Poverty rate: 38.5%
La Homa is a small unincorporated town near the southern tip of Texas. One of the poorest towns in the United States, La Homa’s poverty rate stands at 38.5%, far more than double the U.S. poverty rate of 14.1%.
Joblessness is widespread in La Homa as 18.1% of the area’s labor force are unemployed, based on Census bureau five year estimates. A lack of available jobs may be driving people out of the area. Over the last five years, the number of people living in La Homa declined by 14.5%. As is often the case in areas with weak economic conditions and population decline, property values are low in the town. The typical area home is worth just $66,400, a fraction of the $204,900 the median home value nationwide.
[recirclink id=562217]
8. Conyers, Georgia
> Population: 15,882
> Median home value: $122,200
> Unemployment rate: 10.8%
> Poverty rate: 30.5%
Conyers, Georgia, is one of the poorest cities in the United States. The majority of households earn less than $40,000 a year, and over 30% of residents live below the poverty line. The low incomes are partially attributable to a lack of available jobs, as the city has a five year unemployment rate of over 10%.
Homeownership is not only one of the most practical ways to build wealth, but it also gives residents a more deeply rooted stake community affairs and an interest in positive developments. As is the case in many cities on this list, the homeownership rate in Conyers is low, standing at just 28.8%, well below the 63.8% national rate.

7. Golden Valley, Arizona
> Population: 8,673
> Median home value: $79,100
> Unemployment rate: 14.1%
> Poverty rate: 24.1%
Golden Valley, a small unincorporated town in Mohave County, ranks as the worst place to live in Arizona and seventh worst nationwide. The town’s ranking on this list is due in large part to a weak job market, with annual five year unemployment standing at 14.1%, according to the U.S. Census Bureau.
Food insecurity is also a problem for most Golden Valley residents. More than three-quarters of residents live in low access areas, meaning they live at least a mile from the nearest grocery store in urban areas and at least 10 miles in rural areas. Another hurdle for many residents is affordability. The poverty rate in Golden Valley stands at 24.1%, well above the comparable 14.1% national poverty rate.
[in-text-ad-2]
6. Poinciana, Florida
> Population: 67,169
> Median home value: $164,500
> Unemployment rate: 6.9%
> Poverty rate: 17.4%
Poinciana is an unincorporated town in central Florida. The area ranks poorly on this list due in part to a smaller than average concentration of community amenities. There are fewer restaurants, bars, fitness centers, and museums on a per capita basis in Poinciana and the surrounding county.
Those who are working in the area are more likely to spend more of their day getting to and from work than the typical American. The average commute time in Poinciana is about 44 minutes, well above the 27 minute national average. Over the course of a typical work week, this adds up to over an hour of additional commute time.
5. Irondale, Georgia
> Population: 8,578
> Median home value: $93,300
> Unemployment rate: 8.1%
> Poverty rate: 26.8%
In Irondale, Georgia and across the broader county, there were 498.1 violent crimes for every 100,000 people in 2018. Meanwhile, the national violent crime rate that year was 380.6 incidents per 100,000 people.
High crime rates can make any area a less desirable place to live and have a negative effect on real estate values. In Irondale, the typical home is worth just $93,300, less than half the national median home value of $204,900.
[in-text-ad]
4. Beecher, Michigan
> Population: 9,128
> Median home value: $28,600
> Unemployment rate: 23.1%
> Poverty rate: 38.4%
Beecher is a small unincorporated community in Michigan’s Rust Belt, located less than 10 miles north of Flint. As is the case in most areas that have suffered from industrial decline in recent decades, joblessness is widespread in Beecher. The area’s five year unemployment rate of 23.1% is nearly quadruple the comparable 5.9% national rate.
With a lack of available jobs, many in Beecher are struggling financially. The area’s poverty rate of 38.4% is far more than double the 14.1% national rate, and the majority of households in Beecher live on an income of less than $27,000 a year.
[recirclink id=554829]
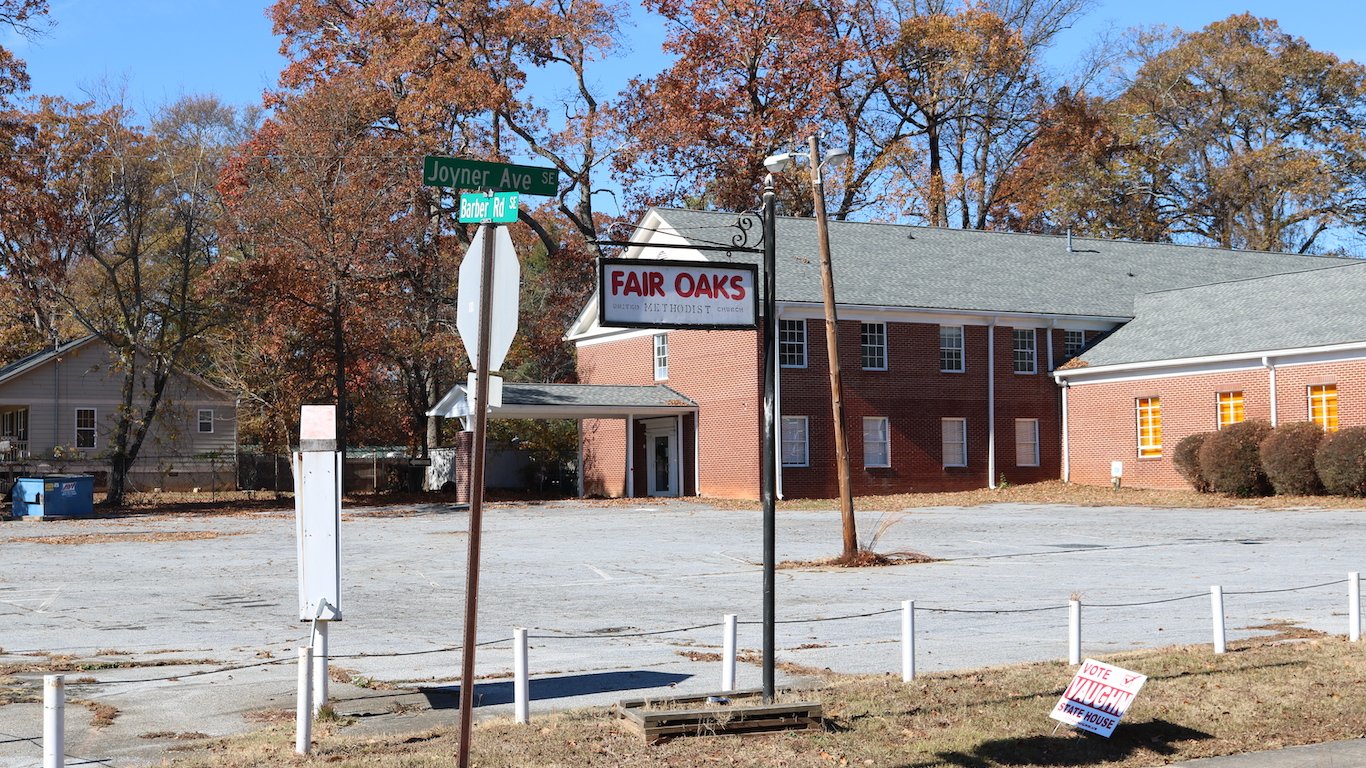
3. Fair Oaks, Georgia
> Population: 9,173
> Median home value: $100,900
> Unemployment rate: 8.1%
> Poverty rate: 32.6%
Access to fresh, nutritious food is relatively limited in Fair Oaks. Over 80% of area residents live far from a grocery store — defined as 1 mile in an urban area and 10 miles in a rural area — nearly double the 42.1% share of Americans who live in low access areas. For many in Fair Oaks, food insecurity is worsened by poverty. The poverty rate of 32.6% is more than double the comparable 14.1% national rate. A high cost of living increases the financial strain on low-income residents, as goods and services in the county are about 4% more expensive than they are nationwide, on average.
As is often the case in the communities on this list, people are leaving Fair Oaks faster than they are coming in. In the last five years, the local population fell by 1.1%.
2. Donaldsonville, Louisiana
> Population: 8,090
> Median home value: $110,800
> Unemployment rate: 14.3%
> Poverty rate: 39.4%
Donaldsonville ranks as the worst city to live in in Louisiana and the second worst in the United States. A poor city, Donaldsonville’s median annual household income is just $22,716. Additionally, a staggering 39.4% of city residents live below the poverty line. The area’s low incomes are likely attributable in part to a weak job market. Over the last five years, overall employment in the city declined by 4.9%. The city’s 14.3% five year unemployment rate is well more than double the comparable U.S. unemployment rate.
[in-text-ad-2]
1. Yazoo City, Mississippi
> Population: 11,076
> Median home value: $68,300
> Unemployment rate: 20.7%
> Poverty rate: 42.6%
Yazoo City, Mississippi, located in the state’s delta region, ranks as the worst place to live in the country largely due to economic conditions. One of the poorest places in the country, Yazoo City has a 42.6% poverty rate. Additionally, more than one in every five area households live on an income of less than $10,000 a year. The large share of poor residents is partially the result of a lack of jobs. According to the Census, unemployment in Yazoo City stands at 20.7%, well more than triple the comparable 5.9% national rate.
City residents are also less likely than the majority of Americans to have easy access to grocery stores or places like parks and recreation centers. Like many other cities and towns on this list, people are leaving Yazoo City faster than they are coming in. In the last five years, the city’s population fell by 3.5%.
Methodology
To identify the worst cities to live in, 24/7 Wall St. created a weighted index of 22 measures across three categories: economy, quality of life, and community.
1.) The economy category consists of four measures:
- Median home value was included at full weight.
- Change in employment from 2014 to 2018 was included at one-half weight.
- The ratio of the number of employed workers to the total population was included at one-half weight.
- The unemployment rate was included at full weight.
2.) The quality of life category consists of six measures:
- The poverty rate was included at full weight.
- The share of the population in urban Census tracts at least 1 mile from a grocery store and in rural Census tracts at least 10 miles from a grocery store, a measure of poor food access, was included at full weight.
- The distance from the city center to the nearest hospital was included at full weight.
- The percentage of patients discharged from acute care hospitals who are readmitted to the hospital within 30 days was included at full weight.
- The percentage of heart attack, coronary artery bypass grafting (CABG) surgery, chronic obstructive pulmonary disease (COPD), heart failure, pneumonia, and stroke patients who pass away within 30 days of treatment was included at full weight.
- The number of drug-related fatalities per 100,000 residents was included at one-quarter weight.
3.) The community category consists of 12 measures:
- The percentage of workers 16 and over commuting by public transit, walking, or other non-car means was included at one-half weight.
- The average travel time to work was included at full weight.
- The number of hospital admissions for conditions that could be treated in an outpatient setting per 1,000 Medicare enrollees — an indication of poor outpatient care and overuse of hospitals — was included at one-half weight.
- The number of violent crimes — homicide, rape, robbery, and aggravated assault — reported per 100,000 residents was included at full weight.
- The number of property crimes — burglary, larceny, motor vehicle theft, and arson — reported per 100,000 residents was included at full weight.
- The number of movie theaters per 100,000 residents was included at one-quarter weight.
- The number of libraries and archives per 100,000 residents was included at one-quarter weight.
- The number of theater companies and dinner theaters per 100,000 residents was included at one-quarter weight.
- The number of museums per 100,000 residents was included at one-quarter weight.
- The number of nature parks and similar places per 100,000 residents was included at one-quarter weight.
- The number of alcoholic drinking places per 100,000 residents was included at one-quarter weight.
- The number of restaurants and other eating places per 100,000 residents was included at one-quarter weight.
Data on population, employment, unemployment, median home value, median household income, commuter characteristics, average travel time to work, and poverty came from the U.S. Census Bureau’s American Community Survey and are five-year estimates for the period 2014 to 2018. Employment data used to calculate employment growth are five-year estimates for the years 2010 to 2014 and 2014 to 2018. Data on cost of living came from real estate analysis company ATTOM Data Solutions and are for the year 2014.
Data on the share of the population in urban census tracts at least 1 mile from a grocery store and in rural census tracts at least 10 miles from a grocery store, a measure of poor food access, came from the U.S. Department of Agriculture’s 2017 update to the Food Access Research Atlas and is at the county level.
Data on hospital locations came from the Centers for Medicare & Medicaid Services. Data on 30-day readmission rates and 30-day mortality rates also came from the CMS and are for the period July 2015 to June 2018. Data was aggregated to the city level for cities with at least one hospital, and was aggregated to the county level for cities with no hospitals. Data on the number of drug-related deaths per 100,000 residents per year from the period 2015 to 2017 is from the Centers for Disease Control and Prevention and is at the county level. Data on preventable hospitalizations per 1,000 Medicare enrollees came from the 2019 County Health Rankings and Roadmaps program, a collaboration between the Robert Wood Johnson Foundation and University of Wisconsin Population Health Institute, and is at the county level.
Data on the number of violent crimes and property crimes reported per 100,000 residents came from the FBI’s Uniform Crime Reporting Program and are for 2018.
Data on the number of movie theaters, libraries and archives, theater companies and dinner theaters, museums, nature parks and other similar places, alcoholic beverage drinking places, and restaurants and other eating places came from the Census Bureau’s 2017 County Business Patterns series and is at the county level.
To avoid geographic clustering, we only took the lowest-ranking city in a given county. Our list includes cities, towns, villages, boroughs, and Census designated places. We did not include places with fewer than 8,000 residents in our analysis. Additionally, we excluded cities and towns where the poverty rate or unemployment rate were below the national average or where the population consisted of 20% college students or more, as well as cities and towns that were missing more than one-third of the data points we considered in our analysis.
Contact [email protected] for any questions or corrections.