
The surge of COVID-19 in the United States continues. As of June 28, at least 55,000 new daily cases have been reported nationwide for the past three weeks, more than double the daily figures from early June.
The rise in cases has been particularly sharp in states in the South and Southwest. Earlier this month, Florida reported over 15,000 new cases, surpassing the previous record set by New York state in early April. Several states in the South and West have surpassed states in the Northeast as the leaders for cumulative reported COVID-19 cases per capita.
While new cases of the virus are spiking dramatically nationwide, in some metropolitan areas, the average daily increase dwarfs that of the U.S. as a whole, adjusting for population.
Using data from state and local health departments, 24/7 Wall St. compiled and reviewed the average number of new daily confirmed COVID-19 cases for the week ending July 27 and compared it to the average of new daily cases from the previous week to determine the cities where the virus is growing the fastest. For comparison purposes, we adjusted the number of confirmed cases per 100,000 people. We excluded metropolitan areas where fewer than 20 new cases were reported in the past 14 days.
Nationwide, the average number of new daily cases climbed only slightly, week-over-week, by less than one case per 100,000 people. Average daily cases in these 29 metro areas climbed by at least 10 cases per 100,000 residents this week compared to the previous one, and by as many as 76.
Surges in COVID-19 cases among the metro areas on this list are driving up overall infection rates in their respective states. For example, more than 20 of the 29 cities on this list are located in one of eight southern or western states, notably California, which has a nation-highest six. It is no coincidence that the majority of these states have among the fastest reported increases in new COVID-19 cases. Here is a complete list of the states where the virus is spreading the fastest right now.

29. Racine, WI
> Change in daily avg. new COVID-19 cases week over week: +10 per 100,000 people
> Avg. new daily cases in 7 days ending July 27: 24 per 100,000
> Avg. new daily cases in 7 days ending July 20: 14 per 100,000
> Cumulative confirmed COVID-19 cases as of July 27: 1,510 per 100,000 people (total: 2,951)
> COVID-19 related deaths as of July 27: 72
> Population: 196,584
> Avg. new daily cases in Wisconsin in 7 days ending July 27: 16 per 100,000 (20th most)
[in-text-ad]

28. Sumter, SC
> Change in daily avg. new COVID-19 cases week over week: +10 per 100,000 people
> Avg. new daily cases in 7 days ending July 27: 47 per 100,000
> Avg. new daily cases in 7 days ending July 20: 37 per 100,000
> Cumulative confirmed COVID-19 cases as of July 27: 1,952 per 100,000 people (total: 2,753)
> COVID-19 related deaths as of July 27: 88
> Population: 106,512
> Avg. new daily cases in South Carolina in 7 days ending July 27: 34 per 100,000 (8th most)
[recirclink id=726259]
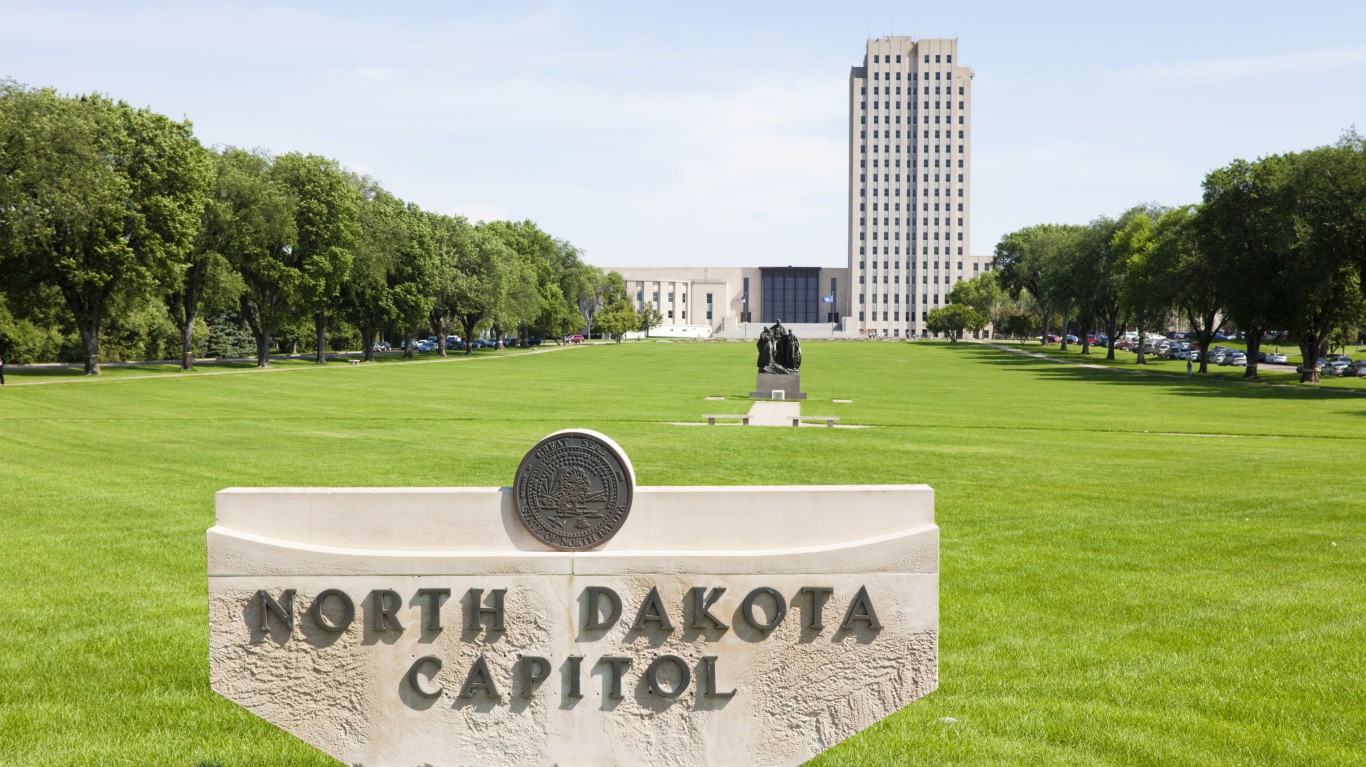
27. Bismarck, ND
> Change in daily avg. new COVID-19 cases week over week: +10 per 100,000 people
> Avg. new daily cases in 7 days ending July 27: 26 per 100,000
> Avg. new daily cases in 7 days ending July 20: 16 per 100,000
> Cumulative confirmed COVID-19 cases as of July 27: 813 per 100,000 people (total: 1,025)
> COVID-19 related deaths as of July 27: 6
> Population: 132,317
> Avg. new daily cases in North Dakota in 7 days ending July 27: 15 per 100,000 (21st most)

26. Las Vegas-Henderson-Paradise, NV
> Change in daily avg. new COVID-19 cases week over week: +10 per 100,000 people
> Avg. new daily cases in 7 days ending July 27: 50 per 100,000
> Avg. new daily cases in 7 days ending July 20: 40 per 100,000
> Cumulative confirmed COVID-19 cases as of July 27: 1,751 per 100,000 people (total: 37,492)
> COVID-19 related deaths as of July 27: 606
> Population: 2,231,647
> Avg. new daily cases in Nevada in 7 days ending July 27: 38 per 100,000 (5th most)
[in-text-ad-2]

25. Merced, CA
> Change in daily avg. new COVID-19 cases week over week: +10 per 100,000 people
> Avg. new daily cases in 7 days ending July 27: 38 per 100,000
> Avg. new daily cases in 7 days ending July 20: 28 per 100,000
> Cumulative confirmed COVID-19 cases as of July 27: 1,208 per 100,000 people (total: 3,251)
> COVID-19 related deaths as of July 27: 27
> Population: 274,765
> Avg. new daily cases in California in 7 days ending July 27: 25 per 100,000 (13th most)

24. Pine Bluff, AR
> Change in daily avg. new COVID-19 cases week over week: +11 per 100,000 people
> Avg. new daily cases in 7 days ending July 27: 37 per 100,000
> Avg. new daily cases in 7 days ending July 20: 26 per 100,000
> Cumulative confirmed COVID-19 cases as of July 27: 2,617 per 100,000 people (total: 2,417)
> COVID-19 related deaths as of July 27: 48
> Population: 90,306
> Avg. new daily cases in Arkansas in 7 days ending July 27: 25 per 100,000 (12th most)
[in-text-ad]

23. Dothan, AL
> Change in daily avg. new COVID-19 cases week over week: +11 per 100,000 people
> Avg. new daily cases in 7 days ending July 27: 34 per 100,000
> Avg. new daily cases in 7 days ending July 20: 23 per 100,000
> Cumulative confirmed COVID-19 cases as of July 27: 1,050 per 100,000 people (total: 1,554)
> COVID-19 related deaths as of July 27: 14
> Population: 148,245
> Avg. new daily cases in Alabama in 7 days ending July 27: 35 per 100,000 (7th most)
[recirclink id=726192]

22. Idaho Falls, ID
> Change in daily avg. new COVID-19 cases week over week: +12 per 100,000 people
> Avg. new daily cases in 7 days ending July 27: 22 per 100,000
> Avg. new daily cases in 7 days ending July 20: 10 per 100,000
> Cumulative confirmed COVID-19 cases as of July 27: 451 per 100,000 people (total: 645)
> COVID-19 related deaths as of July 27: 2
> Population: 149,051
> Avg. new daily cases in Idaho in 7 days ending July 27: 31 per 100,000 (10th most)

21. Sebring-Avon Park, FL
> Change in daily avg. new COVID-19 cases week over week: +12 per 100,000 people
> Avg. new daily cases in 7 days ending July 27: 38 per 100,000
> Avg. new daily cases in 7 days ending July 20: 26 per 100,000
> Cumulative confirmed COVID-19 cases as of July 27: 1,046 per 100,000 people (total: 1,068)
> COVID-19 related deaths as of July 27: 22
> Population: 105,424
> Avg. new daily cases in Florida in 7 days ending July 27: 51 per 100,000 (the most)
[in-text-ad-2]
20. Valdosta, GA
> Change in daily avg. new COVID-19 cases week over week: +12 per 100,000 people
> Avg. new daily cases in 7 days ending July 27: 49 per 100,000
> Avg. new daily cases in 7 days ending July 20: 37 per 100,000
> Cumulative confirmed COVID-19 cases as of July 27: 2,362 per 100,000 people (total: 3,415)
> COVID-19 related deaths as of July 27: 42
> Population: 145,577
> Avg. new daily cases in Georgia in 7 days ending July 27: 37 per 100,000 (6th most)

19. Stockton, CA
> Change in daily avg. new COVID-19 cases week over week: +12 per 100,000 people
> Avg. new daily cases in 7 days ending July 27: 42 per 100,000
> Avg. new daily cases in 7 days ending July 20: 30 per 100,000
> Cumulative confirmed COVID-19 cases as of July 27: 1,453 per 100,000 people (total: 10,637)
> COVID-19 related deaths as of July 27: 110
> Population: 752,660
> Avg. new daily cases in California in 7 days ending July 27: 25 per 100,000 (13th most)
[in-text-ad]

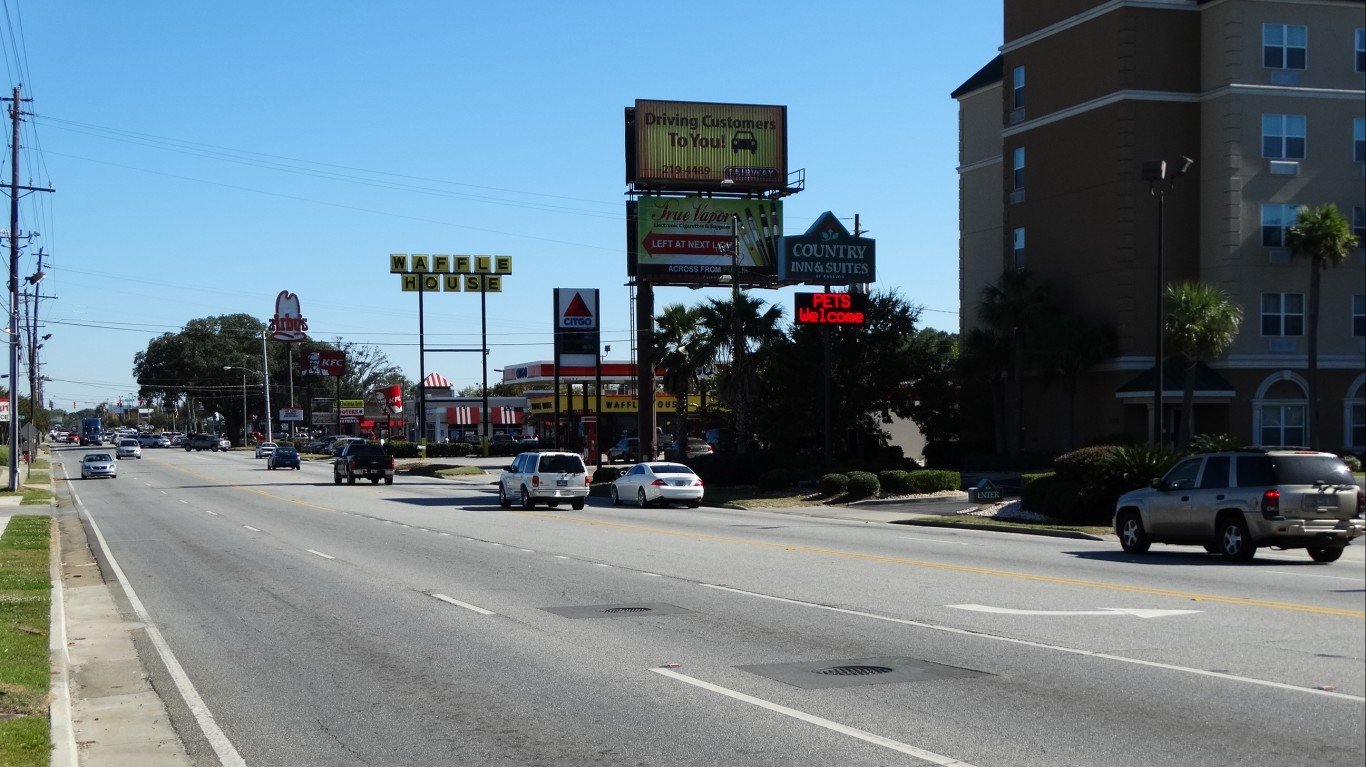
18. Panama City, FL
> Change in daily avg. new COVID-19 cases week over week: +12 per 100,000 people
> Avg. new daily cases in 7 days ending July 27: 67 per 100,000
> Avg. new daily cases in 7 days ending July 20: 55 per 100,000
> Cumulative confirmed COVID-19 cases as of July 27: 1,658 per 100,000 people (total: 3,026)
> COVID-19 related deaths as of July 27: 15
> Population: 202,977
> Avg. new daily cases in Florida in 7 days ending July 27: 51 per 100,000 (the most)
[recirclink id=726211]

17. Johnson City, TN
> Change in daily avg. new COVID-19 cases week over week: +12 per 100,000 people
> Avg. new daily cases in 7 days ending July 27: 26 per 100,000
> Avg. new daily cases in 7 days ending July 20: 14 per 100,000
> Cumulative confirmed COVID-19 cases as of July 27: 584 per 100,000 people (total: 1,176)
> COVID-19 related deaths as of July 27: 4
> Population: 203,921
> Avg. new daily cases in Tennessee in 7 days ending July 27: 33 per 100,000 (9th most)

16. Alexandria, LA
> Change in daily avg. new COVID-19 cases week over week: +13 per 100,000 people
> Avg. new daily cases in 7 days ending July 27: 42 per 100,000
> Avg. new daily cases in 7 days ending July 20: 29 per 100,000
> Cumulative confirmed COVID-19 cases as of July 27: 1,941 per 100,000 people (total: 2,987)
> COVID-19 related deaths as of July 27: 101
> Population: 153,044
> Avg. new daily cases in Louisiana in 7 days ending July 27: 47 per 100,000 (2nd most)
[in-text-ad-2]

15. Tallahassee, FL
> Change in daily avg. new COVID-19 cases week over week: +13 per 100,000 people
> Avg. new daily cases in 7 days ending July 27: 50 per 100,000
> Avg. new daily cases in 7 days ending July 20: 37 per 100,000
> Cumulative confirmed COVID-19 cases as of July 27: 1,515 per 100,000 people (total: 5,757)
> COVID-19 related deaths as of July 27: 33
> Population: 387,455
> Avg. new daily cases in Florida in 7 days ending July 27: 51 per 100,000 (the most)

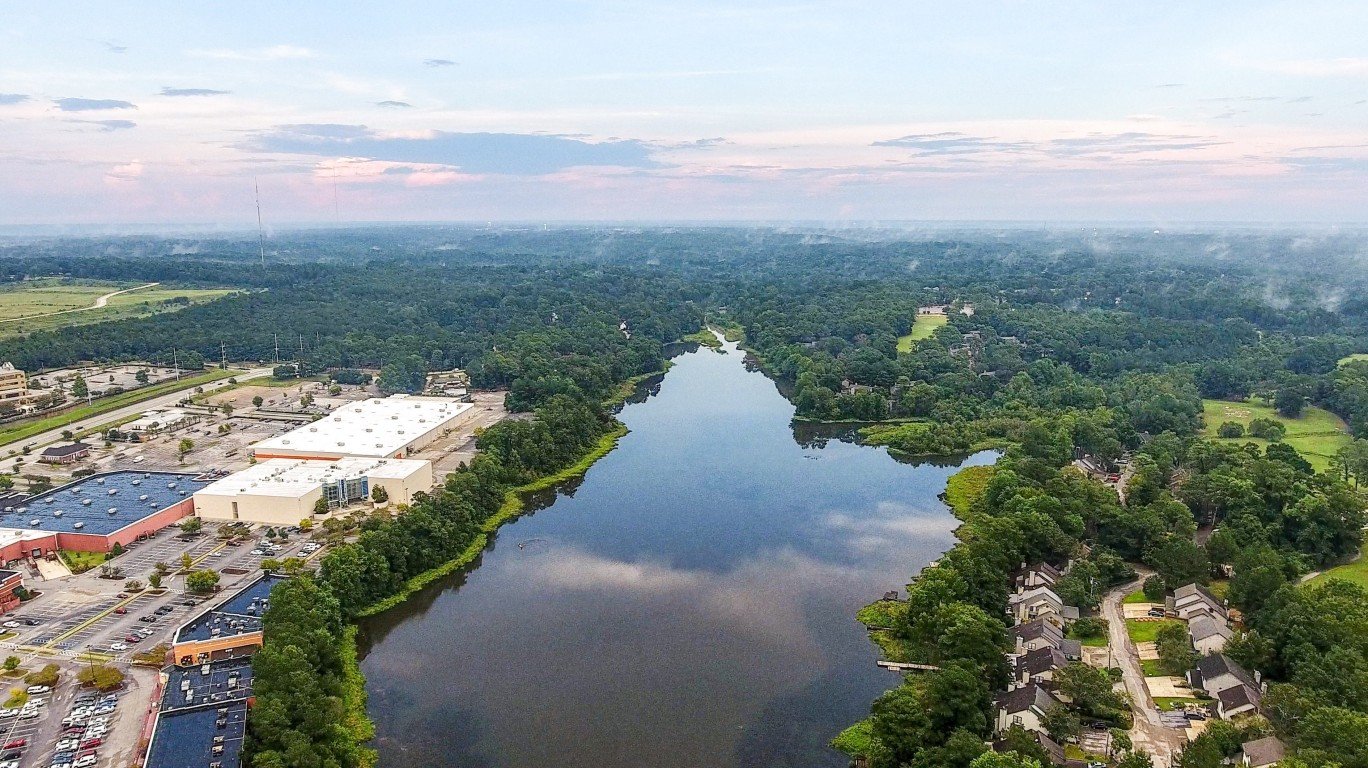
14. Morristown, TN
> Change in daily avg. new COVID-19 cases week over week: +13 per 100,000 people
> Avg. new daily cases in 7 days ending July 27: 37 per 100,000
> Avg. new daily cases in 7 days ending July 20: 24 per 100,000
> Cumulative confirmed COVID-19 cases as of July 27: 1,082 per 100,000 people (total: 1,515)
> COVID-19 related deaths as of July 27: 12
> Population: 118,581
> Avg. new daily cases in Tennessee in 7 days ending July 27: 33 per 100,000 (9th most)
[in-text-ad]

13. Madera, CA
> Change in daily avg. new COVID-19 cases week over week: +14 per 100,000 people
> Avg. new daily cases in 7 days ending July 27: 40 per 100,000
> Avg. new daily cases in 7 days ending July 20: 27 per 100,000
> Cumulative confirmed COVID-19 cases as of July 27: 1,125 per 100,000 people (total: 1,744)
> COVID-19 related deaths as of July 27: 19
> Population: 157,672
> Avg. new daily cases in California in 7 days ending July 27: 25 per 100,000 (13th most)
[recirclink id=726166]

12. Hot Springs, AR
> Change in daily avg. new COVID-19 cases week over week: +14 per 100,000 people
> Avg. new daily cases in 7 days ending July 27: 28 per 100,000
> Avg. new daily cases in 7 days ending July 20: 14 per 100,000
> Cumulative confirmed COVID-19 cases as of July 27: 707 per 100,000 people (total: 695)
> COVID-19 related deaths as of July 27: 5
> Population: 99,154
> Avg. new daily cases in Arkansas in 7 days ending July 27: 25 per 100,000 (12th most)

11. Visalia, CA
> Change in daily avg. new COVID-19 cases week over week: +14 per 100,000 people
> Avg. new daily cases in 7 days ending July 27: 43 per 100,000
> Avg. new daily cases in 7 days ending July 20: 29 per 100,000
> Cumulative confirmed COVID-19 cases as of July 27: 1,822 per 100,000 people (total: 8,392)
> COVID-19 related deaths as of July 27: 168
> Population: 465,861
> Avg. new daily cases in California in 7 days ending July 27: 25 per 100,000 (13th most)
[in-text-ad-2]
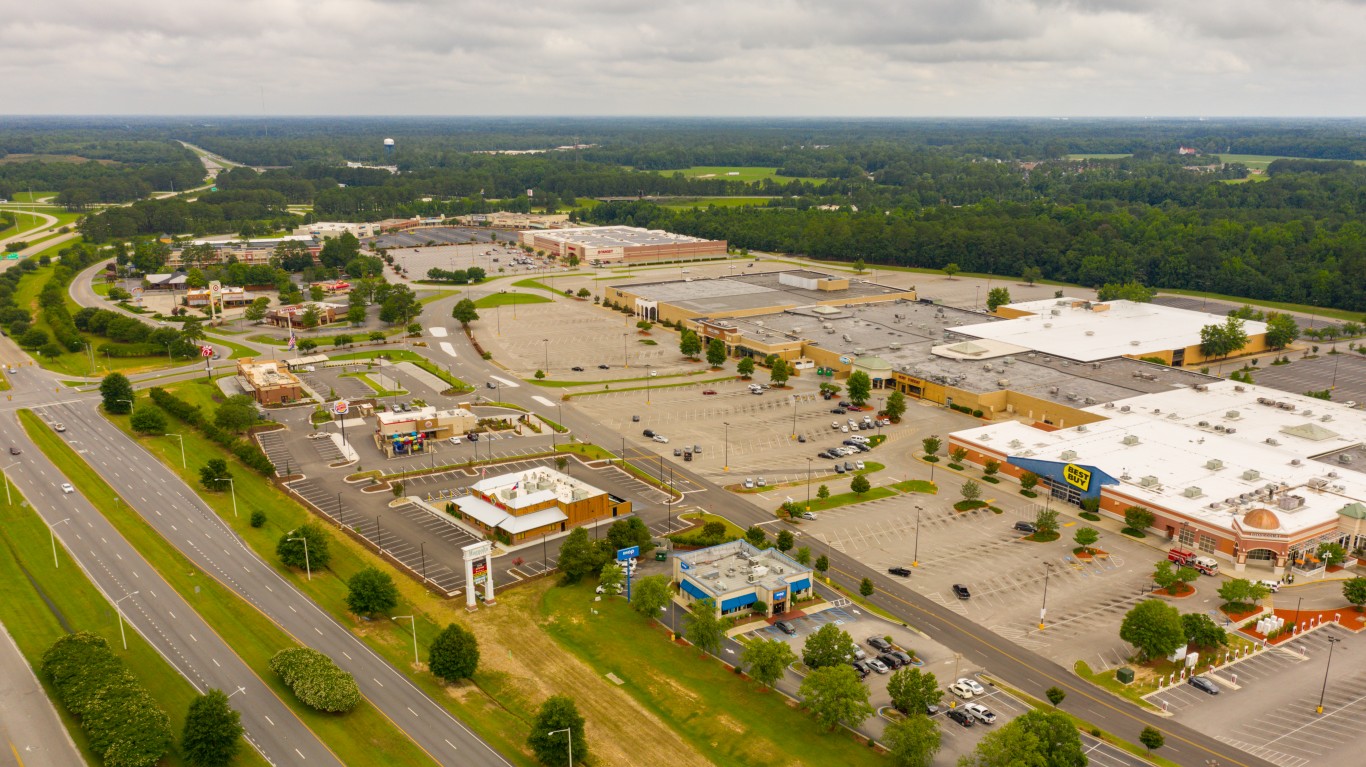
10. Florence, SC
> Change in daily avg. new COVID-19 cases week over week: +14 per 100,000 people
> Avg. new daily cases in 7 days ending July 27: 45 per 100,000
> Avg. new daily cases in 7 days ending July 20: 31 per 100,000
> Cumulative confirmed COVID-19 cases as of July 27: 1,670 per 100,000 people (total: 3,437)
> COVID-19 related deaths as of July 27: 117
> Population: 204,961
> Avg. new daily cases in South Carolina in 7 days ending July 27: 34 per 100,000 (8th most)

9. Jackson, MS
> Change in daily avg. new COVID-19 cases week over week: +14 per 100,000 people
> Avg. new daily cases in 7 days ending July 27: 46 per 100,000
> Avg. new daily cases in 7 days ending July 20: 32 per 100,000
> Cumulative confirmed COVID-19 cases as of July 27: 1,922 per 100,000 people (total: 11,503)
> COVID-19 related deaths as of July 27: 243
> Population: 583,080
> Avg. new daily cases in Mississippi in 7 days ending July 27: 42 per 100,000 (3rd most)
[in-text-ad]

8. Gulfport-Biloxi, MS
> Change in daily avg. new COVID-19 cases week over week: +16 per 100,000 people
> Avg. new daily cases in 7 days ending July 27: 33 per 100,000
> Avg. new daily cases in 7 days ending July 20: 17 per 100,000
> Cumulative confirmed COVID-19 cases as of July 27: 934 per 100,000 people (total: 3,826)
> COVID-19 related deaths as of July 27: 69
> Population: 397,261
> Avg. new daily cases in Mississippi in 7 days ending July 27: 42 per 100,000 (3rd most)
[recirclink id=725842]

7. Wenatchee, WA
> Change in daily avg. new COVID-19 cases week over week: +17 per 100,000 people
> Avg. new daily cases in 7 days ending July 27: 47 per 100,000
> Avg. new daily cases in 7 days ending July 20: 30 per 100,000
> Cumulative confirmed COVID-19 cases as of July 27: 1,380 per 100,000 people (total: 1,616)
> COVID-19 related deaths as of July 27: 14
> Population: 119,943
> Avg. new daily cases in Washington in 7 days ending July 27: 12 per 100,000 (25th fewest)
6. Daphne-Fairhope-Foley, AL
> Change in daily avg. new COVID-19 cases week over week: +17 per 100,000 people
> Avg. new daily cases in 7 days ending July 27: 53 per 100,000
> Avg. new daily cases in 7 days ending July 20: 36 per 100,000
> Cumulative confirmed COVID-19 cases as of July 27: 1,310 per 100,000 people (total: 2,727)
> COVID-19 related deaths as of July 27: 17
> Population: 218,022
> Avg. new daily cases in Alabama in 7 days ending July 27: 35 per 100,000 (7th most)
[in-text-ad-2]

5. San Antonio-New Braunfels, TX
> Change in daily avg. new COVID-19 cases week over week: +17 per 100,000 people
> Avg. new daily cases in 7 days ending July 27: 48 per 100,000
> Avg. new daily cases in 7 days ending July 20: 30 per 100,000
> Cumulative confirmed COVID-19 cases as of July 27: 1,440 per 100,000 people (total: 34,927)
> COVID-19 related deaths as of July 27: 390
> Population: 2,518,036
> Avg. new daily cases in Texas in 7 days ending July 27: 29 per 100,000 (11th most)

4. Hanford-Corcoran, CA
> Change in daily avg. new COVID-19 cases week over week: +18 per 100,000 people
> Avg. new daily cases in 7 days ending July 27: 41 per 100,000
> Avg. new daily cases in 7 days ending July 20: 23 per 100,000
> Cumulative confirmed COVID-19 cases as of July 27: 2,393 per 100,000 people (total: 3,591)
> COVID-19 related deaths as of July 27: 47
> Population: 151,366
> Avg. new daily cases in California in 7 days ending July 27: 25 per 100,000 (13th most)
[in-text-ad]

3. Victoria, TX
> Change in daily avg. new COVID-19 cases week over week: +21 per 100,000 people
> Avg. new daily cases in 7 days ending July 27: 105 per 100,000
> Avg. new daily cases in 7 days ending July 20: 84 per 100,000
> Cumulative confirmed COVID-19 cases as of July 27: 2,953 per 100,000 people (total: 2,938)
> COVID-19 related deaths as of July 27: 28
> Population: 99,047
> Avg. new daily cases in Texas in 7 days ending July 27: 29 per 100,000 (11th most)
[recirclink id=726259]
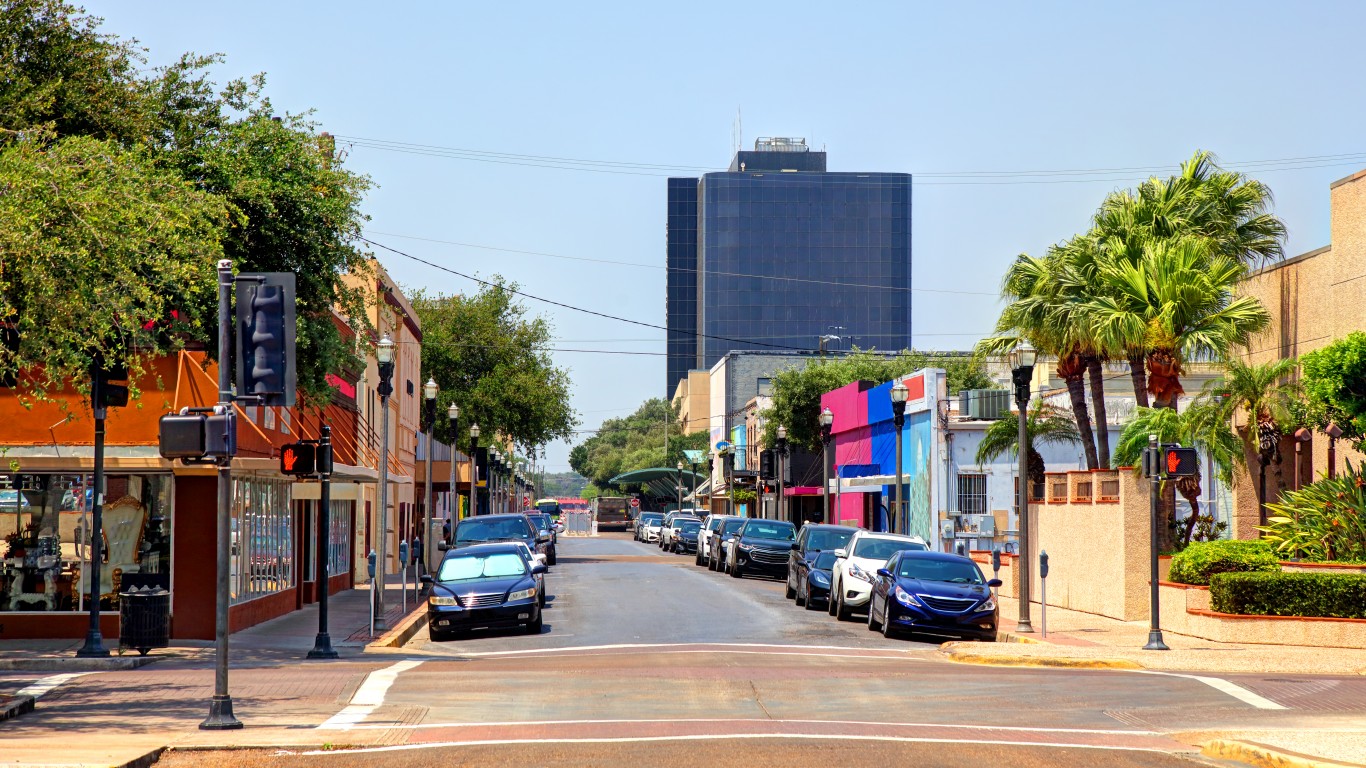
2. McAllen-Edinburg-Mission, TX
> Change in daily avg. new COVID-19 cases week over week: +26 per 100,000 people
> Avg. new daily cases in 7 days ending July 27: 78 per 100,000
> Avg. new daily cases in 7 days ending July 20: 52 per 100,000
> Cumulative confirmed COVID-19 cases as of July 27: 1,784 per 100,000 people (total: 15,153)
> COVID-19 related deaths as of July 27: 456
> Population: 865,939
> Avg. new daily cases in Texas in 7 days ending July 27: 29 per 100,000 (11th most)

1. Bakersfield, CA
> Change in daily avg. new COVID-19 cases week over week: +76 per 100,000 people
> Avg. new daily cases in 7 days ending July 27: 105 per 100,000
> Avg. new daily cases in 7 days ending July 20: 29 per 100,000
> Cumulative confirmed COVID-19 cases as of July 27: 1,970 per 100,000 people (total: 17,394)
> COVID-19 related deaths as of July 27: 123
> Population: 896,764
> Avg. new daily cases in California in 7 days ending July 27: 25 per 100,000 (13th most)
Contact [email protected] for any questions or corrections.