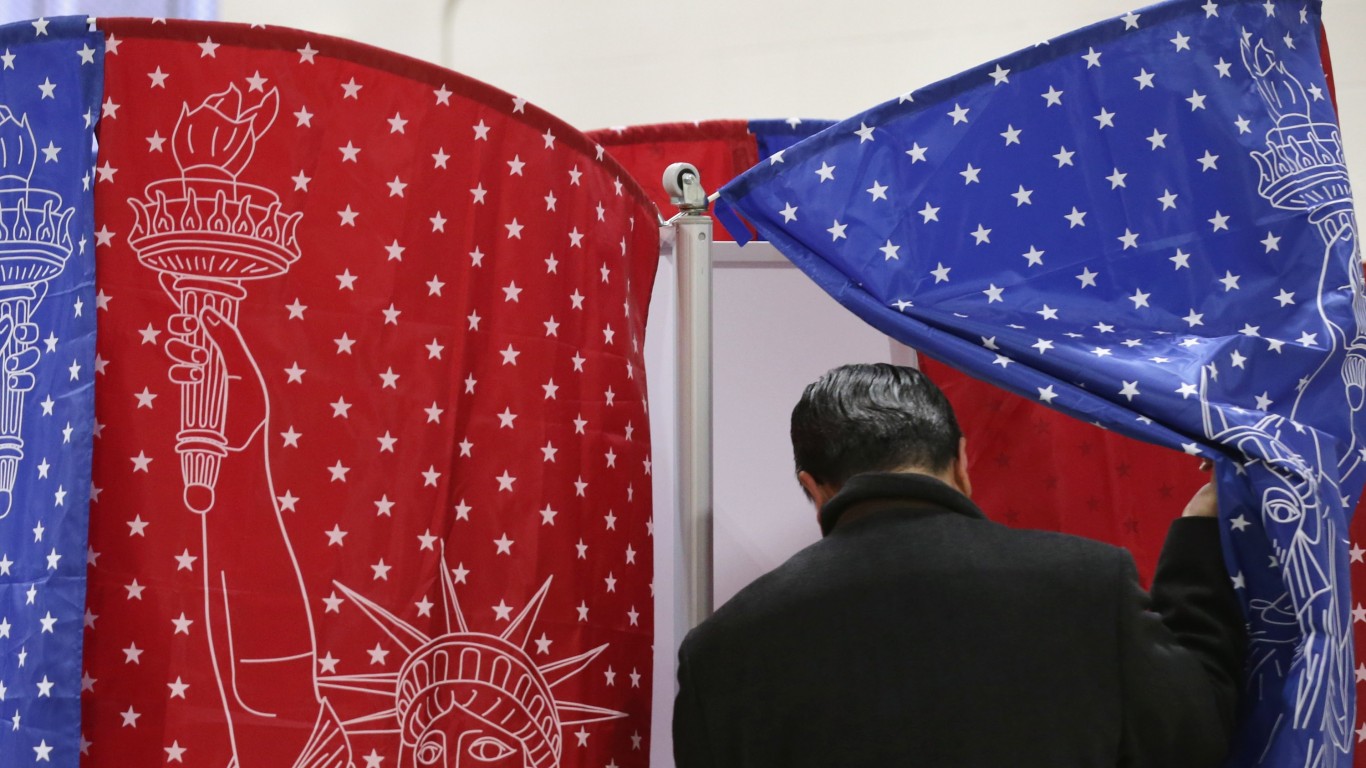
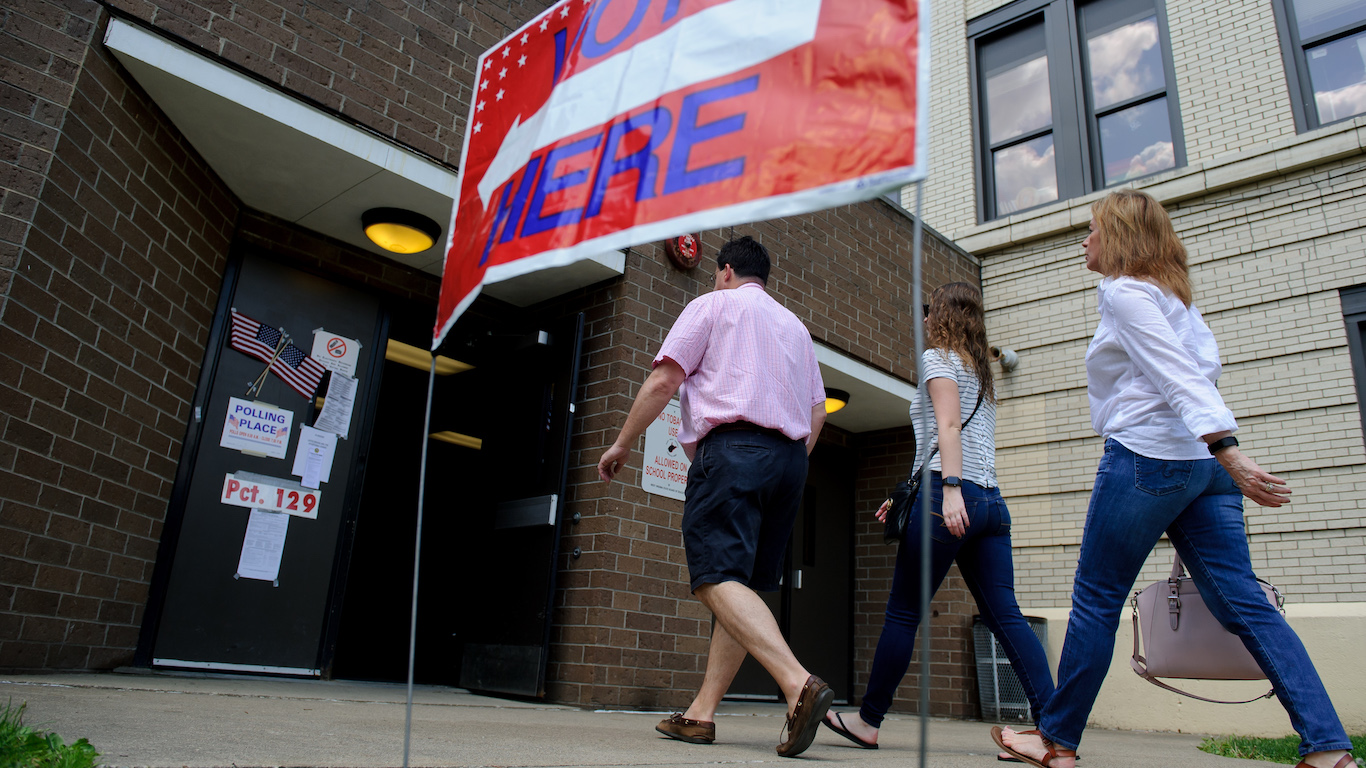
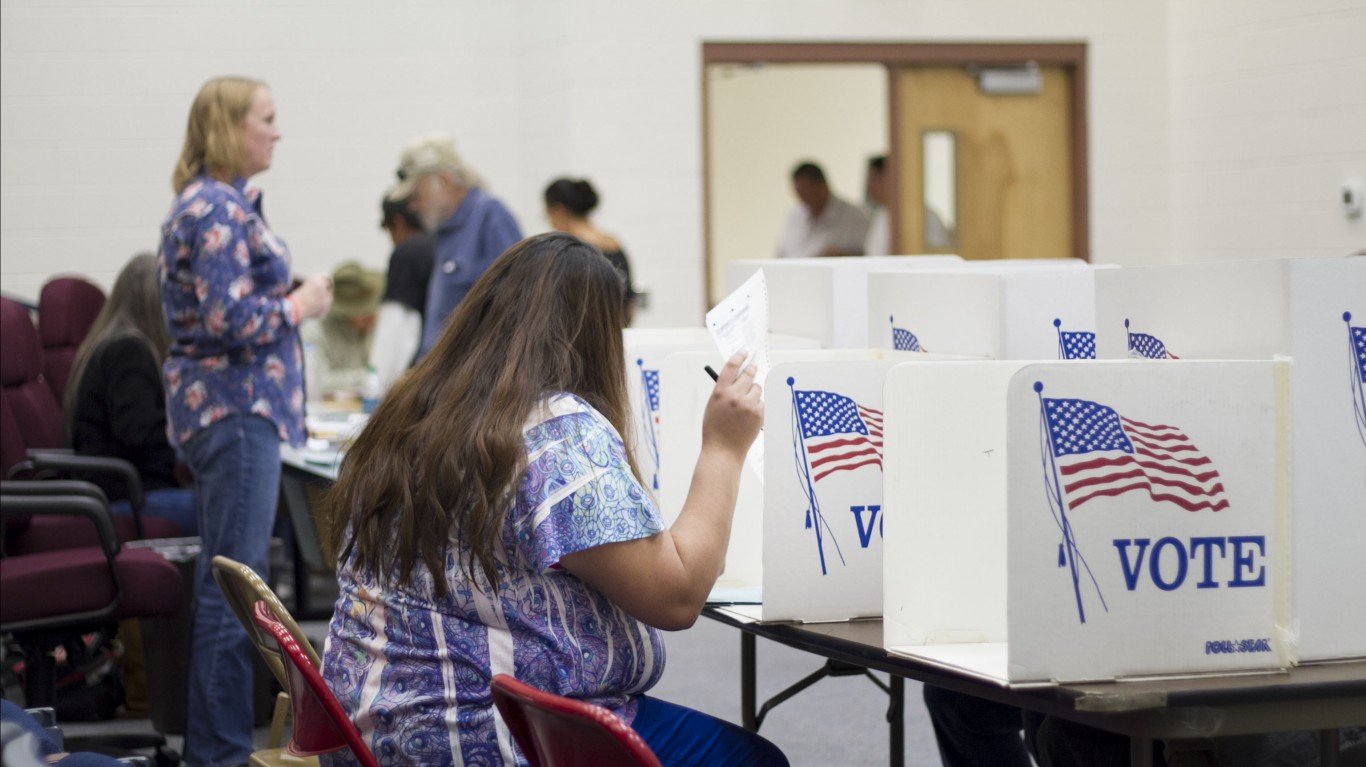
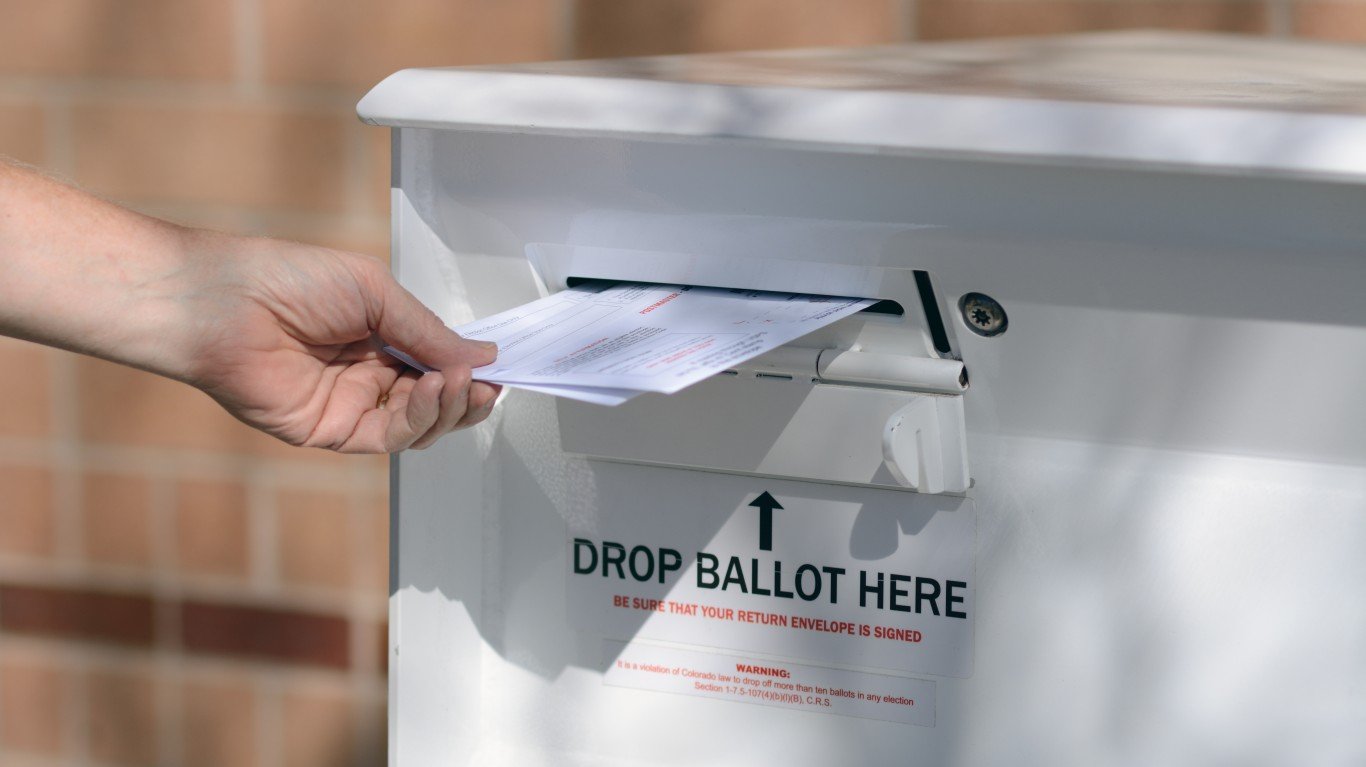
Participation in the democratic process is a fundamental right and responsibility of American citizens age 18 and older. A few days before Election Day on Nov. 3, 2020, Americans are already breaking voting records. About 93 million have cast early ballots, almost twice as many pre-election votes in 2016 and 68% of the total votes counted in the 2016 election.
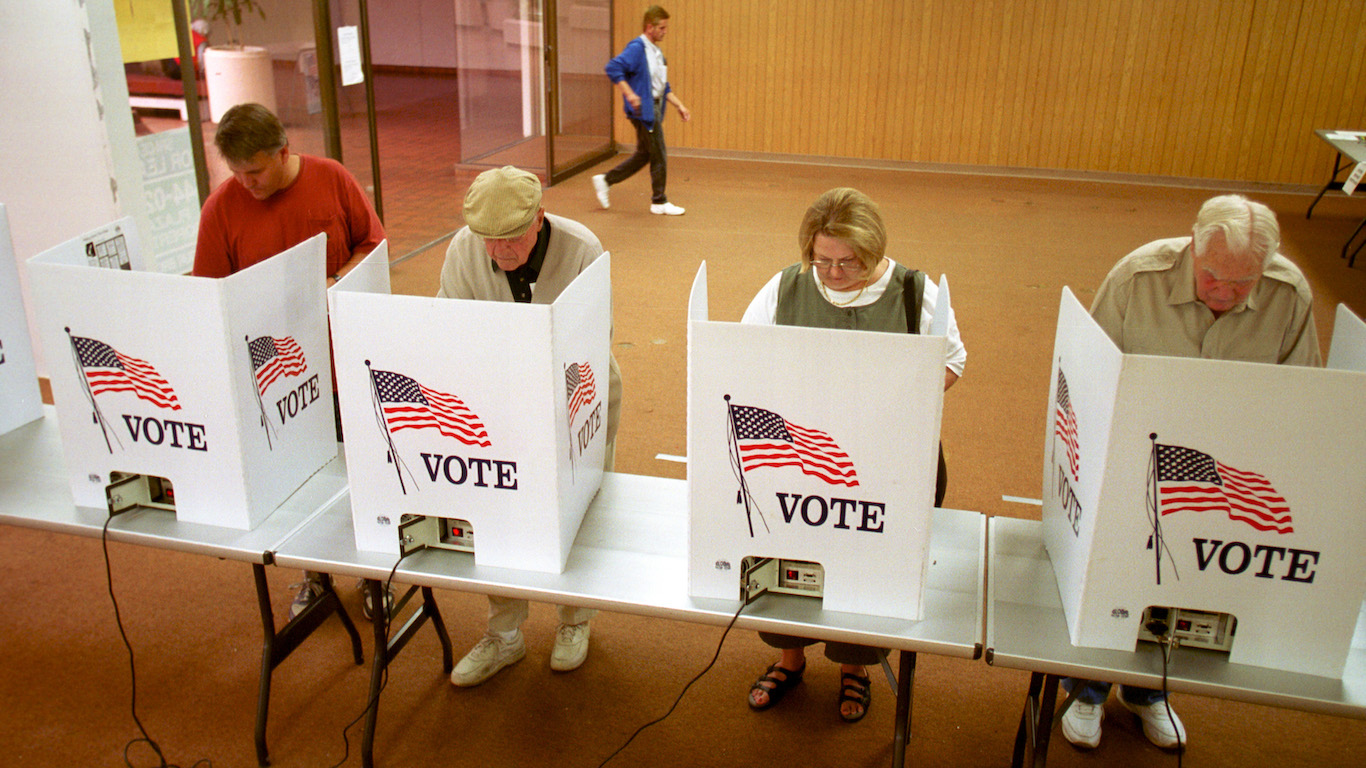
Voter turnout is not even nationwide, however, and some states tend to have far more civically engaged residents than others. Using state-level voter-participation data from the U.S. Census Bureau, 24/7 Wall St. ranked states by voter turnout, from the lowest to the highest.
In nearly every midterm congressional election since 1986, fewer than half of all eligible adults cast a vote. The only exception is the 2018 election, when 53.4% of voting-age adults cast a ballot. The turnout marked the highest participation rate in a midterm election in recent history. Pundits speculate that the record turnout was partially a reaction to the multiple controversies that have engulfed the Trump administration. These are 50 most important events since Trump was elected president.
Age demographics partially explain the increased voter turnout in the highest ranking states on this list. Older Americans — those 65 and older — are the most likely to vote. In seven of the 10 states with the highest voter turnout, the share of residents 65 and older is higher than the 15.6% national share.
Economic factors also influence voter turnout at a state level. Higher-income Americans are far more likely to vote than those at the lower end of the income spectrum. In eight of the 10 states with the highest voter participation, the poverty rate is lower than the 13.4% national rate. Here is a full list of America’s richest and poorest states.
Click here to see the states with the highest voter turnout
Methodology
To identify the states with the highest and lowest voter turnout rates, 24/7 Wall St. reviewed the percentage of voting-age citizens in each state who cast a ballot in the 2018 midterm election. All voter turnout data came from the Current Population Survey, conducted by the U.S. Census Bureau. The percentage of the population that is 65 and older and the poverty rate are one-year estimates from the U.S. Census Bureau’s American Community Survey.
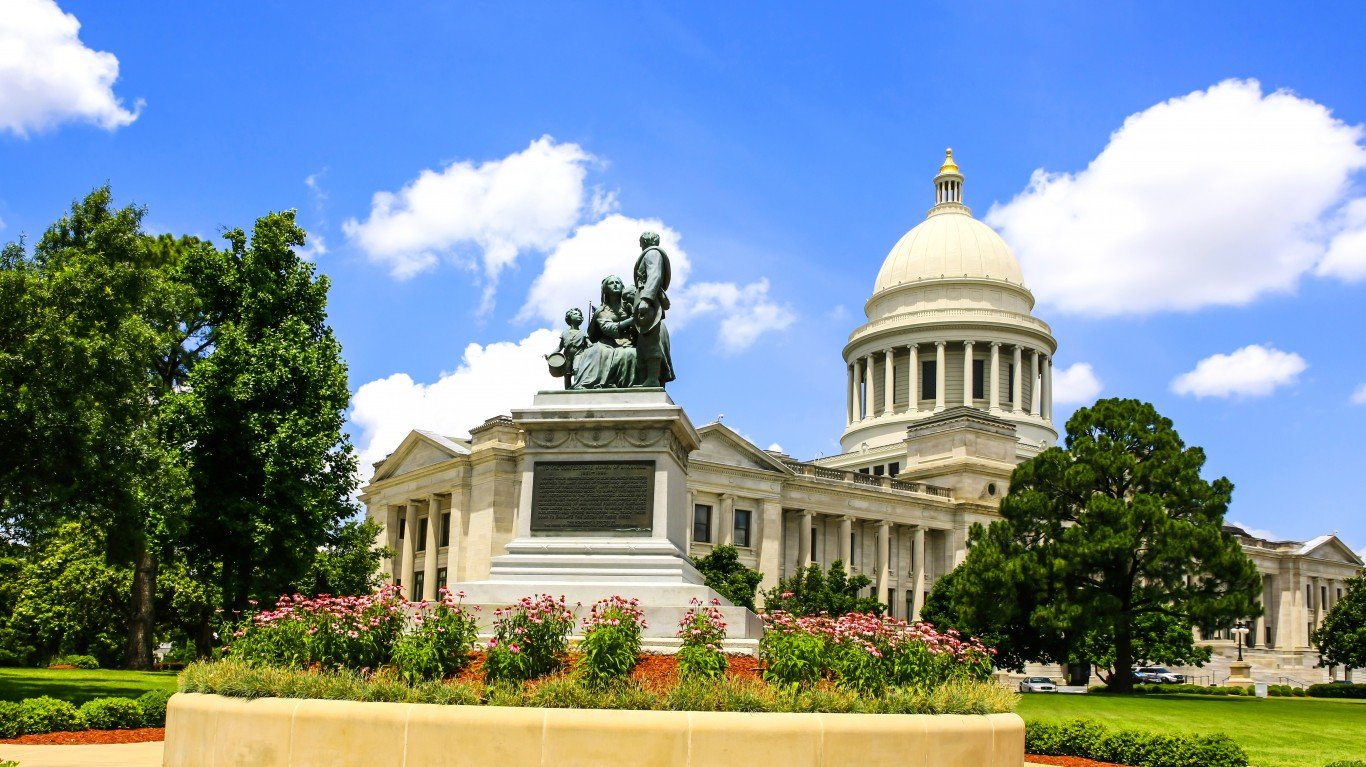
50. Arkansas
> 2018 midterm election turnout: 42.6%
> 2016 presidential election turnout: 58.7% (12th lowest)
> 2016 general election result: Trump, by 26.6 percentage points
> Population 65 and older: 16.5% (19th highest)
> Poverty rate: 16.4% (7th highest)
[in-text-ad]
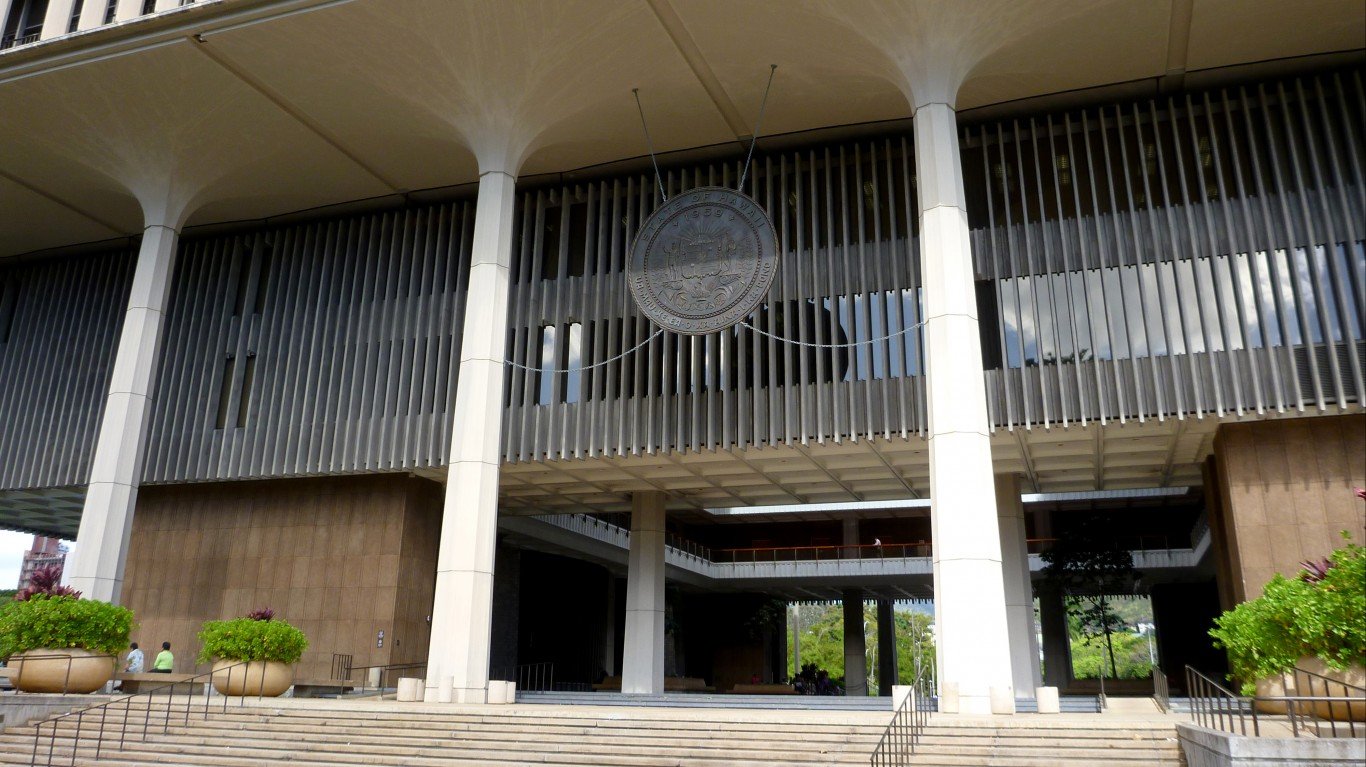
49. Hawaii
> 2018 midterm election turnout: 44.0%
> 2016 presidential election turnout: 47.3% (the lowest)
> 2016 general election result: Clinton, by 32.2 percentage points
> Population 65 and older: 17.8% (7th highest)
> Poverty rate: 9.5% (4th lowest)
[recirclink id=563869]
48. West Virginia
> 2018 midterm election turnout: 44.1%
> 2016 presidential election turnout: 50.8% (2nd lowest)
> 2016 general election result: Trump, by 42.2 percentage points
> Population 65 and older: 19.3% (3rd highest)
> Poverty rate: 19.1% (4th highest)
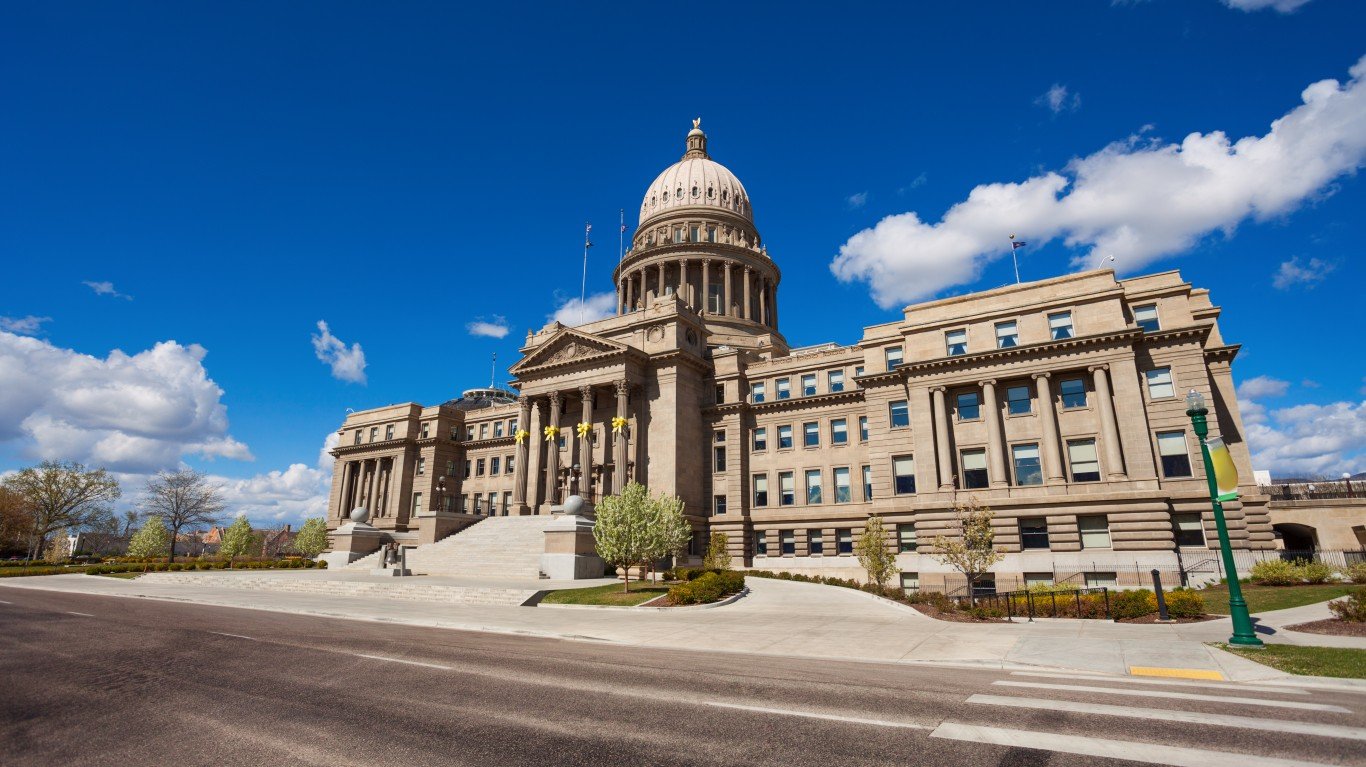
47. Idaho
> 2018 midterm election turnout: 47.9%
> 2016 presidential election turnout: 62.1% (24th lowest)
> 2016 general election result: Trump, by 31.6 percentage points
> Population 65 and older: 15.3% (15th lowest)
> Poverty rate: 12.8% (25th lowest)
[in-text-ad-2]
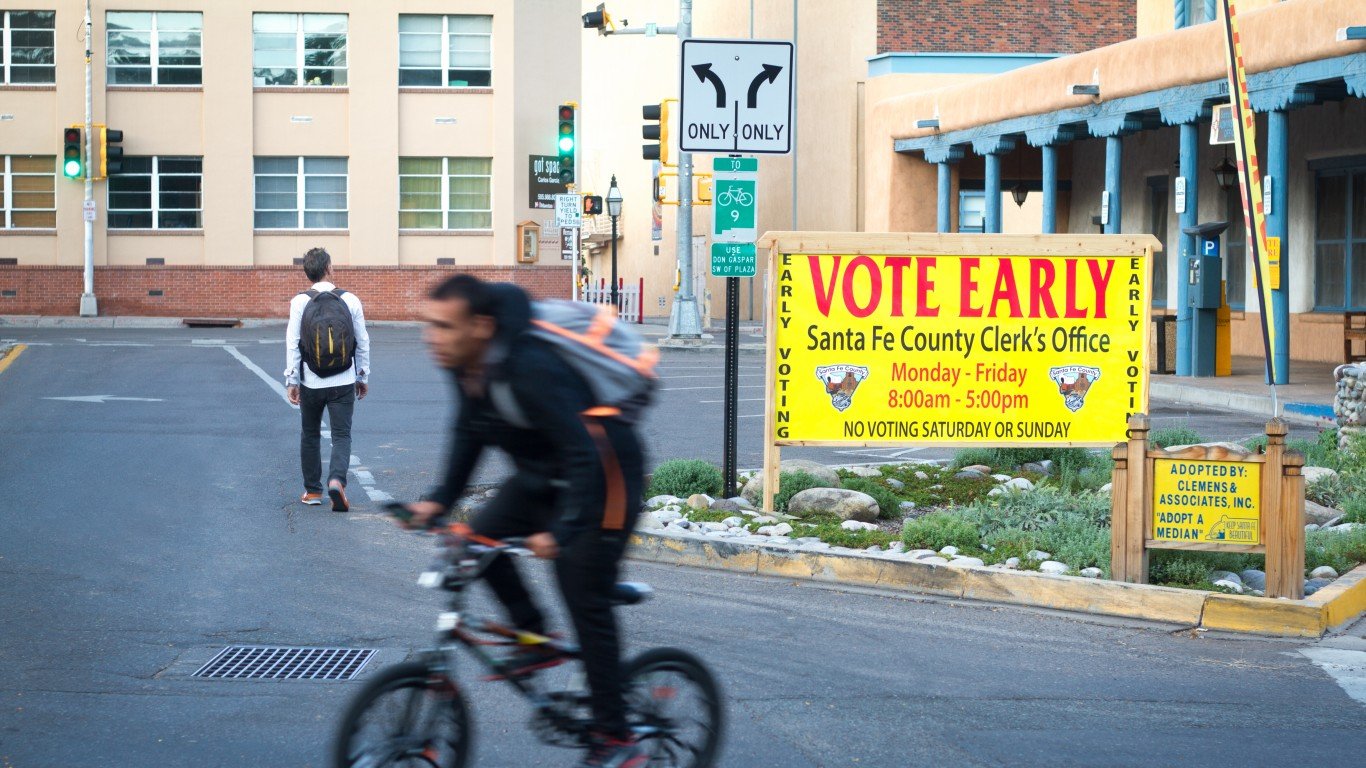
46. New Mexico
> 2018 midterm election turnout: 48.1%
> 2016 presidential election turnout: 54.8% (4th lowest)
> 2016 general election result: Clinton, by 8.3 percentage points
> Population 65 and older: 16.8% (13th highest)
> Poverty rate: 19.7% (2nd highest)

45. Texas
> 2018 midterm election turnout: 48.4%
> 2016 presidential election turnout: 55.4% (5th lowest)
> 2016 general election result: Trump, by 9.2 percentage points
> Population 65 and older: 12.2% (3rd lowest)
> Poverty rate: 14.7% (13th highest)
[in-text-ad]
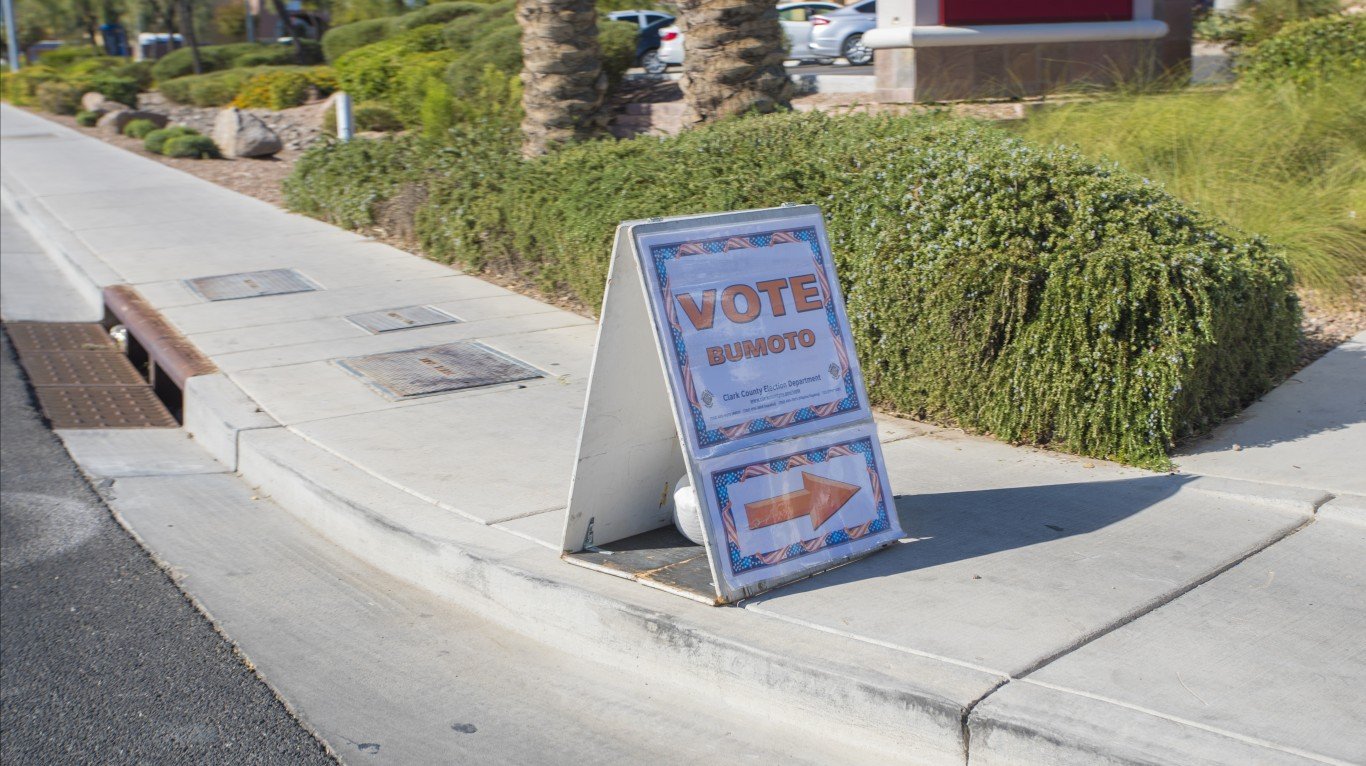
44. Nevada
> 2018 midterm election turnout: 48.7%
> 2016 presidential election turnout: 60.5% (17th lowest)
> 2016 general election result: Clinton, by 2.4 percentage points
> Population 65 and older: 15.3% (15th lowest)
> Poverty rate: 13.0% (24th highest)
[recirclink id=558313]
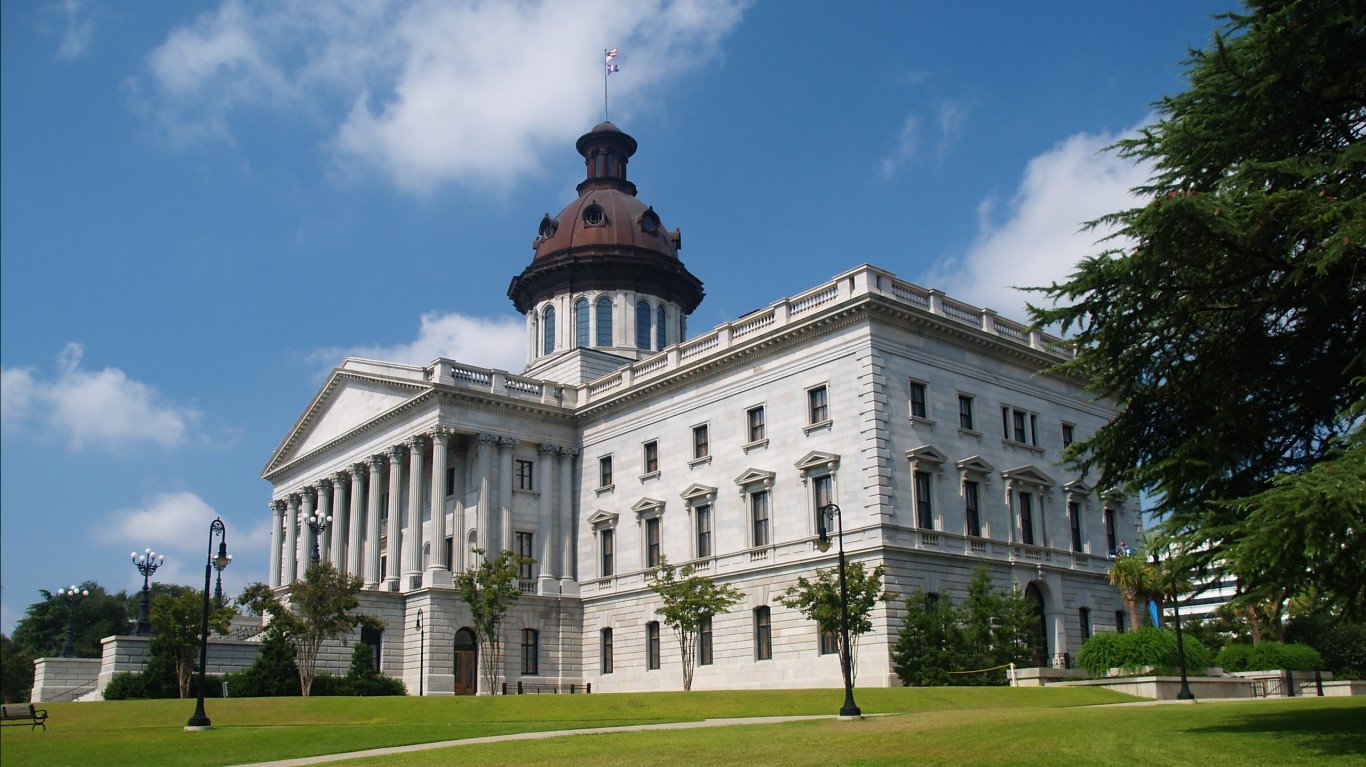
43. South Carolina
> 2018 midterm election turnout: 48.7%
> 2016 presidential election turnout: 62.1% (23rd lowest)
> 2016 general election result: Trump, by 14.1 percentage points
> Population 65 and older: 17.2% (10th highest)
> Poverty rate: 15.4% (9th highest)

42. Indiana
> 2018 midterm election turnout: 49.3%
> 2016 presidential election turnout: 58.3% (11th lowest)
> 2016 general election result: Trump, by 19.3 percentage points
> Population 65 and older: 15.4% (19th lowest)
> Poverty rate: 13.5% (20th highest)
[in-text-ad-2]

41. Oklahoma
> 2018 midterm election turnout: 49.4%
> 2016 presidential election turnout: 56.6% (6th lowest)
> 2016 general election result: Trump, by 36.4 percentage points
> Population 65 and older: 15.3% (15th lowest)
> Poverty rate: 15.8% (8th highest)

40. New York
> 2018 midterm election turnout: 49.5%
> 2016 presidential election turnout: 57.2% (8th lowest)
> 2016 general election result: Clinton, by 21.3 percentage points
> Population 65 and older: 15.9% (25th highest)
> Poverty rate: 14.1% (16th highest)
[in-text-ad]

39. Tennessee
> 2018 midterm election turnout: 49.6%
> 2016 presidential election turnout: 54.0% (3rd lowest)
> 2016 general election result: Trump, by 26.2 percentage points
> Population 65 and older: 15.9% (25th highest)
> Poverty rate: 15.0% (10th highest)
[recirclink id=497059]

38. Louisiana
> 2018 midterm election turnout: 49.8%
> 2016 presidential election turnout: 61.6% (22nd lowest)
> 2016 general election result: Trump, by 19.7 percentage points
> Population 65 and older: 14.9% (9th lowest)
> Poverty rate: 19.7% (2nd highest)
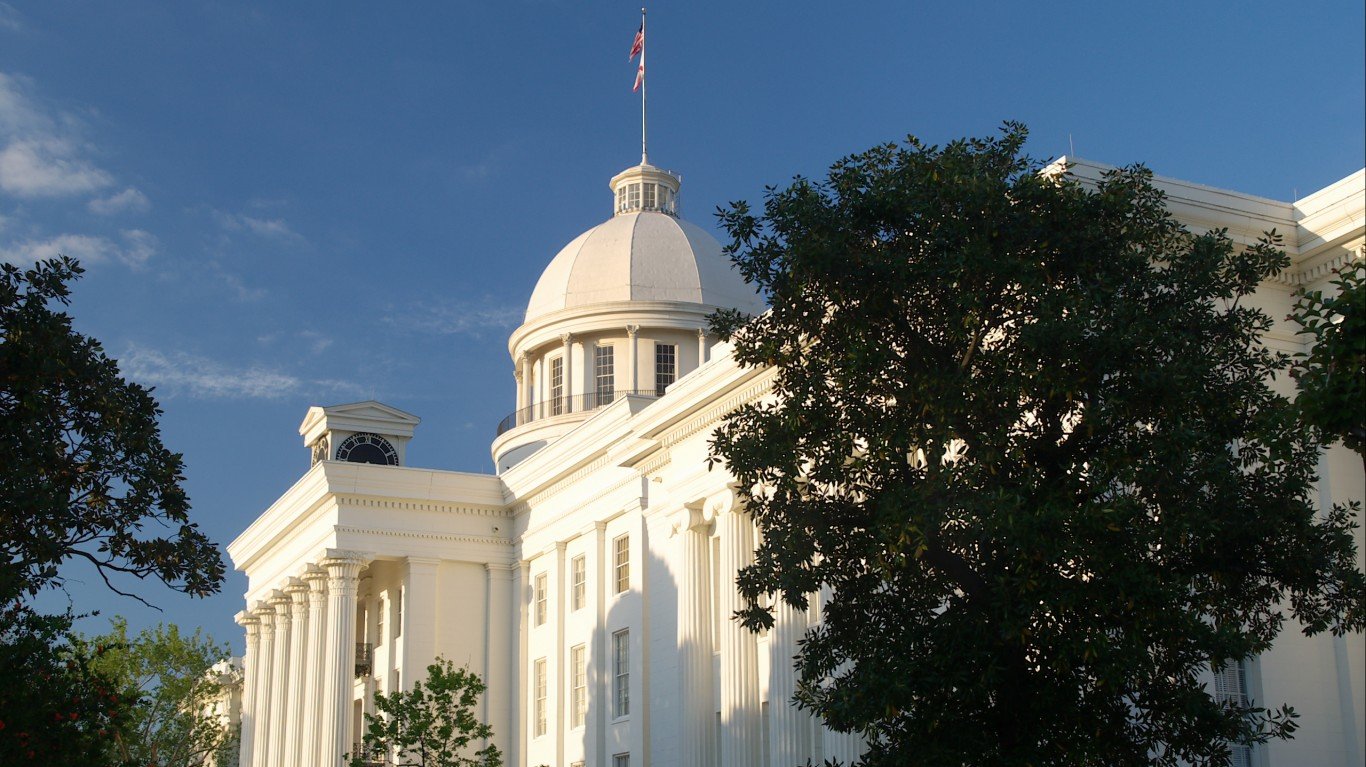
37. Alabama
> 2018 midterm election turnout: 50.7%
> 2016 presidential election turnout: 57.4% (9th lowest)
> 2016 general election result: Trump, by 28.3 percentage points
> Population 65 and older: 16.5% (19th highest)
> Poverty rate: 16.9% (6th highest)
[in-text-ad-2]

36. Nebraska
> 2018 midterm election turnout: 50.8%
> 2016 presidential election turnout: 66.8% (9th highest)
> 2016 general election result: Trump, by 26.3 percentage points
> Population 65 and older: 15.4% (19th lowest)
> Poverty rate: 10.8% (13th lowest)
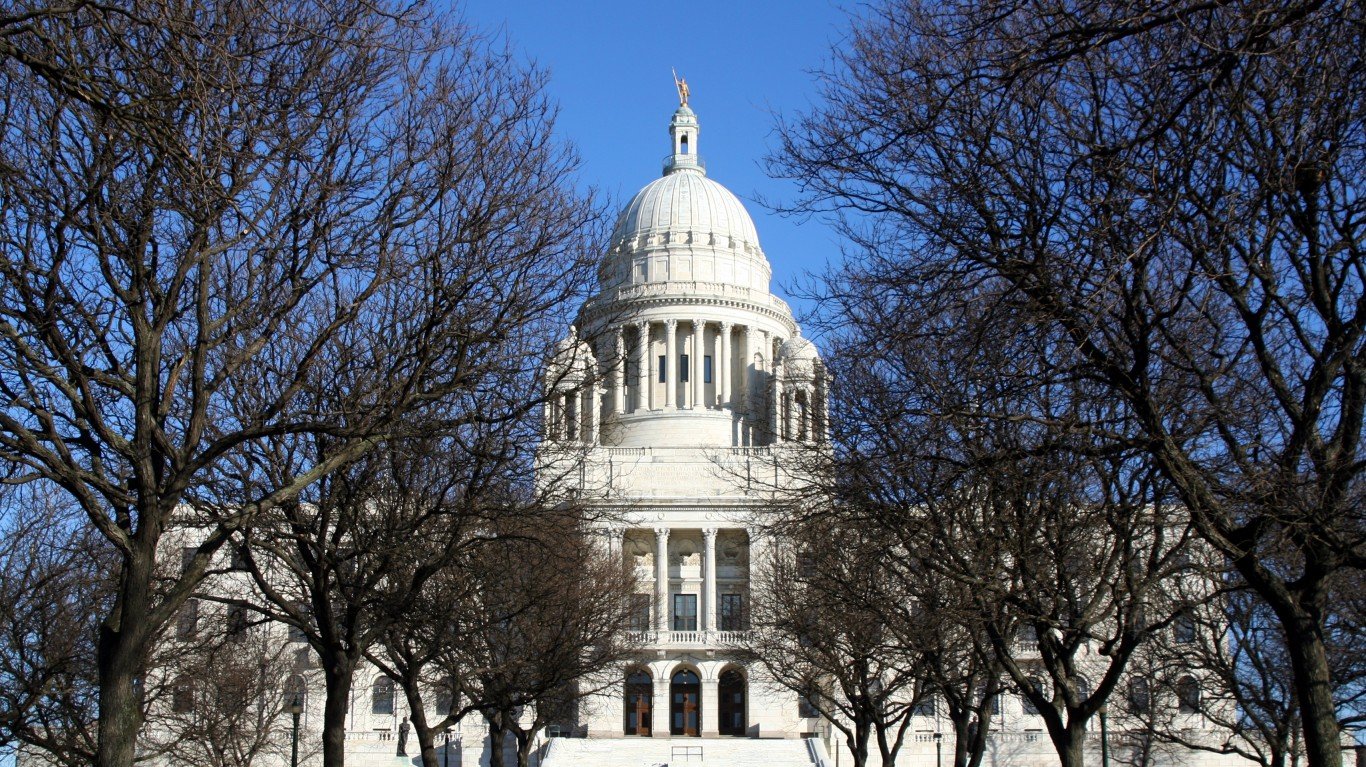
35. Rhode Island
> 2018 midterm election turnout: 51.6%
> 2016 presidential election turnout: 60.6% (18th lowest)
> 2016 general election result: Clinton, by 15.6 percentage points
> Population 65 and older: 16.7% (15th highest)
> Poverty rate: 11.6% (20th lowest)
[in-text-ad]

34. Delaware
> 2018 midterm election turnout: 51.8%
> 2016 presidential election turnout: 62.3% (25th lowest)
> 2016 general election result: Clinton, by 11.5 percentage points
> Population 65 and older: 18.0% (6th highest)
> Poverty rate: 13.6% (19th highest)
[recirclink id=554829]

33. California
> 2018 midterm election turnout: 51.9%
> 2016 presidential election turnout: 57.9% (10th lowest)
> 2016 general election result: Clinton, by 28.8 percentage points
> Population 65 and older: 13.9% (6th lowest)
> Poverty rate: 13.3% (22nd highest)
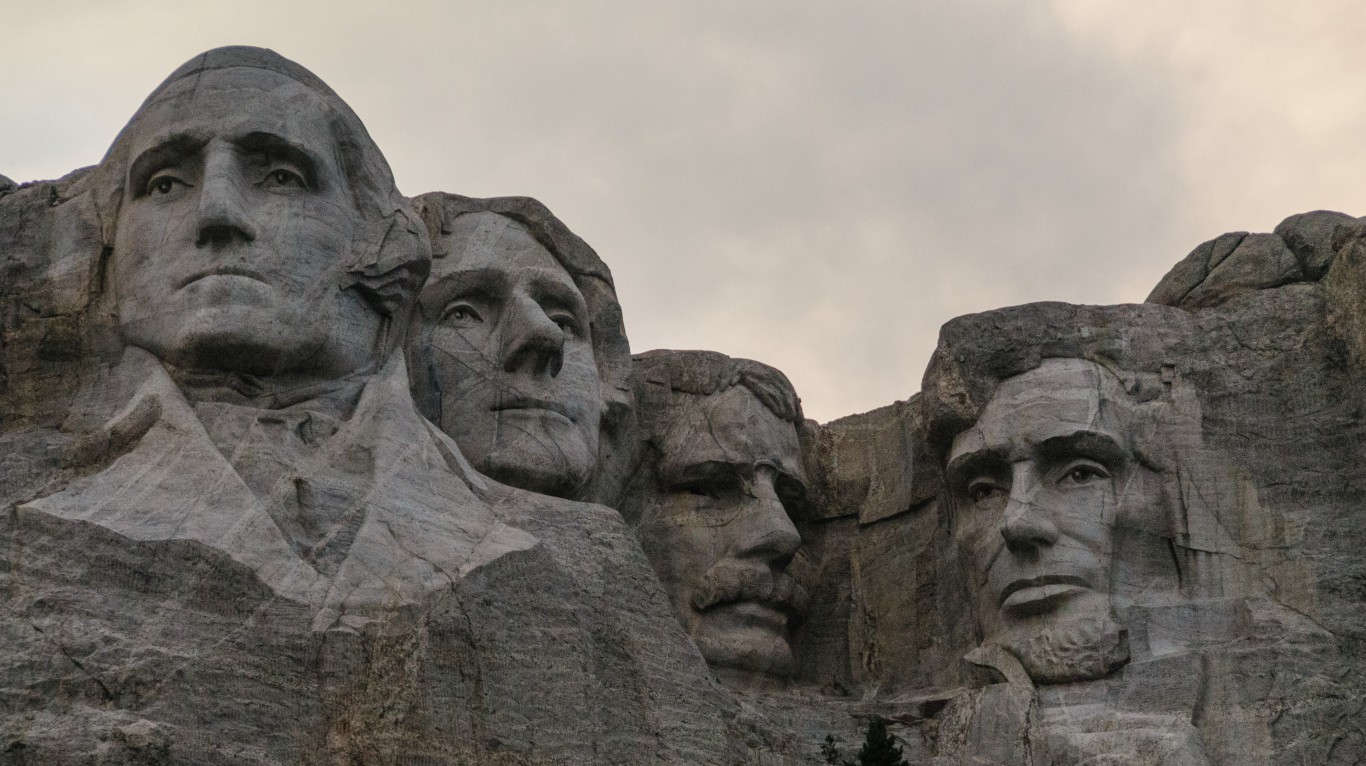
32. South Dakota
> 2018 midterm election turnout: 51.9%
> 2016 presidential election turnout: 59.1% (13th lowest)
> 2016 general election result: Trump, by 29.8 percentage points
> Population 65 and older: 16.3% (23rd highest)
> Poverty rate: 13.0% (24th highest)
[in-text-ad-2]
31. Wyoming
> 2018 midterm election turnout: 52.1%
> 2016 presidential election turnout: 64.8% (15th highest)
> 2016 general election result: Trump, by 47.6 percentage points
> Population 65 and older: 15.6% (21st lowest)
> Poverty rate: 11.3% (19th lowest)

30. North Carolina
> 2018 midterm election turnout: 52.4%
> 2016 presidential election turnout: 67.5% (8th highest)
> 2016 general election result: Trump, by 3.8 percentage points
> Population 65 and older: 15.9% (25th highest)
> Poverty rate: 14.7% (13th highest)
[in-text-ad]
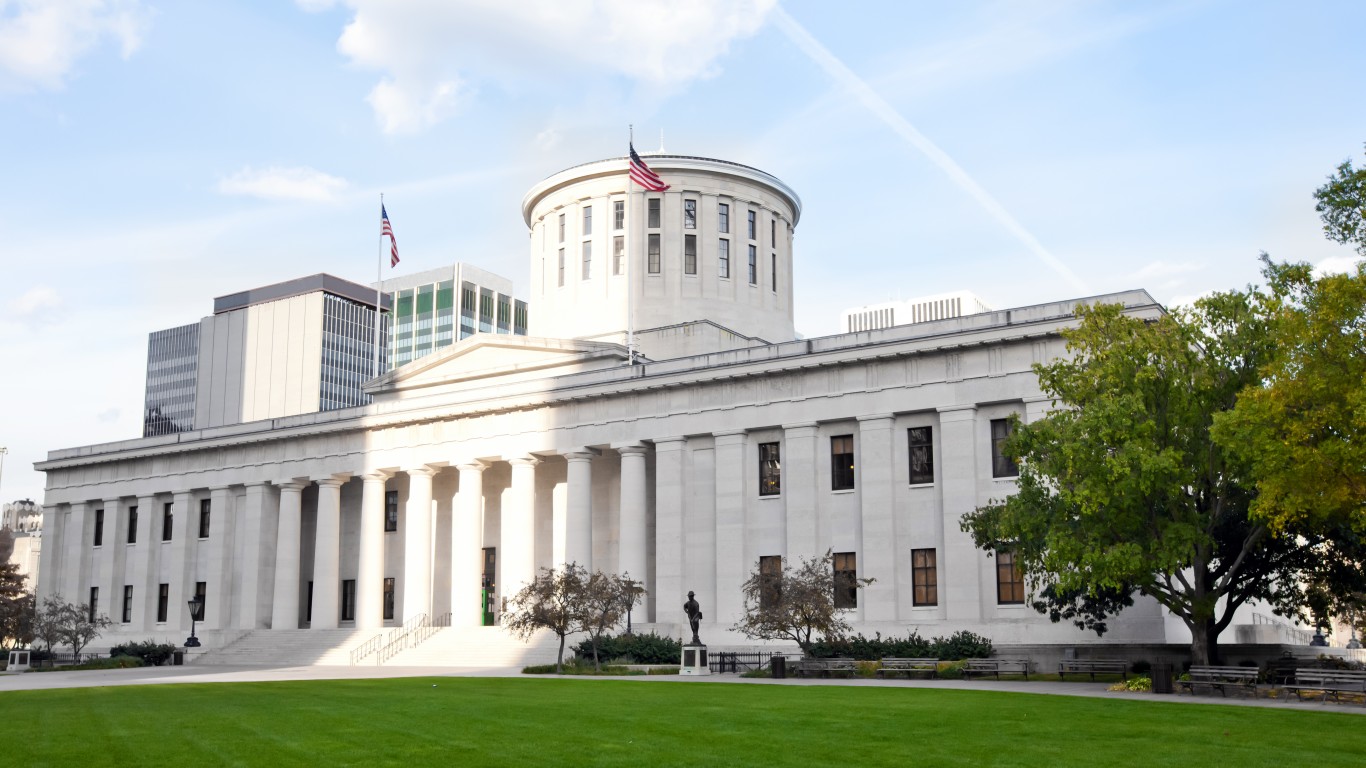
29. Ohio
> 2018 midterm election turnout: 52.5%
> 2016 presidential election turnout: 63.6% (21st highest)
> 2016 general election result: Trump, by 8.6 percentage points
> Population 65 and older: 16.6% (18th highest)
> Poverty rate: 14.0% (17th highest)
[recirclink id=563869]

28. Florida
> 2018 midterm election turnout: 52.6%
> 2016 presidential election turnout: 59.5% (14th lowest)
> 2016 general election result: Trump, by 1.3 percentage points
> Population 65 and older: 20.1% (the highest)
> Poverty rate: 14.0% (17th highest)

27. Alaska
> 2018 midterm election turnout: 52.8%
> 2016 presidential election turnout: 61.3% (20th lowest)
> 2016 general election result: Trump, by 15.2 percentage points
> Population 65 and older: 11.2% (2nd lowest)
> Poverty rate: 11.1% (16th lowest)
[in-text-ad-2]
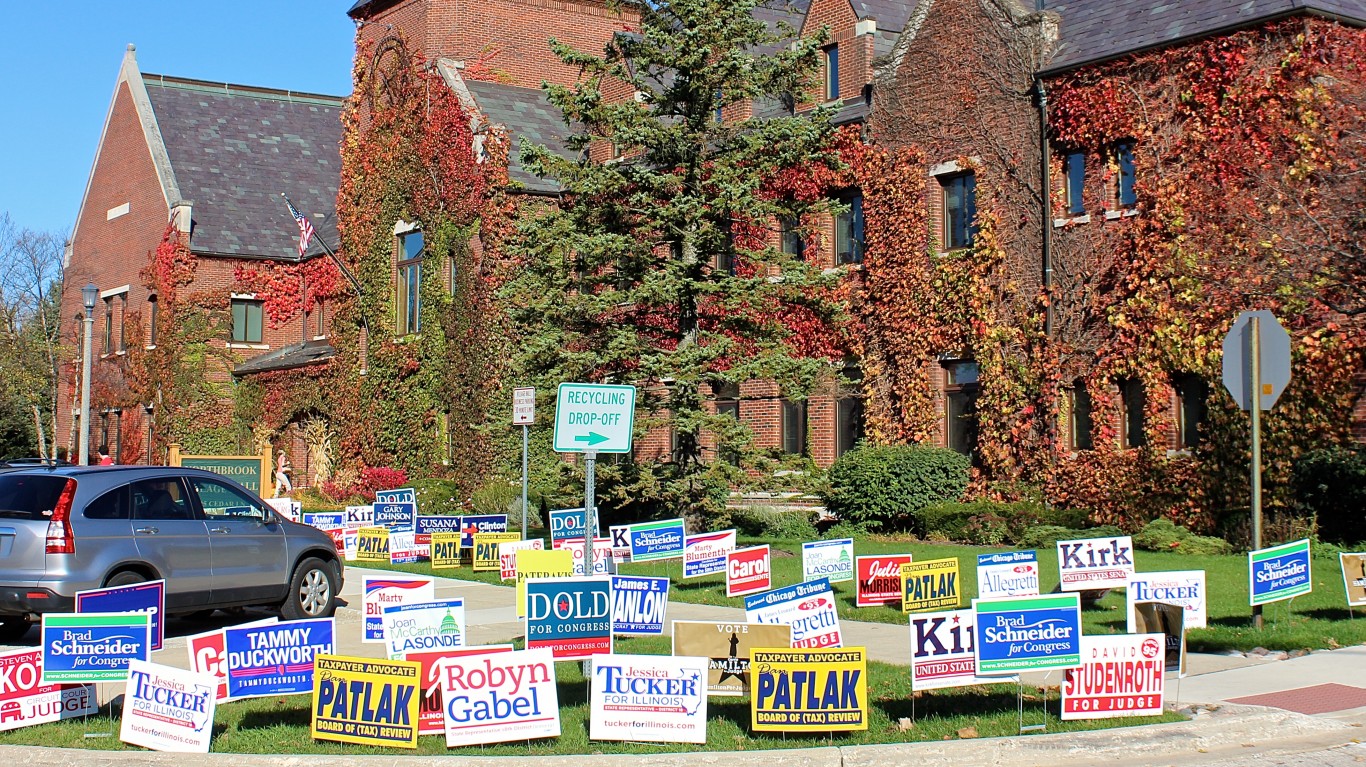
26. Illinois
> 2018 midterm election turnout: 53.0%
> 2016 presidential election turnout: 63.8% (20th highest)
> 2016 general election result: Clinton, by 16 percentage points
> Population 65 and older: 15.2% (12th lowest)
> Poverty rate: 12.6% (24th lowest)

25. Kentucky
> 2018 midterm election turnout: 53.8%
> 2016 presidential election turnout: 57.0% (7th lowest)
> 2016 general election result: Trump, by 29.8 percentage points
> Population 65 and older: 15.9% (25th highest)
> Poverty rate: 17.2% (5th highest)
[in-text-ad]
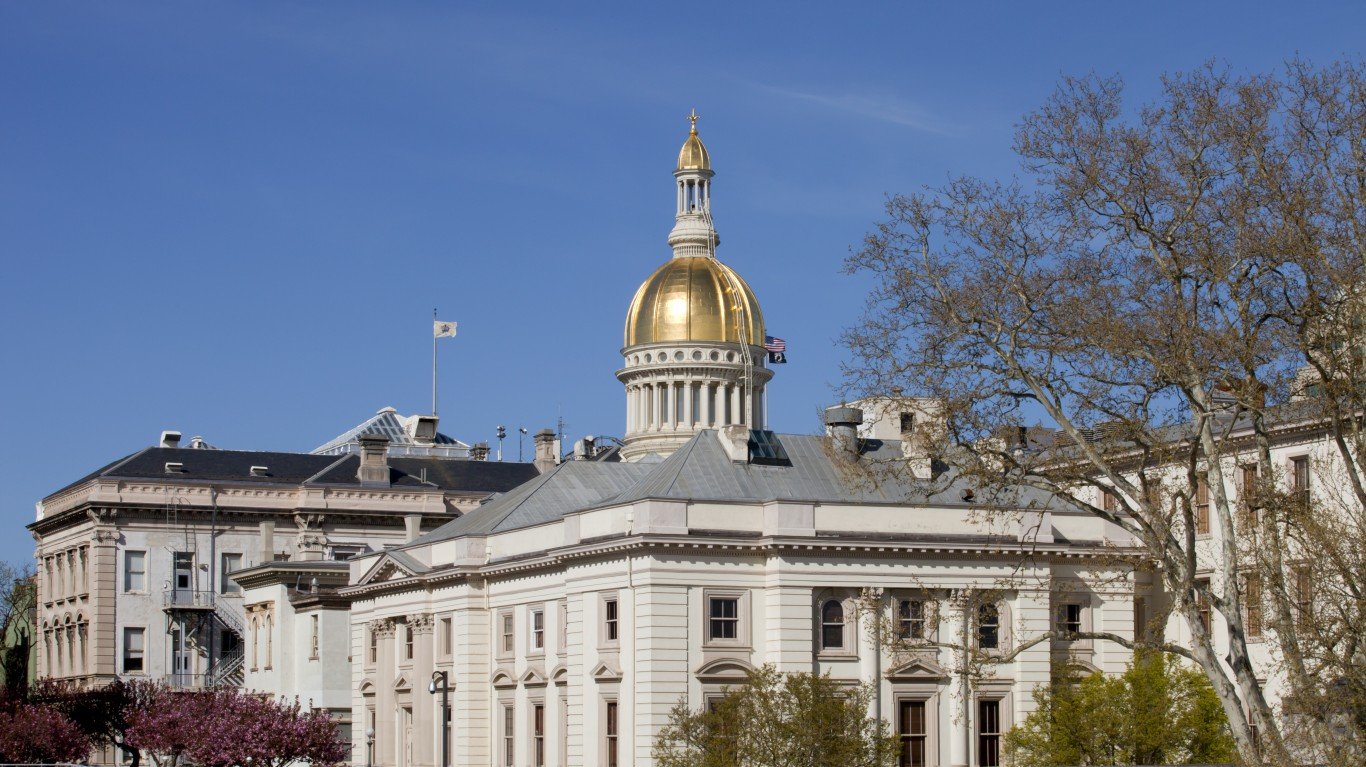
24. New Jersey
> 2018 midterm election turnout: 54.0%
> 2016 presidential election turnout: 61.5% (21st lowest)
> 2016 general election result: Clinton, by 13.2 percentage points
> Population 65 and older: 15.7% (22nd lowest)
> Poverty rate: 10.0% (7th lowest)
[recirclink id=558313]
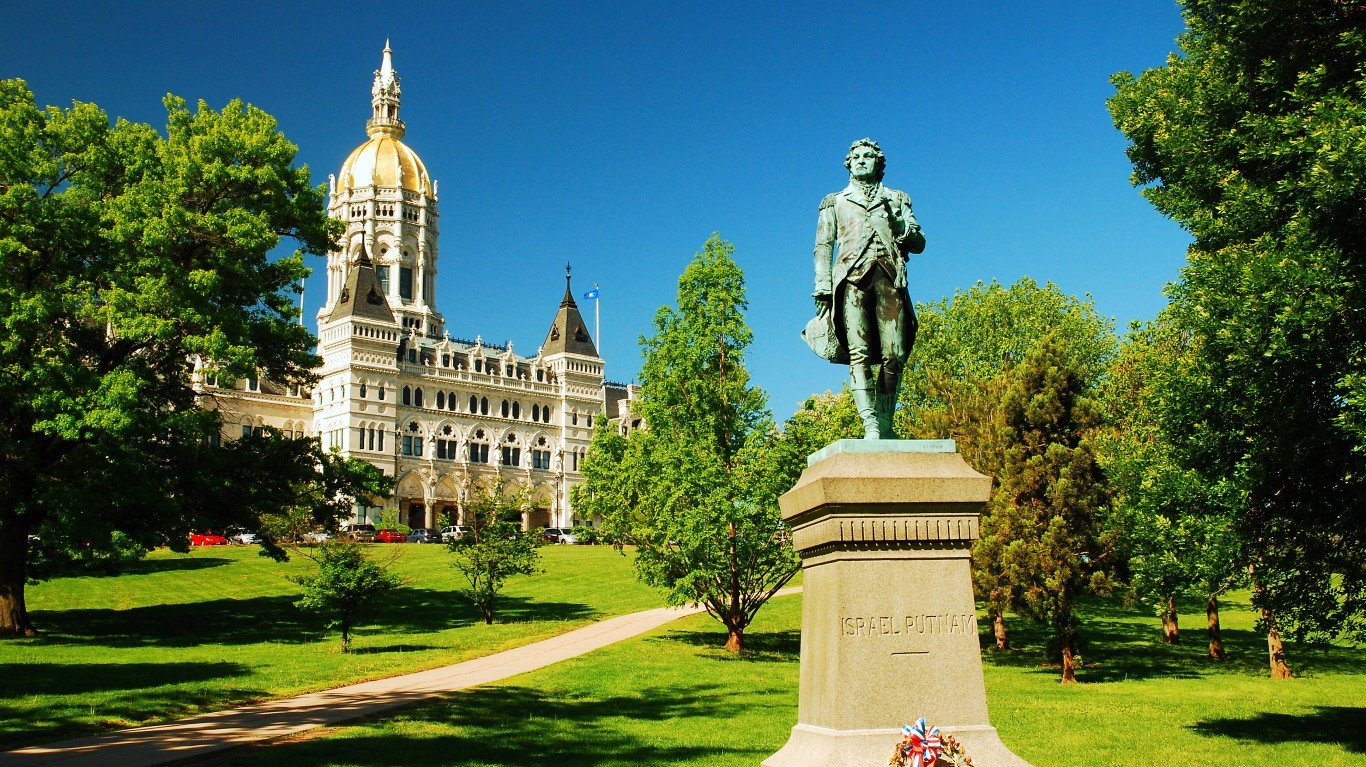
23. Connecticut
> 2018 midterm election turnout: 54.0%
> 2016 presidential election turnout: 63.9% (19th highest)
> 2016 general election result: Clinton, by 13.3 percentage points
> Population 65 and older: 16.8% (13th highest)
> Poverty rate: 9.6% (5th lowest)

22. Maryland
> 2018 midterm election turnout: 54.2%
> 2016 presidential election turnout: 65.8% (14th highest)
> 2016 general election result: Clinton, by 25.2 percentage points
> Population 65 and older: 14.9% (9th lowest)
> Poverty rate: 9.3% (2nd lowest)
[in-text-ad-2]
21. Mississippi
> 2018 midterm election turnout: 54.2%
> 2016 presidential election turnout: 67.7% (7th highest)
> 2016 general election result: Trump, by 18.6 percentage points
> Population 65 and older: 15.6% (21st lowest)
> Poverty rate: 19.8% (the highest)
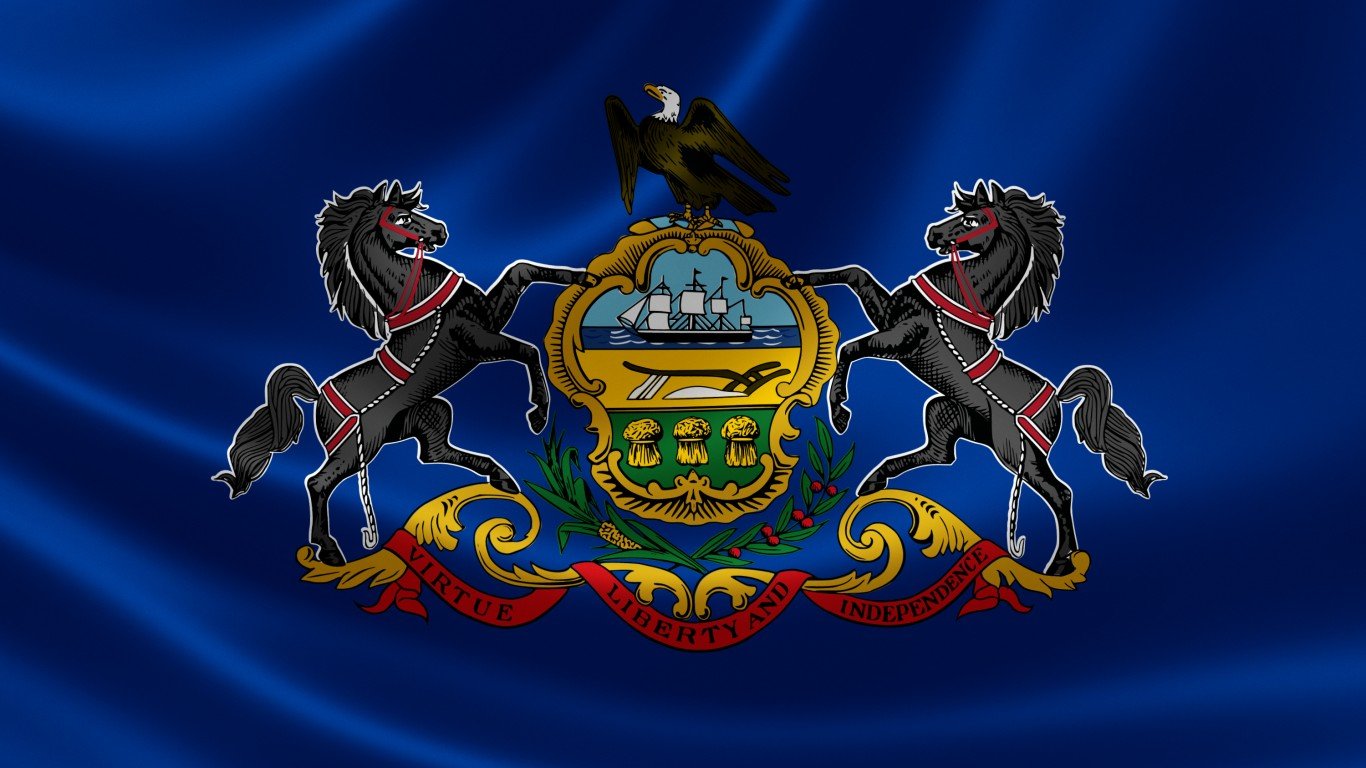
20. Pennsylvania
> 2018 midterm election turnout: 54.6%
> 2016 presidential election turnout: 62.6% (24th highest)
> 2016 general election result: Trump, by 1.2 percentage points
> Population 65 and older: 17.8% (7th highest)
> Poverty rate: 12.5% (23rd lowest)
[in-text-ad]
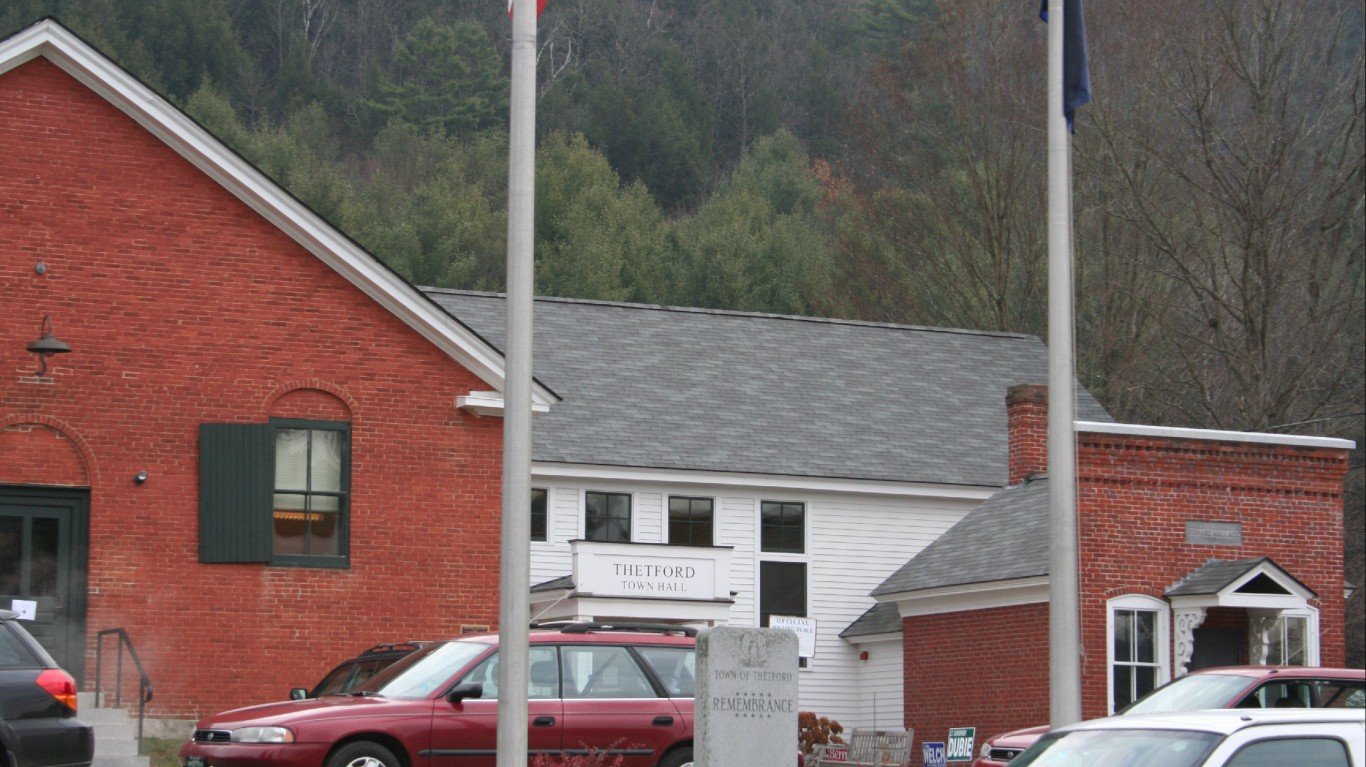
19. Vermont
> 2018 midterm election turnout: 54.9%
> 2016 presidential election turnout: 62.5% (25th highest)
> 2016 general election result: Clinton, by 28.5 percentage points
> Population 65 and older: 18.8% (4th highest)
> Poverty rate: 11.3% (19th lowest)
[recirclink id=497059]

18. Missouri
> 2018 midterm election turnout: 55.0%
> 2016 presidential election turnout: 64.8% (16th highest)
> 2016 general election result: Trump, by 19.1 percentage points
> Population 65 and older: 16.5% (19th highest)
> Poverty rate: 13.4% (21st highest)
17. Massachusetts
> 2018 midterm election turnout: 55.5%
> 2016 presidential election turnout: 66.7% (10th highest)
> 2016 general election result: Clinton, by 27.3 percentage points
> Population 65 and older: 16.1% (24th highest)
> Poverty rate: 10.5% (10th lowest)
[in-text-ad-2]

16. Georgia
> 2018 midterm election turnout: 55.9%
> 2016 presidential election turnout: 60.2% (15th lowest)
> 2016 general election result: Trump, by 5.7 percentage points
> Population 65 and older: 13.4% (4th lowest)
> Poverty rate: 14.9% (11th highest)

15. New Hampshire
> 2018 midterm election turnout: 56.2%
> 2016 presidential election turnout: 69.0% (4th highest)
> 2016 general election result: Clinton, by 0.4 percentage points
> Population 65 and older: 17.6% (9th highest)
> Poverty rate: 7.7% (the lowest)
[in-text-ad]
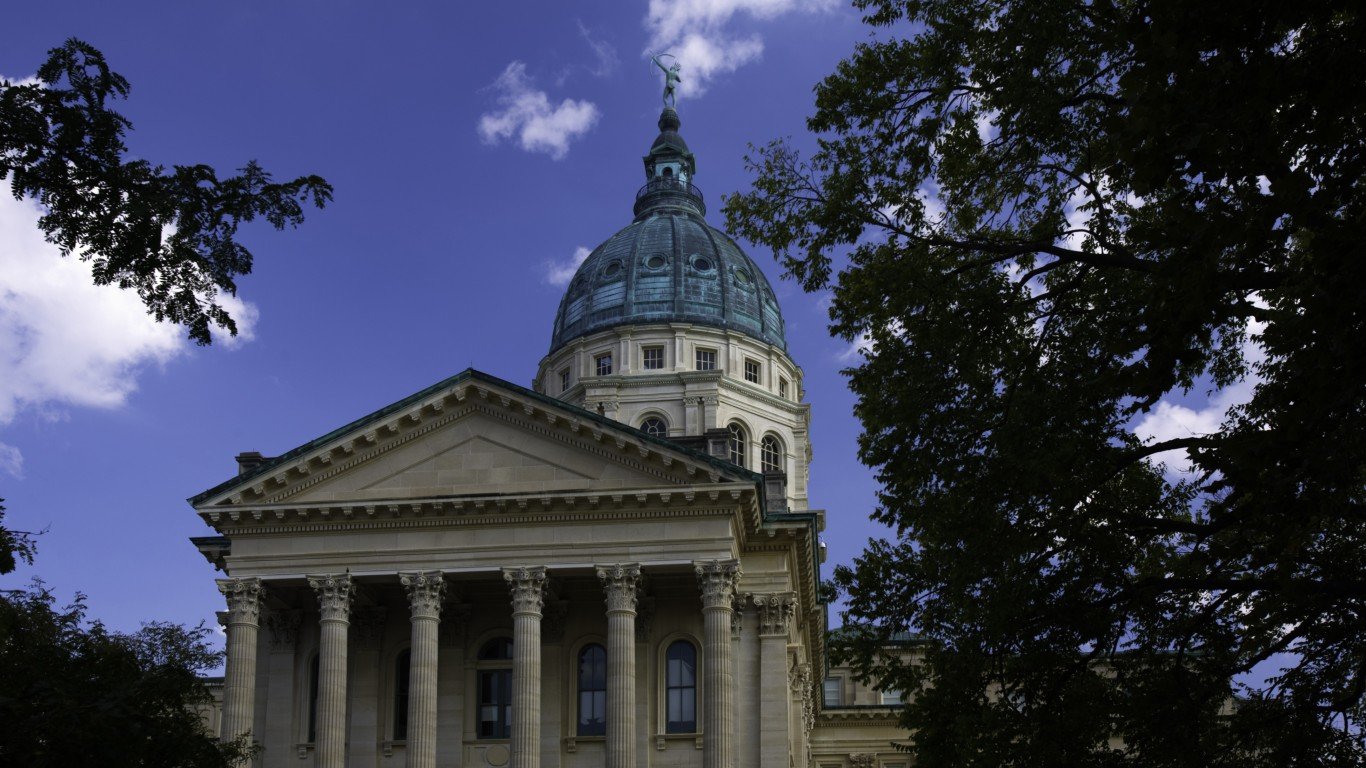
14. Kansas
> 2018 midterm election turnout: 56.9%
> 2016 presidential election turnout: 61.3% (19th lowest)
> 2016 general election result: Trump, by 21 percentage points
> Population 65 and older: 15.4% (19th lowest)
> Poverty rate: 11.9% (21st lowest)
[recirclink id=554829]

13. Virginia
> 2018 midterm election turnout: 57.5%
> 2016 presidential election turnout: 68.2% (6th highest)
> 2016 general election result: Clinton, by 4.9 percentage points
> Population 65 and older: 15.0% (10th lowest)
> Poverty rate: 10.6% (11th lowest)
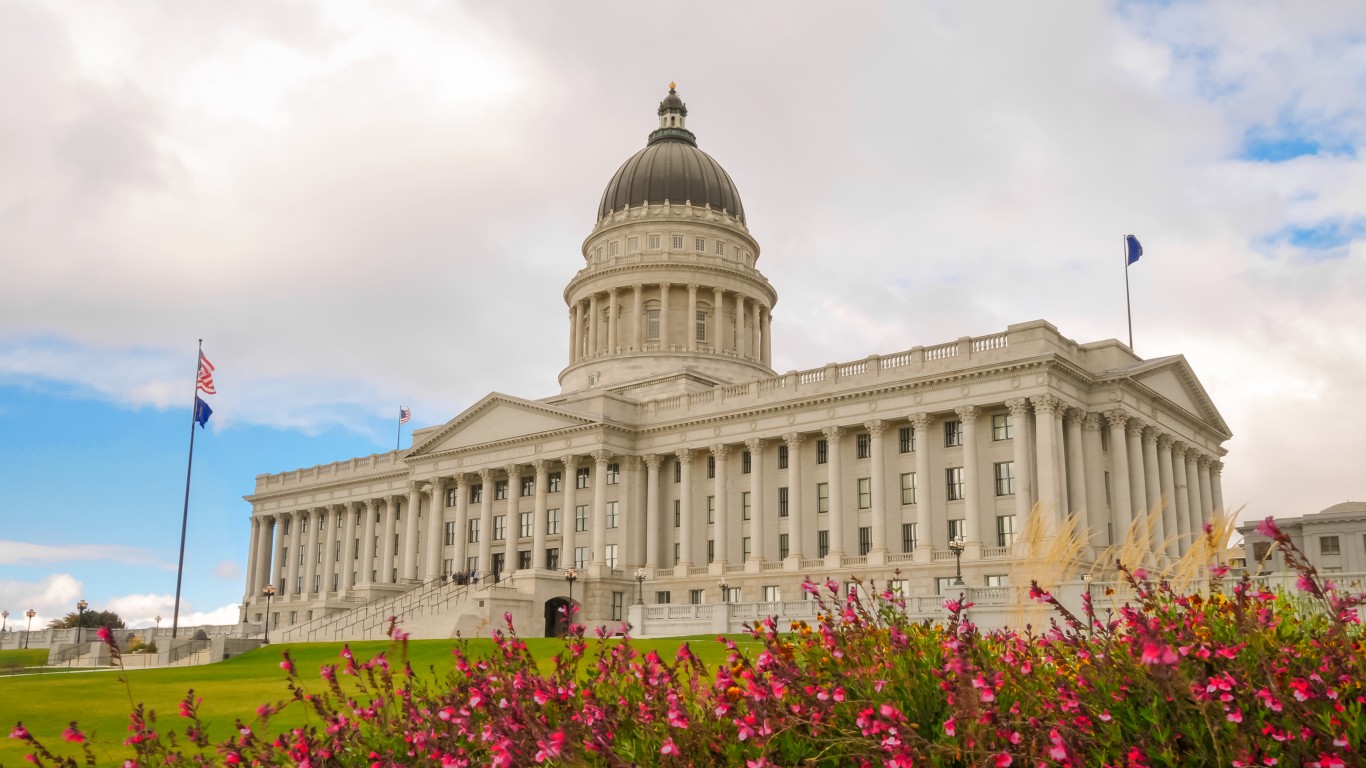
12. Utah
> 2018 midterm election turnout: 57.6%
> 2016 presidential election turnout: 62.7% (23rd highest)
> 2016 general election result: Trump, by 18.1 percentage points
> Population 65 and older: 10.8% (the lowest)
> Poverty rate: 9.7% (6th lowest)
[in-text-ad-2]
11. Colorado
> 2018 midterm election turnout: 58.1%
> 2016 presidential election turnout: 69.5% (3rd highest)
> 2016 general election result: Clinton, by 2.8 percentage points
> Population 65 and older: 13.8% (5th lowest)
> Poverty rate: 10.3% (9th lowest)

10. Arizona
> 2018 midterm election turnout: 58.9%
> 2016 presidential election turnout: 60.4% (16th lowest)
> 2016 general election result: Trump, by 4.1 percentage points
> Population 65 and older: 17.1% (11th highest)
> Poverty rate: 14.9% (11th highest)
[in-text-ad]
9. Michigan
> 2018 midterm election turnout: 59.5%
> 2016 presidential election turnout: 64.3% (17th highest)
> 2016 general election result: Trump, by 0.3 percentage points
> Population 65 and older: 16.7% (15th highest)
> Poverty rate: 14.2% (15th highest)
[recirclink id=563869]

8. Iowa
> 2018 midterm election turnout: 59.6%
> 2016 presidential election turnout: 63.4% (22nd highest)
> 2016 general election result: Trump, by 9.6 percentage points
> Population 65 and older: 16.7% (15th highest)
> Poverty rate: 10.7% (12th lowest)
7. Oregon
> 2018 midterm election turnout: 61.1%
> 2016 presidential election turnout: 66.3% (11th highest)
> 2016 general election result: Clinton, by 10.6 percentage points
> Population 65 and older: 17.1% (11th highest)
> Poverty rate: 13.2% (23rd highest)
[in-text-ad-2]

6. North Dakota
> 2018 midterm election turnout: 61.9%
> 2016 presidential election turnout: 64.2% (18th highest)
> 2016 general election result: Trump, by 36.3 percentage points
> Population 65 and older: 14.9% (9th lowest)
> Poverty rate: 10.3% (9th lowest)
5. Washington
> 2018 midterm election turnout: 61.9%
> 2016 presidential election turnout: 66.3% (12th highest)
> 2016 general election result: Clinton, by 16.2 percentage points
> Population 65 and older: 15.1% (11th lowest)
> Poverty rate: 11.0% (14th lowest)
[in-text-ad]

4. Minnesota
> 2018 midterm election turnout: 63.0%
> 2016 presidential election turnout: 68.7% (5th highest)
> 2016 general election result: Clinton, by 1.5 percentage points
> Population 65 and older: 15.4% (19th lowest)
> Poverty rate: 9.5% (4th lowest)
[recirclink id=558313]

3. Montana
> 2018 midterm election turnout: 63.8%
> 2016 presidential election turnout: 65.9% (13th highest)
> 2016 general election result: Trump, by 20.5 percentage points
> Population 65 and older: 18.1% (5th highest)
> Poverty rate: 12.5% (23rd lowest)

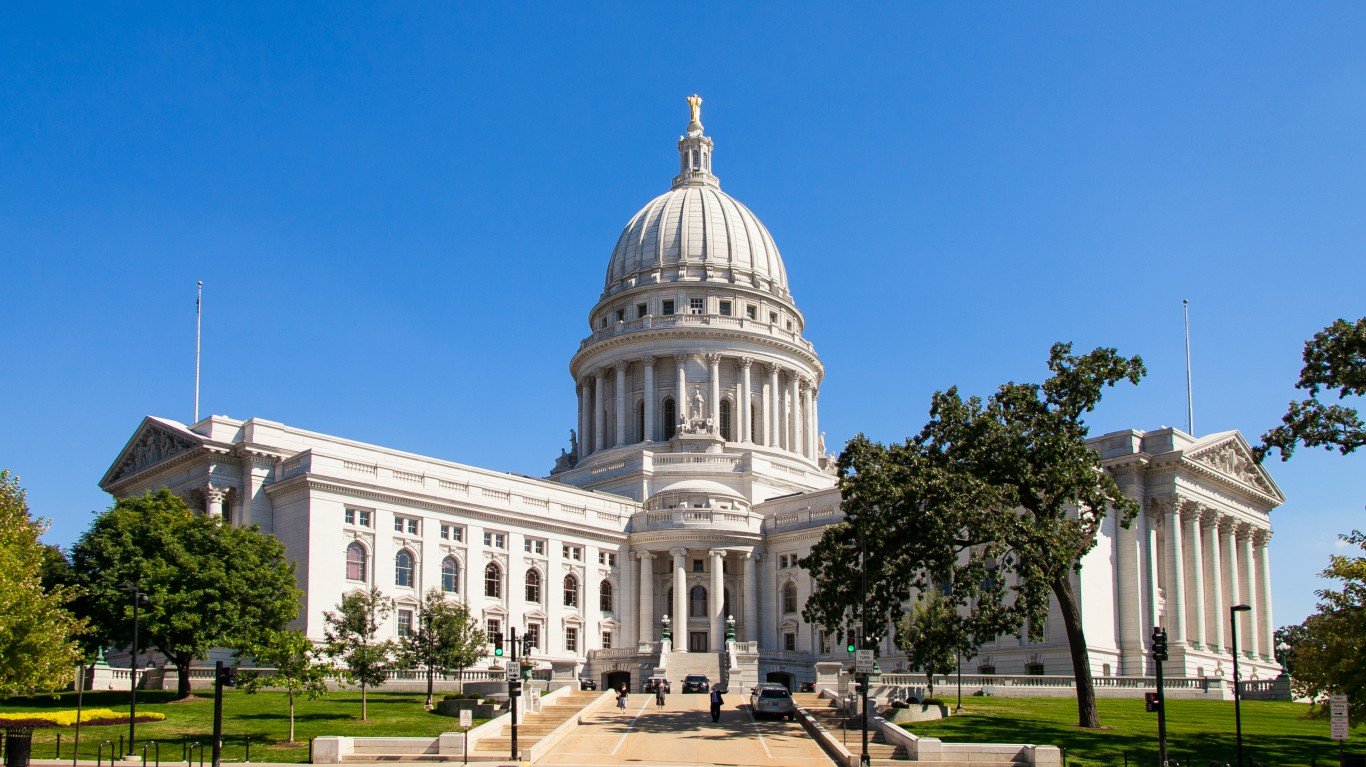
2. Wisconsin
> 2018 midterm election turnout: 64.6%
> 2016 presidential election turnout: 70.5% (2nd highest)
> 2016 general election result: Trump, by 1.0 percentage point
> Population 65 and older: 16.5% (19th highest)
> Poverty rate: 11.3% (19th lowest)
[in-text-ad-2]
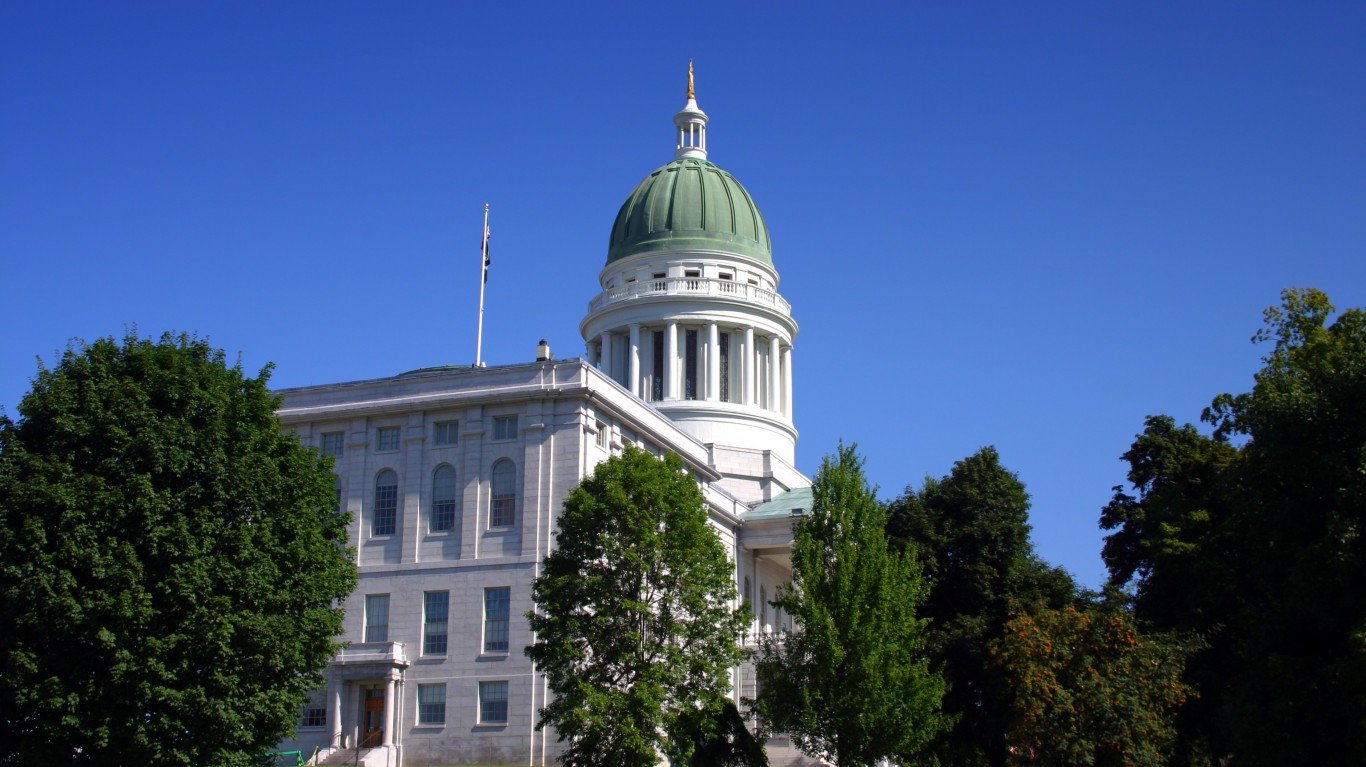
1. Maine
> 2018 midterm election turnout: 65.6%
> 2016 presidential election turnout: 72.7% (the highest)
> 2016 general election result: Clinton, by 2.7 percentage points
> Population 65 and older: 20.0% (2nd highest)
> Poverty rate: 11.1% (16th lowest)
Contact [email protected] for any questions or corrections.