
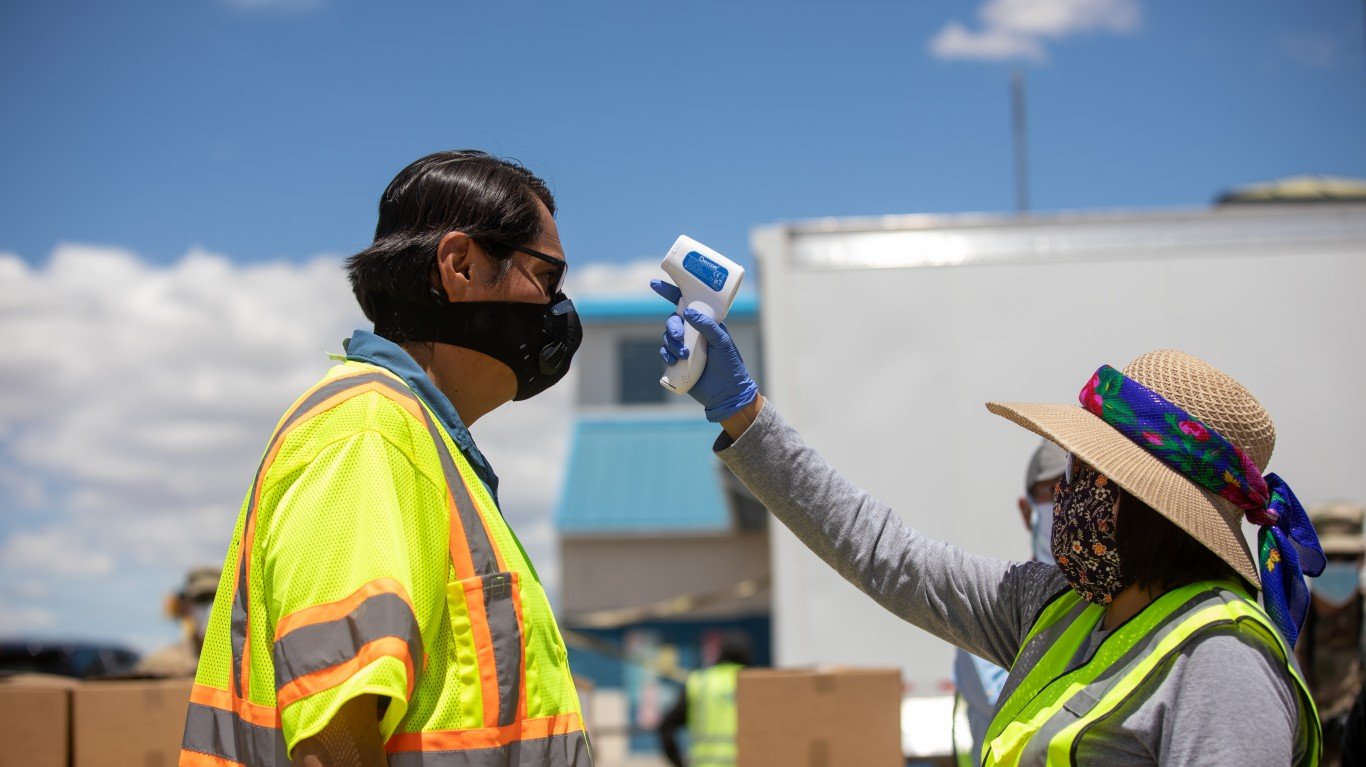
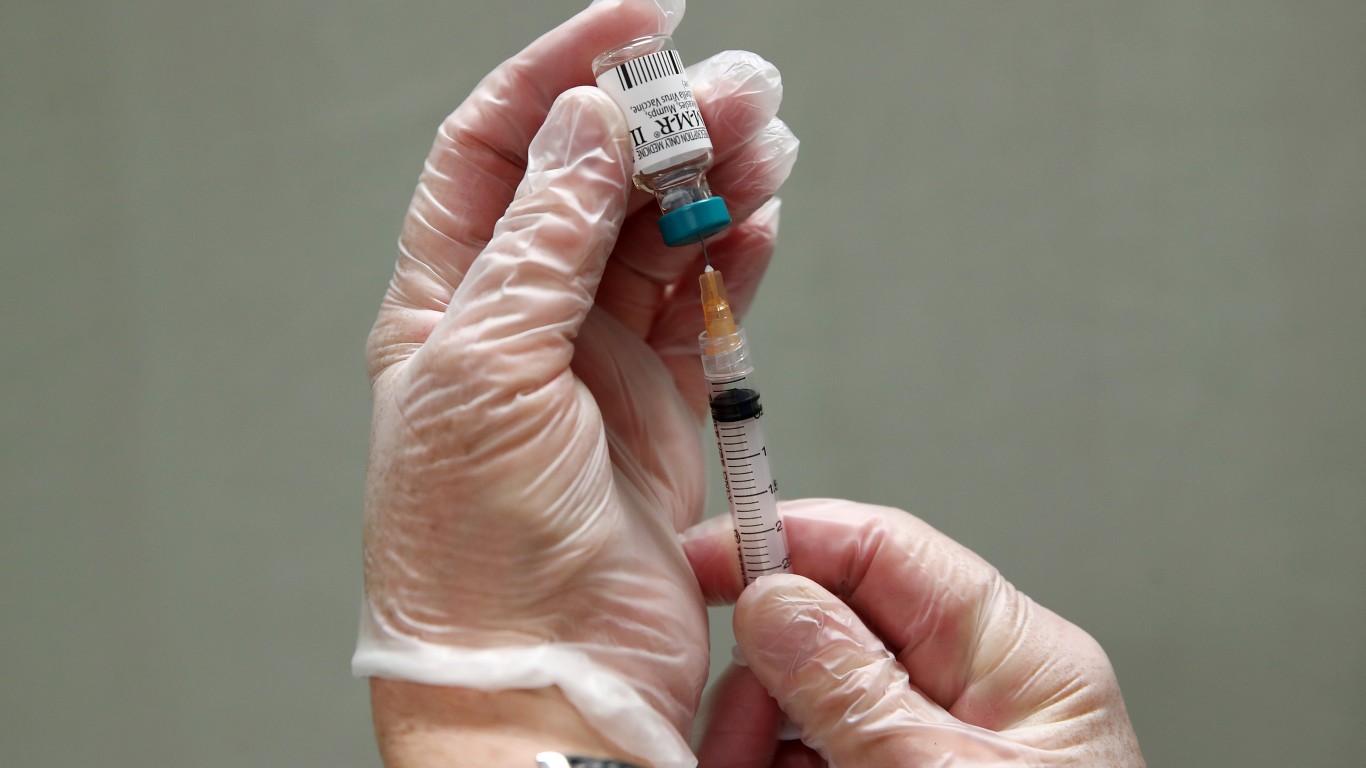
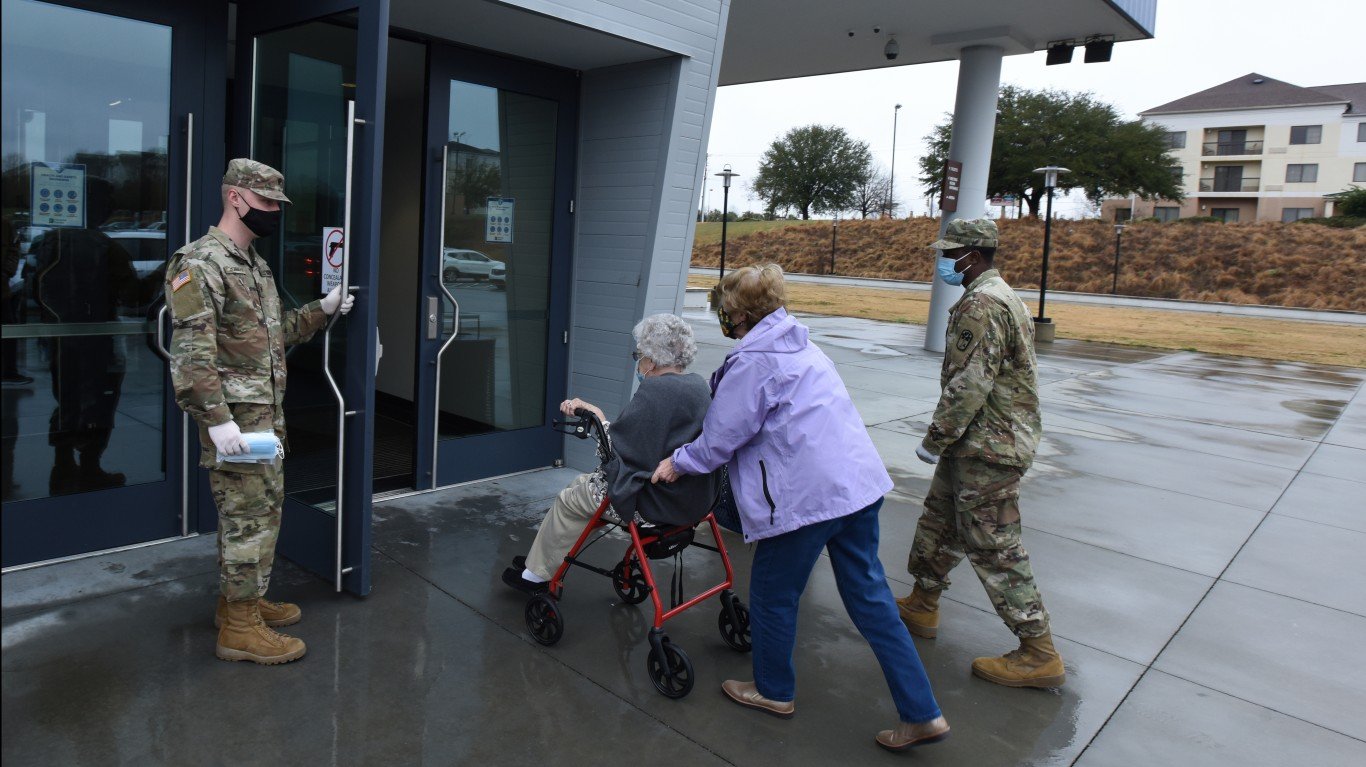
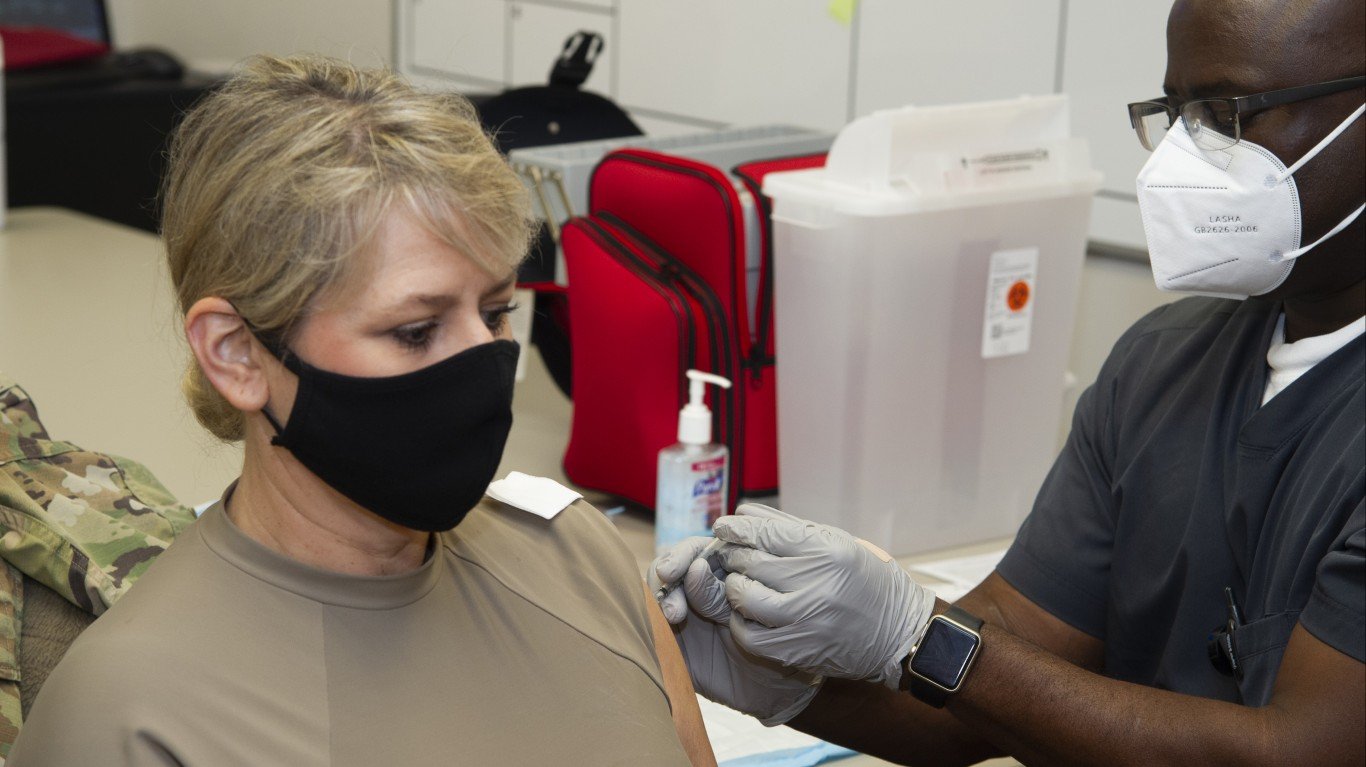
In his first prime time public address on March 11, President Joe Biden announced he would ask all states to make COVID-19 vaccines available to all Americans 18 or older no later than May 1. Biden reiterated his goal of making such progress that the nation could return to a kind of normalcy by the Fourth of July. The pace at which the coronavirus is spreading across the United States has slowed considerably, and that is at least in part thanks to the growing ranks of Americans who have been inoculated.
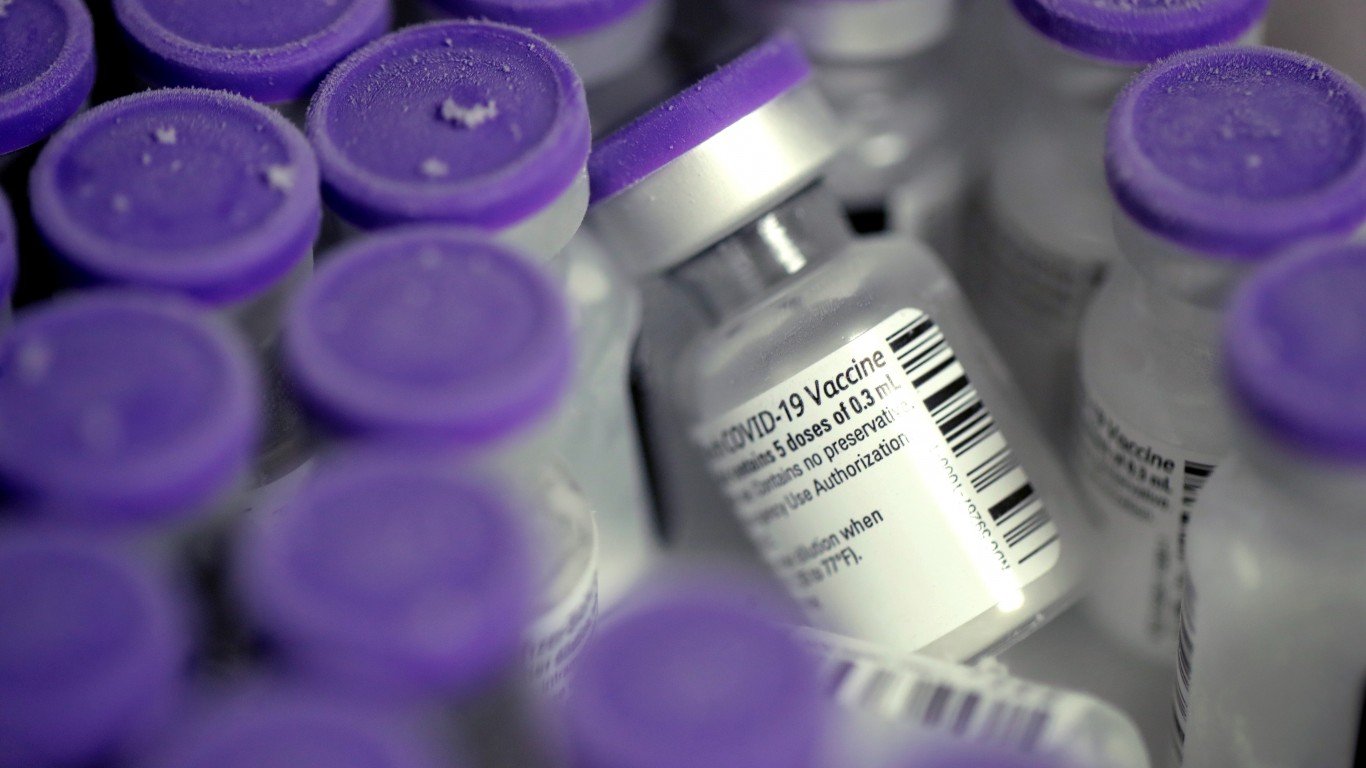
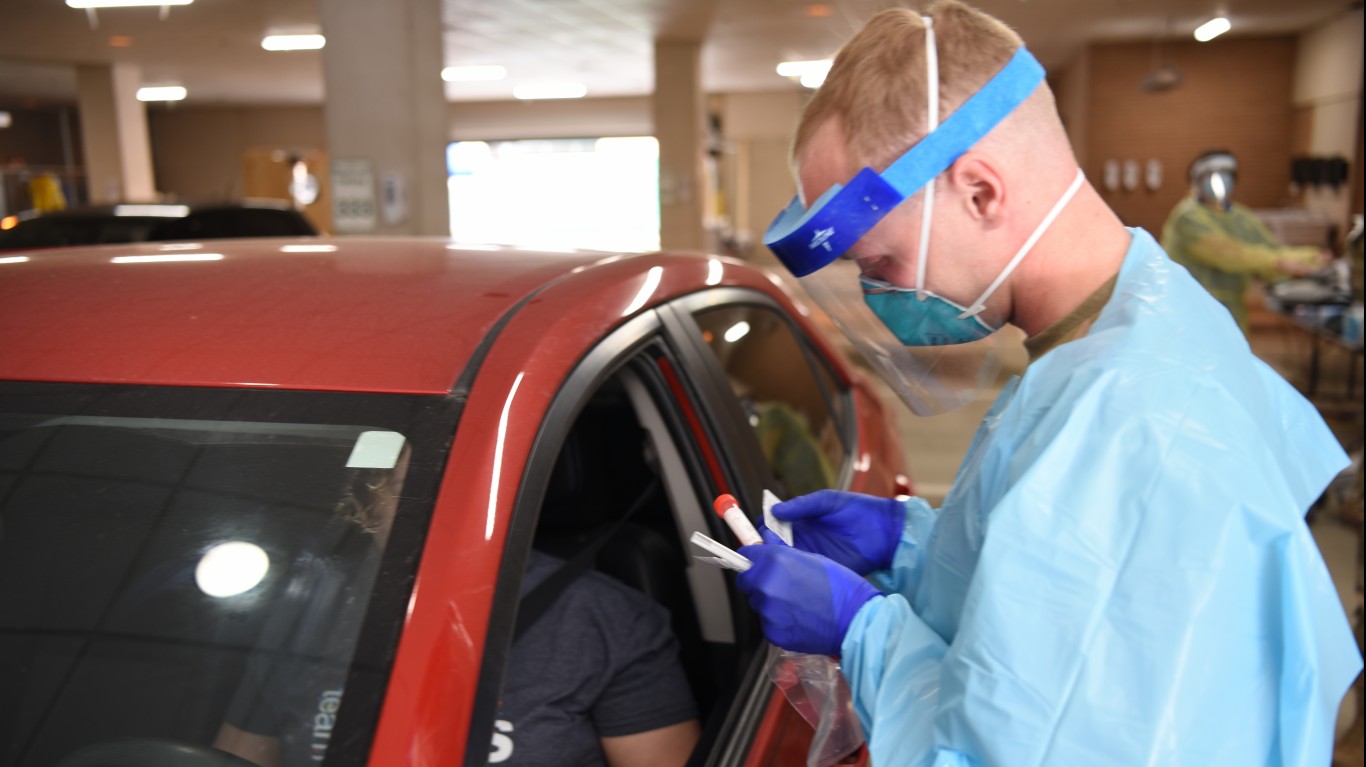
The country, however, still has a long way to go if it is to meet Biden’s July 4 deadline. Tens of thousands of Americans are newly diagnosed with the virus daily, and rollout of the vaccine has been highly inconsistent from one state to the next. As of March 17, just 11.6% of the population have received two doses of the vaccine. Further, the distribution of the Johnson & Johnson vaccine, which requires a single shot, did not begin in the U.S. until early March.
To determine the worst states for giving two vaccine doses, 24/7 Wall St. reviewed data on the number of vaccine doses distributed as of March 17, 2021, from the Centers for Disease Control and Prevention. States were ranked based on the number of residents who have received two doses of the COVID-19 vaccine as a percentage of the total population.
Each state has managed its vaccine rollout with varying levels of success. The state prioritization plan, differences in health care infrastructure, variance in geography and population, and the concentration of at-risk groups, have all had an impact on how quickly the vaccine has been distributed. These are the states where the most people are vaccinated.
Another factor at play in the state-by-state differences in vaccine distribution efficiency is how willing residents have been to be vaccinated. In a Census survey from February, anywhere from 13.9% to nearly half of state unvaccinated adult populations said they would probably or definitely not get a vaccine.
Click here to see the worst state for giving 2 vaccine doses.
Click here to see our methodology.

1. Alaska
> Residents receiving 2 vaccine doses as of March 17: 134,386 — 18.4% of population
> Residents receiving at least 1 dose as of March 17: 210,932 — 28.8% of population
> Average new cases per day, week ending March 17: 140 — 19.1 per 100,000 residents
> Unvaccinated adults not willing to be vaccinated: 29.1% (19th highest)
[in-text-ad]
2. New Mexico
> Residents receiving 2 vaccine doses as of March 17: 363,760 — 17.3% of population
> Residents receiving at least 1 dose as of March 17: 630,828 — 30.1% of population
> Average new cases per day, week ending March 17: 218 — 10.4 per 100,000 residents
> Unvaccinated adults not willing to be vaccinated: 18.6% (eighth lowest)
[recirclink id=841653]

3. South Dakota
> Residents receiving 2 vaccine doses as of March 17: 137,259 — 15.5% of population
> Residents receiving at least 1 dose as of March 17: 248,205 — 28.1% of population
> Average new cases per day, week ending March 17: 117 — 13.2 per 100,000 residents
> Unvaccinated adults not willing to be vaccinated: 30.9% (16th highest)

4. Hawaii
> Residents receiving 2 vaccine doses as of March 17: 212,680 — 15.0% of population
> Residents receiving at least 1 dose as of March 17: 349,281 — 24.7% of population
> Average new cases per day, week ending March 17: 57 — 4.0 per 100,000 residents
> Unvaccinated adults not willing to be vaccinated: 18.7% (ninth lowest)
[in-text-ad-2]

5. West Virginia
> Residents receiving 2 vaccine doses as of March 17: 261,121 — 14.6% of population
> Residents receiving at least 1 dose as of March 17: 426,168 — 23.8% of population
> Average new cases per day, week ending March 17: 285 — 15.9 per 100,000 residents
> Unvaccinated adults not willing to be vaccinated: 31.1% (13th highest)

6. North Dakota
> Residents receiving 2 vaccine doses as of March 17: 109,249 — 14.3% of population
> Residents receiving at least 1 dose as of March 17: 200,698 — 26.3% of population
> Average new cases per day, week ending March 17: 85 — 11.2 per 100,000 residents
> Unvaccinated adults not willing to be vaccinated: 38.0% (third highest)
[in-text-ad]
7. Montana
> Residents receiving 2 vaccine doses as of March 17: 149,526 — 14.0% of population
> Residents receiving at least 1 dose as of March 17: 257,975 — 24.1% of population
> Average new cases per day, week ending March 17: 143 — 13.3 per 100,000 residents
> Unvaccinated adults not willing to be vaccinated: 29.9% (17th highest)
[recirclink id=851501]

8. Wyoming
> Residents receiving 2 vaccine doses as of March 17: 80,504 — 13.9% of population
> Residents receiving at least 1 dose as of March 17: 130,099 — 22.5% of population
> Average new cases per day, week ending March 17: 60 — 10.3 per 100,000 residents
> Unvaccinated adults not willing to be vaccinated: 49.9% (the highest)

9. Connecticut
> Residents receiving 2 vaccine doses as of March 17: 492,960 — 13.8% of population
> Residents receiving at least 1 dose as of March 17: 977,155 — 27.4% of population
> Average new cases per day, week ending March 17: 787 — 22.1 per 100,000 residents
> Unvaccinated adults not willing to be vaccinated: 18.8% (10th lowest)
[in-text-ad-2]
10. Maine
> Residents receiving 2 vaccine doses as of March 17: 178,175 — 13.3% of population
> Residents receiving at least 1 dose as of March 17: 354,939 — 26.4% of population
> Average new cases per day, week ending March 17: 180 — 13.4 per 100,000 residents
> Unvaccinated adults not willing to be vaccinated: 23.3% (17th lowest)

11. Wisconsin
> Residents receiving 2 vaccine doses as of March 17: 770,452 — 13.2% of population
> Residents receiving at least 1 dose as of March 17: 1,373,417 — 23.6% of population
> Average new cases per day, week ending March 17: 418 — 7.2 per 100,000 residents
> Unvaccinated adults not willing to be vaccinated: 33.2% (11th highest)
[in-text-ad]

12. Vermont
> Residents receiving 2 vaccine doses as of March 17: 82,429 — 13.2% of population
> Residents receiving at least 1 dose as of March 17: 158,711 — 25.4% of population
> Average new cases per day, week ending March 17: 111 — 17.8 per 100,000 residents
> Unvaccinated adults not willing to be vaccinated: 15.0% (second lowest)
[recirclink id=850606]

13. Oklahoma
> Residents receiving 2 vaccine doses as of March 17: 519,773 — 13.1% of population
> Residents receiving at least 1 dose as of March 17: 975,627 — 24.7% of population
> Average new cases per day, week ending March 17: 502 — 12.7 per 100,000 residents
> Unvaccinated adults not willing to be vaccinated: 36.5% (fifth highest)

14. Arizona
> Residents receiving 2 vaccine doses as of March 17: 935,640 — 12.9% of population
> Residents receiving at least 1 dose as of March 17: 1,682,456 — 23.1% of population
> Average new cases per day, week ending March 17: 1,000 — 13.7 per 100,000 residents
> Unvaccinated adults not willing to be vaccinated: 26.8% (23rd highest)
[in-text-ad-2]

15. Nebraska
> Residents receiving 2 vaccine doses as of March 17: 248,063 — 12.8% of population
> Residents receiving at least 1 dose as of March 17: 457,500 — 23.7% of population
> Average new cases per day, week ending March 17: 260 — 13.4 per 100,000 residents
> Unvaccinated adults not willing to be vaccinated: 24.4% (19th lowest)

16. Massachusetts
> Residents receiving 2 vaccine doses as of March 17: 879,441 — 12.8% of population
> Residents receiving at least 1 dose as of March 17: 1,805,897 — 26.2% of population
> Average new cases per day, week ending March 17: 1,595 — 23.1 per 100,000 residents
> Unvaccinated adults not willing to be vaccinated: 16.6% (fourth lowest)
[in-text-ad]
17. Iowa
> Residents receiving 2 vaccine doses as of March 17: 399,146 — 12.7% of population
> Residents receiving at least 1 dose as of March 17: 756,625 — 24.0% of population
> Average new cases per day, week ending March 17: 469 — 14.9 per 100,000 residents
> Unvaccinated adults not willing to be vaccinated: 29.5% (18th highest)
[recirclink id=851770]

18. Minnesota
> Residents receiving 2 vaccine doses as of March 17: 710,484 — 12.6% of population
> Residents receiving at least 1 dose as of March 17: 1,379,321 — 24.5% of population
> Average new cases per day, week ending March 17: 1,019 — 18.1 per 100,000 residents
> Unvaccinated adults not willing to be vaccinated: 25.8% (25th lowest)

19. Indiana
> Residents receiving 2 vaccine doses as of March 17: 843,588 — 12.5% of population
> Residents receiving at least 1 dose as of March 17: 1,345,400 — 20.0% of population
> Average new cases per day, week ending March 17: 770 — 11.4 per 100,000 residents
> Unvaccinated adults not willing to be vaccinated: 33.3% (10th highest)
[in-text-ad-2]

20. New Jersey
> Residents receiving 2 vaccine doses as of March 17: 1,109,188 — 12.5% of population
> Residents receiving at least 1 dose as of March 17: 2,251,222 — 25.3% of population
> Average new cases per day, week ending March 17: 3,607 — 40.6 per 100,000 residents
> Unvaccinated adults not willing to be vaccinated: 16.2% (third lowest)
21. Washington
> Residents receiving 2 vaccine doses as of March 17: 945,062 — 12.4% of population
> Residents receiving at least 1 dose as of March 17: 1,742,242 — 22.9% of population
> Average new cases per day, week ending March 17: 687 — 9.0 per 100,000 residents
> Unvaccinated adults not willing to be vaccinated: 21.2% (12th lowest)
[in-text-ad]

22. Colorado
> Residents receiving 2 vaccine doses as of March 17: 709,609 — 12.3% of population
> Residents receiving at least 1 dose as of March 17: 1,262,328 — 21.9% of population
> Average new cases per day, week ending March 17: 1,049 — 18.2 per 100,000 residents
> Unvaccinated adults not willing to be vaccinated: 22.1% (15th lowest)
[recirclink id=852123]

23. Virginia
> Residents receiving 2 vaccine doses as of March 17: 1,042,826 — 12.2% of population
> Residents receiving at least 1 dose as of March 17: 1,968,155 — 23.1% of population
> Average new cases per day, week ending March 17: 1,302 — 15.3 per 100,000 residents
> Unvaccinated adults not willing to be vaccinated: 19.9% (11th lowest)

24. Delaware
> Residents receiving 2 vaccine doses as of March 17: 117,796 — 12.1% of population
> Residents receiving at least 1 dose as of March 17: 218,487 — 22.4% of population
> Average new cases per day, week ending March 17: 301 — 30.9 per 100,000 residents
> Unvaccinated adults not willing to be vaccinated: 24.9% (22nd lowest)
[in-text-ad-2]

25. Maryland
> Residents receiving 2 vaccine doses as of March 17: 730,421 — 12.1% of population
> Residents receiving at least 1 dose as of March 17: 1,397,258 — 23.1% of population
> Average new cases per day, week ending March 17: 852 — 14.1 per 100,000 residents
> Unvaccinated adults not willing to be vaccinated: 22.4% (16th lowest)

26. Illinois
> Residents receiving 2 vaccine doses as of March 17: 1,530,906 — 12.1% of population
> Residents receiving at least 1 dose as of March 17: 2,909,272 — 23.0% of population
> Average new cases per day, week ending March 17: 1,570 — 12.4 per 100,000 residents
> Unvaccinated adults not willing to be vaccinated: 18.4% (seventh lowest)
[in-text-ad]

27. Michigan
> Residents receiving 2 vaccine doses as of March 17: 1,188,958 — 11.9% of population
> Residents receiving at least 1 dose as of March 17: 2,152,908 — 21.6% of population
> Average new cases per day, week ending March 17: 2,160 — 21.6 per 100,000 residents
> Unvaccinated adults not willing to be vaccinated: 24.6% (20th lowest)
[recirclink id=841653]

28. Kentucky
> Residents receiving 2 vaccine doses as of March 17: 531,743 — 11.9% of population
> Residents receiving at least 1 dose as of March 17: 1,072,092 — 24.0% of population
> Average new cases per day, week ending March 17: 832 — 18.6 per 100,000 residents
> Unvaccinated adults not willing to be vaccinated: 34.8% (eighth highest)
29. Oregon
> Residents receiving 2 vaccine doses as of March 17: 499,062 — 11.8% of population
> Residents receiving at least 1 dose as of March 17: 906,252 — 21.5% of population
> Average new cases per day, week ending March 17: 319 — 7.6 per 100,000 residents
> Unvaccinated adults not willing to be vaccinated: 24.0% (18th lowest)
[in-text-ad-2]

30. North Carolina
> Residents receiving 2 vaccine doses as of March 17: 1,239,527 — 11.8% of population
> Residents receiving at least 1 dose as of March 17: 2,337,632 — 22.3% of population
> Average new cases per day, week ending March 17: 1,651 — 15.7 per 100,000 residents
> Unvaccinated adults not willing to be vaccinated: 26.1% (25th highest)

31. Ohio
> Residents receiving 2 vaccine doses as of March 17: 1,378,934 — 11.8% of population
> Residents receiving at least 1 dose as of March 17: 2,507,736 — 21.5% of population
> Average new cases per day, week ending March 17: 1,534 — 13.1 per 100,000 residents
> Unvaccinated adults not willing to be vaccinated: 31.1% (14th highest)
[in-text-ad]

32. Idaho
> Residents receiving 2 vaccine doses as of March 17: 210,094 — 11.8% of population
> Residents receiving at least 1 dose as of March 17: 349,038 — 19.5% of population
> Average new cases per day, week ending March 17: 320 — 17.9 per 100,000 residents
> Unvaccinated adults not willing to be vaccinated: 35.9% (seventh highest)
[recirclink id=851501]
33. Nevada
> Residents receiving 2 vaccine doses as of March 17: 357,115 — 11.6% of population
> Residents receiving at least 1 dose as of March 17: 651,736 — 21.2% of population
> Average new cases per day, week ending March 17: 431 — 14.0 per 100,000 residents
> Unvaccinated adults not willing to be vaccinated: 24.9% (23rd lowest)
34. Pennsylvania
> Residents receiving 2 vaccine doses as of March 17: 1,474,677 — 11.5% of population
> Residents receiving at least 1 dose as of March 17: 3,012,928 — 23.5% of population
> Average new cases per day, week ending March 17: 2,492 — 19.5 per 100,000 residents
> Unvaccinated adults not willing to be vaccinated: 21.6% (13th lowest)
[in-text-ad-2]

35. Florida
> Residents receiving 2 vaccine doses as of March 17: 2,449,545 — 11.4% of population
> Residents receiving at least 1 dose as of March 17: 4,524,707 — 21.1% of population
> Average new cases per day, week ending March 17: 4,638 — 21.6 per 100,000 residents
> Unvaccinated adults not willing to be vaccinated: 28.5% (20th highest)

36. Louisiana
> Residents receiving 2 vaccine doses as of March 17: 528,524 — 11.4% of population
> Residents receiving at least 1 dose as of March 17: 963,135 — 20.7% of population
> Average new cases per day, week ending March 17: 496 — 10.7 per 100,000 residents
> Unvaccinated adults not willing to be vaccinated: 36.7% (fourth highest)
[in-text-ad]

37. Kansas
> Residents receiving 2 vaccine doses as of March 17: 328,529 — 11.3% of population
> Residents receiving at least 1 dose as of March 17: 638,421 — 21.9% of population
> Average new cases per day, week ending March 17: 265 — 9.1 per 100,000 residents
> Unvaccinated adults not willing to be vaccinated: 26.5% (24th highest)
[recirclink id=850606]
38. South Carolina
> Residents receiving 2 vaccine doses as of March 17: 574,702 — 11.2% of population
> Residents receiving at least 1 dose as of March 17: 1,065,987 — 20.7% of population
> Average new cases per day, week ending March 17: 1,096 — 21.3 per 100,000 residents
> Unvaccinated adults not willing to be vaccinated: 32.0% (12th highest)

39. New Hampshire
> Residents receiving 2 vaccine doses as of March 17: 151,047 — 11.1% of population
> Residents receiving at least 1 dose as of March 17: 345,874 — 25.4% of population
> Average new cases per day, week ending March 17: 251 — 18.5 per 100,000 residents
> Unvaccinated adults not willing to be vaccinated: 22.0% (14th lowest)
[in-text-ad-2]

40. Rhode Island
> Residents receiving 2 vaccine doses as of March 17: 117,181 — 11.1% of population
> Residents receiving at least 1 dose as of March 17: 286,139 — 27.0% of population
> Average new cases per day, week ending March 17: 349 — 33.0 per 100,000 residents
> Unvaccinated adults not willing to be vaccinated: 13.9% (the lowest)

41. New York
> Residents receiving 2 vaccine doses as of March 17: 2,096,336 — 10.8% of population
> Residents receiving at least 1 dose as of March 17: 4,487,772 — 23.1% of population
> Average new cases per day, week ending March 17: 7,043 — 36.2 per 100,000 residents
> Unvaccinated adults not willing to be vaccinated: 17.1% (fifth lowest)
[in-text-ad]

42. Mississippi
> Residents receiving 2 vaccine doses as of March 17: 318,358 — 10.7% of population
> Residents receiving at least 1 dose as of March 17: 604,746 — 20.3% of population
> Average new cases per day, week ending March 17: 453 — 15.2 per 100,000 residents
> Unvaccinated adults not willing to be vaccinated: 40.0% (second highest)
[recirclink id=851770]

43. California
> Residents receiving 2 vaccine doses as of March 17: 4,223,542 — 10.7% of population
> Residents receiving at least 1 dose as of March 17: 8,847,129 — 22.4% of population
> Average new cases per day, week ending March 17: 3,516 — 8.9 per 100,000 residents
> Unvaccinated adults not willing to be vaccinated: 17.8% (sixth lowest)
44. Missouri
> Residents receiving 2 vaccine doses as of March 17: 635,191 — 10.3% of population
> Residents receiving at least 1 dose as of March 17: 1,235,858 — 20.1% of population
> Average new cases per day, week ending March 17: 402 — 6.6 per 100,000 residents
> Unvaccinated adults not willing to be vaccinated: 25.8% (24th lowest)
[in-text-ad-2]
45. Arkansas
> Residents receiving 2 vaccine doses as of March 17: 309,874 — 10.3% of population
> Residents receiving at least 1 dose as of March 17: 602,085 — 20.0% of population
> Average new cases per day, week ending March 17: 313 — 10.4 per 100,000 residents
> Unvaccinated adults not willing to be vaccinated: 28.0% (21st highest)

46. Alabama
> Residents receiving 2 vaccine doses as of March 17: 500,808 — 10.2% of population
> Residents receiving at least 1 dose as of March 17: 893,767 — 18.2% of population
> Average new cases per day, week ending March 17: 818 — 16.7 per 100,000 residents
> Unvaccinated adults not willing to be vaccinated: 36.1% (sixth highest)
[in-text-ad]

47. Tennessee
> Residents receiving 2 vaccine doses as of March 17: 669,516 — 9.8% of population
> Residents receiving at least 1 dose as of March 17: 1,300,220 — 19.0% of population
> Average new cases per day, week ending March 17: 1,268 — 18.6 per 100,000 residents
> Unvaccinated adults not willing to be vaccinated: 33.6% (ninth highest)
[recirclink id=852123]

48. Georgia
> Residents receiving 2 vaccine doses as of March 17: 1,023,227 — 9.6% of population
> Residents receiving at least 1 dose as of March 17: 1,710,417 — 16.1% of population
> Average new cases per day, week ending March 17: 1,601 — 15.1 per 100,000 residents
> Unvaccinated adults not willing to be vaccinated: 31.0% (15th highest)
49. Texas
> Residents receiving 2 vaccine doses as of March 17: 2,763,336 — 9.5% of population
> Residents receiving at least 1 dose as of March 17: 5,750,589 — 19.8% of population
> Average new cases per day, week ending March 17: 4,577 — 15.8 per 100,000 residents
> Unvaccinated adults not willing to be vaccinated: 27.8% (22nd highest)
[in-text-ad-2]

50. Utah
> Residents receiving 2 vaccine doses as of March 17: 259,004 — 8.1% of population
> Residents receiving at least 1 dose as of March 17: 639,360 — 19.9% of population
> Average new cases per day, week ending March 17: 793 — 24.7 per 100,000 residents
> Unvaccinated adults not willing to be vaccinated: 24.9% (21st lowest)
Methodology
To determine the worst states for giving two vaccine doses, 24/7 Wall St. reviewed data on the number of vaccine doses distributed as of March 17, 2021 from the Centers for Disease Control and Prevention. States were ranked based on the number of residents who have received two doses of the COVID-19 vaccine as a percentage of the total population. Data used to adjust for population came from the U.S. Census Bureau’s American Community Survey and are for 2019. Supplemental data on confirmed COVID-19 cases and deaths came from various state and local health departments. Data on the percentage of residents who have not yet received a vaccine and probably will not or definitely will not get a vaccine came from the Census Bureau’s Household Pulse Survey and are for February 17, 2021 to March 1, 2021.