U.S. employers added over half a million jobs in May of 2021. The unemployment rate declined from 6.1% the month before to 5.8%, the lowest rate since the COVID-19 pandemic hit. Yet this growth was still slower than expected. Some employers said they are struggling to find workers, and economists have put forth one theory as to why — employers are not paying high enough wages.
As of 2020, the median annual wage in America was $41,950. Wages can vary significantly, based not just on the work done, but also on where it is being done. There are over a dozen U.S. cities in which the median annual wage is over $50,000.
To determine the cities with the highest paying jobs, 24/7 Wall St. reviewed data on median annual wages for 389 metropolitan statistical areas from the U.S. Bureau of Labor Statistics Occupational Employment and Wage Statistics program.
Nearly half of the metro areas on this list actually reported lower employment figures in 2020 than in 2015. This is largely attributable to the COVID-19 pandemic, in which millions of Americans lost their jobs.
Many of the metro areas with the highest paying jobs are known as hubs for specialized fields like technology, nuclear engineering, biochemistry, and more. In addition to paying relatively high wages, these jobs were largely insulated from the effects of the pandemic, allowing workers to continue earning high wages throughout 2020. These are the 25 highest paying jobs in America.
Click here to see 25 cities with the highest paying jobs.
Click here to read our detailed methodology.

25 (tied). Sacramento–Roseville–Arden-Arcade, CA
> Median annual wage: $48,070
> Apr. 2021 unemployment rate: 6.9%
> Poverty rate: 11.9%
The median annual wage in the Sacramento metro area of California was $48,070 in 2020. This is tied for the 25th highest across the nearly 400 major metropolitan areas in America. The median annual earnings in the area increased by 15.9% from 2015 to 2020, exactly in line with the wage growth nationwide.
The number of people working in the Sacramento area increased to 968,520 in 2020, up by nearly 100,000 people from 2015. This represents a 10.7% increase — the highest jump of any metro area on this list.
[in-text-ad]
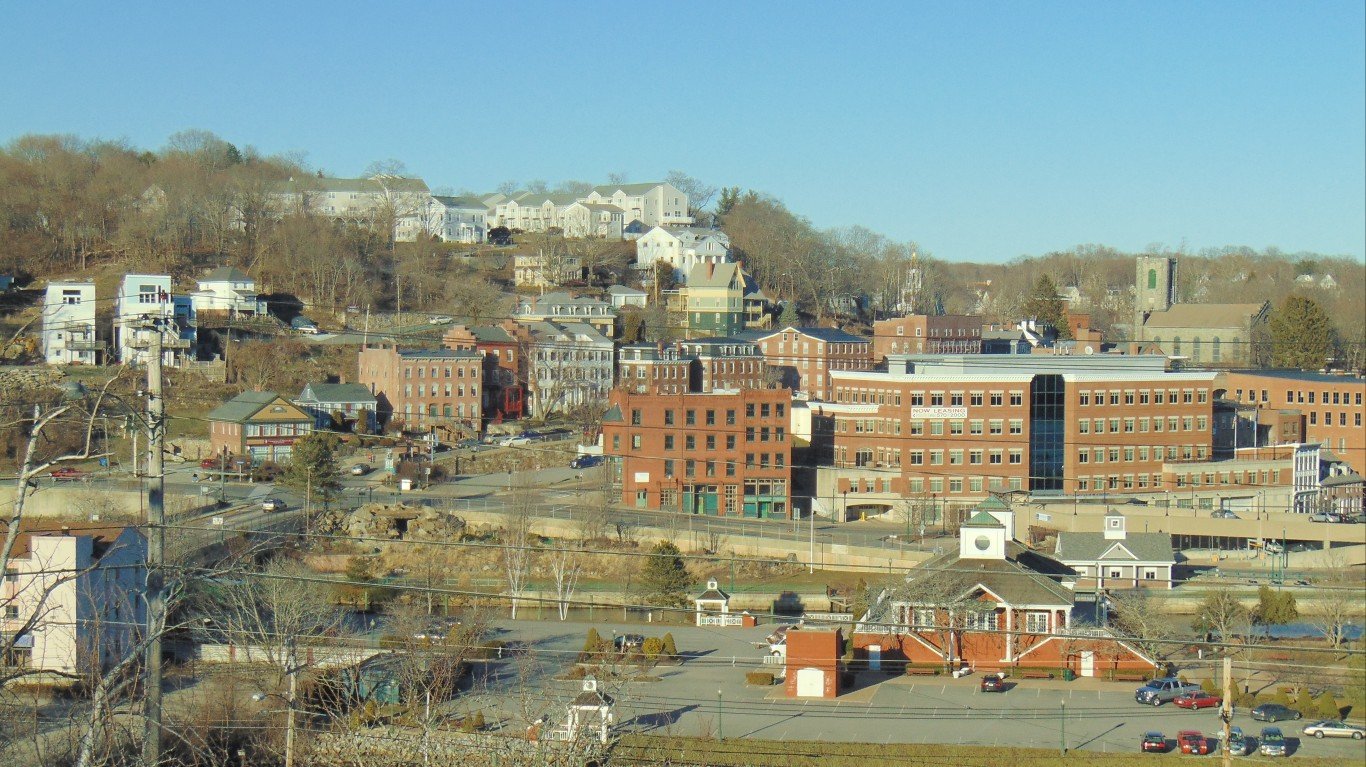
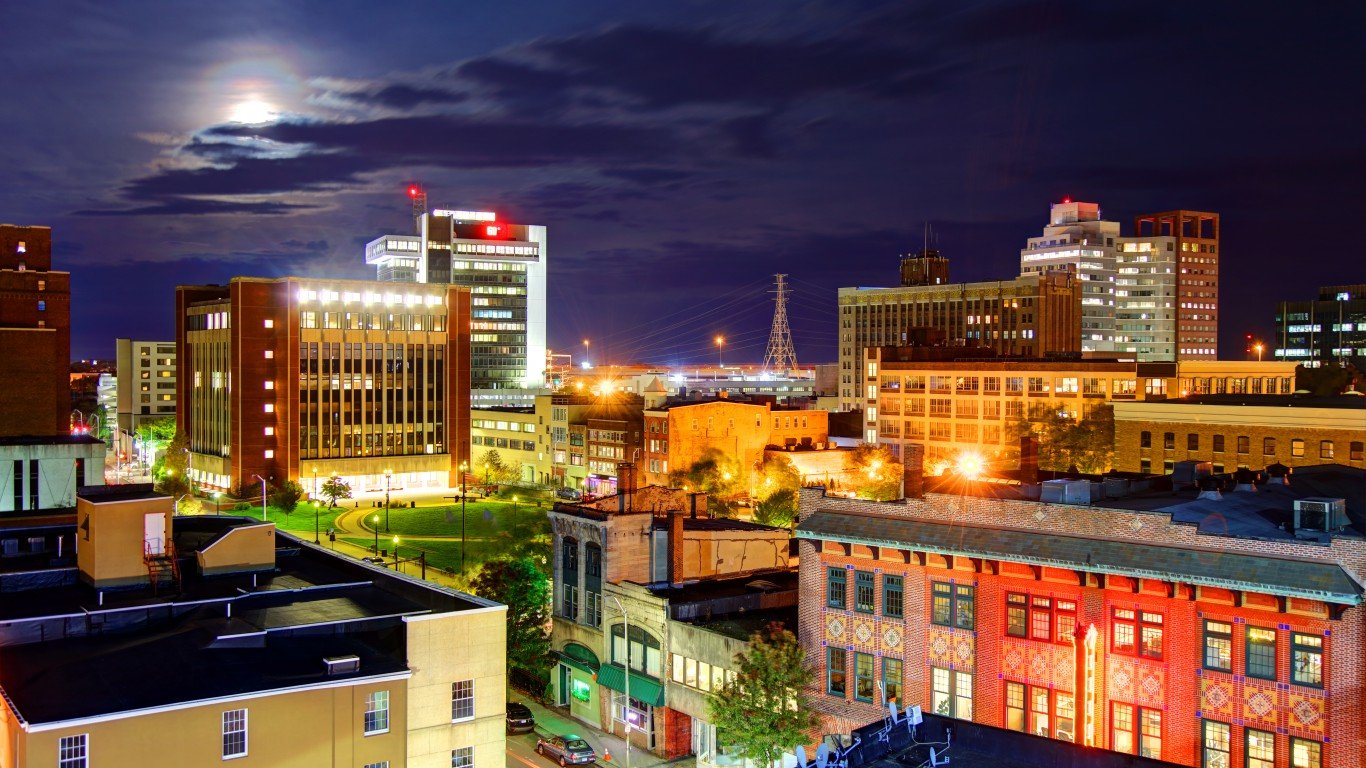
25 (tied). Norwich-New London-Westerly, CT-RI
> Median annual wage: $48,070
> Apr. 2021 unemployment rate: 8.7%
> Poverty rate: 7.2%
The Norwich-New London-Westerly area along the border of Connecticut and Rhode Island now ranks as one of the 25 metro areas with the highest median annual wage in the U.S. with most workers earning over $48,000 annually. From 2015 to 2020, the area’s median annual wages increased by 24.4% — one of the 10 largest increases among all metro areas.
The number of people working in the Norwich area declined by 12.6% from 2015 to 2020, one of the largest drops of any major metropolitan area in the U.S. Of the 26 cities with the highest paying jobs, 14 reported increases in employment over the last five years, while a dozen lost jobs over that same time period. For context, the total number of workers in the U.S. increased 0.9% from 2015 to 2020.
[recirclink id=846220]

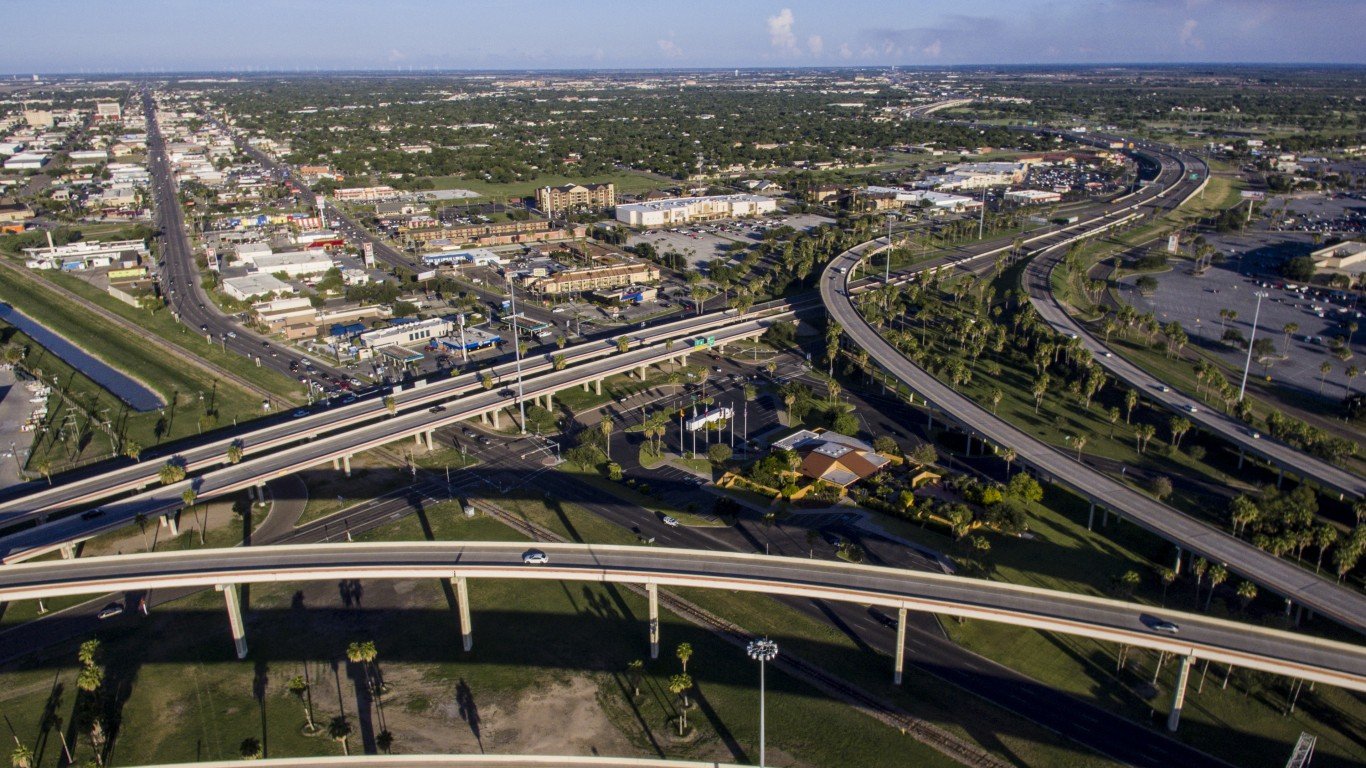
24. San Diego-Carlsbad, CA
> Median annual wage: $48,200
> Apr. 2021 unemployment rate: 7.1%
> Poverty rate: 10.3%
There are nearly 1.4 million workers in the San Diego metro area in southern California, most of whom earn over $48,000 in wages per year. Biochemist, biophysicist, and biological scientist are relatively highly concentrated jobs in the San Diego area when compared to the occupation’s concentration in the national labor force. These jobs tend to pay much higher wages than the typical job.
Like nearly every other area on this list, goods and services in the San Diego area tend to be expensive. The area’s cost of living is nearly 18% higher than the average nationwide, the 10th highest cost of living among all major metro areas in the nation. Home values tend to be high in the San Diego area as well. The median home is worth $619,300, more than double the U.S. median of $240,500.

23. Urban Honolulu, HI
> Median annual wage: $48,310
> Apr. 2021 unemployment rate: 7.8%
> Poverty rate: 8.1%
The median annual wage for all jobs in the Honolulu metro area increased from $39,690 in 2015 to $48,310 in 2020, a 21.7% increase. The area went from having the 32nd highest annual median wage in the country to the 23rd highest. The area’s higher wages are offset by Honolulu’s high cost of living, which is 23.8% higher than average nationwide and is the fourth highest cost of living in the U.S.
Two of the most highly concentrated jobs in Honolulu, relative to the national concentration, are cooks and baggage porters, which both rely on Hawaii’s tourism industry. That industry shut down for much of 2020 due to the COVID-19 pandemic, leaving many without a job. Compared to 2015, the number of people working in the Honolulu area declined by 8.6% in 2020.
[in-text-ad-2]

22. New Haven, CT
> Median annual wage: $48,410
> Apr. 2021 unemployment rate: 7.3%
> Poverty rate: 12.2%
The median annual wage in the New Haven, Connecticut, area is higher than in all but 21 other major metropolitan areas in the U.S., at $48,410. The median annual wage nationwide is $41,950. Unlike most other areas on this list, wages in the New Haven area have increased relatively slowly, growing just 12.9% from 2015 to 2020. Nationwide, wages increased 15.9% during that time period.
From 2015 to 2020, the number of people working in the New Haven area declined 3.6%, from nearly 280,000 to just under 270,000. Across the country, the number of total workers increased by 0.9%, even after taking into account the COVID-19 pandemic’s effects on the job market.
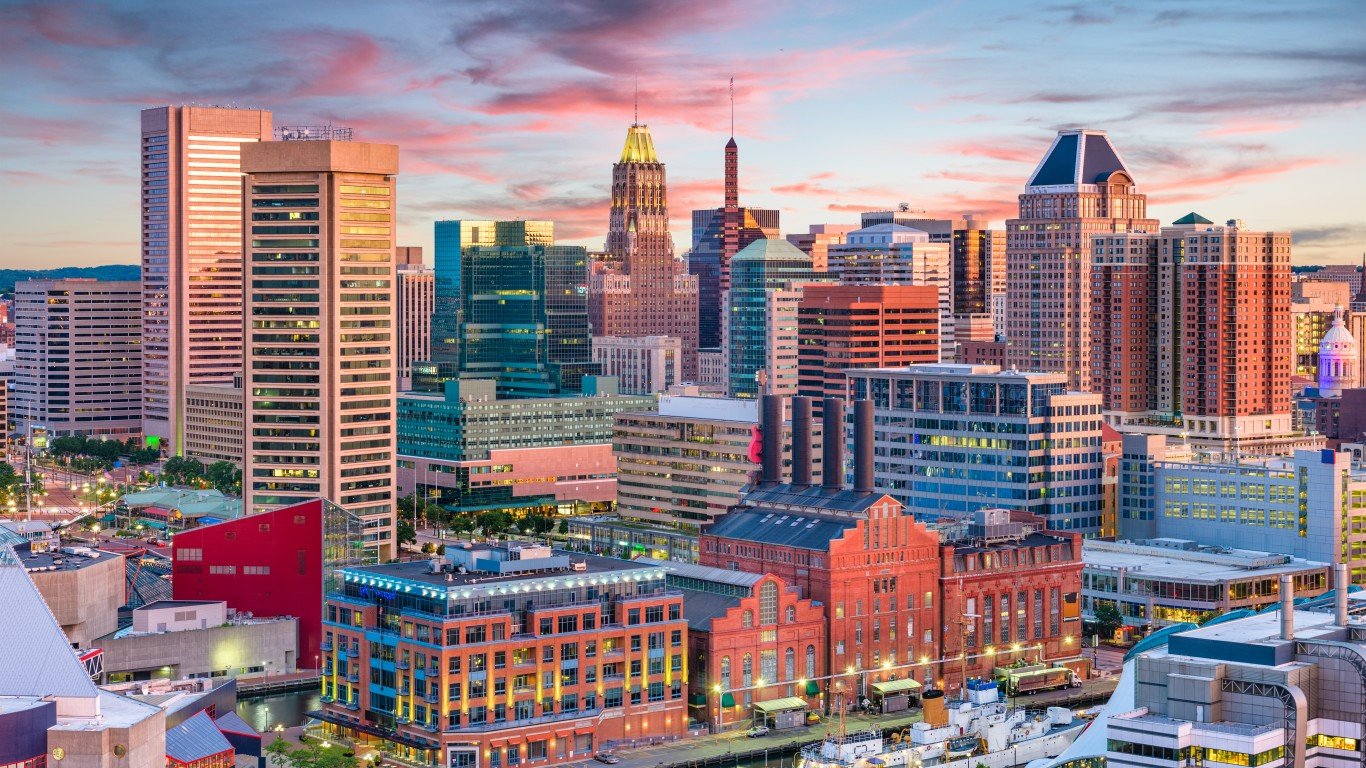
21. Baltimore-Columbia-Towson, MD
> Median annual wage: $48,470
> Apr. 2021 unemployment rate: 5.7%
> Poverty rate: 9.4%
The Baltimore area has a higher median annual wage than all but 20 other metro areas in the U.S., at $48,470 — well above the $41,950 median annual wage nationwide. Just 9.4% of area residents live below the poverty line, compared to 12.3% of Americans overall.
The Baltimore area has an outsized share of computer and information research scientists relative to their share in the national labor force. These workers are 4.6 times more common in the Baltimore area than they are nationwide and help boost the median annual wage, as most of these tech workers earn more than $126,600.
[in-text-ad]
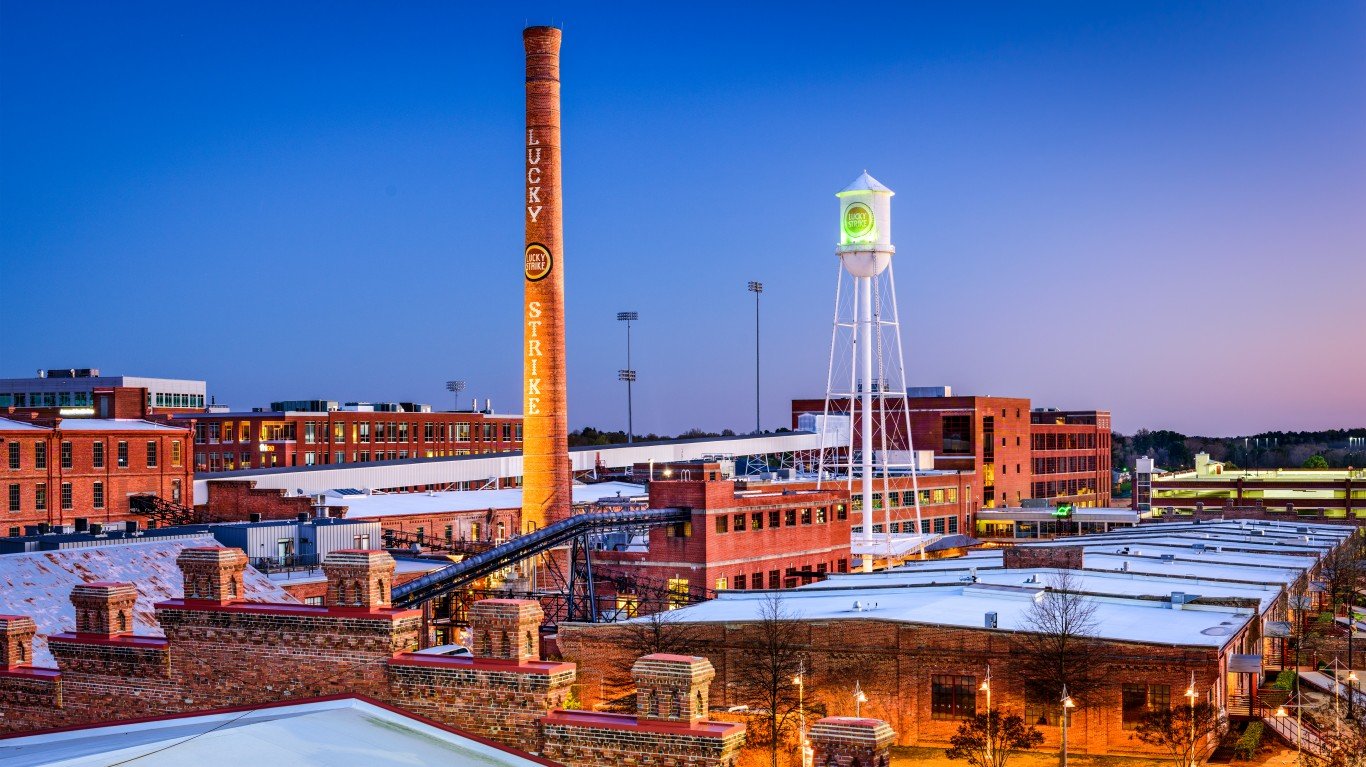
20. Durham-Chapel Hill, NC
> Median annual wage: $49,460
> Apr. 2021 unemployment rate: 3.8%
> Poverty rate: 14.0%
The Durham-Chapel Hill area of North Carolina is part of the Research Triangle, the area between three research universities — UNC – Chapel Hill, Duke University, and North Carolina State. These schools produce thousands of graduates with STEM degrees annually, providing companies in the area with a steady influx of new workers. The metro area has one of the highest bachelor’s degree attainment rates in the country, at 46.3%, well above the 33.1% rate nationwide. This likely helps boost the median annual wage in the area, which ranks 20th, at $49,640.
The relatively high wages in the Durham area go farther than in most high-income areas as the cost of living is 5.2% lower than the average U.S. cost of living. Durham is one of just two metro areas on this list with a relatively low cost of living.
[recirclink id=829058]

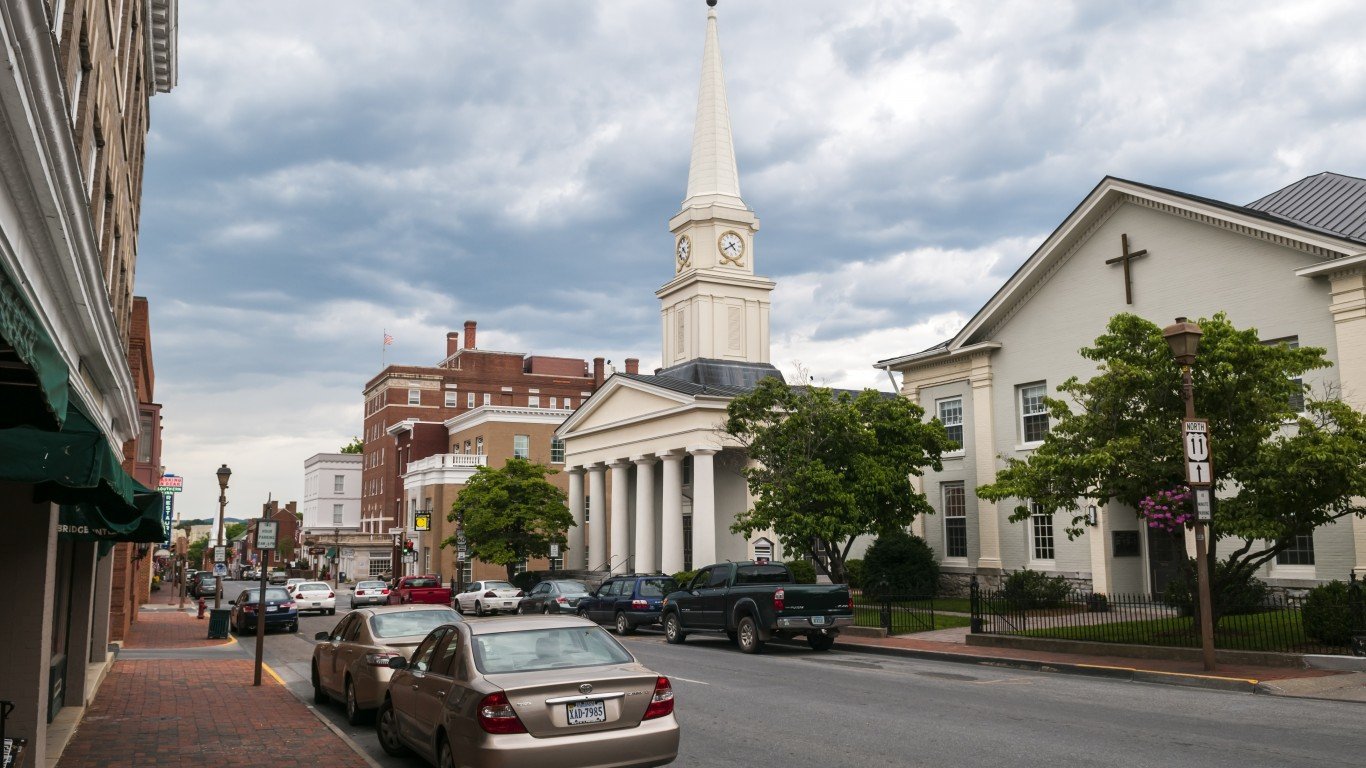
19. Portsmouth, NH-ME
> Median annual wage: $49,640
> Apr. 2021 unemployment rate: 2.9%
> Poverty rate: N/A
The Portsmouth metro area along the New Hampshire-Maine border had the 38th highest median annual wage in 2015, at $39,100. By 2020, that median wage increased to $49,640 and ranked 19th highest of nearly 400 major metro areas. The 27.0% increase in the area’s median wage is the third highest jump of all metro areas. In addition to these high wages, Portsmouth’s unemployment rate is very low, at 2.9% in April 2021 — less than half of the national unemployment rate of 6.1% and the lowest of any area on this list.
Portsmouth is 13 miles away from the NextEra Energy Seabrook nuclear power plant, which employs hundreds of people, including a number of nuclear engineers — the most concentrated occupation in the metro area relative to its concentration in the U.S. labor force. These highly specialized workers typically earn more than $93,000 per year.
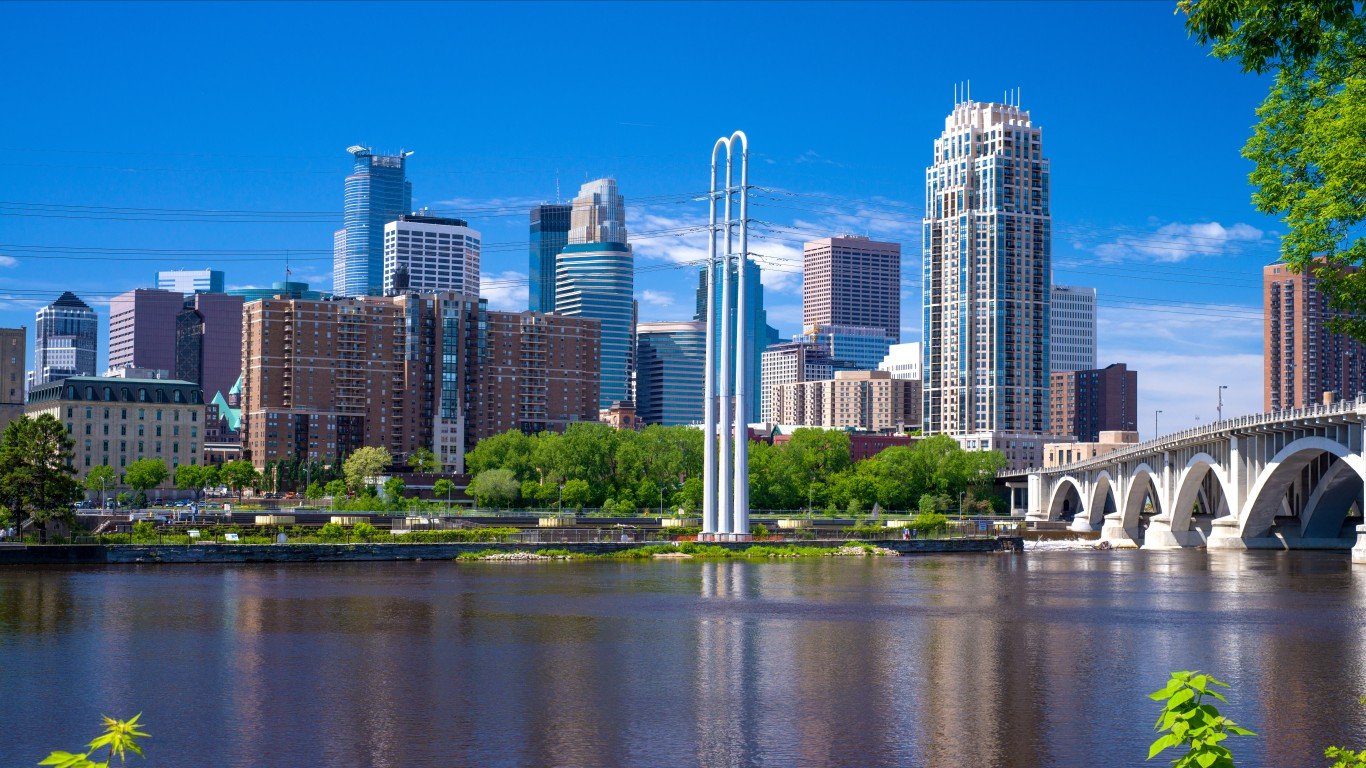
18. Minneapolis-St. Paul-Bloomington, MN-WI
> Median annual wage: $49,700
> Apr. 2021 unemployment rate: 3.9%
> Poverty rate: 8.2%
The Minneapolis metro area is the only place in the Midwest to rank among the metro areas with the 25 highest paying jobs. As is the case with many areas on this list, Minneapolis has a relatively high bachelor’s degree attainment rate with 43.2% of adults 25 and older holding at least a bachelor’s degree, more than 10 percentage points higher than the U.S. rate. Degree holders tend to have much higher earnings than workers without degrees.
The Minneapolis area has a strong job market, with a 3.9% unemployment rate as of April 2021, well below the national unemployment rate of 6.1%. Just 8.2% of area residents live below the poverty line, compared to 12.3% of all Americans.
[in-text-ad-2]
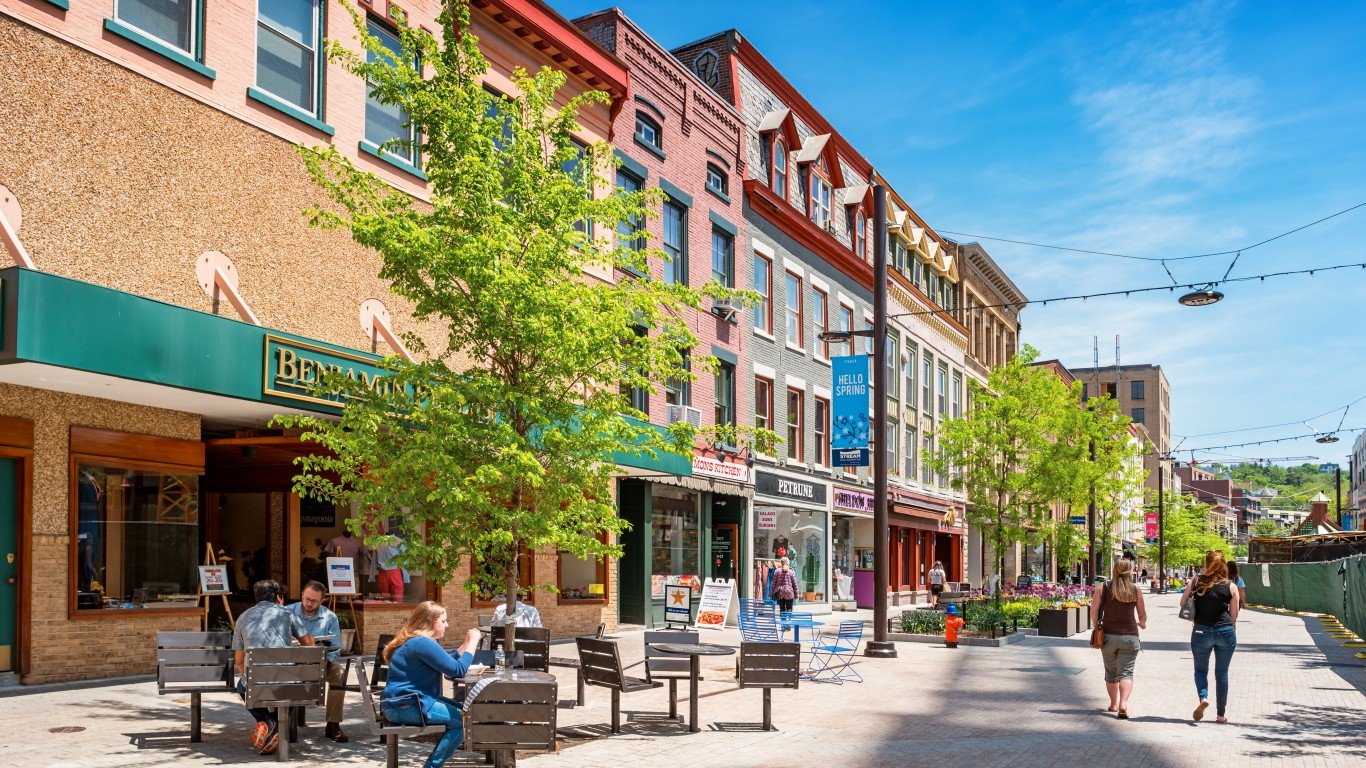
17. Ithaca, NY
> Median annual wage: $49,880
> Apr. 2021 unemployment rate: 4.9%
> Poverty rate: 17.9%
The typical Ithaca, New York, worker earns nearly $50,000 per year, higher than all but 16 other metro areas in the U.S. Home to Ivy League college Cornell University and its prestigious veterinary medicine program, Ithaca’s most concentrated job relative to the job’s concentration nationwide, is postsecondary biological teachers. These educators typically earn nearly $128,000.
Unlike nearly every other city with the highest paying jobs, the Ithaca metro area has a relatively high poverty rate, at 17.9%. Only two other cities on this list exceed the U.S. poverty rate of 12.3%, though neither has a poverty rate nearly as high. More than 1 in 10 Ithaca households earn less than $10,000 per year, well above the 5.8% rate nationwide.

16. Olympia-Tumwater, WA
> Median annual wage: $50,070
> Apr. 2021 unemployment rate: 5.3%
> Poverty rate: 9.2%
The Olympia, Washington, area of western Washington is one of just 16 metro areas across the country in which most workers earn more than $50,000 per year. Nationwide, most workers earn less than $42,000.
In the last five years, the area’s median annual wage increased by 24.5% — the sixth highest increase among the nearly 400 metro areas in the U.S. In 2015, Olympia area workers had an annual median wage of $40,210. In that same time, the number of workers in the area grew by 7.6%, compared to a less than 1% increase in U.S. total employment.
[in-text-ad]
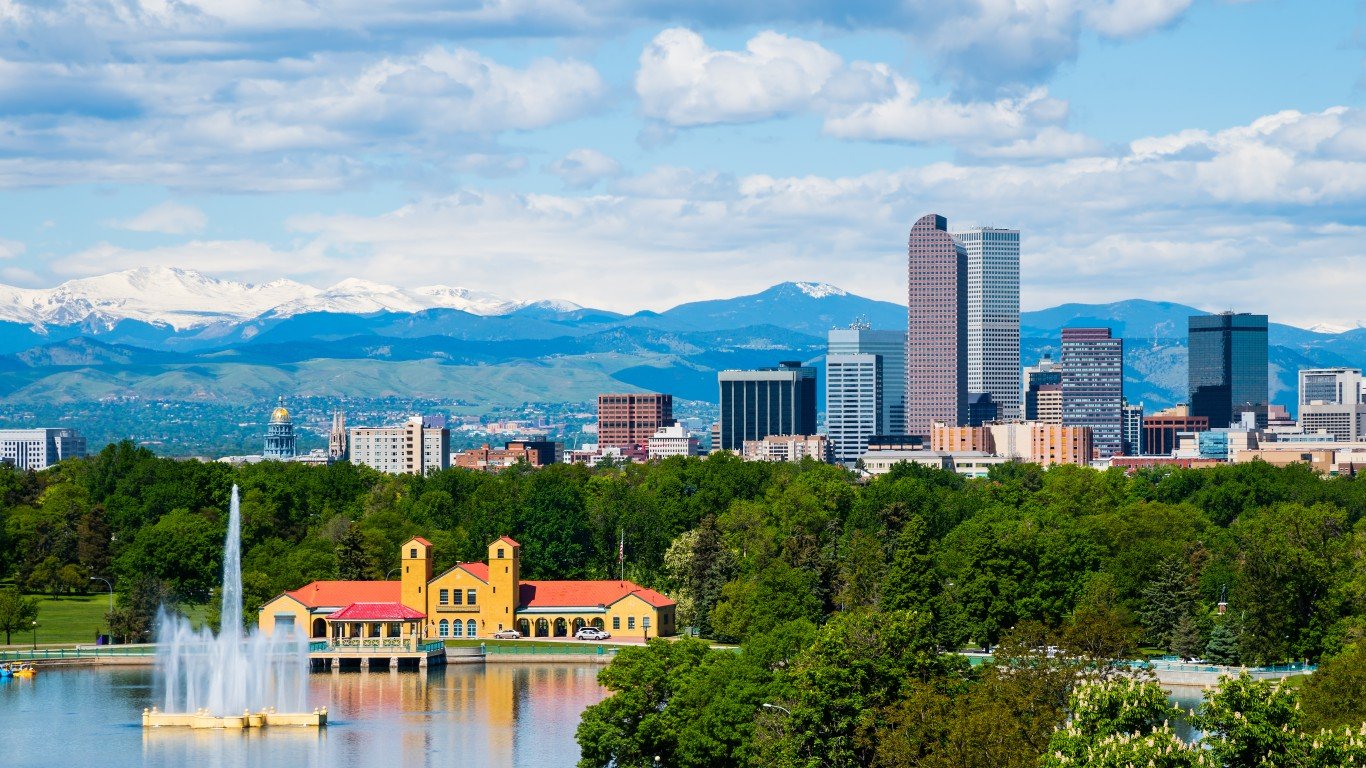
15. Denver-Aurora-Lakewood, CO
> Median annual wage: $50,170
> Apr. 2021 unemployment rate: 6.6%
> Poverty rate: 7.9%
The Denver area has a rapidly expanding job market and rapidly increasing wages. From 2015 to 2020, the area’s total number of workers increased from 1.37 million to 1.46 million, a 6% increase. Nationwide, the number of workers increased by just under 1.0%. The Denver area’s median annual wage increased by 21.6% to $50,170 during that same time period. Nationwide, wages increased by 15.9% over that time.
Across the country, 12.3% of people live in poverty. In the Denver area, the poverty rate is just 7.9%, one of the lowest of any major metro area.
[recirclink id=836401]
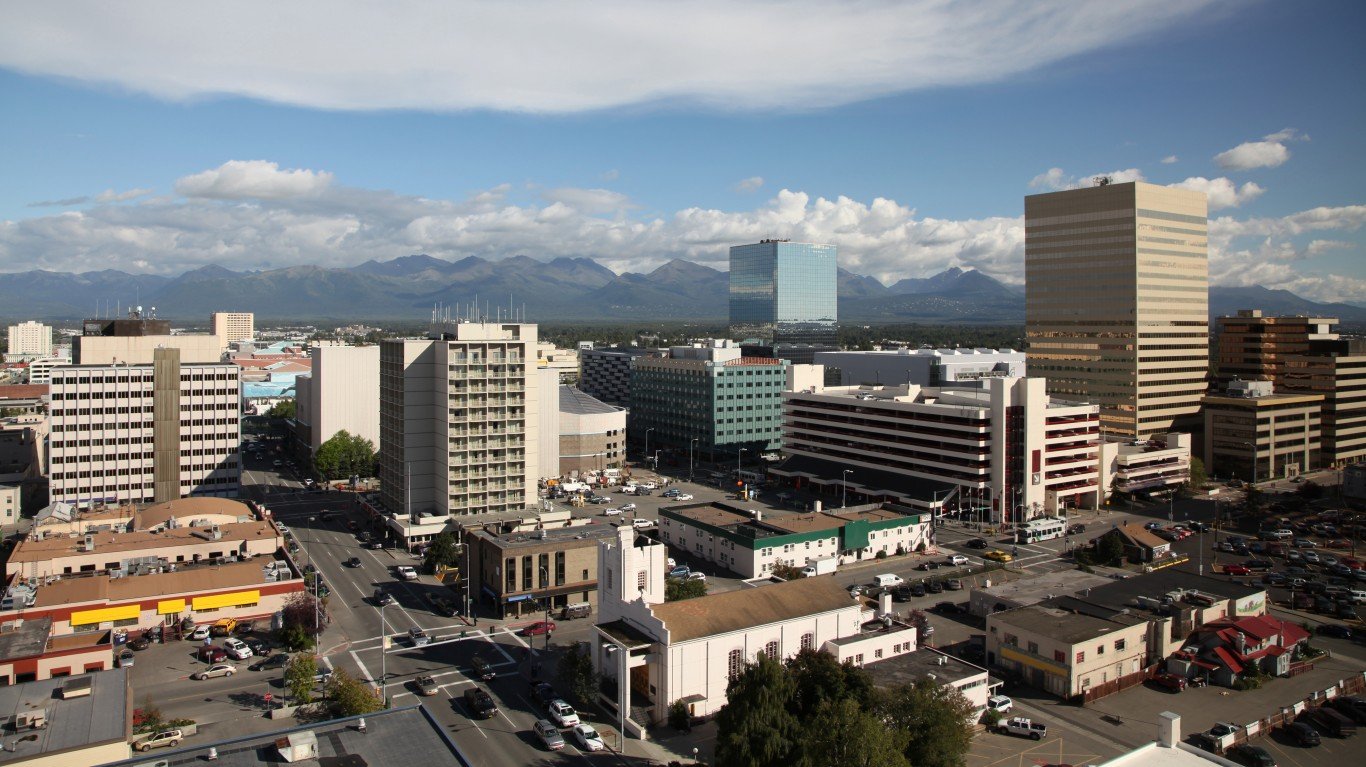
14. Anchorage, AK
> Median annual wage: $50,180
> Apr. 2021 unemployment rate: 6.9%
> Poverty rate: 10.0%
The Anchorage metro area in southern Alaska ranks 14th in the country in wages, with a median annual wage of $50,180. It is one of two metro areas in the state to rank among the 25 cities with the highest paying jobs. In 2015, the area’s median wage ranked among the 10 highest in the country, but Anchorage is one of just 17 American metro areas in which median annual wages increased by less than 10% from 2015 to 2020. Across the country, wages increased by 15.9%.
The most concentrated jobs in Anchorage, relative to the occupation’s concentration in the U.S. workforce, are commercial pilots, petroleum engineers, and airline pilots, copilots, and flight engineers, which tend to pay relatively well. Pilots are necessary in Alaska as many communities are not reachable by roads.
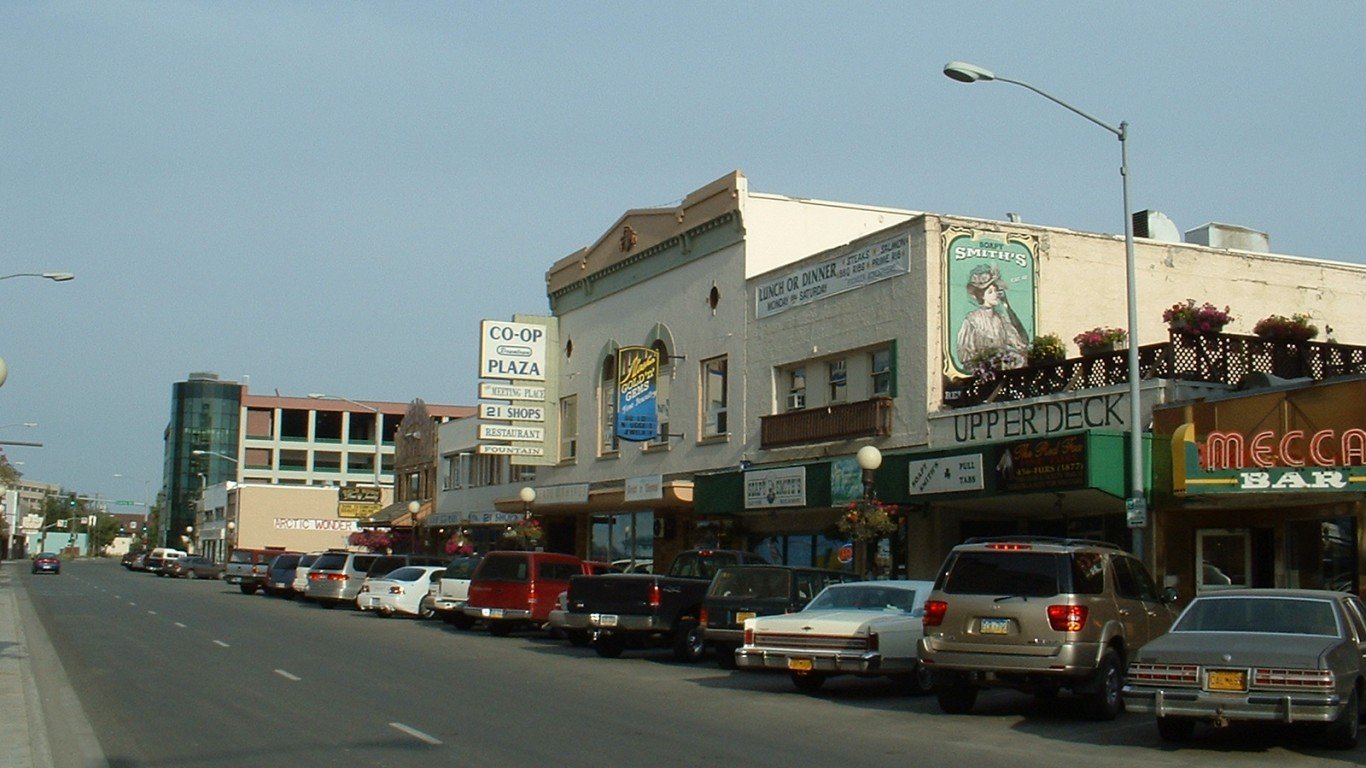
13. Fairbanks, AK
> Median annual wage: $50,660
> Apr. 2021 unemployment rate: 5.4%
> Poverty rate: 5.9%
Alaska is rich in natural resources like oil and natural gas, and the most concentrated jobs in the Fairbanks, Alaska, labor force — when compared to the U.S. labor force — are geoscientists, earth drillers, and environmental scientists. These jobs pay much higher wages than the typical occupation. Though jobs in Fairbanks tend to pay well, incomes in the area did not increase nearly as quickly as they did across the country. The area’s median annual wage of $50,660 in 2020 was just 6.3% higher than it was in 2015. Nationwide, wages increased by 15.9% in that same five-year timeframe.
The Fairbanks area lost 18.4% of its employment from 2015 to 2020, with the number of workers dipping from 37,840 to 30,890 — by far the smallest labor force of any metro area on this list.
[in-text-ad-2]

12. Bremerton-Silverdale, WA
> Median annual wage: $51,060
> Apr. 2021 unemployment rate: 5.1%
> Poverty rate: 6.9%
The Bremerton area of Washington, west of Seattle across the Puget Sound, is one of just a dozen metro areas in America with median annual wages exceeding $51,000. Employment in the area has been growing rapidly, from 82,350 workers in 2015 to 86,510 in 2020. This 5.1% increase in total employment is more than five times higher than the national employment increase in the same time period.
In many of the other cities on this list, the most highly concentrated occupations, relative to their concentrations in the U.S. labor force, are in STEM fields, and include scientists, engineers, biochemists, and more. Yet in the Bremerton area, the most highly concentrated jobs relative to their concentrations nationwide are metal and plastic layout workers and riggers, both of which are most commonly employed in the ship and boat building industry.

11. New York-Newark-Jersey City, NY-NJ-PA
> Median annual wage: $52,020
> Apr. 2021 unemployment rate: 8.9%
> Poverty rate: 11.6%
In the New York City metro area, the typical worker earns a little over $52,000 — a higher wage than in all but 10 other U.S. metro areas. Nationwide, the typical worker earns just under $42,000. Though the New York area still has by far the most workers of anywhere in the country, total employment contracted in the past five years, from over 9 million in 2015 to 8.8 million in 2020, a 2.3% decline.
In spite of the relatively high wages, many New York area residents are still struggling. The area’s April 2021 unemployment rate was 8.9%, one of the 20 highest among metro areas and well above the 6.1% national unemployment rate. New York also has the third-highest cost of living among metro areas, with goods and services 25.7% more expensive than the average nationwide.
[in-text-ad]
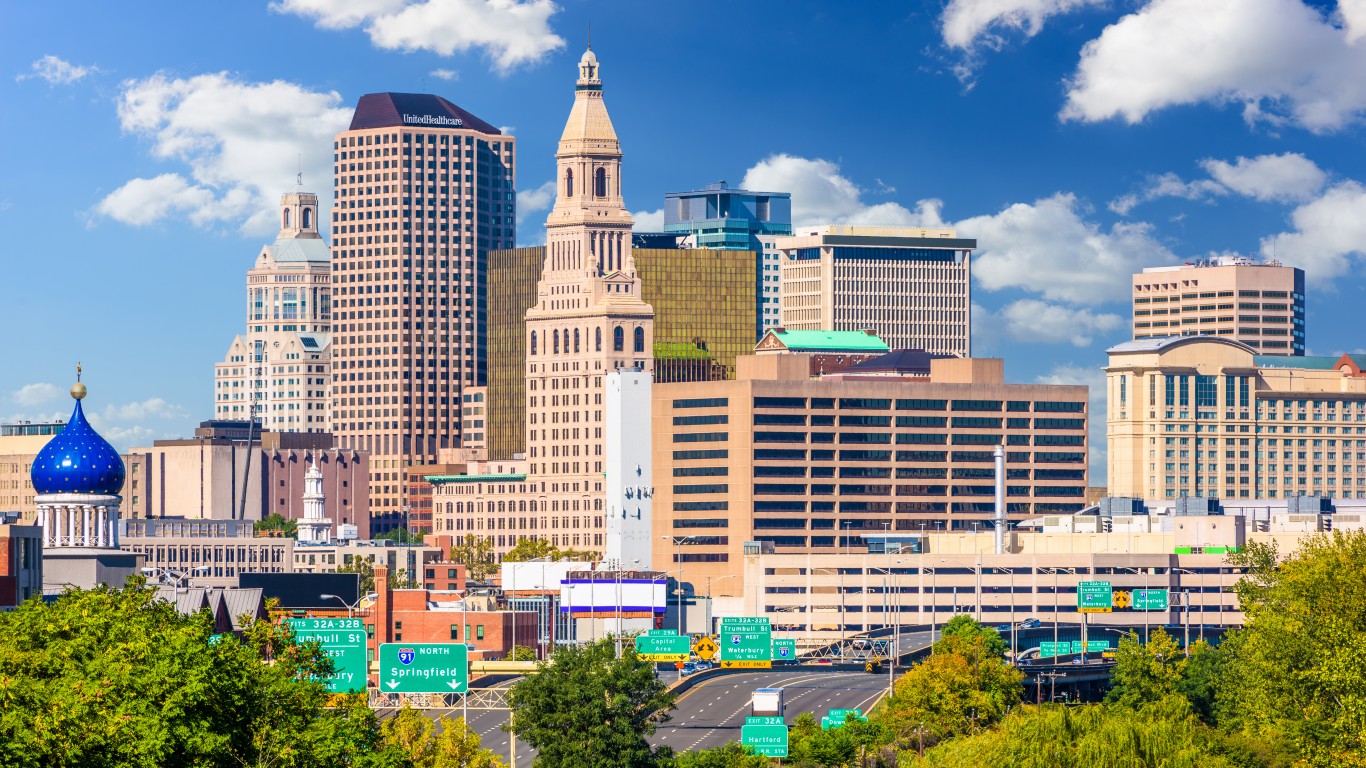
10. Hartford-West Hartford-East Hartford, CT
> Median annual wage: $53,030
> Apr. 2021 unemployment rate: 8.0%
> Poverty rate: 10.1%
The Hartford area of Connecticut ranks 10th among the metro areas with the highest paying jobs, as most workers earn over $53,000. However, the job market in the area is struggling, with an 8.0% April 2021 unemployment rate, well above the 6.1% national rate. The Hartford area lost 4.8% of workers from 2015 to 2020.
Hartford is sometimes known as “the insurance capital of the world” due to the high concentration of insurance companies headquartered there, including Aetna, The Hartford, Cigna, and more. The most highly concentrated job in the area relative to the job’s concentration in the national labor force is as an actuary, who calculates risk and liability, most commonly on behalf of insurance companies. These workers tend to earn well over $100,000 per year.
[recirclink id=855605]

9. Boulder, CO
> Median annual wage: $54,770
> Apr. 2021 unemployment rate: 5.5%
> Poverty rate: 10.9%
College-educated workers tend to earn higher wages than workers without at least a bachelor’s degree. Boulder, Colorado, ranks as the best-educated metro area in America, with 64.8% of residents 25 and older holding at least a bachelor’s degree. No other U.S. metro area has a bachelor’s degree attainment rate of even 60%.
The most highly concentrated career fields in the Boulder area relative to their concentration in the national labor force are physicists, bioengineers and biomedical engineers, and biochemists and biophysicists. These fields typically require advanced degrees from prospective employees and tend to pay high wages.
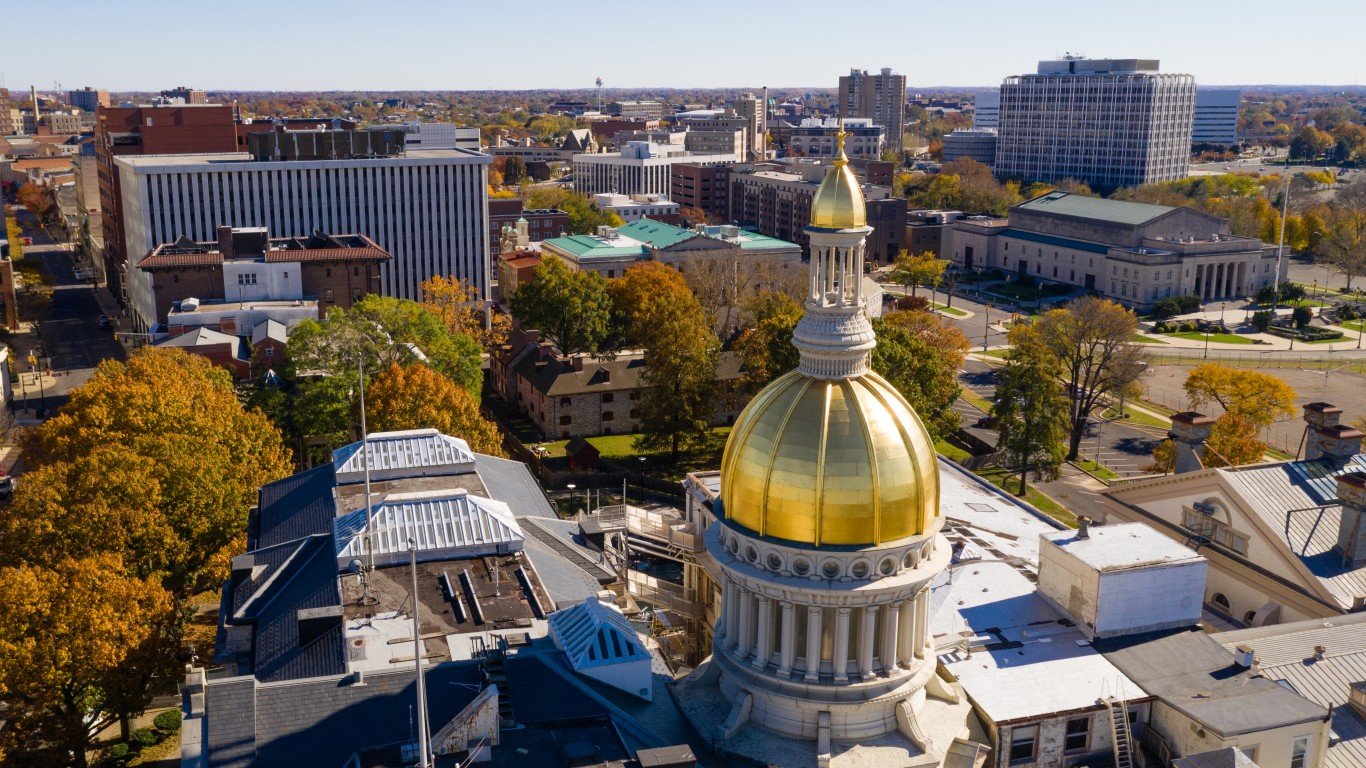
8. Trenton, NJ
> Median annual wage: $55,220
> Apr. 2021 unemployment rate: 6.1%
> Poverty rate: 12.8%
The Trenton area of New Jersey, just across the Delaware River from Pennsylvania, is one of just eight metro areas in which most workers earn over $55,000 annually. Despite the high wages, the area’s poverty rate of 12.8% is a half a percentage point higher than the U.S. rate.
Though the Trenton area has the eighth-highest median annual wage of any U.S. metro area, economic growth has been relatively slow compared to the vast majority of other places. In 2015, the area had the fourth-highest median annual wage, at $50,310. The area’s median wage has increased by just 9.8% in the five years since, the 14th slowest wage growth among metro areas.
[in-text-ad-2]
7. Bridgeport-Stamford-Norwalk, CT
> Median annual wage: $55,630
> Apr. 2021 unemployment rate: 7.7%
> Poverty rate: 9.1%
The Bridgeport area of Connecticut’s southern coast has some of the nation’s highest wages, with a median annual wage of $55,630. From 2015 to 2020, wages in the area increased by 18.5%, even as employment dwindled. In 2015, more than 417,000 people worked in the Bridgeport area. In 2020, total employment dropped to under 377,000, a nearly 10% decline.
The Bridgeport area has one of the highest concentrations of wealthy residents of nearly anywhere in America — 22.8% of households earn at least $200,000, the third highest share of any metro area and more than double the 8.5% of all U.S. households at that income level. The typical house in the area is worth $444,500, which is more than $200,000 higher than the U.S. median home value.

6. Boston-Cambridge-Nashua, MA-NH
> Median annual wage: $57,080
> Apr. 2021 unemployment rate: 6.2%
> Poverty rate: 8.6%
The Boston metro area has a median annual wage of more than $57,000 — the highest of the six New England metro areas to rank on this list. In spite of these high wages, employment in the area dipped by 0.9% from 2015 to 2020, even as employment increased by 0.9% nationwide during that time.
The Boston area is home to some of the most prestigious research universities in the nation, including Harvard, MIT, Brandeis, and more. This has helped make the area a hotbed of medical research. High-income occupations like biochemists, biophysicists, medical scientists, and more make up a much larger share of Boston’s workforce than is typical in the U.S. overall.
[in-text-ad]
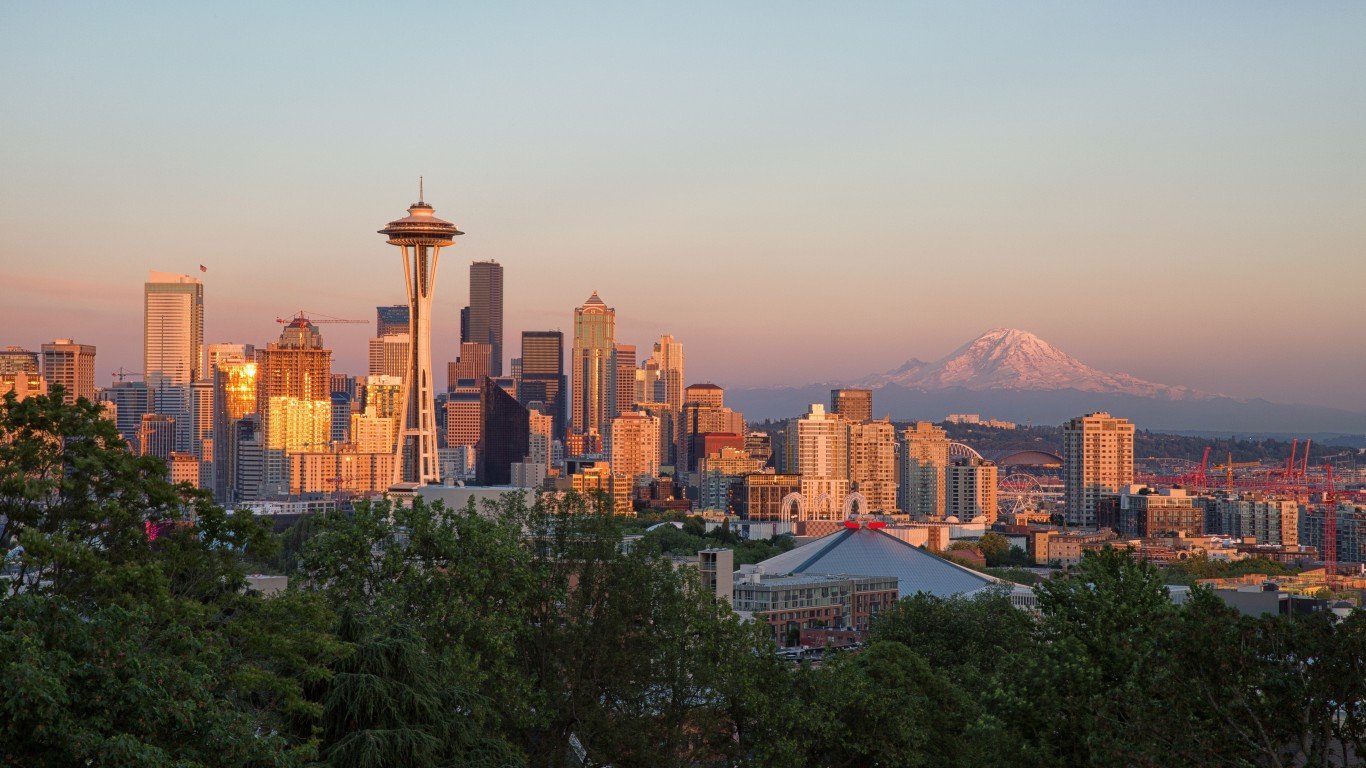
5. Seattle-Tacoma-Bellevue, WA
> Median annual wage: $58,330
> Apr. 2021 unemployment rate: 5.6%
> Poverty rate: 7.8%
The median annual wage in the Seattle metro area increased by 25.9% from 2015 to 2020, boosting the typical earnings by $12,000 to $58,330. Due in part to the presence of large companies like Boeing and Amazon, high-income jobs like avionics technicians and web developers make up an outsized share of the Seattle area’s workforce.
Financial hardship is relatively uncommon in Seattle — 7.8% of residents live in poverty compared to 12.3% of Americans overall. The share of households living on less than $10,000 is just 3.8%, 2 percentage points lower than the national share.
[recirclink id=856605]

4. Washington-Arlington-Alexandria, DC-VA-MD-WV
> Median annual wage: $60,480
> Apr. 2021 unemployment rate: 5.5%
> Poverty rate: 7.5%
The Washington, D.C. metro area is one of four metro areas with median annual wages of more than $60,000. Perhaps not surprising, just 7.5% of residents live in poverty, compared to 12.3% of Americans overall. The area’s labor market also seems to have fared relatively well during the COVID-19 pandemic. Its 5.5% unemployment rate is lower than the nationwide 6.1% rate.
High bachelor’s degree attainment rates often indicate that an area will have relatively high incomes, and the Washington, D.C. area is no exception. It is one of seven metro areas in the country in which more than half of adults 25 and older, 51.4%, hold at least a bachelor’s degree.

3. San Francisco-Oakland-Hayward, CA
> Median annual wage: $61,790
> Apr. 2021 unemployment rate: 6.1%
> Poverty rate: 8.2%
Jobs in the San Francisco metro area have a median annual wage of $61,790, third highest in the country. Area wages grew much faster than they did on average nationwide, increasing by nearly 23% from 2015 to 2020 compared to the nationwide increase of 15.9%. Likely due in part to the high wages, the area’s employment growth has far outpaced the growth nationwide. The number of workers in the area increased by 6.6% from 2015 to 2020, compared to 0.9% growth nationwide during that same period.
The relatively high wages in the San Francisco area are offset by the highest cost of living of anywhere in the country. Prices of goods and services are 34.5% higher than they are on average nationwide. Most homes in the area are valued at over $940,000 — $700,000 higher than the typical American home.
[in-text-ad-2]

2. California-Lexington Park, MD
> Median annual wage: $63,750
> Apr. 2021 unemployment rate: 4.2%
> Poverty rate: 7.3%
The California-Lexington Park metro area in the southern part of Maryland has the second highest paying jobs of any U.S. metro area, with the typical worker earning $63,750 annually. It is one of the smallest areas on this list, with just over 45,000 total workers in 2020. The area is within commuting distance to Washington, D.C., and there are a number of government contractors like Northrop Grumman in the area, which offer high-paying jobs like aerospace engineering. More than 2.1% of the area’s workforce is employed as aerospace engineers — a share that is more than 48 times higher than the percentage of aerospace engineers in the U.S. workforce.
The Lexington Park metro area stands out from the others on this list for a number of other reasons. Its cost of living is actually 3.6% lower than the average cost of living nationwide. It is also the only one on the list to have a lower bachelor’s degree attainment rate. Just 30.7% of adults in the area 25 and older have at least a bachelor’s degree, compared to 33.1% of all American adults that age.
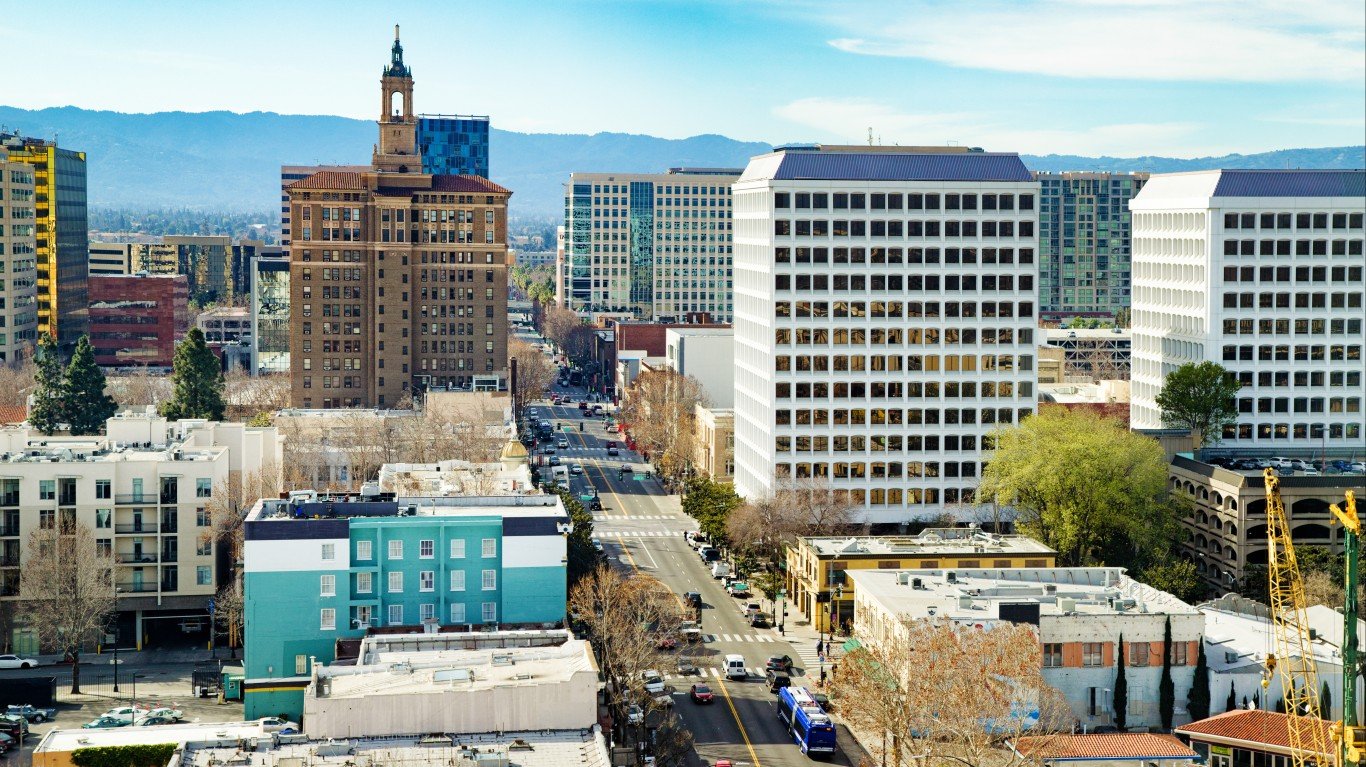
1. San Jose-Sunnyvale-Santa Clara, CA
> Median annual wage: $69,620
> Apr. 2021 unemployment rate: 5.3%
> Poverty rate: 6.3%
The San Jose-Sunnyvale-Santa Clara metro area of California, just south of the San Francisco Bay, has by far the highest paying jobs of any metro area in America, with the typical worker earning $69,620 annually — over $5,000 more than in any other area. The area spans a large part of Silicon Valley, which is famous for tech jobs. Of the 25 cities with the highest paying jobs, the San Jose area is the only one in which computer and mathematical occupations ranks as the largest job sector.
The San Jose area has the second highest cost of living, with goods and services 26.7% more expensive than they are on average nationwide. It also has a median home value of $1,116,400 — more than four times higher than the U.S. median and the only metro area in which most homes are valued at over $1 million.
Methodology
To determine the cities with the highest paying jobs, 24/7 Wall St. reviewed data on median wage for 389 metropolitan statistical areas from the U.S. Bureau of Labor Statistics Occupational Employment and Wage Statistics program. Metropolitan areas were ranked based on the median annual wage for all occupations as of May 2020. Data on employment and location quotient, used to determine the relative concentration of a job within a metro area, also came from the BLS OEWS. Supplemental data on regional price parity, a measure of cost of living, came from the Bureau of Economic Analysis and is for 2019. Poverty rate figures came from the U.S. Census Bureau’s 2019 American Community Survey and are one-year estimates.
Contact [email protected] for any questions or corrections.