U.S. gun sales in the first seven months of 2021 surged 13% to 25,125,896 from the same seven months last year. This makes it the largest first seven months of the year figure since sales were first recorded in 1998. Illinois, the state with the most gun sales through the first seven months, accounted for nearly 27% of total sales.
The increase is part of a trend. Sales of guns in the United States rose 40% last year to 39,695,315 — setting yet another high-water mark in annual gun sales since the current record keeping system went into effect. Increases by state in July and for the first seven months varied substantially, as has been the case for years. Gun violence also varies by state. Here are the states with the most gun violence.
The Federal Bureau of Investigation tracks background checks and publishes a list of how many are handled as part of its National Instant Criminal Background Check System. Each month, the figures are reported by state. Nearly everyone put through this system qualifies as a buyer. People who are excluded usually have criminal records. Of the more than 350 million checks that have been handled since 1998, there have only been 2 million denials. Therefore, the data is the best proxy for U.S. gun sales available.
The New York Times points out that pandemic gun sales are largely over. While people who already own guns have been buying more, there is a new group of buyers. “New preliminary data from Northeastern University and the Harvard Injury Control Research Center show that about a fifth of all Americans who bought guns last year were first-time gun owners.” More of these buyers are people of color and women.
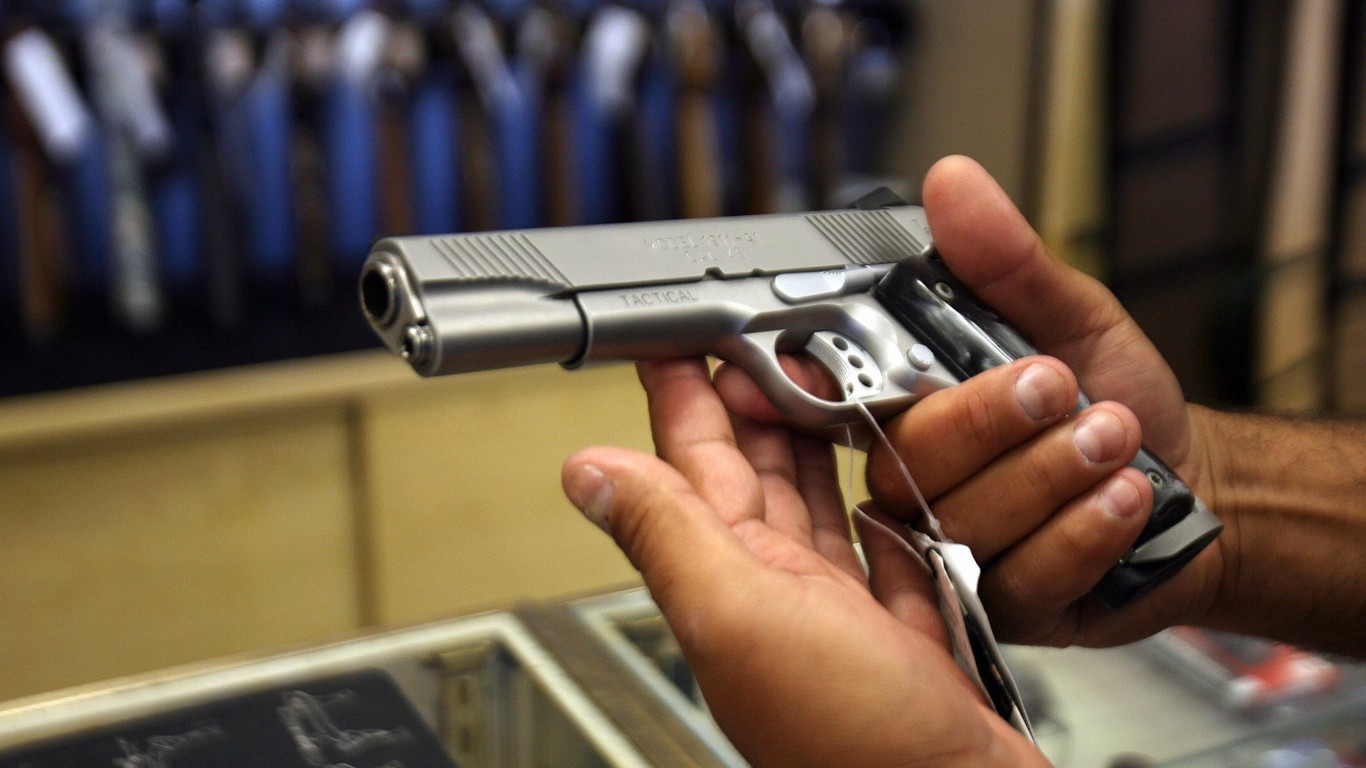
NPR commented on another trend: “Most often, the first-timers are purchasing a semiautomatic handgun, outpacing the second-most-purchased firearm, shotguns, by 2 to 1, according to NSSF [National Shooting Sports Foundation].” Some states, however, have more strict regulations about the type of gun, license, and background checks required. Here are the states with the best and worst gun laws.
Growing civil unrest may have prompted people to buy guns for personal and family protection, many social scientists have posited, although this remains a matter of debate. Another theory is that chaos brought on by the COVID-19 pandemic was a major cause. A UC Davis School of Medicine study about fear of violence reports: “The coronavirus pandemic has exacerbated persistent structural, economic, and social inequities in the conditions that contribute to violence and its consequences.”
The gun sales increases in July and first seven months of 2021 should not be taken as unusual, nor should the rise in sales from 2019 to 2020 be viewed as an anomaly. Gun sales have increased most years since 1999. Annual sales first topped 25 million in 2016, 20 million in 2013, 15 million in 2011 and 10 million in 2006. In 1999, the first full year the FBI kept data, sales totaled 9,138,123.
The state with the most gun sales through the first seven months was Illinois at 6,707,482. The state has only 4% of the population but accounted for 27% of gun sales for the period. In second place, Kentucky reported 1,984,388 sales in the first seven months of 2021. That is over 7% of the guns sold nationwide, even though the state has only 1.3% of the U.S. population. Still, Illinois and Kentucky are not among the top 10 most dangerous cities in the country.
Here are 2021 gun sales by state, including the District of Columbia and some territories.
To determine how many guns are purchased in every state, 24/7 Wall St. reviewed firearm registrations in every state between Jan. 1, 2019 and July 31, 2021 from The National Instant Criminal Background Check System (NICS).
The background check data is widely used as the best available proxy for gun sales, but checks and sales are not equal. According to the NICS: “These statistics represent the number of firearm background checks initiated through the NICS. They do not represent the number of firearms sold. Based on varying state laws and purchase scenarios, a one-to-one correlation cannot be made between a firearm background check and a firearm sale.”
We also examined 2019 firearm-related deaths data from the Centers for Disease Control and Prevention.

50. Hawaii
> Firearm background checks YTD, July 2021: 6.9 for every 1,000 people
> Firearm background checks YTD, July 2021: 9,761– the fewest
> Firearm background checks in 2020: 20,102– the fewest
> Firearm background checks in 2019: 12,666– the fewest
> YoY change from 2019 to 2020: +58.7% — 15th highest
> Firearm deaths in 2019: 3.9 for every 100,000 people — 2nd fewest
[in-text-ad]

49. Rhode Island
> Firearm background checks YTD, July 2021: 23.8 for every 1,000 people
> Firearm background checks YTD, July 2021: 25,261– 2nd fewest
> Firearm background checks in 2020: 51,369– 2nd fewest
> Firearm background checks in 2019: 24,338– 2nd fewest
> YoY change from 2019 to 2020: +111.1% — 2nd highest
> Firearm deaths in 2019: 4.2 for every 100,000 people — 5th fewest
[recirclink id=905365]

48. Vermont
> Firearm background checks YTD, July 2021: 50.2 for every 1,000 people
> Firearm background checks YTD, July 2021: 31,340– 3rd fewest
> Firearm background checks in 2020: 57,965– 3rd fewest
> Firearm background checks in 2019: 35,843– 3rd fewest
> YoY change from 2019 to 2020: +61.7% — 12th highest
> Firearm deaths in 2019: 9.5 for every 100,000 people — 11th fewest

47. Delaware
> Firearm background checks YTD, July 2021: 44.1 for every 1,000 people
> Firearm background checks YTD, July 2021: 42,905– 4th fewest
> Firearm background checks in 2020: 77,057– 4th fewest
> Firearm background checks in 2019: 46,427– 4th fewest
> YoY change from 2019 to 2020: +66.0% — 10th highest
> Firearm deaths in 2019: 9.2 for every 100,000 people — 10th fewest
[in-text-ad-2]

46. North Dakota
> Firearm background checks YTD, July 2021: 62.8 for every 1,000 people
> Firearm background checks YTD, July 2021: 47,856– 5th fewest
> Firearm background checks in 2020: 85,465– 5th fewest
> Firearm background checks in 2019: 60,389– 5th fewest
> YoY change from 2019 to 2020: +41.5% — 14th lowest
> Firearm deaths in 2019: 11.7 for every 100,000 people — 17th fewest
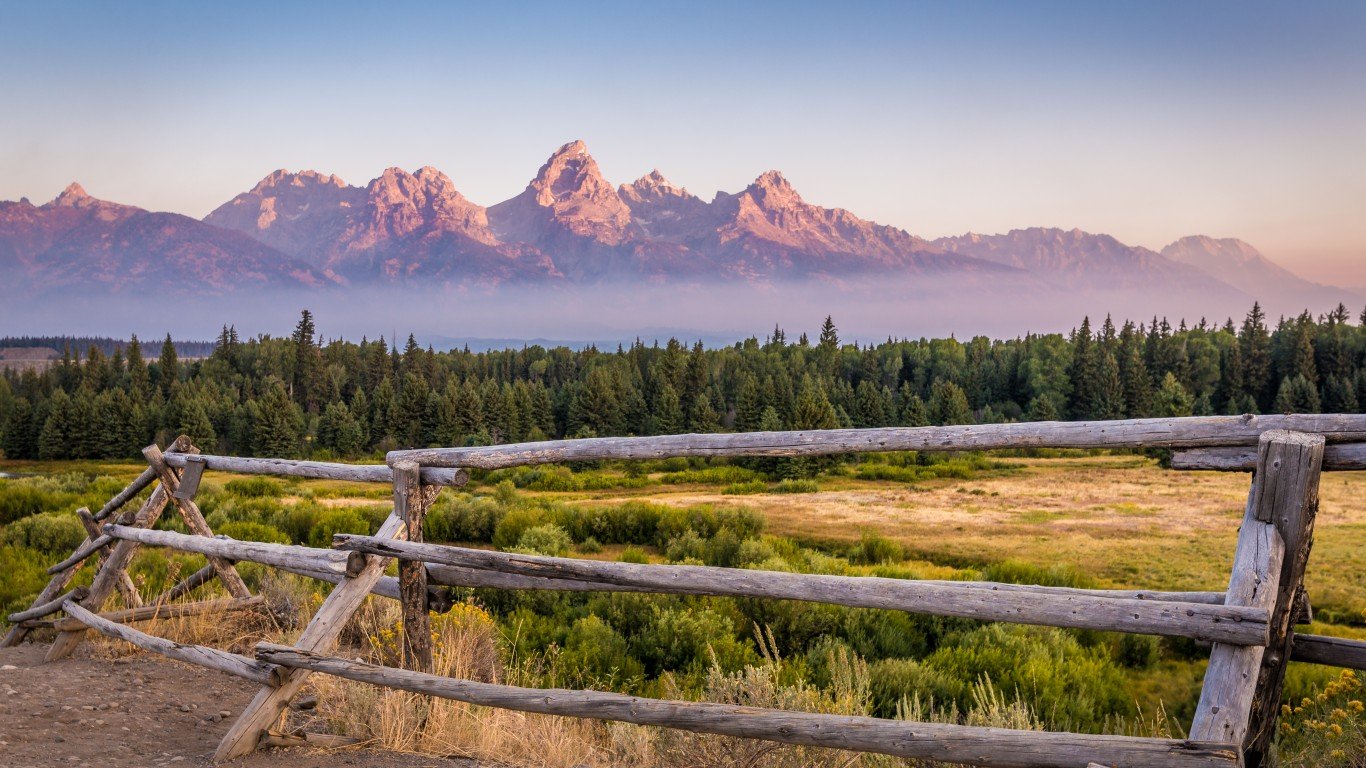
45. Wyoming
> Firearm background checks YTD, July 2021: 88.0 for every 1,000 people
> Firearm background checks YTD, July 2021: 50,907– 6th fewest
> Firearm background checks in 2020: 91,384– 6th fewest
> Firearm background checks in 2019: 61,291– 6th fewest
> YoY change from 2019 to 2020: +49.1% — 23rd lowest
> Firearm deaths in 2019: 22.5 for every 100,000 people — 3rd most
[in-text-ad]
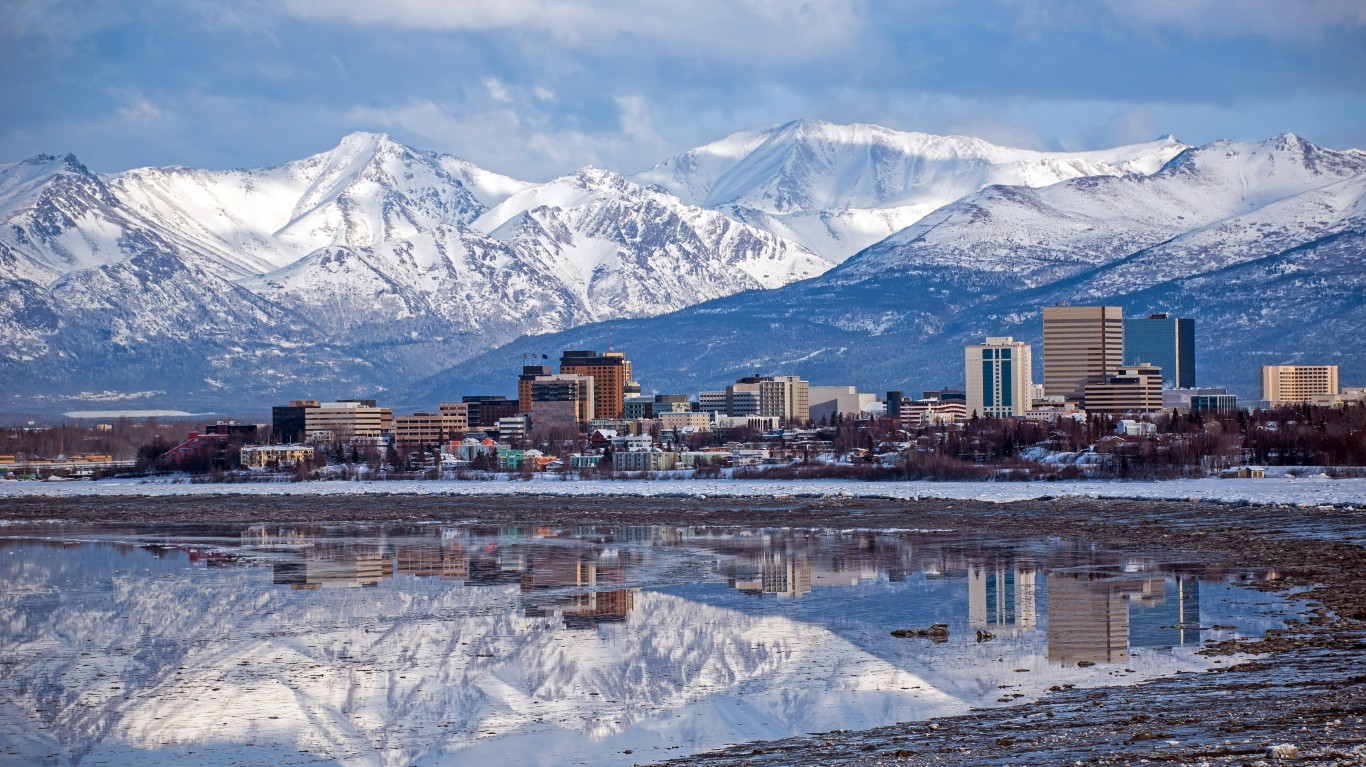
44. Alaska
> Firearm background checks YTD, July 2021: 75.3 for every 1,000 people
> Firearm background checks YTD, July 2021: 55,113– 7th fewest
> Firearm background checks in 2020: 98,952– 7th fewest
> Firearm background checks in 2019: 76,923– 8th fewest
> YoY change from 2019 to 2020: +28.6% — 4th lowest
> Firearm deaths in 2019: 23.0 for every 100,000 people — 2nd most
[recirclink id=824344]
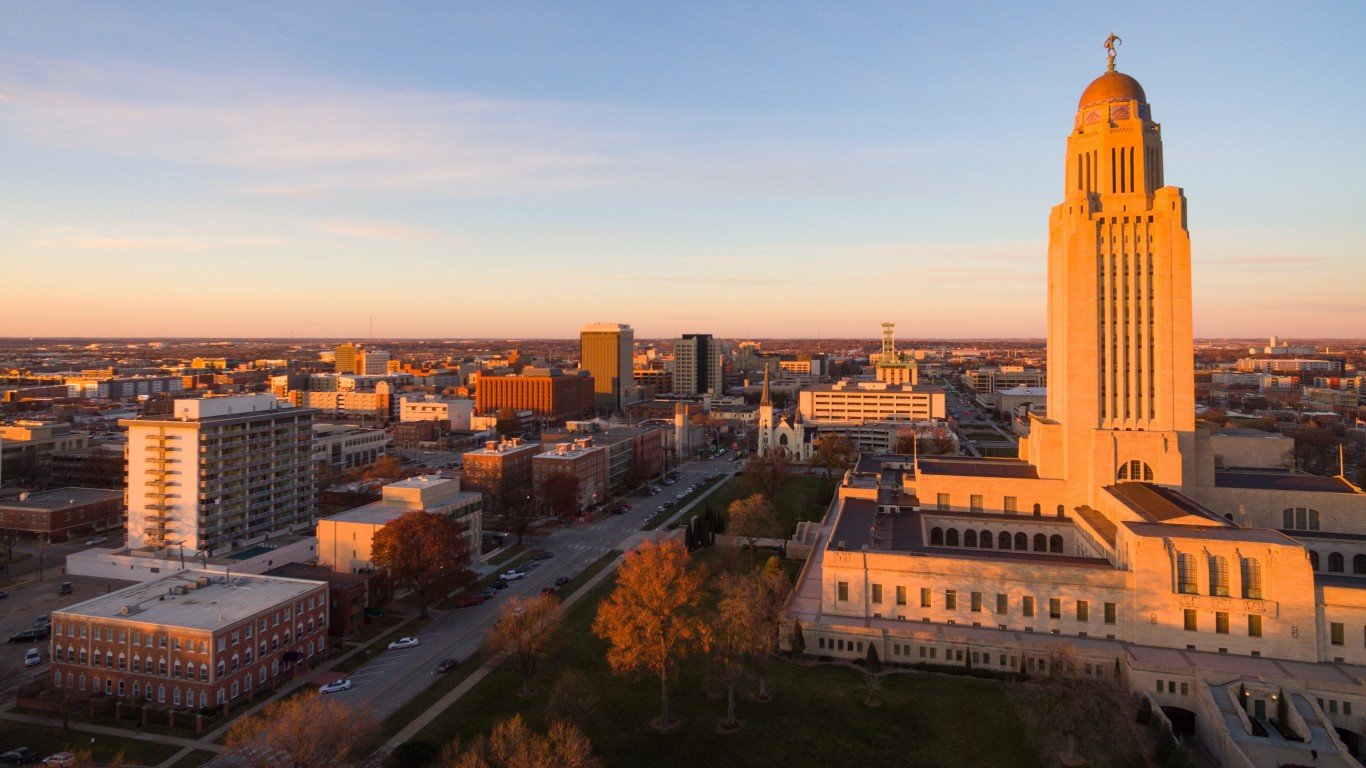
43. Nebraska
> Firearm background checks YTD, July 2021: 28.8 for every 1,000 people
> Firearm background checks YTD, July 2021: 55,731– 8th fewest
> Firearm background checks in 2020: 104,511– 8th fewest
> Firearm background checks in 2019: 68,236– 7th fewest
> YoY change from 2019 to 2020: +53.2% — 21st highest
> Firearm deaths in 2019: 10.0 for every 100,000 people — 12th fewest
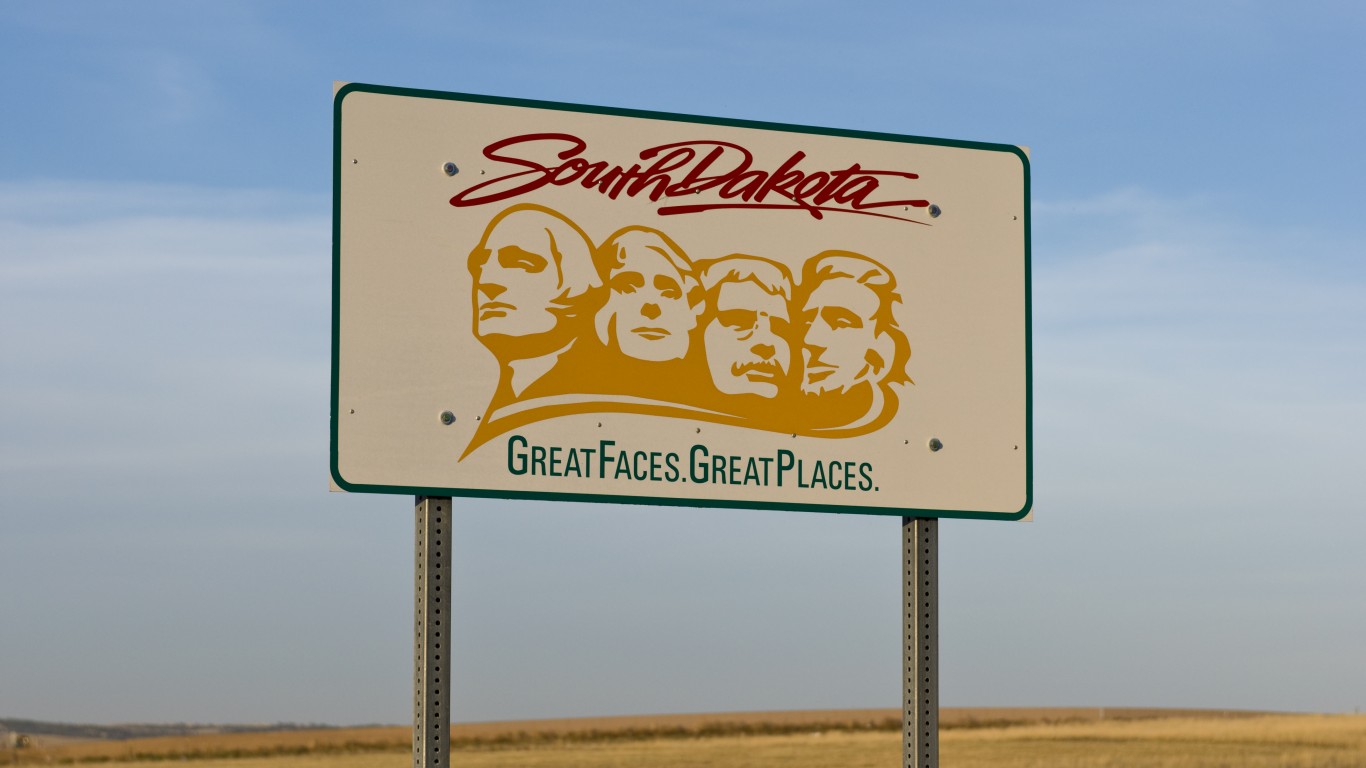
42. South Dakota
> Firearm background checks YTD, July 2021: 72.0 for every 1,000 people
> Firearm background checks YTD, July 2021: 63,717– 9th fewest
> Firearm background checks in 2020: 115,448– 9th fewest
> Firearm background checks in 2019: 85,426– 9th fewest
> YoY change from 2019 to 2020: +35.1% — 12th lowest
> Firearm deaths in 2019: 12.3 for every 100,000 people — 23rd fewest
[in-text-ad-2]

41. Maine
> Firearm background checks YTD, July 2021: 55.1 for every 1,000 people
> Firearm background checks YTD, July 2021: 74,104– 10th fewest
> Firearm background checks in 2020: 137,149– 10th fewest
> Firearm background checks in 2019: 90,626– 10th fewest
> YoY change from 2019 to 2020: +51.3% — 24th highest
> Firearm deaths in 2019: 11.7 for every 100,000 people — 18th fewest

40. New Hampshire
> Firearm background checks YTD, July 2021: 69.7 for every 1,000 people
> Firearm background checks YTD, July 2021: 94,727– 11th fewest
> Firearm background checks in 2020: 174,662– 12th fewest
> Firearm background checks in 2019: 112,173– 12th fewest
> YoY change from 2019 to 2020: +55.7% — 18th highest
> Firearm deaths in 2019: 11.2 for every 100,000 people — 16th fewest
[in-text-ad]
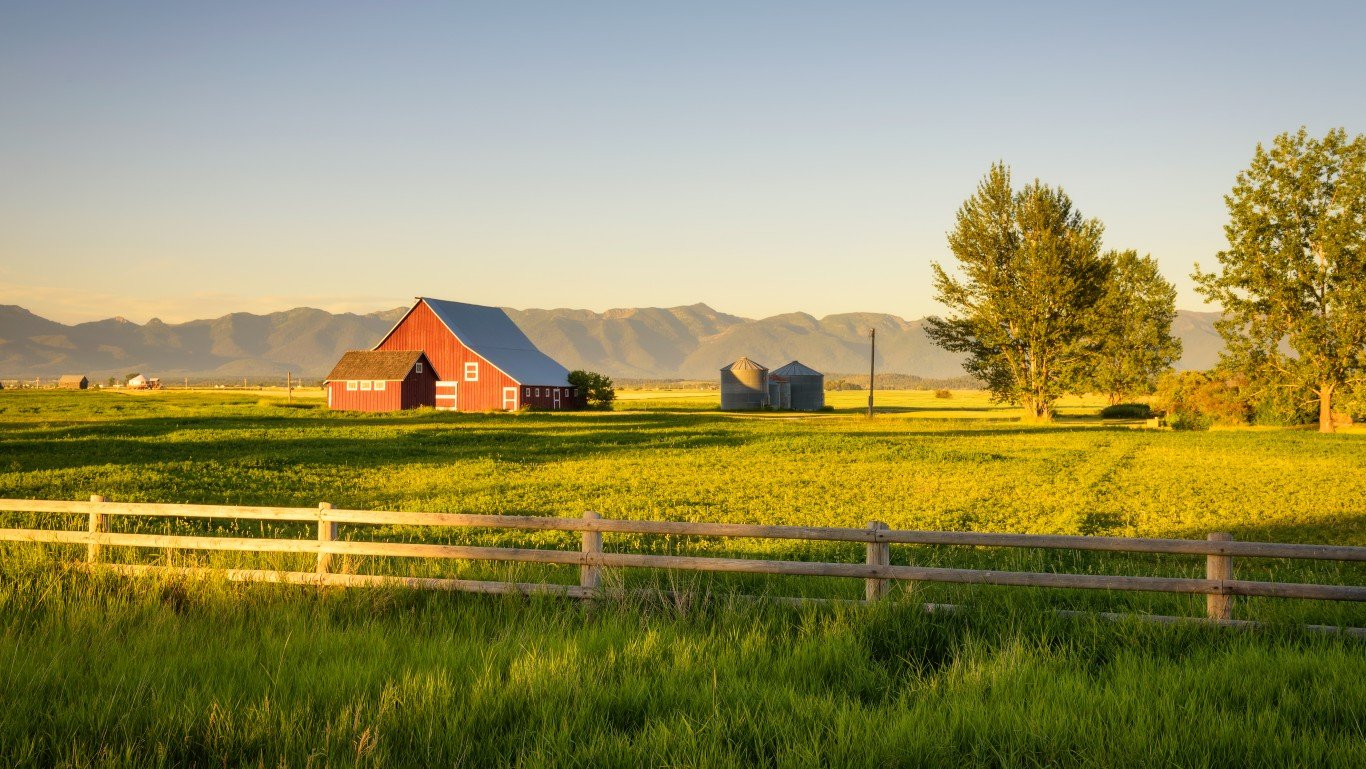
39. Montana
> Firearm background checks YTD, July 2021: 89.2 for every 1,000 people
> Firearm background checks YTD, July 2021: 95,347– 12th fewest
> Firearm background checks in 2020: 172,695– 11th fewest
> Firearm background checks in 2019: 115,823– 13th fewest
> YoY change from 2019 to 2020: +49.1% — 24th lowest
> Firearm deaths in 2019: 18.3 for every 100,000 people — 11th most
[recirclink id=889678]

38. Nevada
> Firearm background checks YTD, July 2021: 38.5 for every 1,000 people
> Firearm background checks YTD, July 2021: 118,543– 13th fewest
> Firearm background checks in 2020: 219,349– 16th fewest
> Firearm background checks in 2019: 128,312– 14th fewest
> YoY change from 2019 to 2020: +70.9% — 6th highest
> Firearm deaths in 2019: 15.7 for every 100,000 people — 15th most

37. New Mexico
> Firearm background checks YTD, July 2021: 57.1 for every 1,000 people
> Firearm background checks YTD, July 2021: 119,756– 14th fewest
> Firearm background checks in 2020: 206,252– 14th fewest
> Firearm background checks in 2019: 156,829– 16th fewest
> YoY change from 2019 to 2020: +31.5% — 9th lowest
> Firearm deaths in 2019: 21.8 for every 100,000 people — 5th most
[in-text-ad-2]
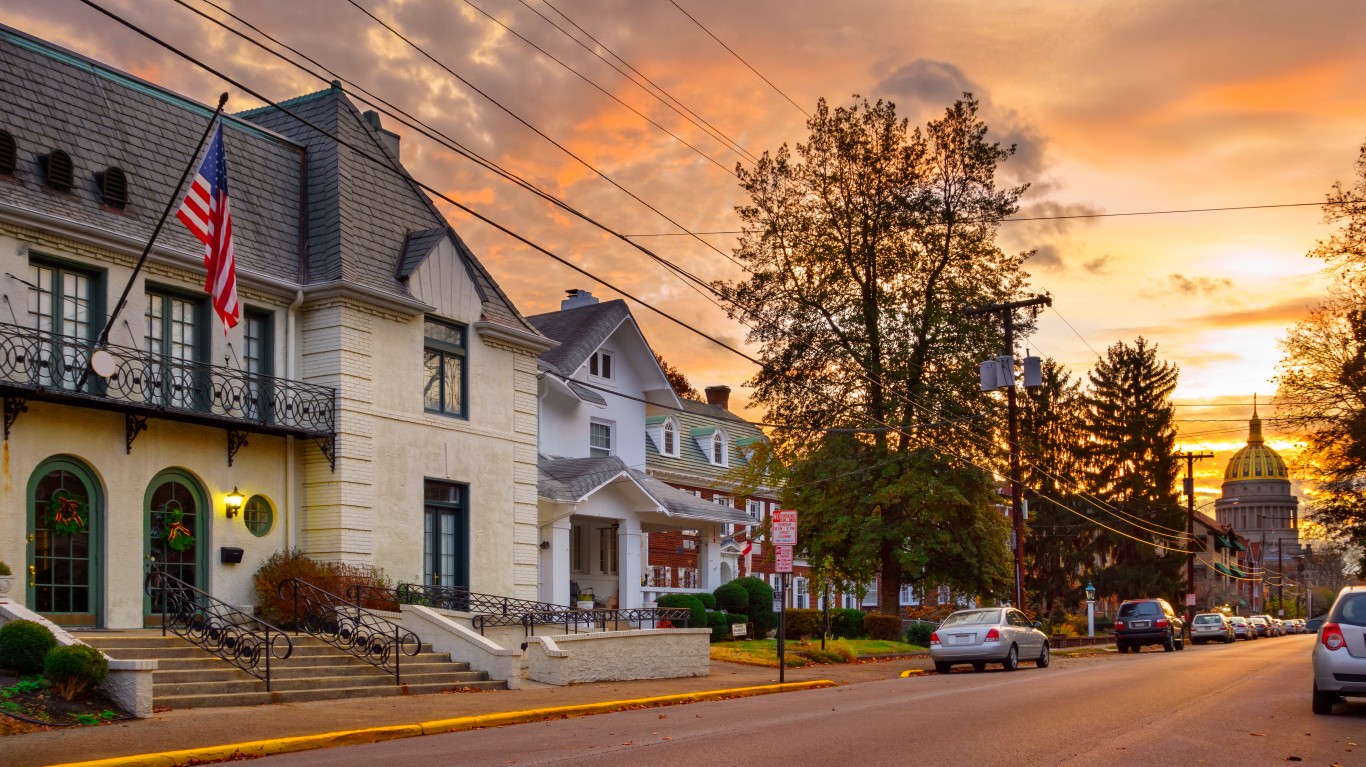
36. West Virginia
> Firearm background checks YTD, July 2021: 74.9 for every 1,000 people
> Firearm background checks YTD, July 2021: 134,231– 15th fewest
> Firearm background checks in 2020: 265,705– 19th fewest
> Firearm background checks in 2019: 206,196– 20th fewest
> YoY change from 2019 to 2020: +28.9% — 6th lowest
> Firearm deaths in 2019: 16.0 for every 100,000 people — 14th most

35. Kansas
> Firearm background checks YTD, July 2021: 47.2 for every 1,000 people
> Firearm background checks YTD, July 2021: 137,411– 16th fewest
> Firearm background checks in 2020: 249,589– 17th fewest
> Firearm background checks in 2019: 167,010– 17th fewest
> YoY change from 2019 to 2020: +49.4% — 25th lowest
> Firearm deaths in 2019: 13.4 for every 100,000 people — 22nd most
[in-text-ad]
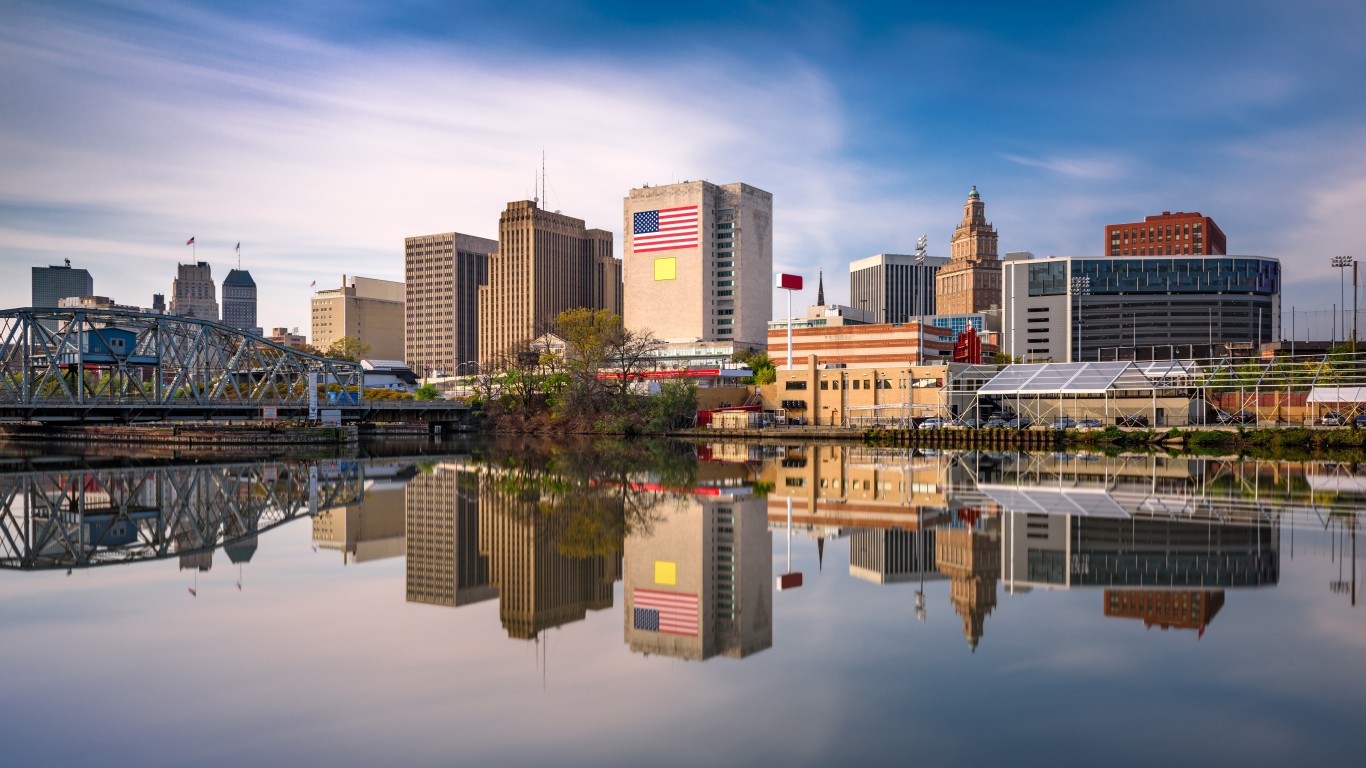
34. New Jersey
> Firearm background checks YTD, July 2021: 17.0 for every 1,000 people
> Firearm background checks YTD, July 2021: 151,141– 17th fewest
> Firearm background checks in 2020: 177,901– 13th fewest
> Firearm background checks in 2019: 91,257– 11th fewest
> YoY change from 2019 to 2020: +94.9% — 4th highest
> Firearm deaths in 2019: 4.1 for every 100,000 people — 4th fewest
[recirclink id=835517]

33. Massachusetts
> Firearm background checks YTD, July 2021: 23.7 for every 1,000 people
> Firearm background checks YTD, July 2021: 163,387– 18th fewest
> Firearm background checks in 2020: 262,583– 18th fewest
> Firearm background checks in 2019: 212,316– 22nd fewest
> YoY change from 2019 to 2020: +23.7% — 2nd lowest
> Firearm deaths in 2019: 3.4 for every 100,000 people — the fewest

32. Idaho
> Firearm background checks YTD, July 2021: 93.7 for every 1,000 people
> Firearm background checks YTD, July 2021: 167,472– 19th fewest
> Firearm background checks in 2020: 281,284– 21st fewest
> Firearm background checks in 2019: 209,275– 21st fewest
> YoY change from 2019 to 2020: +34.4% — 11th lowest
> Firearm deaths in 2019: 13.5 for every 100,000 people — 21st most
[in-text-ad-2]

31. Maryland
> Firearm background checks YTD, July 2021: 28.1 for every 1,000 people
> Firearm background checks YTD, July 2021: 170,047– 20th fewest
> Firearm background checks in 2020: 302,563– 22nd fewest
> Firearm background checks in 2019: 148,813– 15th fewest
> YoY change from 2019 to 2020: +103.3% — 3rd highest
> Firearm deaths in 2019: 12.5 for every 100,000 people — 24th fewest

30. Arkansas
> Firearm background checks YTD, July 2021: 57.7 for every 1,000 people
> Firearm background checks YTD, July 2021: 173,978– 21st fewest
> Firearm background checks in 2020: 324,741– 23rd fewest
> Firearm background checks in 2019: 221,344– 23rd fewest
> YoY change from 2019 to 2020: +46.7% — 19th lowest
> Firearm deaths in 2019: 18.7 for every 100,000 people — 9th most
[in-text-ad]

29. Iowa
> Firearm background checks YTD, July 2021: 55.3 for every 1,000 people
> Firearm background checks YTD, July 2021: 174,518– 22nd fewest
> Firearm background checks in 2020: 270,614– 20th fewest
> Firearm background checks in 2019: 182,802– 19th fewest
> YoY change from 2019 to 2020: +48.0% — 22nd lowest
> Firearm deaths in 2019: 8.9 for every 100,000 people — 9th fewest
[recirclink id=905365]

28. Connecticut
> Firearm background checks YTD, July 2021: 50.6 for every 1,000 people
> Firearm background checks YTD, July 2021: 180,514– 23rd fewest
> Firearm background checks in 2020: 219,227– 15th fewest
> Firearm background checks in 2019: 172,935– 18th fewest
> YoY change from 2019 to 2020: +26.8% — 3rd lowest
> Firearm deaths in 2019: 5.1 for every 100,000 people — 6th fewest

27. Mississippi
> Firearm background checks YTD, July 2021: 63.2 for every 1,000 people
> Firearm background checks YTD, July 2021: 188,058– 24th fewest
> Firearm background checks in 2020: 366,829– 24th fewest
> Firearm background checks in 2019: 238,388– 24th fewest
> YoY change from 2019 to 2020: +53.9% — 20th highest
> Firearm deaths in 2019: 23.7 for every 100,000 people — the most
[in-text-ad-2]
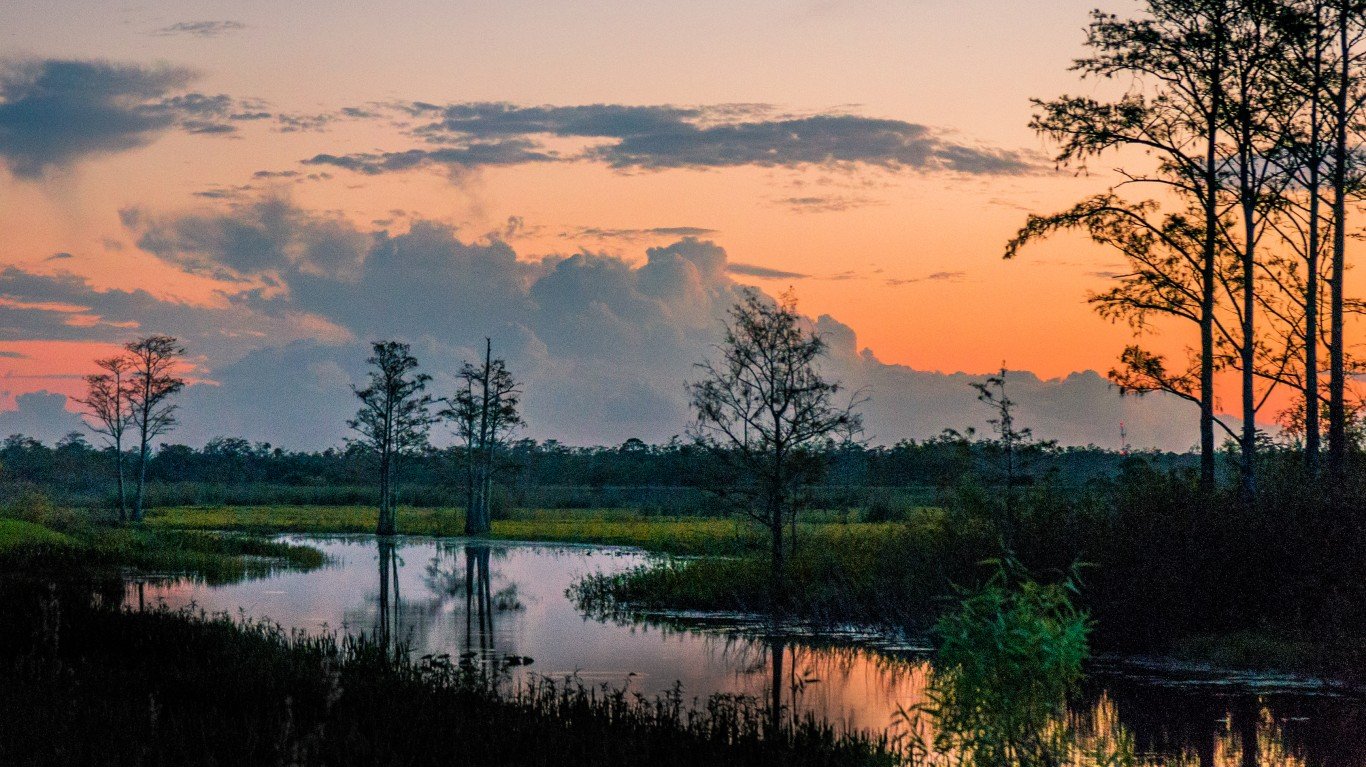
26. Louisiana
> Firearm background checks YTD, July 2021: 52.0 for every 1,000 people
> Firearm background checks YTD, July 2021: 241,517– 25th fewest
> Firearm background checks in 2020: 430,537– 25th fewest
> Firearm background checks in 2019: 282,264– 25th fewest
> YoY change from 2019 to 2020: +52.5% — 23rd highest
> Firearm deaths in 2019: 21.5 for every 100,000 people — 6th most

25. Oklahoma
> Firearm background checks YTD, July 2021: 63.1 for every 1,000 people
> Firearm background checks YTD, July 2021: 249,508– 25th most
> Firearm background checks in 2020: 470,286– 25th most
> Firearm background checks in 2019: 360,043– 22nd most
> YoY change from 2019 to 2020: +30.6% — 8th lowest
> Firearm deaths in 2019: 18.2 for every 100,000 people — 12th most
[in-text-ad]

24. Oregon
> Firearm background checks YTD, July 2021: 65.2 for every 1,000 people
> Firearm background checks YTD, July 2021: 275,189– 24th most
> Firearm background checks in 2020: 516,096– 23rd most
> Firearm background checks in 2019: 357,700– 23rd most
> YoY change from 2019 to 2020: +44.3% — 17th lowest
> Firearm deaths in 2019: 13.2 for every 100,000 people — 25th most
[recirclink id=824344]

23. New York
> Firearm background checks YTD, July 2021: 14.3 for every 1,000 people
> Firearm background checks YTD, July 2021: 278,258– 23rd most
> Firearm background checks in 2020: 507,940– 24th most
> Firearm background checks in 2019: 355,374– 24th most
> YoY change from 2019 to 2020: +42.9% — 16th lowest
> Firearm deaths in 2019: 4.1 for every 100,000 people — 3rd fewest

22. South Carolina
> Firearm background checks YTD, July 2021: 58.2 for every 1,000 people
> Firearm background checks YTD, July 2021: 299,794– 22nd most
> Firearm background checks in 2020: 530,930– 22nd most
> Firearm background checks in 2019: 328,221– 25th most
> YoY change from 2019 to 2020: +61.8% — 11th highest
> Firearm deaths in 2019: 19.4 for every 100,000 people — 8th most
[in-text-ad-2]

21. Arizona
> Firearm background checks YTD, July 2021: 49.6 for every 1,000 people
> Firearm background checks YTD, July 2021: 360,924– 21st most
> Firearm background checks in 2020: 665,458– 21st most
> Firearm background checks in 2019: 372,912– 21st most
> YoY change from 2019 to 2020: +78.4% — 5th highest
> Firearm deaths in 2019: 15.6 for every 100,000 people — 16th most

20. Colorado
> Firearm background checks YTD, July 2021: 67.0 for every 1,000 people
> Firearm background checks YTD, July 2021: 386,038– 20th most
> Firearm background checks in 2020: 680,507– 20th most
> Firearm background checks in 2019: 469,535– 19th most
> YoY change from 2019 to 2020: +44.9% — 18th lowest
> Firearm deaths in 2019: 14.4 for every 100,000 people — 18th most
[in-text-ad]

19. Missouri
> Firearm background checks YTD, July 2021: 63.2 for every 1,000 people
> Firearm background checks YTD, July 2021: 387,999– 19th most
> Firearm background checks in 2020: 708,184– 19th most
> Firearm background checks in 2019: 497,858– 17th most
> YoY change from 2019 to 2020: +42.2% — 15th lowest
> Firearm deaths in 2019: 20.2 for every 100,000 people — 7th most
[recirclink id=889678]

18. Virginia
> Firearm background checks YTD, July 2021: 46.6 for every 1,000 people
> Firearm background checks YTD, July 2021: 397,518– 18th most
> Firearm background checks in 2020: 823,513– 16th most
> Firearm background checks in 2019: 512,766– 16th most
> YoY change from 2019 to 2020: +60.6% — 13th highest
> Firearm deaths in 2019: 11.9 for every 100,000 people — 20th fewest

17. Washington
> Firearm background checks YTD, July 2021: 57.6 for every 1,000 people
> Firearm background checks YTD, July 2021: 438,343– 17th most
> Firearm background checks in 2020: 781,471– 17th most
> Firearm background checks in 2019: 607,170– 13th most
> YoY change from 2019 to 2020: +28.7% — 5th lowest
> Firearm deaths in 2019: 10.9 for every 100,000 people — 15th fewest
[in-text-ad-2]
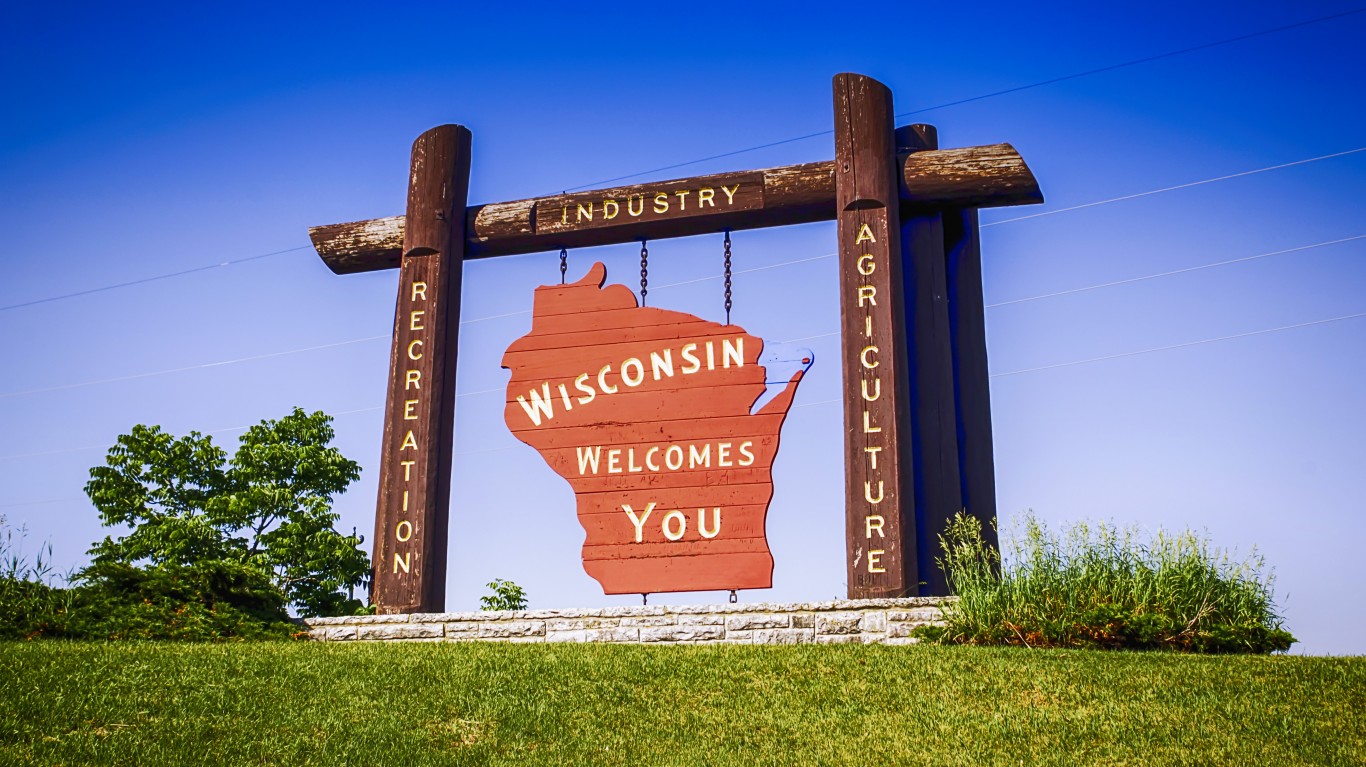
16. Wisconsin
> Firearm background checks YTD, July 2021: 78.2 for every 1,000 people
> Firearm background checks YTD, July 2021: 455,437– 16th most
> Firearm background checks in 2020: 731,618– 18th most
> Firearm background checks in 2019: 435,685– 20th most
> YoY change from 2019 to 2020: +67.9% — 7th highest
> Firearm deaths in 2019: 10.2 for every 100,000 people — 13th fewest

15. North Carolina
> Firearm background checks YTD, July 2021: 47.4 for every 1,000 people
> Firearm background checks YTD, July 2021: 497,299– 15th most
> Firearm background checks in 2020: 890,284– 15th most
> Firearm background checks in 2019: 530,365– 15th most
> YoY change from 2019 to 2020: +67.9% — 8th highest
> Firearm deaths in 2019: 13.3 for every 100,000 people — 24th most
[in-text-ad]

14. Georgia
> Firearm background checks YTD, July 2021: 48.9 for every 1,000 people
> Firearm background checks YTD, July 2021: 519,142– 14th most
> Firearm background checks in 2020: 904,035– 14th most
> Firearm background checks in 2019: 539,113– 14th most
> YoY change from 2019 to 2020: +67.7% — 9th highest
> Firearm deaths in 2019: 16.0 for every 100,000 people — 13th most
[recirclink id=835517]
13. Ohio
> Firearm background checks YTD, July 2021: 45.4 for every 1,000 people
> Firearm background checks YTD, July 2021: 530,395– 13th most
> Firearm background checks in 2020: 976,751– 12th most
> Firearm background checks in 2019: 638,495– 11th most
> YoY change from 2019 to 2020: +53.0% — 22nd highest
> Firearm deaths in 2019: 13.5 for every 100,000 people — 20th most

12. Minnesota
> Firearm background checks YTD, July 2021: 100.9 for every 1,000 people
> Firearm background checks YTD, July 2021: 568,852– 12th most
> Firearm background checks in 2020: 958,391– 13th most
> Firearm background checks in 2019: 682,356– 10th most
> YoY change from 2019 to 2020: +40.5% — 13th lowest
> Firearm deaths in 2019: 8.2 for every 100,000 people — 8th fewest
[in-text-ad-2]

11. Alabama
> Firearm background checks YTD, July 2021: 118.6 for every 1,000 people
> Firearm background checks YTD, July 2021: 581,290– 11th most
> Firearm background checks in 2020: 1,085,475– 9th most
> Firearm background checks in 2019: 690,084– 9th most
> YoY change from 2019 to 2020: +57.3% — 16th highest
> Firearm deaths in 2019: 21.8 for every 100,000 people — 4th most

10. Tennessee
> Firearm background checks YTD, July 2021: 86.5 for every 1,000 people
> Firearm background checks YTD, July 2021: 590,497– 10th most
> Firearm background checks in 2020: 984,760– 11th most
> Firearm background checks in 2019: 635,313– 12th most
> YoY change from 2019 to 2020: +55.0% — 19th highest
> Firearm deaths in 2019: 18.6 for every 100,000 people — 10th most
[in-text-ad]
9. Michigan
> Firearm background checks YTD, July 2021: 61.1 for every 1,000 people
> Firearm background checks YTD, July 2021: 610,029– 9th most
> Firearm background checks in 2020: 1,068,511– 10th most
> Firearm background checks in 2019: 492,171– 18th most
> YoY change from 2019 to 2020: +117.1% — the highest
> Firearm deaths in 2019: 12.0 for every 100,000 people — 22nd fewest
[recirclink id=905365]

8. Utah
> Firearm background checks YTD, July 2021: 228.9 for every 1,000 people
> Firearm background checks YTD, July 2021: 733,790– 8th most
> Firearm background checks in 2020: 1,216,773– 8th most
> Firearm background checks in 2019: 823,270– 8th most
> YoY change from 2019 to 2020: +47.8% — 21st lowest
> Firearm deaths in 2019: 11.9 for every 100,000 people — 19th fewest
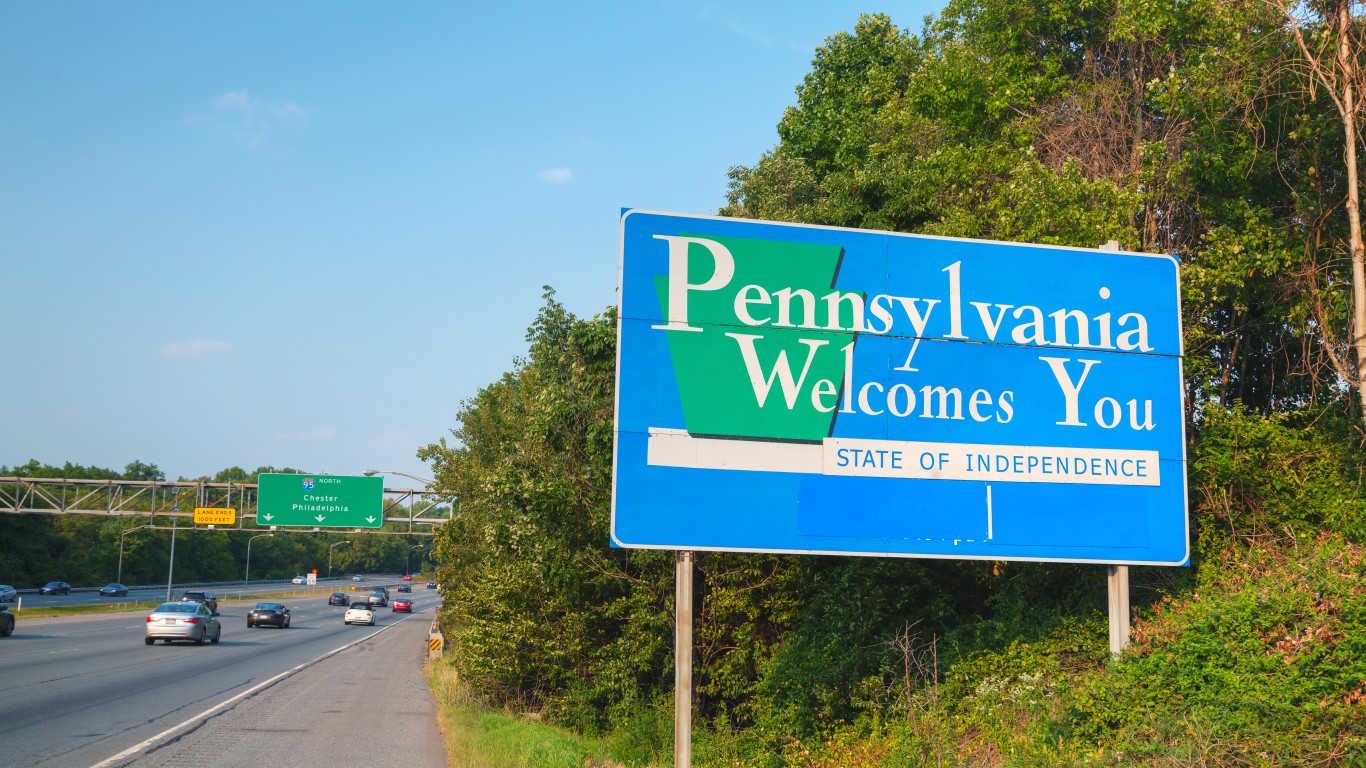
7. Pennsylvania
> Firearm background checks YTD, July 2021: 67.5 for every 1,000 people
> Firearm background checks YTD, July 2021: 863,914– 7th most
> Firearm background checks in 2020: 1,452,921– 7th most
> Firearm background checks in 2019: 987,886– 7th most
> YoY change from 2019 to 2020: +47.1% — 20th lowest
> Firearm deaths in 2019: 11.9 for every 100,000 people — 21st fewest
[in-text-ad-2]

6. California
> Firearm background checks YTD, July 2021: 22.4 for every 1,000 people
> Firearm background checks YTD, July 2021: 886,292– 6th most
> Firearm background checks in 2020: 1,601,054– 6th most
> Firearm background checks in 2019: 1,240,632– 5th most
> YoY change from 2019 to 2020: +29.1% — 7th lowest
> Firearm deaths in 2019: 7.5 for every 100,000 people — 7th fewest
5. Florida
> Firearm background checks YTD, July 2021: 49.3 for every 1,000 people
> Firearm background checks YTD, July 2021: 1,059,122– 5th most
> Firearm background checks in 2020: 1,912,204– 5th most
> Firearm background checks in 2019: 1,195,539– 6th most
> YoY change from 2019 to 2020: +59.9% — 14th highest
> Firearm deaths in 2019: 13.4 for every 100,000 people — 23rd most
[in-text-ad]

4. Texas
> Firearm background checks YTD, July 2021: 41.3 for every 1,000 people
> Firearm background checks YTD, July 2021: 1,197,967– 4th most
> Firearm background checks in 2020: 2,325,281– 3rd most
> Firearm background checks in 2019: 1,487,212– 3rd most
> YoY change from 2019 to 2020: +56.4% — 17th highest
> Firearm deaths in 2019: 12.7 for every 100,000 people — 25th fewest
[recirclink id=889678]

3. Indiana
> Firearm background checks YTD, July 2021: 184.8 for every 1,000 people
> Firearm background checks YTD, July 2021: 1,244,066– 3rd most
> Firearm background checks in 2020: 1,935,587– 4th most
> Firearm background checks in 2019: 1,450,565– 4th most
> YoY change from 2019 to 2020: +33.4% — 10th lowest
> Firearm deaths in 2019: 14.1 for every 100,000 people — 19th most
2. Kentucky
> Firearm background checks YTD, July 2021: 444.2 for every 1,000 people
> Firearm background checks YTD, July 2021: 1,984,388– 2nd most
> Firearm background checks in 2020: 3,330,462– 2nd most
> Firearm background checks in 2019: 4,120,892– 2nd most
> YoY change from 2019 to 2020: -19.2% — the lowest
> Firearm deaths in 2019: 14.9 for every 100,000 people — 17th most
[in-text-ad-2]
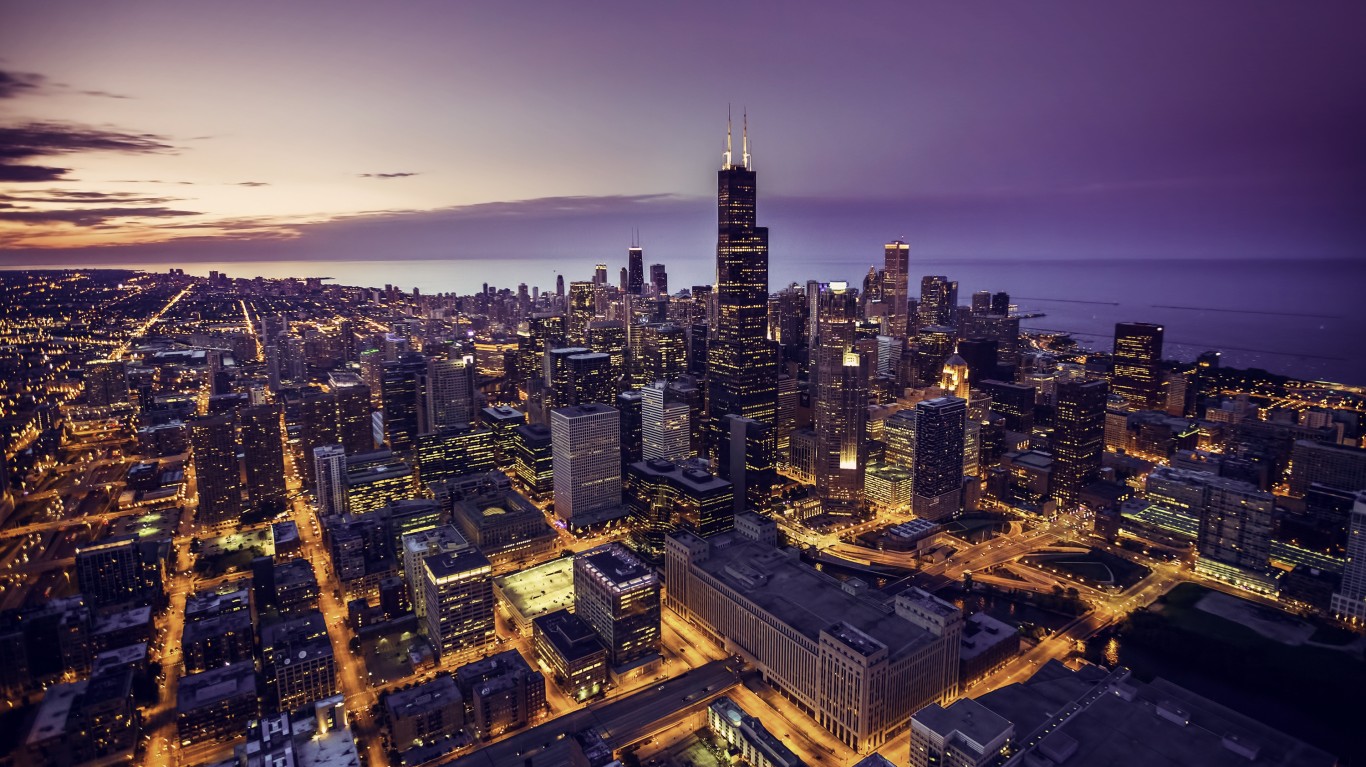
1. Illinois
> Firearm background checks YTD, July 2021: 529.3 for every 1,000 people
> Firearm background checks YTD, July 2021: 6,707,482– the most
> Firearm background checks in 2020: 7,455,065– the most
> Firearm background checks in 2019: 4,949,570– the most
> YoY change from 2019 to 2020: +50.6% — 25th highest
> Firearm deaths in 2019: 10.7 for every 100,000 people — 14th fewest
Contact [email protected] for any questions or corrections.