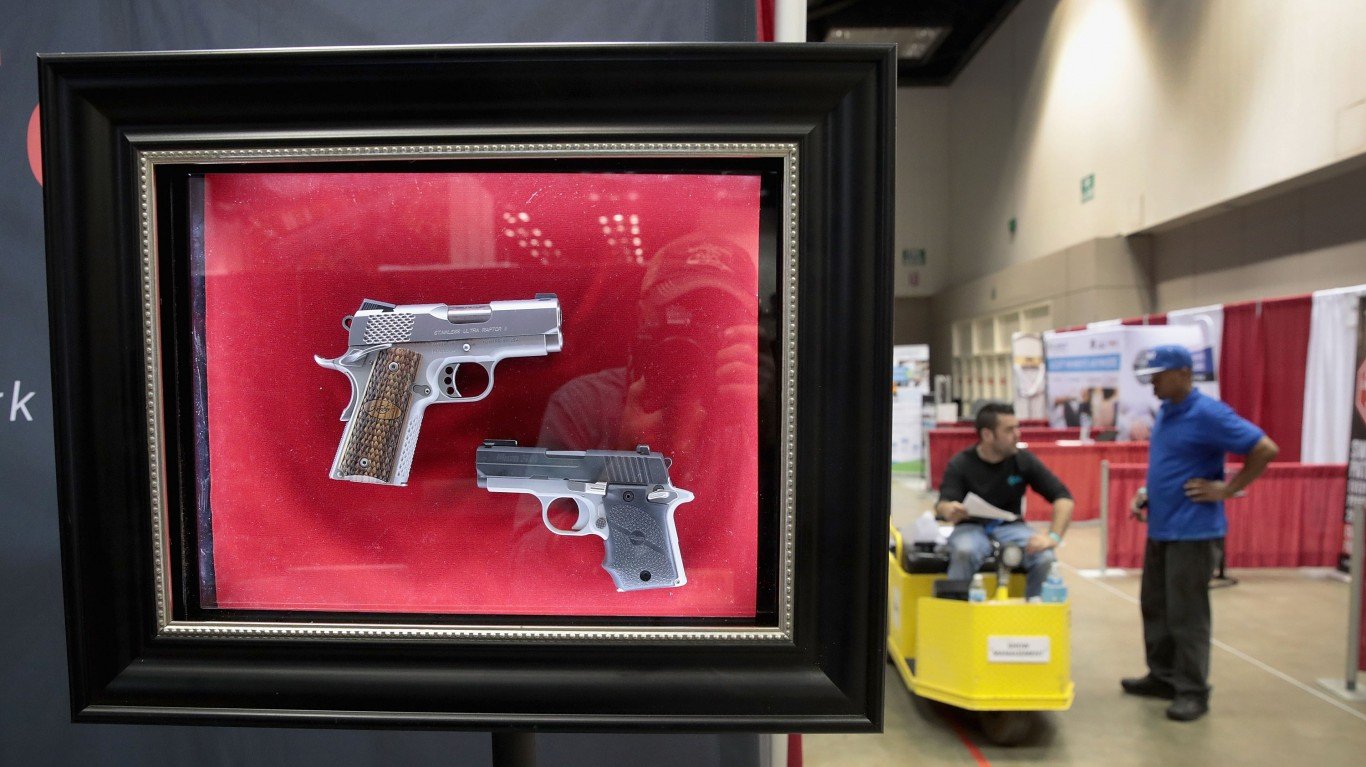
California Gov. Gavin Newsom’s proposed gun control amendment to the state constitution was introduced in August into the state legislature. The measure, called the Right to Safety Resolution, would raise the minimum age to buy a gun in the state from 18 to 21, establish a mandatory background check and waiting period for every gun purchase, and ban civilians from possessing assault-style weapons.
These changes, if passed, will likely suppress gun sales in a state where firearm purchases are already quite uncommon, at least when adjusting for population. In July, there were 2.4 firearm-related per 1,000 state residents in California, the seventh fewest among states. Firearm background checks are the best available approximation of gun sales in the U.S.
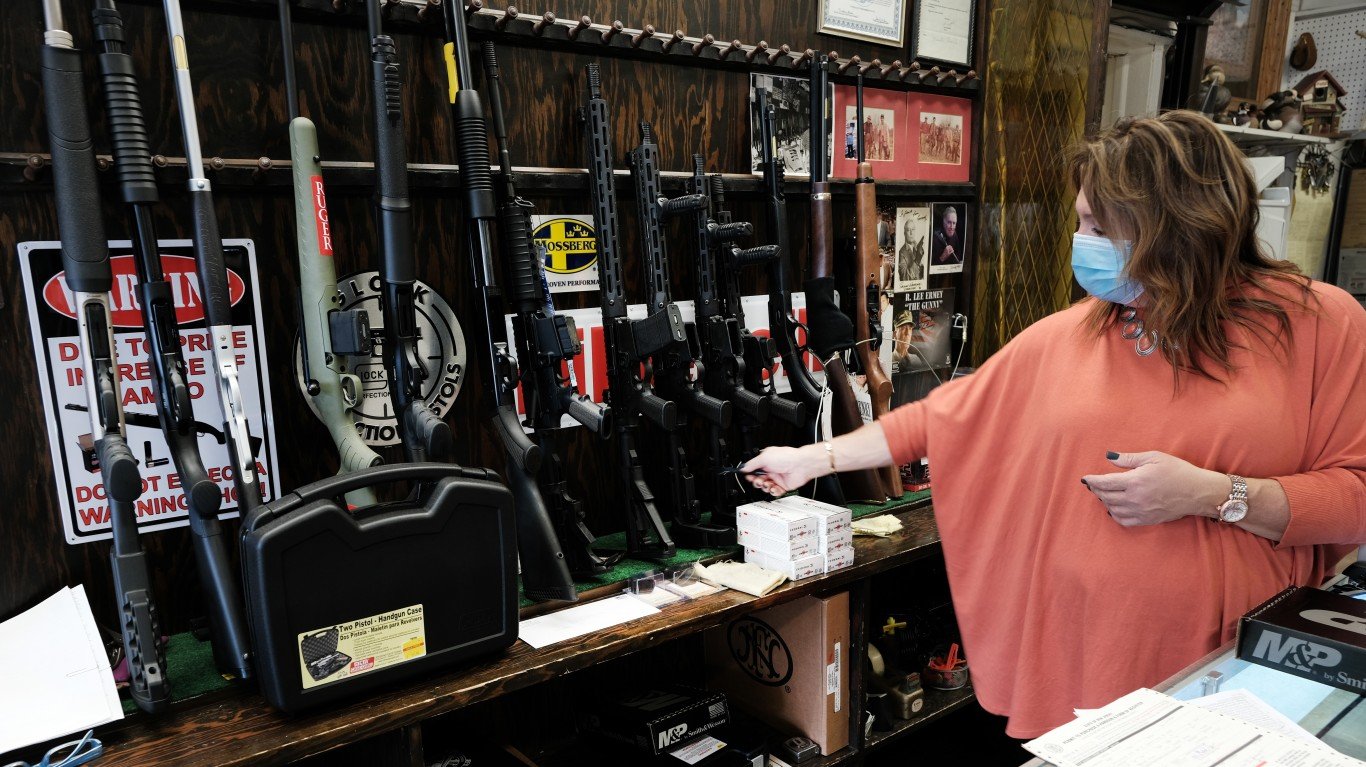
To find the states where the most people bought guns last month, 24/7 Wall St. used data from the FBI’s National Instant Criminal Background Check System. States are ranked based on the number of gun background checks in July 2023 per 1,000 state residents.
To get closer to an accurate reflection of gun sales, several categories of criminal background checks were excluded from our calculation, including pawn shop transactions, returns, rentals, and rechecks, which are conducted periodically by some states on existing permit holders. Even after removing these categories, background checks still only serve as a rough approximation of gun sales and are likely an over or underestimation in some states. Across the United States, there were 3.8 checks per 1,000 people in July. (Also read: the company making the most guns in every state.)
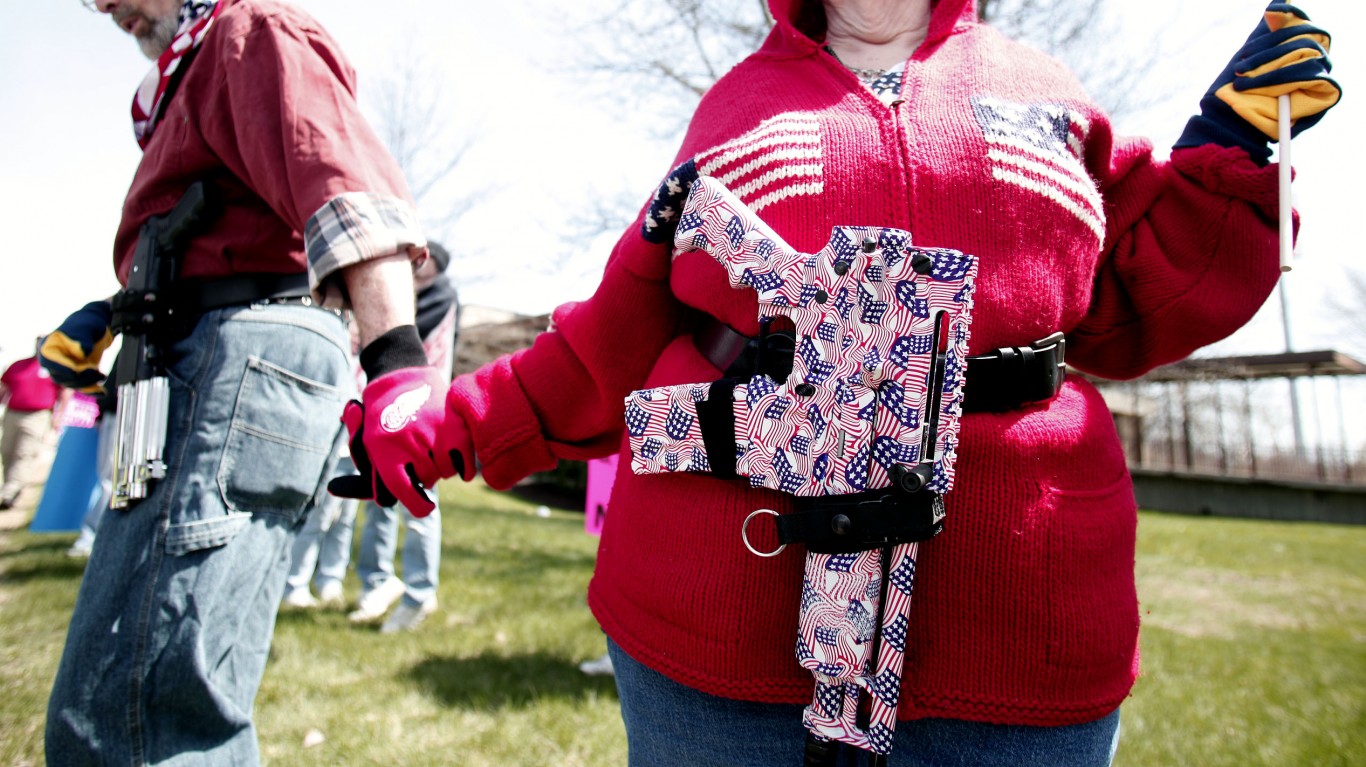
California, as a state with relatively few checks per person, is in company with a number of left-leaning states that have stricter gun control legislation in place. Of the eight states receiving a score of “A-” or better from the Gifford Law Centers gun law scorecard (higher scores denote stricter gun policies), six fall among the bottom 10 states for background checks. This is interesting as stricter background check policies imply that more gun sales require a background check, yet these states have among the fewest checks per capita. Perhaps, this is indicative of even lower gun sales in these states compared to states that do not enforce strict checking policies. (Also see: every state’s grade on gun laws.)
At the other end of the list are a number of very pro-gun states. The seven states with the most checks per capita all receive “F” grades from the Giffords center. Notably, two states that appear to have relatively high gun sales — Oregon and Colorado — have more pro-gun regulation than the others states with a high number of checks per person. Both states have in the past year passed substantial legislation to control firearms, and both are embroiled in legal disputes over the constitutionality of those laws.
Click here to see the states where the most people bought guns last month.
Click here to read our detailed methodology.
50. Hawaii
> Firearm background checks per 1,000 residents, July 2023: 0.9
> Firearm background checks, July 2023: 1,337 — the fewest
> Most common type of firearm check: No data available
> Firearm background checks per 1,000 residents, July 2022: 1.3 — the fewest
> Firearm background checks, Jan-July 2022: 1,827 — the fewest
> Change in background checks, July 2022-July 2023: -490 (-26.8% — 6th largest decrease)
> 2022 Population: 1.4 million — 11th smallest
[in-text-ad]
49. New Jersey
> Firearm background checks per 1,000 residents, July 2023: 1.2
> Firearm background checks, July 2023: 10,927 — 16th fewest
> Most common type of firearm check: Handguns
> Firearm background checks per 1,000 residents, July 2022: 1.6 — 2nd fewest
> Firearm background checks, Jan-July 2022: 14,486 — 19th fewest
> Change in background checks, July 2022-July 2023: -3,559 (-24.6% — 11th largest decrease)
> 2022 Population: 9.3 million — 11th largest
[recirclink id=1301457]
48. New York
> Firearm background checks per 1,000 residents, July 2023: 1.2
> Firearm background checks, July 2023: 23,584 — 22nd most
> Most common type of firearm check: Handguns
> Firearm background checks per 1,000 residents, July 2022: 1.7 — 3rd fewest
> Firearm background checks, Jan-July 2022: 34,047 — 19th most
> Change in background checks, July 2022-July 2023: -10,463 (-30.7% — 2nd largest decrease)
> 2022 Population: 19.7 million — 4th largest

47. Rhode Island
> Firearm background checks per 1,000 residents, July 2023: 1.4
> Firearm background checks, July 2023: 1,580 — 2nd fewest
> Most common type of firearm check: Handguns
> Firearm background checks per 1,000 residents, July 2022: 1.7 — 4th fewest
> Firearm background checks, Jan-July 2022: 1,906 — 2nd fewest
> Change in background checks, July 2022-July 2023: -326 (-17.1% — 21st largest decrease)
> 2022 Population: 1.1 million — 7th smallest
[in-text-ad-2]
46. Iowa
> Firearm background checks per 1,000 residents, July 2023: 2.2
> Firearm background checks, July 2023: 6,976 — 11th fewest
> Most common type of firearm check: Handguns
> Firearm background checks per 1,000 residents, July 2022: 2.5 — 6th fewest
> Firearm background checks, Jan-July 2022: 8,146 — 10th fewest
> Change in background checks, July 2022-July 2023: -1,170 (-14.4% — 22nd smallest decrease)
> 2022 Population: 3.2 million — 20th smallest
45. Nebraska
> Firearm background checks per 1,000 residents, July 2023: 2.4
> Firearm background checks, July 2023: 4,720 — 8th fewest
> Most common type of firearm check: Long guns
> Firearm background checks per 1,000 residents, July 2022: 2.4 — 5th fewest
> Firearm background checks, Jan-July 2022: 4,677 — 5th fewest
> Change in background checks, July 2022-July 2023: +43 (+0.9% — the smallest increase)
> 2022 Population: 2.0 million — 14th smallest
[in-text-ad]
44. California
> Firearm background checks per 1,000 residents, July 2023: 2.4
> Firearm background checks, July 2023: 94,115 — 3rd most
> Most common type of firearm check: Handguns
> Firearm background checks per 1,000 residents, July 2022: 2.7 — 7th fewest
> Firearm background checks, Jan-July 2022: 105,185 — 3rd most
> Change in background checks, July 2022-July 2023: -11,070 (-10.5% — 8th smallest decrease)
> 2022 Population: 39.0 million — the largest
[recirclink id=1302769]

43. Massachusetts
> Firearm background checks per 1,000 residents, July 2023: 2.4
> Firearm background checks, July 2023: 17,024 — 24th fewest
> Most common type of firearm check: Handguns
> Firearm background checks per 1,000 residents, July 2022: 2.7 — 8th fewest
> Firearm background checks, Jan-July 2022: 19,030 — 24th fewest
> Change in background checks, July 2022-July 2023: -2,006 (-10.5% — 9th smallest decrease)
> 2022 Population: 7.0 million — 16th largest

42. Georgia
> Firearm background checks per 1,000 residents, July 2023: 3.1
> Firearm background checks, July 2023: 33,824 — 14th most
> Most common type of firearm check: Handguns
> Firearm background checks per 1,000 residents, July 2022: 3.6 — 11th fewest
> Firearm background checks, Jan-July 2022: 38,919 — 17th most
> Change in background checks, July 2022-July 2023: -5,095 (-13.1% — 17th smallest decrease)
> 2022 Population: 10.9 million — 8th largest
[in-text-ad-2]

41. Maryland
> Firearm background checks per 1,000 residents, July 2023: 3.2
> Firearm background checks, July 2023: 19,903 — 24th most
> Most common type of firearm check: Handguns
> Firearm background checks per 1,000 residents, July 2022: 3.5 — 9th fewest
> Firearm background checks, Jan-July 2022: 21,321 — 25th most
> Change in background checks, July 2022-July 2023: -1,418 (-6.7% — 6th smallest decrease)
> 2022 Population: 6.2 million — 19th largest
40. Texas
> Firearm background checks per 1,000 residents, July 2023: 3.3
> Firearm background checks, July 2023: 99,885 — the most
> Most common type of firearm check: Handguns
> Firearm background checks per 1,000 residents, July 2022: 4.2 — 16th fewest
> Firearm background checks, Jan-July 2022: 125,648 — the most
> Change in background checks, July 2022-July 2023: -25,763 (-20.5% — 15th largest decrease)
> 2022 Population: 30.0 million — 2nd largest
[in-text-ad]
39. Nevada
> Firearm background checks per 1,000 residents, July 2023: 3.3
> Firearm background checks, July 2023: 10,611 — 14th fewest
> Most common type of firearm check: Handguns
> Firearm background checks per 1,000 residents, July 2022: 3.7 — 12th fewest
> Firearm background checks, Jan-July 2022: 11,896 — 14th fewest
> Change in background checks, July 2022-July 2023: -1,285 (-10.8% — 10th smallest decrease)
> 2022 Population: 3.2 million — 19th smallest
[recirclink id=1301559]
38. Delaware
> Firearm background checks per 1,000 residents, July 2023: 3.3
> Firearm background checks, July 2023: 3,410 — 4th fewest
> Most common type of firearm check: Handguns
> Firearm background checks per 1,000 residents, July 2022: 3.5 — 10th fewest
> Firearm background checks, Jan-July 2022: 3,559 — 4th fewest
> Change in background checks, July 2022-July 2023: -149 (-4.2% — 3rd smallest decrease)
> 2022 Population: 1.0 million — 6th smallest
37. Kentucky
> Firearm background checks per 1,000 residents, July 2023: 3.5
> Firearm background checks, July 2023: 15,736 — 22nd fewest
> Most common type of firearm check: Handguns
> Firearm background checks per 1,000 residents, July 2022: 4.2 — 15th fewest
> Firearm background checks, Jan-July 2022: 18,847 — 23rd fewest
> Change in background checks, July 2022-July 2023: -3,111 (-16.5% — 24th largest decrease)
> 2022 Population: 4.5 million — 25th smallest
[in-text-ad-2]
36. Ohio
> Firearm background checks per 1,000 residents, July 2023: 3.5
> Firearm background checks, July 2023: 41,446 — 9th most
> Most common type of firearm check: Handguns
> Firearm background checks per 1,000 residents, July 2022: 4.0 — 14th fewest
> Firearm background checks, Jan-July 2022: 46,681 — 10th most
> Change in background checks, July 2022-July 2023: -5,235 (-11.2% — 11th smallest decrease)
> 2022 Population: 11.8 million — 7th largest

35. Vermont
> Firearm background checks per 1,000 residents, July 2023: 3.6
> Firearm background checks, July 2023: 2,318 — 3rd fewest
> Most common type of firearm check: Long guns
> Firearm background checks per 1,000 residents, July 2022: 5.1 — 23rd fewest
> Firearm background checks, Jan-July 2022: 3,317 — 3rd fewest
> Change in background checks, July 2022-July 2023: -999 (-30.1% — 3rd largest decrease)
> 2022 Population: 647,064 — 2nd smallest
[in-text-ad]
34. Connecticut
> Firearm background checks per 1,000 residents, July 2023: 3.6
> Firearm background checks, July 2023: 13,062 — 19th fewest
> Most common type of firearm check: Handguns
> Firearm background checks per 1,000 residents, July 2022: 4.6 — 19th fewest
> Firearm background checks, Jan-July 2022: 16,803 — 21st fewest
> Change in background checks, July 2022-July 2023: -3,741 (-22.3% — 12th largest decrease)
> 2022 Population: 3.6 million — 22nd smallest
[recirclink id=1291802]

33. Louisiana
> Firearm background checks per 1,000 residents, July 2023: 3.6
> Firearm background checks, July 2023: 16,749 — 23rd fewest
> Most common type of firearm check: Handguns
> Firearm background checks per 1,000 residents, July 2022: 4.9 — 21st fewest
> Firearm background checks, Jan-July 2022: 22,466 — 24th most
> Change in background checks, July 2022-July 2023: -5,717 (-25.4% — 9th largest decrease)
> 2022 Population: 4.6 million — 25th largest
32. Illinois
> Firearm background checks per 1,000 residents, July 2023: 3.7
> Firearm background checks, July 2023: 46,805 — 6th most
> Most common type of firearm check: Handguns
> Firearm background checks per 1,000 residents, July 2022: 4.7 — 20th fewest
> Firearm background checks, Jan-July 2022: 58,935 — 6th most
> Change in background checks, July 2022-July 2023: -12,130 (-20.6% — 14th largest decrease)
> 2022 Population: 12.6 million — 6th largest
[in-text-ad-2]
31. Indiana
> Firearm background checks per 1,000 residents, July 2023: 4.1
> Firearm background checks, July 2023: 28,215 — 18th most
> Most common type of firearm check: Handguns
> Firearm background checks per 1,000 residents, July 2022: 5.8 — 21st most
> Firearm background checks, Jan-July 2022: 39,490 — 15th most
> Change in background checks, July 2022-July 2023: -11,275 (-28.6% — 4th largest decrease)
> 2022 Population: 6.8 million — 17th largest
30. Kansas
> Firearm background checks per 1,000 residents, July 2023: 4.1
> Firearm background checks, July 2023: 12,157 — 18th fewest
> Most common type of firearm check: Handguns
> Firearm background checks per 1,000 residents, July 2022: 4.4 — 17th fewest
> Firearm background checks, Jan-July 2022: 12,977 — 17th fewest
> Change in background checks, July 2022-July 2023: -820 (-6.3% — 5th smallest decrease)
> 2022 Population: 2.9 million — 16th smallest
[in-text-ad]
29. Washington
> Firearm background checks per 1,000 residents, July 2023: 4.1
> Firearm background checks, July 2023: 32,234 — 16th most
> Most common type of firearm check: Handguns
> Firearm background checks per 1,000 residents, July 2022: 7.1 — 11th most
> Firearm background checks, Jan-July 2022: 55,092 — 7th most
> Change in background checks, July 2022-July 2023: -22,858 (-41.5% — the largest decrease)
> 2022 Population: 7.8 million — 13th largest
[recirclink id=1301069]

28. Virginia
> Firearm background checks per 1,000 residents, July 2023: 4.1
> Firearm background checks, July 2023: 36,002 — 12th most
> Most common type of firearm check: Handguns
> Firearm background checks per 1,000 residents, July 2022: 5.0 — 22nd fewest
> Firearm background checks, Jan-July 2022: 43,198 — 12th most
> Change in background checks, July 2022-July 2023: -7,196 (-16.7% — 23rd largest decrease)
> 2022 Population: 8.7 million — 12th largest

27. Florida
> Firearm background checks per 1,000 residents, July 2023: 4.3
> Firearm background checks, July 2023: 94,704 — 2nd most
> Most common type of firearm check: Handguns
> Firearm background checks per 1,000 residents, July 2022: 5.1 — 24th fewest
> Firearm background checks, Jan-July 2022: 114,287 — 2nd most
> Change in background checks, July 2022-July 2023: -19,583 (-17.1% — 20th largest decrease)
> 2022 Population: 22.2 million — 3rd largest
[in-text-ad-2]
26. North Carolina
> Firearm background checks per 1,000 residents, July 2023: 4.3
> Firearm background checks, July 2023: 46,480 — 7th most
> Most common type of firearm check: Handguns
> Firearm background checks per 1,000 residents, July 2022: 3.8 — 13th fewest
> Firearm background checks, Jan-July 2022: 40,685 — 14th most
> Change in background checks, July 2022-July 2023: +5,795 (+14.2% — the largest increase)
> 2022 Population: 10.7 million — 9th largest
25. Arkansas
> Firearm background checks per 1,000 residents, July 2023: 4.4
> Firearm background checks, July 2023: 13,363 — 21st fewest
> Most common type of firearm check: Handguns
> Firearm background checks per 1,000 residents, July 2022: 4.6 — 18th fewest
> Firearm background checks, Jan-July 2022: 14,102 — 18th fewest
> Change in background checks, July 2022-July 2023: -739 (-5.2% — 4th smallest decrease)
> 2022 Population: 3.0 million — 18th smallest
[in-text-ad]
24. South Carolina
> Firearm background checks per 1,000 residents, July 2023: 4.5
> Firearm background checks, July 2023: 23,683 — 21st most
> Most common type of firearm check: Handguns
> Firearm background checks per 1,000 residents, July 2022: 5.3 — 25th most
> Firearm background checks, Jan-July 2022: 27,957 — 22nd most
> Change in background checks, July 2022-July 2023: -4,274 (-15.3% — 24th smallest decrease)
> 2022 Population: 5.3 million — 23rd largest
[recirclink id=1301457]
23. Mississippi
> Firearm background checks per 1,000 residents, July 2023: 4.5
> Firearm background checks, July 2023: 13,213 — 20th fewest
> Most common type of firearm check: Handguns
> Firearm background checks per 1,000 residents, July 2022: 5.5 — 23rd most
> Firearm background checks, Jan-July 2022: 16,309 — 20th fewest
> Change in background checks, July 2022-July 2023: -3,096 (-19.0% — 18th largest decrease)
> 2022 Population: 2.9 million — 17th smallest
22. Michigan
> Firearm background checks per 1,000 residents, July 2023: 4.5
> Firearm background checks, July 2023: 45,320 — 8th most
> Most common type of firearm check: Handguns
> Firearm background checks per 1,000 residents, July 2022: 5.2 — 25th fewest
> Firearm background checks, Jan-July 2022: 52,605 — 8th most
> Change in background checks, July 2022-July 2023: -7,285 (-13.8% — 19th smallest decrease)
> 2022 Population: 10.0 million — 10th largest
[in-text-ad-2]
21. Minnesota
> Firearm background checks per 1,000 residents, July 2023: 4.6
> Firearm background checks, July 2023: 26,448 — 19th most
> Most common type of firearm check: Handguns
> Firearm background checks per 1,000 residents, July 2022: 5.6 — 22nd most
> Firearm background checks, Jan-July 2022: 31,828 — 20th most
> Change in background checks, July 2022-July 2023: -5,380 (-16.9% — 22nd largest decrease)
> 2022 Population: 5.7 million — 22nd largest
20. Arizona
> Firearm background checks per 1,000 residents, July 2023: 4.6
> Firearm background checks, July 2023: 34,097 — 13th most
> Most common type of firearm check: Handguns
> Firearm background checks per 1,000 residents, July 2022: 5.3 — 24th most
> Firearm background checks, Jan-July 2022: 39,144 — 16th most
> Change in background checks, July 2022-July 2023: -5,047 (-12.9% — 16th smallest decrease)
> 2022 Population: 7.4 million — 14th largest
[in-text-ad]
19. Missouri
> Firearm background checks per 1,000 residents, July 2023: 4.8
> Firearm background checks, July 2023: 29,659 — 17th most
> Most common type of firearm check: Handguns
> Firearm background checks per 1,000 residents, July 2022: 6.0 — 19th most
> Firearm background checks, Jan-July 2022: 36,983 — 18th most
> Change in background checks, July 2022-July 2023: -7,324 (-19.8% — 17th largest decrease)
> 2022 Population: 6.2 million — 18th largest
[recirclink id=1302769]
18. South Dakota
> Firearm background checks per 1,000 residents, July 2023: 4.9
> Firearm background checks, July 2023: 4,422 — 7th fewest
> Most common type of firearm check: Long guns
> Firearm background checks per 1,000 residents, July 2022: 6.5 — 15th most
> Firearm background checks, Jan-July 2022: 5,953 — 8th fewest
> Change in background checks, July 2022-July 2023: -1,531 (-25.7% — 8th largest decrease)
> 2022 Population: 909,824 — 5th smallest
17. Maine
> Firearm background checks per 1,000 residents, July 2023: 4.9
> Firearm background checks, July 2023: 6,809 — 10th fewest
> Most common type of firearm check: Handguns
> Firearm background checks per 1,000 residents, July 2022: 6.2 — 17th most
> Firearm background checks, Jan-July 2022: 8,535 — 11th fewest
> Change in background checks, July 2022-July 2023: -1,726 (-20.2% — 16th largest decrease)
> 2022 Population: 1.4 million — 9th smallest
[in-text-ad-2]

16. New Mexico
> Firearm background checks per 1,000 residents, July 2023: 5.2
> Firearm background checks, July 2023: 10,930 — 17th fewest
> Most common type of firearm check: Handguns
> Firearm background checks per 1,000 residents, July 2022: 5.8 — 20th most
> Firearm background checks, Jan-July 2022: 12,318 — 16th fewest
> Change in background checks, July 2022-July 2023: -1,388 (-11.3% — 12th smallest decrease)
> 2022 Population: 2.1 million — 15th smallest
15. North Dakota
> Firearm background checks per 1,000 residents, July 2023: 5.2
> Firearm background checks, July 2023: 4,062 — 5th fewest
> Most common type of firearm check: Long guns
> Firearm background checks per 1,000 residents, July 2022: 7.0 — 12th most
> Firearm background checks, Jan-July 2022: 5,483 — 7th fewest
> Change in background checks, July 2022-July 2023: -1,421 (-25.9% — 7th largest decrease)
> 2022 Population: 779,261 — 4th smallest
[in-text-ad]

14. Oklahoma
> Firearm background checks per 1,000 residents, July 2023: 5.2
> Firearm background checks, July 2023: 21,063 — 23rd most
> Most common type of firearm check: Handguns
> Firearm background checks per 1,000 residents, July 2022: 6.2 — 16th most
> Firearm background checks, Jan-July 2022: 24,856 — 23rd most
> Change in background checks, July 2022-July 2023: -3,793 (-15.3% — 23rd smallest decrease)
> 2022 Population: 4.0 million — 23rd smallest
[recirclink id=1301559]
13. Wisconsin
> Firearm background checks per 1,000 residents, July 2023: 5.7
> Firearm background checks, July 2023: 33,724 — 15th most
> Most common type of firearm check: Handguns
> Firearm background checks per 1,000 residents, July 2022: 7.6 — 7th most
> Firearm background checks, Jan-July 2022: 44,715 — 11th most
> Change in background checks, July 2022-July 2023: -10,991 (-24.6% — 10th largest decrease)
> 2022 Population: 5.9 million — 20th largest

12. Pennsylvania
> Firearm background checks per 1,000 residents, July 2023: 5.8
> Firearm background checks, July 2023: 75,778 — 4th most
> Most common type of firearm check: Handguns
> Firearm background checks per 1,000 residents, July 2022: 7.2 — 9th most
> Firearm background checks, Jan-July 2022: 93,154 — 4th most
> Change in background checks, July 2022-July 2023: -17,376 (-18.7% — 19th largest decrease)
> 2022 Population: 13.0 million — 5th largest
[in-text-ad-2]
11. Utah
> Firearm background checks per 1,000 residents, July 2023: 5.9
> Firearm background checks, July 2023: 19,834 — 25th most
> Most common type of firearm check: Handguns
> Firearm background checks per 1,000 residents, July 2022: 6.1 — 18th most
> Firearm background checks, Jan-July 2022: 20,516 — 25th fewest
> Change in background checks, July 2022-July 2023: -682 (-3.3% — 2nd smallest decrease)
> 2022 Population: 3.4 million — 21st smallest
10. West Virginia
> Firearm background checks per 1,000 residents, July 2023: 6.0
> Firearm background checks, July 2023: 10,691 — 15th fewest
> Most common type of firearm check: Handguns
> Firearm background checks per 1,000 residents, July 2022: 6.9 — 14th most
> Firearm background checks, Jan-July 2022: 12,316 — 15th fewest
> Change in background checks, July 2022-July 2023: -1,625 (-13.2% — 18th smallest decrease)
> 2022 Population: 1.8 million — 12th smallest
[in-text-ad]

9. Oregon
> Firearm background checks per 1,000 residents, July 2023: 6.1
> Firearm background checks, July 2023: 25,884 — 20th most
> Most common type of firearm check: Handguns
> Firearm background checks per 1,000 residents, July 2022: 7.1 — 10th most
> Firearm background checks, Jan-July 2022: 30,050 — 21st most
> Change in background checks, July 2022-July 2023: -4,166 (-13.9% — 20th smallest decrease)
> 2022 Population: 4.2 million — 24th smallest
[recirclink id=1291802]

8. Colorado
> Firearm background checks per 1,000 residents, July 2023: 6.2
> Firearm background checks, July 2023: 36,007 — 11th most
> Most common type of firearm check: Handguns
> Firearm background checks per 1,000 residents, July 2022: 7.0 — 13th most
> Firearm background checks, Jan-July 2022: 40,693 — 13th most
> Change in background checks, July 2022-July 2023: -4,686 (-11.5% — 13th smallest decrease)
> 2022 Population: 5.8 million — 21st largest
7. New Hampshire
> Firearm background checks per 1,000 residents, July 2023: 6.5
> Firearm background checks, July 2023: 9,003 — 13th fewest
> Most common type of firearm check: Handguns
> Firearm background checks per 1,000 residents, July 2022: 7.4 — 8th most
> Firearm background checks, Jan-July 2022: 10,261 — 13th fewest
> Change in background checks, July 2022-July 2023: -1,258 (-12.3% — 14th smallest decrease)
> 2022 Population: 1.4 million — 10th smallest
[in-text-ad-2]
6. Tennessee
> Firearm background checks per 1,000 residents, July 2023: 7.1
> Firearm background checks, July 2023: 50,092 — 5th most
> Most common type of firearm check: Handguns
> Firearm background checks per 1,000 residents, July 2022: 9.0 — 3rd most
> Firearm background checks, Jan-July 2022: 63,198 — 5th most
> Change in background checks, July 2022-July 2023: -13,106 (-20.7% — 13th largest decrease)
> 2022 Population: 7.1 million — 15th largest
5. Alabama
> Firearm background checks per 1,000 residents, July 2023: 7.3
> Firearm background checks, July 2023: 36,824 — 10th most
> Most common type of firearm check: Handguns
> Firearm background checks per 1,000 residents, July 2022: 10.0 — the most
> Firearm background checks, Jan-July 2022: 50,532 — 9th most
> Change in background checks, July 2022-July 2023: -13,708 (-27.1% — 5th largest decrease)
> 2022 Population: 5.1 million — 24th largest
[in-text-ad]

4. Wyoming
> Firearm background checks per 1,000 residents, July 2023: 7.3
> Firearm background checks, July 2023: 4,261 — 6th fewest
> Most common type of firearm check: Handguns
> Firearm background checks per 1,000 residents, July 2022: 8.4 — 6th most
> Firearm background checks, Jan-July 2022: 4,882 — 6th fewest
> Change in background checks, July 2022-July 2023: -621 (-12.7% — 15th smallest decrease)
> 2022 Population: 581,381 — the smallest
[recirclink id=1301069]

3. Alaska
> Firearm background checks per 1,000 residents, July 2023: 7.4
> Firearm background checks, July 2023: 5,427 — 9th fewest
> Most common type of firearm check: Handguns
> Firearm background checks per 1,000 residents, July 2022: 8.6 — 5th most
> Firearm background checks, Jan-July 2022: 6,324 — 9th fewest
> Change in background checks, July 2022-July 2023: -897 (-14.2% — 21st smallest decrease)
> 2022 Population: 733,583 — 3rd smallest

2. Montana
> Firearm background checks per 1,000 residents, July 2023: 7.9
> Firearm background checks, July 2023: 8,835 — 12th fewest
> Most common type of firearm check: Handguns
> Firearm background checks per 1,000 residents, July 2022: 8.7 — 4th most
> Firearm background checks, Jan-July 2022: 9,715 — 12th fewest
> Change in background checks, July 2022-July 2023: -880 (-9.1% — 7th smallest decrease)
> 2022 Population: 1.1 million — 8th smallest
[in-text-ad-2]

1. Idaho
> Firearm background checks per 1,000 residents, July 2023: 8.9
> Firearm background checks, July 2023: 17,284 — 25th fewest
> Most common type of firearm check: Handguns
> Firearm background checks per 1,000 residents, July 2022: 9.1 — 2nd most
> Firearm background checks, Jan-July 2022: 17,694 — 22nd fewest
> Change in background checks, July 2022-July 2023: -410 (-2.3% — the smallest decrease)
> 2022 Population: 1.9 million — 13th smallest
Methodology
To find the states where the most people bought guns last month, 24/7 Wall St. used FBI data from its National Instant Criminal Background Check System. To get a more accurate approximation of gun sales, we excluded several categories of checks, including pawn shop transactions, returns, rentals, and rechecks, which are conducted periodically by some states on existing permit holders. We ranked states based on the number of gun checks in July 2023 per 1,000 people in each state.
Even after removing some types of checks that are clearly unrelated to a new firearm purchase, because every state has different laws in terms of when background checks are required and different accounting practices, background checks still only serve as a rough approximation of gun sales.
The most glaring example of this is Illinois, which alone accounted for about half of the background checks in the country after excluding the aforementioned categories. Illinois no longer breaks down background checks separately, but did from July 2016 through July 2021. During the four full years of data, an average of 9.2% of Illinois’s non-private sale or gun-specific permit checks were non-rechecks. We applied that average to the most recent state figures to estimate Illinois’ count. This was done only because Illinois is such a glaring example of inconsistency and because there was historical data to produce an estimate.
There are likely other states for which the background check figures listed are inflated or underestimated proxies for gun sales.
Population data came from the U.S. Census Bureau’s Population and Housing Unit Estimates Program, and are for July of 2022, the most recent data available.
Contact [email protected] for any questions or corrections.