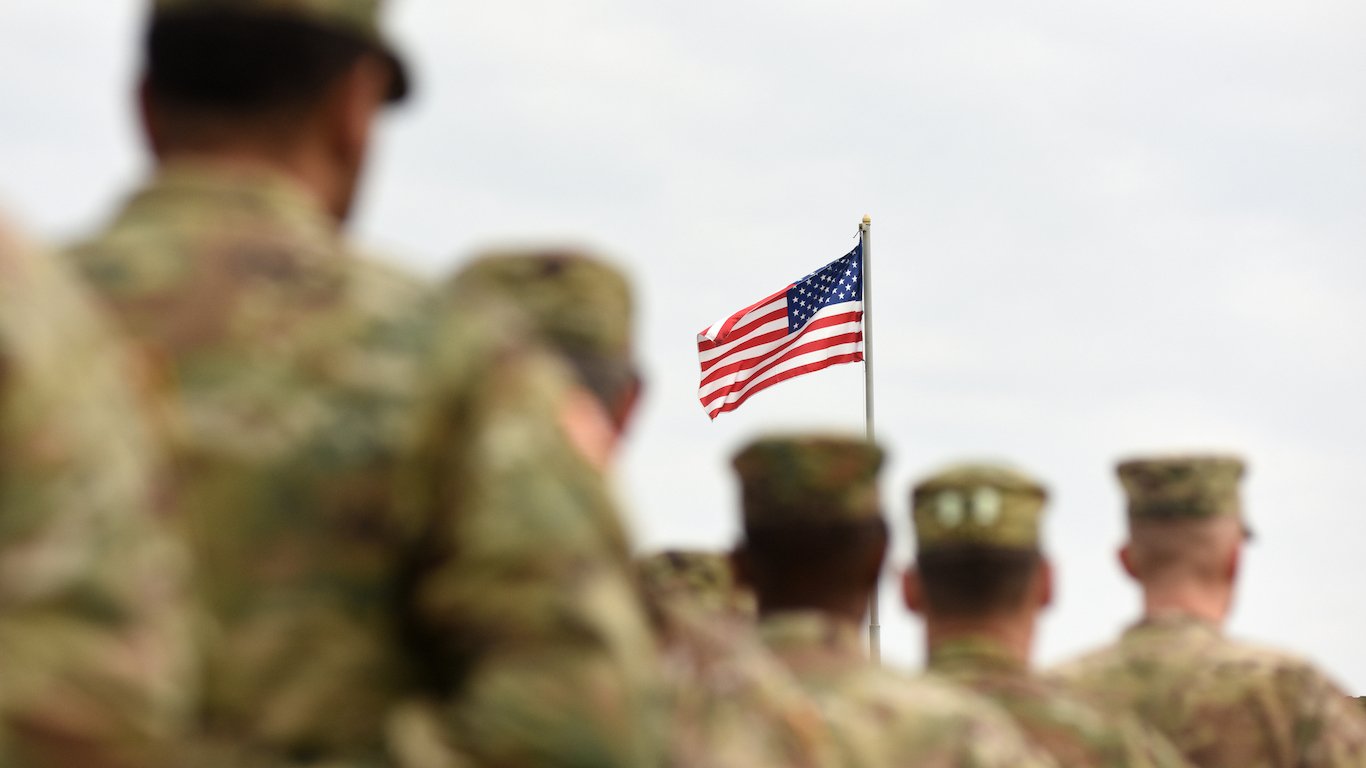
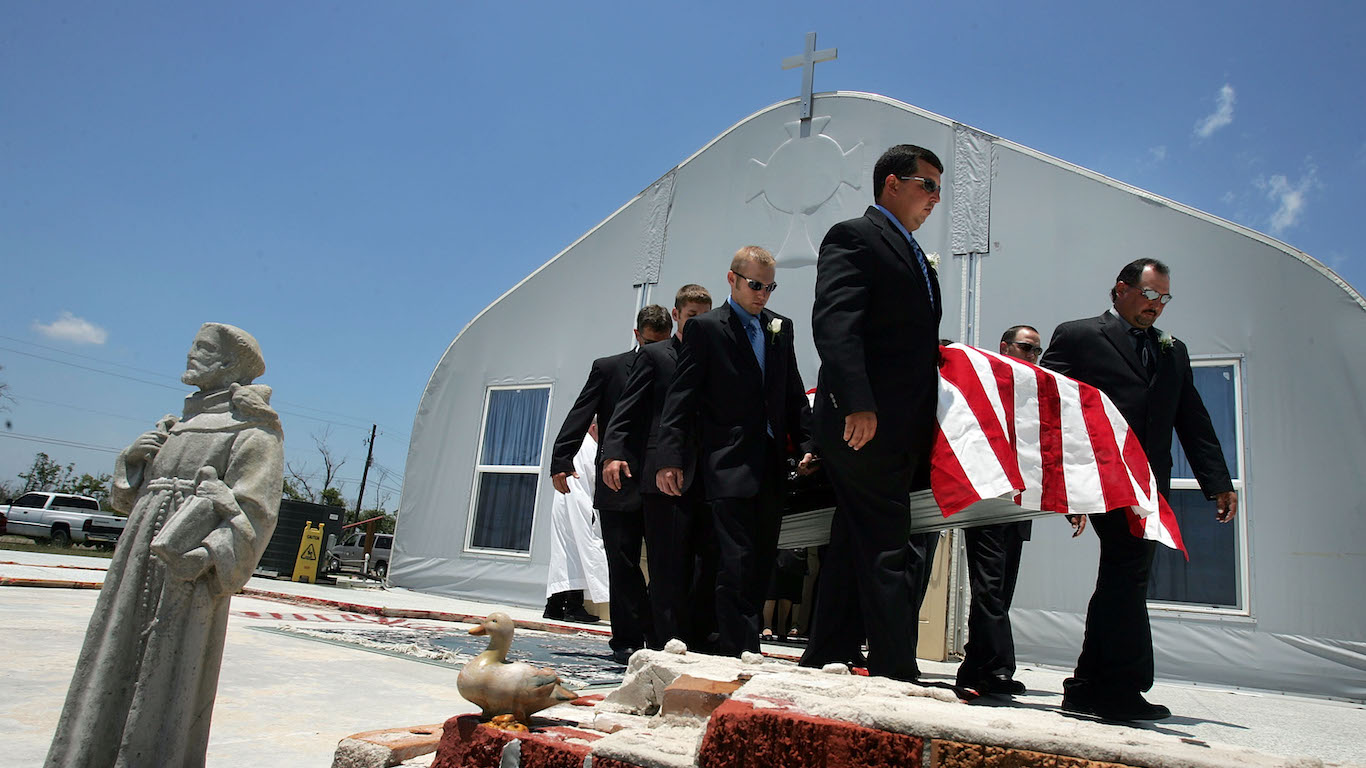
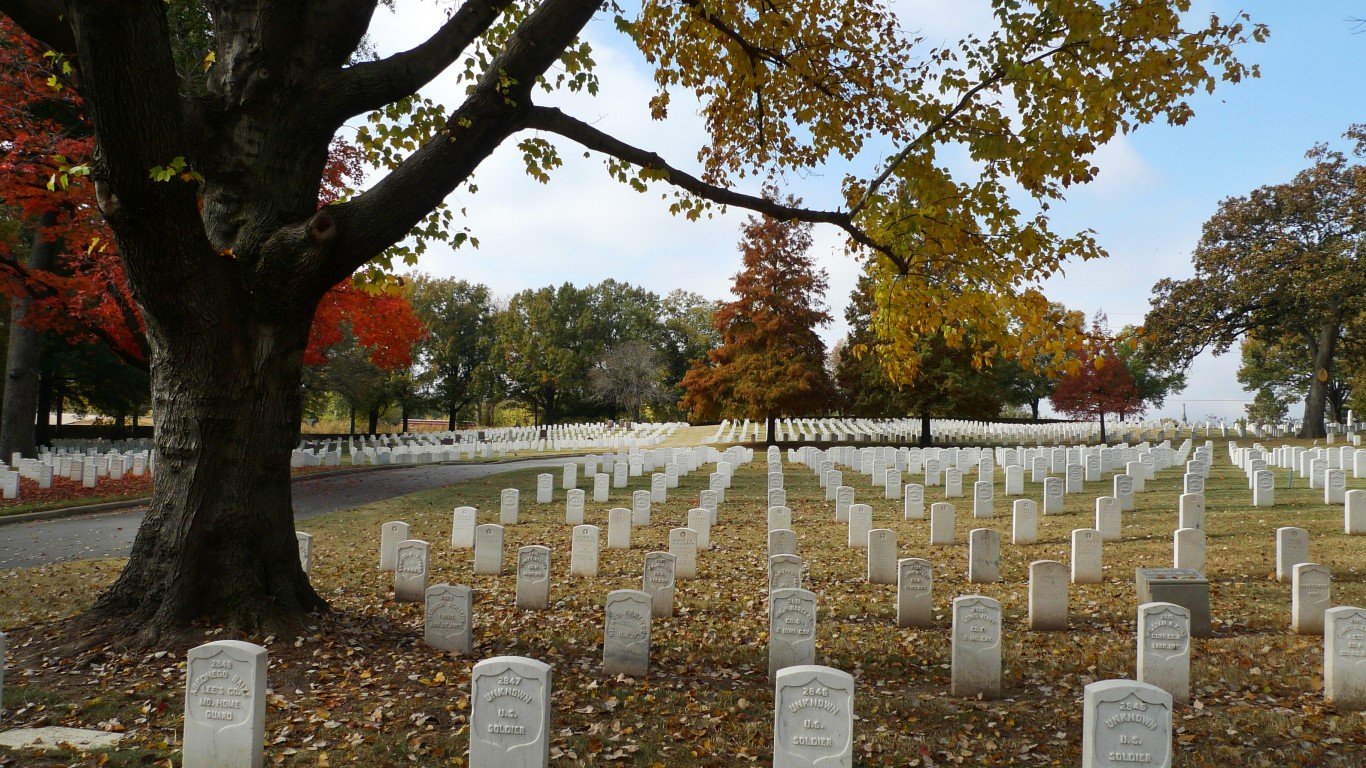
After nearly two decades of fighting, the withdrawal of U.S. troops from Afghanistan marks the end of the longest war in American history. Since 2001, nearly 2,500 American service members have been killed in the conflict — in addition to tens of thousands of contractors, civilians, Afghan and allied military personnel.
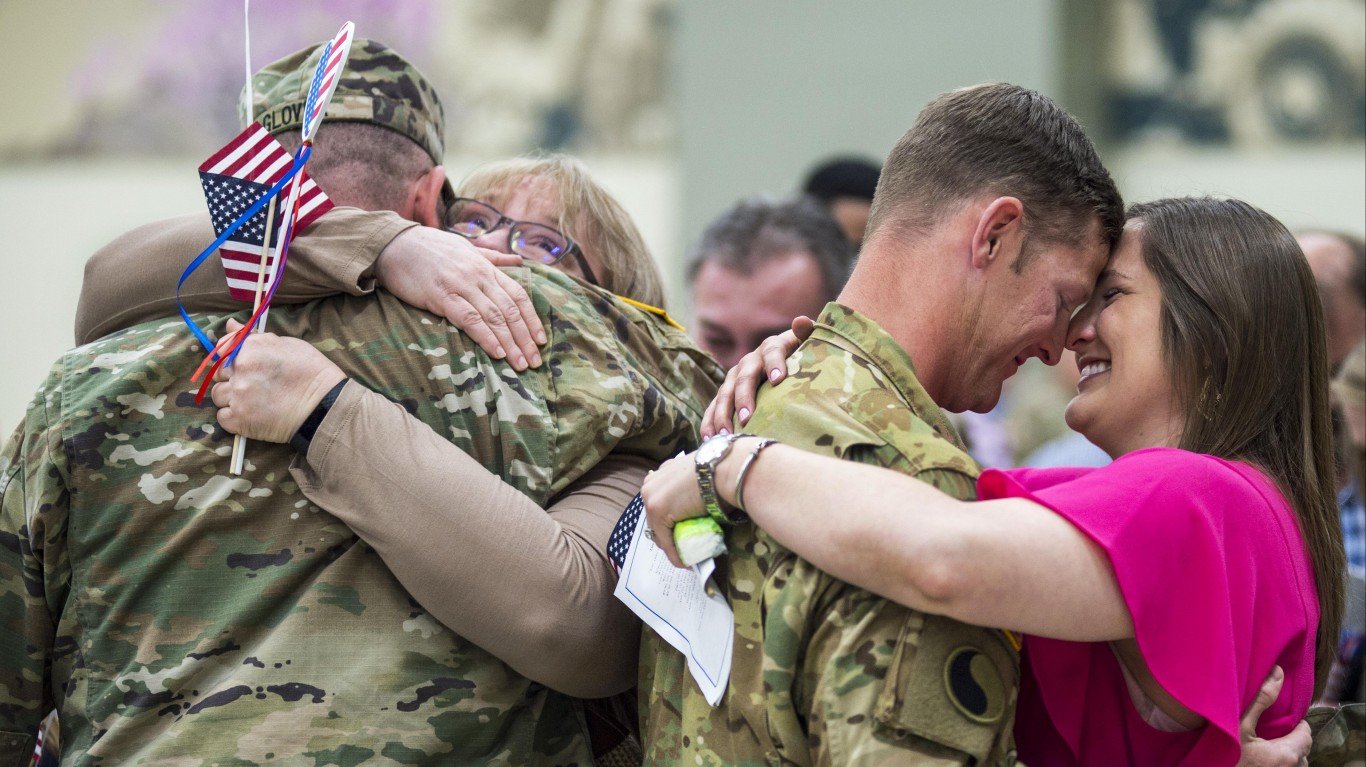
The servicemen and servicewomen returning home will join the more than 17 million American military veterans living across the country. Over 20% of veterans served since the terror attacks of Sept. 11, 2021, the catalyst for the U.S. invasion of Afghanistan. Here is a look at the longest wars in history.
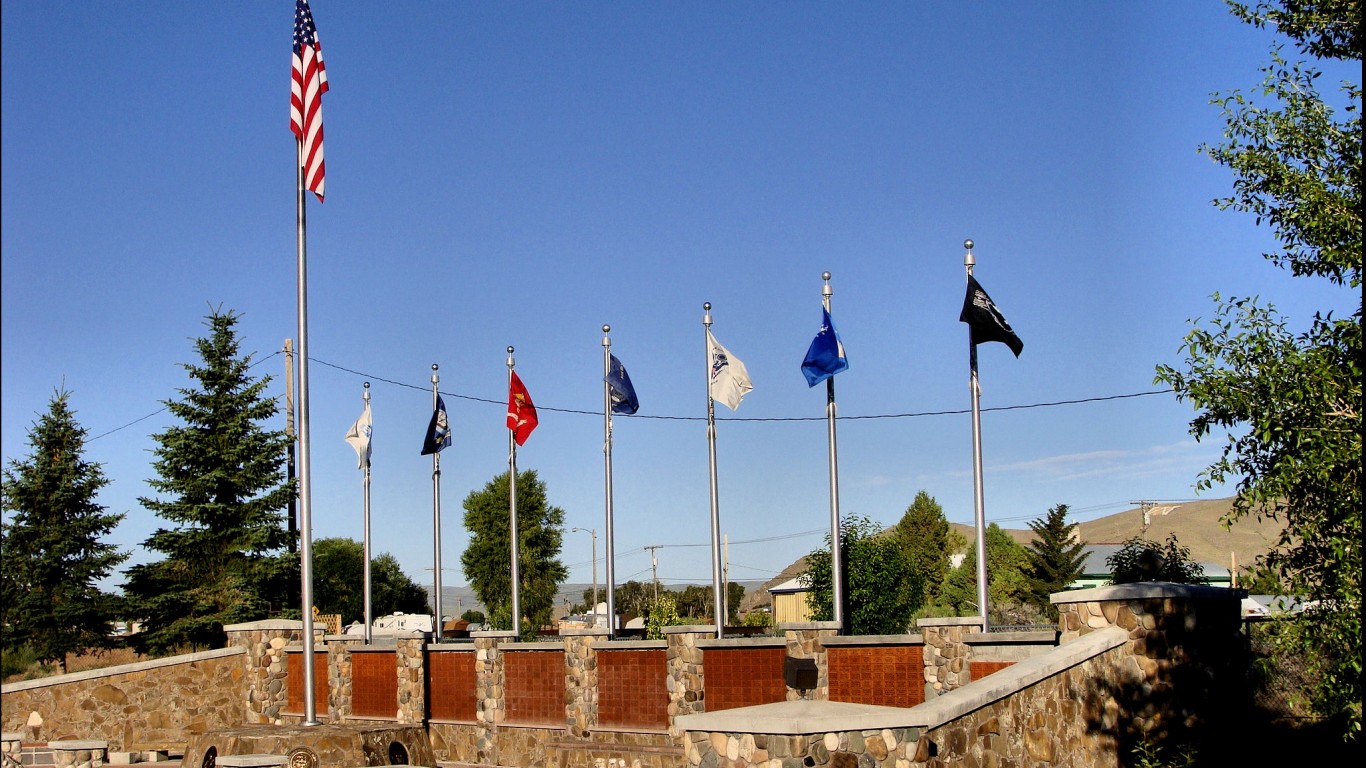
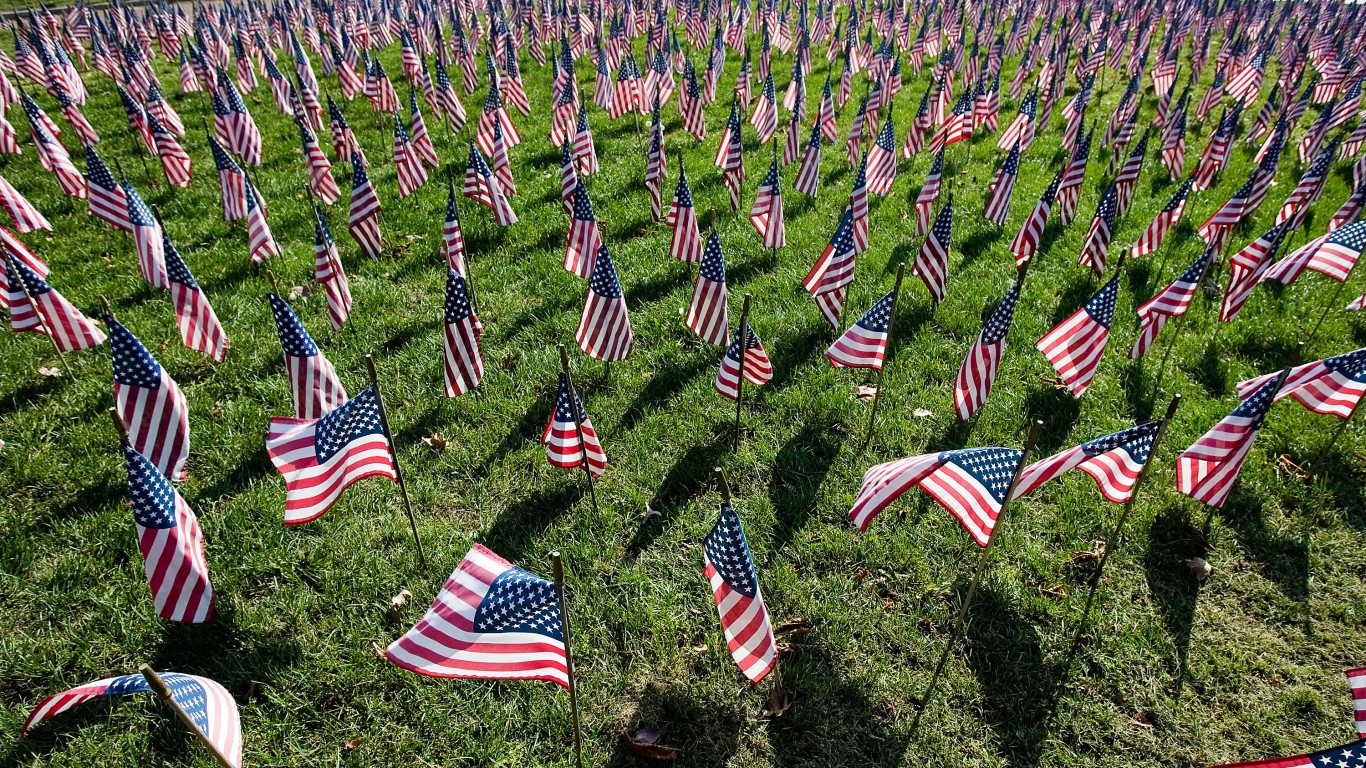
Using data from the U.S. Census Bureau, 24/7 Wall St. identified the states with the most veterans. Nationwide, veterans account for 6.9% of the adult population, and depending on the state, veterans make up anywhere from less than 5% of the adult population to over 10%.
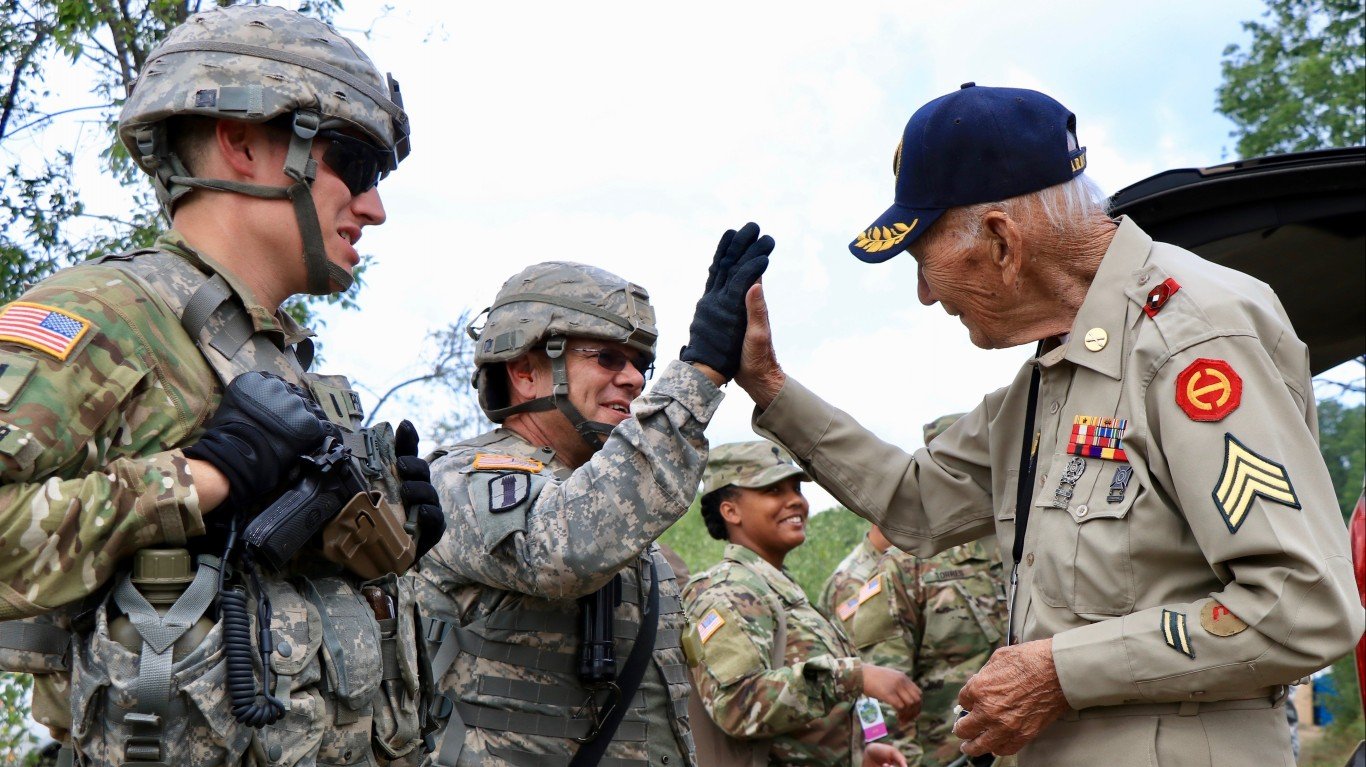
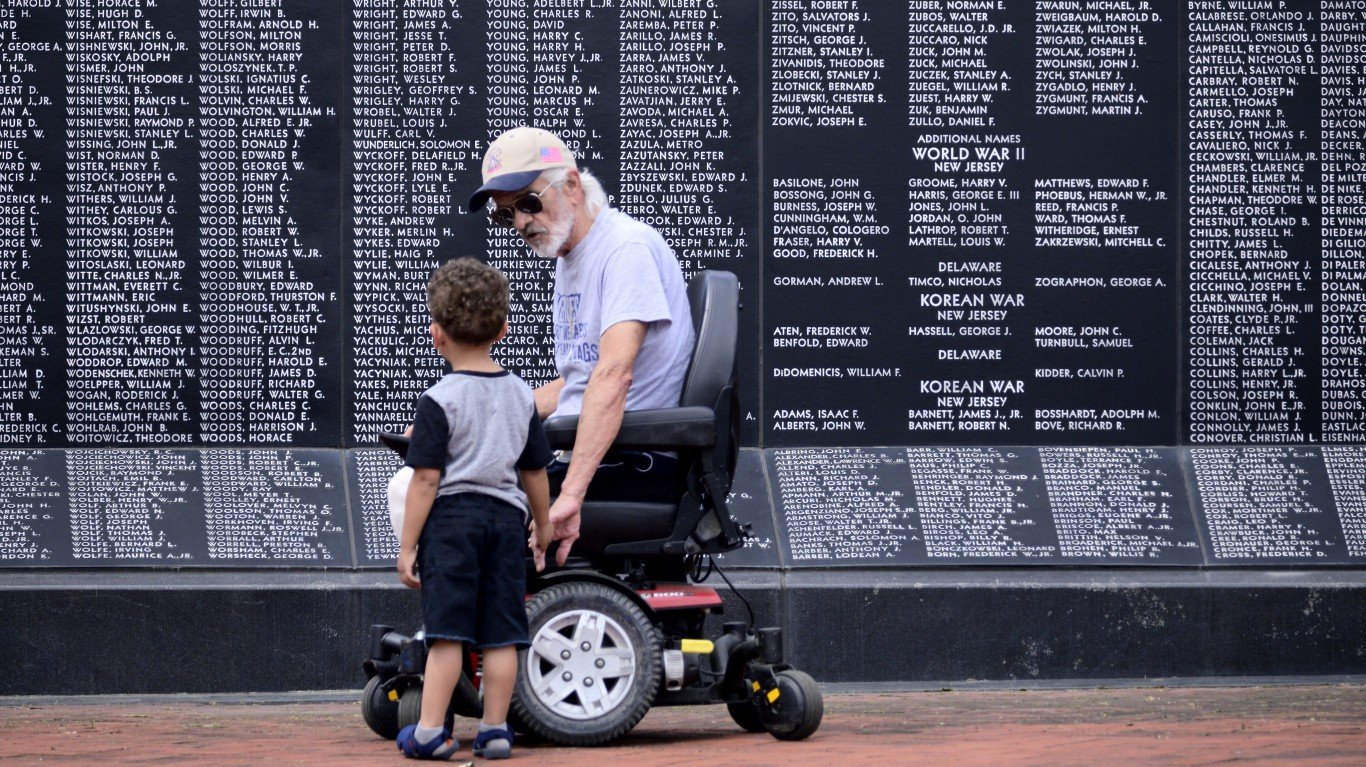
The human toll of American military conflicts extends far beyond those killed or missing in action. About 30% of veterans nationwide have a disability, and about 41% of Americans who have served since Sept. 11 2001 have a disability connected with their service. These typically include missing limbs, burns, spinal cord injuries, post traumatic stress disorder, hearing loss, and traumatic brain injuries.
While there are some exceptions, many of the states that are home to a large concentration of veterans are also home to major military bases as well as a high concentration of active duty troops. Here is a look at America’s largest military bases.
Click here to see the states with the most veterans.
To determine the states with the most veterans, 24/7 Wall St. reviewed data on veteran status from the U.S Census Bureau’s 2019 American Community Survey. States were ranked based on the number of veterans as a percentage of the 18 and older population. Supplemental data on veteran median income, disability status, labor force participation rates (the percentage of working-age veterans who are employed or looking for work), and percentage of veterans that fought in each major U.S war also came from the ACS.

50. New York
> Veteran population: 4.3% of adults (655,055 total)
> Post Sept. 11, 2001 era veterans: 16.9% of vets — 11th lowest (110,745 total)
> Gulf War era veterans, 1990-2001: 15.9% of vets — 6th lowest (104,001 total)
> Vietnam War era veterans: 35.6% of vets — 12th lowest (233,366 total)
> Korean War veterans: 8.9% of vets — 4th highest (58,216 total)
> WWII veterans: 3.5% of vets — 3rd highest (22,743 total)
> Veteran population with a disability: 28.3% — 11th lowest
[in-text-ad]

49. New Jersey
> Veteran population: 4.4% of adults (302,777 total)
> Post Sept. 11, 2001 era veterans: 14.9% of vets — 3rd lowest (45,223 total)
> Gulf War era veterans, 1990-2001: 14.6% of vets — the lowest (44,309 total)
> Vietnam War era veterans: 36.8% of vets — 21st highest (111,485 total)
> Korean War veterans: 9.9% of vets — 3rd highest (30,074 total)
> WWII veterans: 3.3% of vets — 4th highest (9,932 total)
> Veteran population with a disability: 28.8% — 16th lowest
[recirclink id=805246]

48. California
> Veteran population: 4.8% of adults (1,471,467 total)
> Post Sept. 11, 2001 era veterans: 21.8% of vets — 21st highest (320,701 total)
> Gulf War era veterans, 1990-2001: 19.1% of vets — 16th lowest (280,799 total)
> Vietnam War era veterans: 36.1% of vets — 20th lowest (530,839 total)
> Korean War veterans: 7.6% of vets — 12th highest (111,163 total)
> WWII veterans: 2.7% of vets — 10th highest (40,005 total)
> Veteran population with a disability: 30.2% — 21st highest

47. Massachusetts
> Veteran population: 5.0% of adults (277,814 total)
> Post Sept. 11, 2001 era veterans: 16.6% of vets — 7th lowest (46,127 total)
> Gulf War era veterans, 1990-2001: 15.5% of vets — 4th lowest (43,091 total)
> Vietnam War era veterans: 36.1% of vets — 20th lowest (100,219 total)
> Korean War veterans: 10.1% of vets — 2nd highest (28,147 total)
> WWII veterans: 3.9% of vets — 2nd highest (10,939 total)
> Veteran population with a disability: 29.3% — 21st lowest
[in-text-ad-2]

46. Utah
> Veteran population: 5.1% of adults (115,363 total)
> Post Sept. 11, 2001 era veterans: 27.1% of vets — 8th highest (31,273 total)
> Gulf War era veterans, 1990-2001: 23.9% of vets — 11th highest (27,552 total)
> Vietnam War era veterans: 36.3% of vets — 24th lowest (41,907 total)
> Korean War veterans: 7.0% of vets — 19th highest (8,096 total)
> WWII veterans: 2.7% of vets — 10th highest (3,083 total)
> Veteran population with a disability: 27.7% — 6th lowest

45. Illinois
> Veteran population: 5.3% of adults (526,153 total)
> Post Sept. 11, 2001 era veterans: 17.9% of vets — 16th lowest (94,140 total)
> Gulf War era veterans, 1990-2001: 18.5% of vets — 13th lowest (97,146 total)
> Vietnam War era veterans: 36.9% of vets — 18th highest (193,938 total)
> Korean War veterans: 7.4% of vets — 14th highest (39,058 total)
> WWII veterans: 2.8% of vets — 8th highest (14,507 total)
> Veteran population with a disability: 29.5% — 22nd lowest
[in-text-ad]

44. Connecticut
> Veteran population: 5.5% of adults (156,499 total)
> Post Sept. 11, 2001 era veterans: 16.8% of vets — 10th lowest (26,324 total)
> Gulf War era veterans, 1990-2001: 15.8% of vets — 5th lowest (24,788 total)
> Vietnam War era veterans: 35.9% of vets — 16th lowest (56,209 total)
> Korean War veterans: 10.2% of vets — the highest (15,900 total)
> WWII veterans: 3.3% of vets — 4th highest (5,122 total)
> Veteran population with a disability: 27.3% — 5th lowest
[recirclink id=934583]
43. Rhode Island
> Veteran population: 5.8% of adults (49,471 total)
> Post Sept. 11, 2001 era veterans: 13.7% of vets — the lowest (6,786 total)
> Gulf War era veterans, 1990-2001: 14.7% of vets — 2nd lowest (7,258 total)
> Vietnam War era veterans: 39.3% of vets — 5th highest (19,445 total)
> Korean War veterans: 8.1% of vets — 8th highest (3,999 total)
> WWII veterans: 4.5% of vets — the highest (2,221 total)
> Veteran population with a disability: 28.7% — 15th lowest

42. Minnesota
> Veteran population: 6.4% of adults (276,686 total)
> Post Sept. 11, 2001 era veterans: 16.1% of vets — 6th lowest (44,628 total)
> Gulf War era veterans, 1990-2001: 15.5% of vets — 4th lowest (42,968 total)
> Vietnam War era veterans: 40.5% of vets — the highest (112,039 total)
> Korean War veterans: 8.4% of vets — 7th highest (23,233 total)
> WWII veterans: 3.0% of vets — 6th highest (8,243 total)
> Veteran population with a disability: 28.1% — 7th lowest
[in-text-ad-2]

41. Louisiana
> Veteran population: 6.5% of adults (229,938 total)
> Post Sept. 11, 2001 era veterans: 21.6% of vets — 23rd highest (49,732 total)
> Gulf War era veterans, 1990-2001: 23.6% of vets — 14th highest (54,340 total)
> Vietnam War era veterans: 36.5% of vets — 25th lowest (83,972 total)
> Korean War veterans: 6.0% of vets — 18th lowest (13,684 total)
> WWII veterans: 1.4% of vets — 8th lowest (3,177 total)
> Veteran population with a disability: 34.1% — 7th highest

40. Texas
> Veteran population: 6.5% of adults (1,405,059 total)
> Post Sept. 11, 2001 era veterans: 28.3% of vets — 6th highest (397,443 total)
> Gulf War era veterans, 1990-2001: 27.1% of vets — 6th highest (380,664 total)
> Vietnam War era veterans: 32.2% of vets — 6th lowest (452,138 total)
> Korean War veterans: 4.7% of vets — 4th lowest (65,997 total)
> WWII veterans: 1.5% of vets — 10th lowest (21,107 total)
> Veteran population with a disability: 29.3% — 21st lowest
[in-text-ad]

39. Michigan
> Veteran population: 6.6% of adults (520,129 total)
> Post Sept. 11, 2001 era veterans: 14.4% of vets — 2nd lowest (74,756 total)
> Gulf War era veterans, 1990-2001: 17.6% of vets — 10th lowest (91,434 total)
> Vietnam War era veterans: 38.2% of vets — 8th highest (198,760 total)
> Korean War veterans: 7.4% of vets — 14th highest (38,549 total)
> WWII veterans: 2.4% of vets — 18th highest (12,468 total)
> Veteran population with a disability: 31.4% — 17th highest
[recirclink id=847654]
38. Mississippi
> Veteran population: 6.8% of adults (153,873 total)
> Post Sept. 11, 2001 era veterans: 25.6% of vets — 9th highest (39,382 total)
> Gulf War era veterans, 1990-2001: 23.1% of vets — 16th highest (35,560 total)
> Vietnam War era veterans: 34.7% of vets — 10th lowest (53,322 total)
> Korean War veterans: 5.5% of vets — 13th lowest (8,413 total)
> WWII veterans: 1.8% of vets — 19th lowest (2,832 total)
> Veteran population with a disability: 32.7% — 14th highest

37. Vermont
> Veteran population: 6.9% of adults (35,114 total)
> Post Sept. 11, 2001 era veterans: 17.4% of vets — 13th lowest (6,106 total)
> Gulf War era veterans, 1990-2001: 16.5% of vets — 7th lowest (5,778 total)
> Vietnam War era veterans: 38.0% of vets — 10th highest (13,349 total)
> Korean War veterans: 8.5% of vets — 6th highest (2,969 total)
> WWII veterans: 1.9% of vets — 24th lowest (673 total)
> Veteran population with a disability: 34.0% — 8th highest
[in-text-ad-2]

36. Wisconsin
> Veteran population: 6.9% of adults (315,574 total)
> Post Sept. 11, 2001 era veterans: 18.1% of vets — 17th lowest (57,098 total)
> Gulf War era veterans, 1990-2001: 17.3% of vets — 9th lowest (54,532 total)
> Vietnam War era veterans: 36.8% of vets — 21st highest (116,252 total)
> Korean War veterans: 7.5% of vets — 13th highest (23,729 total)
> WWII veterans: 2.6% of vets — 14th highest (8,219 total)
> Veteran population with a disability: 28.3% — 11th lowest

35. Pennsylvania
> Veteran population: 7.0% of adults (710,375 total)
> Post Sept. 11, 2001 era veterans: 16.0% of vets — 5th lowest (113,345 total)
> Gulf War era veterans, 1990-2001: 17.0% of vets — 8th lowest (120,576 total)
> Vietnam War era veterans: 36.7% of vets — 23rd highest (261,036 total)
> Korean War veterans: 8.6% of vets — 5th highest (61,103 total)
> WWII veterans: 2.9% of vets — 7th highest (20,941 total)
> Veteran population with a disability: 29.6% — 24th lowest
[in-text-ad]

34. Indiana
> Veteran population: 7.1% of adults (364,594 total)
> Post Sept. 11, 2001 era veterans: 19.3% of vets — 21st lowest (70,465 total)
> Gulf War era veterans, 1990-2001: 19.3% of vets — 17th lowest (70,206 total)
> Vietnam War era veterans: 35.8% of vets — 15th lowest (130,344 total)
> Korean War veterans: 6.4% of vets — 22nd lowest (23,179 total)
> WWII veterans: 2.6% of vets — 14th highest (9,393 total)
> Veteran population with a disability: 31.4% — 17th highest
[recirclink id=709696]

33. Kentucky
> Veteran population: 7.2% of adults (250,036 total)
> Post Sept. 11, 2001 era veterans: 19.5% of vets — 22nd lowest (48,758 total)
> Gulf War era veterans, 1990-2001: 23.1% of vets — 16th highest (57,812 total)
> Vietnam War era veterans: 37.8% of vets — 11th highest (94,519 total)
> Korean War veterans: 4.8% of vets — 5th lowest (12,105 total)
> WWII veterans: 2.1% of vets — 23rd highest (5,346 total)
> Veteran population with a disability: 34.3% — 5th highest

32. Ohio
> Veteran population: 7.3% of adults (663,232 total)
> Post Sept. 11, 2001 era veterans: 17.6% of vets — 15th lowest (116,602 total)
> Gulf War era veterans, 1990-2001: 19.0% of vets — 14th lowest (126,219 total)
> Vietnam War era veterans: 36.2% of vets — 22nd lowest (239,819 total)
> Korean War veterans: 6.4% of vets — 22nd lowest (42,642 total)
> WWII veterans: 2.7% of vets — 10th highest (17,684 total)
> Veteran population with a disability: 28.7% — 15th lowest
[in-text-ad-2]

31. Maryland
> Veteran population: 7.5% of adults (350,423 total)
> Post Sept. 11, 2001 era veterans: 28.3% of vets — 6th highest (99,113 total)
> Gulf War era veterans, 1990-2001: 28.3% of vets — 3rd highest (99,269 total)
> Vietnam War era veterans: 30.1% of vets — 2nd lowest (105,641 total)
> Korean War veterans: 5.3% of vets — 11th lowest (18,440 total)
> WWII veterans: 1.9% of vets — 24th lowest (6,529 total)
> Veteran population with a disability: 23.0% — 2nd lowest

30. Kansas
> Veteran population: 7.5% of adults (165,033 total)
> Post Sept. 11, 2001 era veterans: 20.9% of vets — 25th lowest (34,520 total)
> Gulf War era veterans, 1990-2001: 20.2% of vets — 21st lowest (33,274 total)
> Vietnam War era veterans: 37.2% of vets — 14th highest (61,445 total)
> Korean War veterans: 8.1% of vets — 8th highest (13,342 total)
> WWII veterans: 2.3% of vets — 20th highest (3,821 total)
> Veteran population with a disability: 32.5% — 15th highest
[in-text-ad]

29. Iowa
> Veteran population: 7.6% of adults (185,254 total)
> Post Sept. 11, 2001 era veterans: 18.4% of vets — 18th lowest (34,076 total)
> Gulf War era veterans, 1990-2001: 19.1% of vets — 16th lowest (35,416 total)
> Vietnam War era veterans: 36.2% of vets — 22nd lowest (67,036 total)
> Korean War veterans: 7.7% of vets — 10th highest (14,336 total)
> WWII veterans: 2.8% of vets — 8th highest (5,216 total)
> Veteran population with a disability: 28.7% — 15th lowest
[recirclink id=805246]

28. Georgia
> Veteran population: 7.6% of adults (616,527 total)
> Post Sept. 11, 2001 era veterans: 25.3% of vets — 10th highest (155,765 total)
> Gulf War era veterans, 1990-2001: 27.8% of vets — 5th highest (171,270 total)
> Vietnam War era veterans: 31.3% of vets — 4th lowest (192,966 total)
> Korean War veterans: 5.3% of vets — 11th lowest (32,372 total)
> WWII veterans: 1.2% of vets — 5th lowest (7,541 total)
> Veteran population with a disability: 29.1% — 19th lowest

27. Nebraska
> Veteran population: 7.7% of adults (112,177 total)
> Post Sept. 11, 2001 era veterans: 22.3% of vets — 18th highest (24,976 total)
> Gulf War era veterans, 1990-2001: 22.1% of vets — 20th highest (24,844 total)
> Vietnam War era veterans: 36.1% of vets — 20th lowest (40,484 total)
> Korean War veterans: 7.3% of vets — 16th highest (8,189 total)
> WWII veterans: 2.4% of vets — 18th highest (2,718 total)
> Veteran population with a disability: 30.0% — 23rd highest
[in-text-ad-2]

26. Oregon
> Veteran population: 7.9% of adults (263,885 total)
> Post Sept. 11, 2001 era veterans: 17.6% of vets — 15th lowest (46,341 total)
> Gulf War era veterans, 1990-2001: 18.0% of vets — 11th lowest (47,505 total)
> Vietnam War era veterans: 37.8% of vets — 11th highest (99,655 total)
> Korean War veterans: 6.5% of vets — 25th lowest (17,278 total)
> WWII veterans: 2.5% of vets — 16th highest (6,694 total)
> Veteran population with a disability: 34.5% — 4th highest

25. North Carolina
> Veteran population: 7.9% of adults (641,993 total)
> Post Sept. 11, 2001 era veterans: 23.4% of vets — 14th highest (150,211 total)
> Gulf War era veterans, 1990-2001: 25.1% of vets — 9th highest (161,206 total)
> Vietnam War era veterans: 33.8% of vets — 7th lowest (217,169 total)
> Korean War veterans: 5.6% of vets — 15th lowest (36,125 total)
> WWII veterans: 1.9% of vets — 24th lowest (12,157 total)
> Veteran population with a disability: 29.8% — 25th lowest
[in-text-ad]

24. Tennessee
> Veteran population: 8.0% of adults (422,161 total)
> Post Sept. 11, 2001 era veterans: 22.1% of vets — 19th highest (93,283 total)
> Gulf War era veterans, 1990-2001: 23.5% of vets — 15th highest (99,279 total)
> Vietnam War era veterans: 36.9% of vets — 18th highest (155,904 total)
> Korean War veterans: 5.2% of vets — 9th lowest (21,830 total)
> WWII veterans: 1.2% of vets — 5th lowest (5,276 total)
> Veteran population with a disability: 33.2% — 11th highest
[recirclink id=934583]

23. North Dakota
> Veteran population: 8.0% of adults (46,041 total)
> Post Sept. 11, 2001 era veterans: 29.8% of vets — 3rd highest (13,698 total)
> Gulf War era veterans, 1990-2001: 20.7% of vets — 25th highest (9,544 total)
> Vietnam War era veterans: 36.1% of vets — 20th lowest (16,626 total)
> Korean War veterans: 5.0% of vets — 7th lowest (2,315 total)
> WWII veterans: 1.7% of vets — 15th lowest (791 total)
> Veteran population with a disability: 28.3% — 11th lowest
22. Arkansas
> Veteran population: 8.0% of adults (184,996 total)
> Post Sept. 11, 2001 era veterans: 21.8% of vets — 21st highest (40,383 total)
> Gulf War era veterans, 1990-2001: 20.6% of vets — 23rd lowest (38,136 total)
> Vietnam War era veterans: 38.1% of vets — 9th highest (70,549 total)
> Korean War veterans: 6.7% of vets — 23rd highest (12,318 total)
> WWII veterans: 1.5% of vets — 10th lowest (2,824 total)
> Veteran population with a disability: 36.7% — 3rd highest
[in-text-ad-2]

21. Missouri
> Veteran population: 8.1% of adults (382,548 total)
> Post Sept. 11, 2001 era veterans: 19.7% of vets — 23rd lowest (75,445 total)
> Gulf War era veterans, 1990-2001: 20.0% of vets — 19th lowest (76,589 total)
> Vietnam War era veterans: 37.1% of vets — 15th highest (141,776 total)
> Korean War veterans: 6.7% of vets — 23rd highest (25,498 total)
> WWII veterans: 2.0% of vets — 25th lowest (7,729 total)
> Veteran population with a disability: 33.1% — 12th highest

20. Florida
> Veteran population: 8.2% of adults (1,402,264 total)
> Post Sept. 11, 2001 era veterans: 19.3% of vets — 21st lowest (271,177 total)
> Gulf War era veterans, 1990-2001: 22.1% of vets — 20th highest (310,354 total)
> Vietnam War era veterans: 37.0% of vets — 16th highest (518,426 total)
> Korean War veterans: 7.7% of vets — 10th highest (107,587 total)
> WWII veterans: 2.3% of vets — 20th highest (32,234 total)
> Veteran population with a disability: 30.1% — 22nd highest
[in-text-ad]

19. Colorado
> Veteran population: 8.2% of adults (367,292 total)
> Post Sept. 11, 2001 era veterans: 29.2% of vets — 4th highest (107,390 total)
> Gulf War era veterans, 1990-2001: 28.0% of vets — 4th highest (102,776 total)
> Vietnam War era veterans: 31.6% of vets — 5th lowest (116,159 total)
> Korean War veterans: 5.2% of vets — 9th lowest (19,126 total)
> WWII veterans: 1.8% of vets — 19th lowest (6,563 total)
> Veteran population with a disability: 26.6% — 4th lowest
[recirclink id=847654]
18. Alabama
> Veteran population: 8.4% of adults (318,254 total)
> Post Sept. 11, 2001 era veterans: 24.3% of vets — 13th highest (77,447 total)
> Gulf War era veterans, 1990-2001: 25.5% of vets — 8th highest (81,064 total)
> Vietnam War era veterans: 35.6% of vets — 12th lowest (113,331 total)
> Korean War veterans: 6.1% of vets — 19th lowest (19,449 total)
> WWII veterans: 1.1% of vets — 3rd lowest (3,378 total)
> Veteran population with a disability: 33.3% — 10th highest

17. New Mexico
> Veteran population: 8.4% of adults (135,230 total)
> Post Sept. 11, 2001 era veterans: 20.1% of vets — 24th lowest (27,198 total)
> Gulf War era veterans, 1990-2001: 20.7% of vets — 25th highest (27,981 total)
> Vietnam War era veterans: 39.7% of vets — 3rd highest (53,723 total)
> Korean War veterans: 6.9% of vets — 20th highest (9,320 total)
> WWII veterans: 2.1% of vets — 23rd highest (2,814 total)
> Veteran population with a disability: 33.9% — 9th highest
[in-text-ad-2]

16. Hawaii
> Veteran population: 8.5% of adults (90,368 total)
> Post Sept. 11, 2001 era veterans: 28.6% of vets — 5th highest (25,810 total)
> Gulf War era veterans, 1990-2001: 23.1% of vets — 16th highest (20,861 total)
> Vietnam War era veterans: 34.4% of vets — 8th lowest (31,114 total)
> Korean War veterans: 7.1% of vets — 17th highest (6,430 total)
> WWII veterans: 1.9% of vets — 24th lowest (1,709 total)
> Veteran population with a disability: 28.4% — 12th lowest

15. West Virginia
> Veteran population: 8.5% of adults (121,084 total)
> Post Sept. 11, 2001 era veterans: 16.7% of vets — 9th lowest (20,244 total)
> Gulf War era veterans, 1990-2001: 19.8% of vets — 18th lowest (24,013 total)
> Vietnam War era veterans: 38.5% of vets — 6th highest (46,651 total)
> Korean War veterans: 6.8% of vets — 21st highest (8,272 total)
> WWII veterans: 1.8% of vets — 19th lowest (2,207 total)
> Veteran population with a disability: 37.0% — 2nd highest
[in-text-ad]

14. New Hampshire
> Veteran population: 8.5% of adults (93,866 total)
> Post Sept. 11, 2001 era veterans: 17.0% of vets — 12th lowest (15,959 total)
> Gulf War era veterans, 1990-2001: 18.5% of vets — 13th lowest (17,355 total)
> Vietnam War era veterans: 37.0% of vets — 16th highest (34,720 total)
> Korean War veterans: 6.5% of vets — 25th lowest (6,118 total)
> WWII veterans: 2.1% of vets — 23rd highest (1,983 total)
> Veteran population with a disability: 28.9% — 17th lowest
[recirclink id=709696]

13. Arizona
> Veteran population: 8.5% of adults (478,354 total)
> Post Sept. 11, 2001 era veterans: 21.2% of vets — 25th highest (101,464 total)
> Gulf War era veterans, 1990-2001: 21.6% of vets — 22nd highest (103,274 total)
> Vietnam War era veterans: 38.5% of vets — 6th highest (184,351 total)
> Korean War veterans: 7.1% of vets — 17th highest (34,048 total)
> WWII veterans: 1.7% of vets — 15th lowest (8,122 total)
> Veteran population with a disability: 31.1% — 19th highest

12. South Dakota
> Veteran population: 8.6% of adults (57,032 total)
> Post Sept. 11, 2001 era veterans: 21.9% of vets — 20th highest (12,477 total)
> Gulf War era veterans, 1990-2001: 20.7% of vets — 25th highest (11,782 total)
> Vietnam War era veterans: 36.7% of vets — 23rd highest (20,946 total)
> Korean War veterans: 6.6% of vets — 25th highest (3,776 total)
> WWII veterans: 2.7% of vets — 10th highest (1,517 total)
> Veteran population with a disability: 34.3% — 5th highest
[in-text-ad-2]
11. Oklahoma
> Veteran population: 8.8% of adults (261,559 total)
> Post Sept. 11, 2001 era veterans: 25.3% of vets — 10th highest (66,142 total)
> Gulf War era veterans, 1990-2001: 23.7% of vets — 13th highest (61,870 total)
> Vietnam War era veterans: 35.7% of vets — 13th lowest (93,426 total)
> Korean War veterans: 5.7% of vets — 16th lowest (14,848 total)
> WWII veterans: 1.9% of vets — 24th lowest (4,939 total)
> Veteran population with a disability: 37.3% — the highest

10. South Carolina
> Veteran population: 8.9% of adults (354,669 total)
> Post Sept. 11, 2001 era veterans: 21.4% of vets — 24th highest (75,775 total)
> Gulf War era veterans, 1990-2001: 25.9% of vets — 7th highest (91,889 total)
> Vietnam War era veterans: 36.6% of vets — 25th highest (129,901 total)
> Korean War veterans: 4.9% of vets — 6th lowest (17,351 total)
> WWII veterans: 1.3% of vets — 6th lowest (4,543 total)
> Veteran population with a disability: 30.0% — 23rd highest
[in-text-ad]
9. Washington
> Veteran population: 8.9% of adults (523,852 total)
> Post Sept. 11, 2001 era veterans: 24.6% of vets — 12th highest (129,071 total)
> Gulf War era veterans, 1990-2001: 24.3% of vets — 10th highest (127,421 total)
> Vietnam War era veterans: 35.8% of vets — 15th lowest (187,619 total)
> Korean War veterans: 4.7% of vets — 4th lowest (24,808 total)
> WWII veterans: 1.8% of vets — 19th lowest (9,374 total)
> Veteran population with a disability: 29.6% — 24th lowest
[recirclink id=805246]
8. Maine
> Veteran population: 8.9% of adults (97,439 total)
> Post Sept. 11, 2001 era veterans: 16.7% of vets — 9th lowest (16,300 total)
> Gulf War era veterans, 1990-2001: 20.1% of vets — 20th lowest (19,568 total)
> Vietnam War era veterans: 40.3% of vets — 2nd highest (39,284 total)
> Korean War veterans: 6.8% of vets — 21st highest (6,635 total)
> WWII veterans: 2.5% of vets — 16th highest (2,391 total)
> Veteran population with a disability: 32.5% — 15th highest

7. Nevada
> Veteran population: 8.9% of adults (212,507 total)
> Post Sept. 11, 2001 era veterans: 23.3% of vets — 15th highest (49,443 total)
> Gulf War era veterans, 1990-2001: 23.8% of vets — 12th highest (50,602 total)
> Vietnam War era veterans: 34.5% of vets — 9th lowest (73,359 total)
> Korean War veterans: 5.8% of vets — 17th lowest (12,362 total)
> WWII veterans: 1.6% of vets — 13th lowest (3,445 total)
> Veteran population with a disability: 28.2% — 8th lowest
[in-text-ad-2]
6. Delaware
> Veteran population: 8.9% of adults (68,252 total)
> Post Sept. 11, 2001 era veterans: 16.0% of vets — 5th lowest (10,946 total)
> Gulf War era veterans, 1990-2001: 21.6% of vets — 22nd highest (14,748 total)
> Vietnam War era veterans: 39.5% of vets — 4th highest (26,937 total)
> Korean War veterans: 6.4% of vets — 22nd lowest (4,393 total)
> WWII veterans: 2.2% of vets — 22nd highest (1,527 total)
> Veteran population with a disability: 30.0% — 23rd highest

5. Idaho
> Veteran population: 9.1% of adults (120,919 total)
> Post Sept. 11, 2001 era veterans: 19.1% of vets — 19th lowest (23,149 total)
> Gulf War era veterans, 1990-2001: 20.5% of vets — 22nd lowest (24,830 total)
> Vietnam War era veterans: 37.6% of vets — 13th highest (45,521 total)
> Korean War veterans: 6.5% of vets — 25th lowest (7,859 total)
> WWII veterans: 1.6% of vets — 13th lowest (1,959 total)
> Veteran population with a disability: 33.1% — 12th highest
[in-text-ad]
4. Wyoming
> Veteran population: 9.4% of adults (41,390 total)
> Post Sept. 11, 2001 era veterans: 22.5% of vets — 17th highest (9,324 total)
> Gulf War era veterans, 1990-2001: 22.8% of vets — 19th highest (9,424 total)
> Vietnam War era veterans: 36.3% of vets — 24th lowest (15,005 total)
> Korean War veterans: 5.6% of vets — 15th lowest (2,303 total)
> WWII veterans: 0.2% of vets — the lowest (90 total)
> Veteran population with a disability: 29.1% — 19th lowest
[recirclink id=934583]

3. Virginia
> Veteran population: 10.0% of adults (655,698 total)
> Post Sept. 11, 2001 era veterans: 33.1% of vets — 2nd highest (216,986 total)
> Gulf War era veterans, 1990-2001: 34.6% of vets — the highest (227,169 total)
> Vietnam War era veterans: 29.8% of vets — the lowest (195,310 total)
> Korean War veterans: 4.7% of vets — 4th lowest (31,074 total)
> WWII veterans: 1.4% of vets — 8th lowest (9,046 total)
> Veteran population with a disability: 22.4% — the lowest

2. Montana
> Veteran population: 10.3% of adults (86,270 total)
> Post Sept. 11, 2001 era veterans: 22.6% of vets — 16th highest (19,478 total)
> Gulf War era veterans, 1990-2001: 21.0% of vets — 24th highest (18,086 total)
> Vietnam War era veterans: 36.9% of vets — 18th highest (31,792 total)
> Korean War veterans: 5.5% of vets — 13th lowest (4,736 total)
> WWII veterans: 1.6% of vets — 13th lowest (1,416 total)
> Veteran population with a disability: 30.6% — 20th highest
[in-text-ad-2]

1. Alaska
> Veteran population: 10.7% of adults (57,225 total)
> Post Sept. 11, 2001 era veterans: 35.0% of vets — the highest (20,032 total)
> Gulf War era veterans, 1990-2001: 33.8% of vets — 2nd highest (19,323 total)
> Vietnam War era veterans: 30.2% of vets — 3rd lowest (17,267 total)
> Korean War veterans: 2.7% of vets — the lowest (1,545 total)
> WWII veterans: 1.0% of vets — 2nd lowest (568 total)
> Veteran population with a disability: 24.1% — 3rd lowest
Contact [email protected] for any questions or corrections.