The United States is the only industrialized country in the world without universal health care — and as a result, most Americans under age 65 receive employer-based health insurance coverage. Under this system, an estimated 28.9 million Americans under 65 were uninsured in 2019 — before the COVID-19 pandemic put over 22 million Americans out of work.
While most of those jobs have since been restored, the official uninsured rate for Americans under 65 in 2020 will likely be higher than the 10.8% rate in 2019 — a continuation of the three-year trend of declining insurance coverage that began in 2017. Still, there are parts of the country where nearly every American under 65 is insured, either through their employer, Medicaid, or directly-purchased coverage.
Using data from the U.S. Census Bureau, 24/7 Wall St. identified the metropolitan area in every state with the best health insurance coverage. Metro areas are ranked based on the share of residents under age 65 — the age of eligibility for Medicare — who are uninsured. It is important to note that Delaware, New Hampshire, Rhode Island, and Vermont each have only one metropolitan area, and as a result, these places rank as having the best health insurance coverage by default only.
Uninsured rates vary considerably across the country, and as a result, a metro area’s ranking on this list does not necessarily mean the uninsured rate is low relative to the nation as a whole. In eight states, mostly located in the South, the lowest uninsured rate among metro areas is higher than the national rate. Uninsured rates in the metropolitan areas on this list range from 3.2% to 14.2%.
Click here to see the metro with the best health insurance coverage.
Click here to see our detailed methodology.

Alabama: Auburn-Opelika
> Americans under 65, no health insurance: 8.1% (Alabama: 11.7%)
> Americans under 65, Medicare coverage (or multiple types): 2.1% (Alabama: 4.8%)
> Americans under 65, Medicaid coverage (or multiple types): 14.6% (Alabama: 20.8%)
> Americans under 65, VA coverage (or multiple types): 2.2% (Alabama: 1.6%)
> Americans under 65, employer-based insurance (or multiple types): 64.6% (Alabama: 58.2%)
> Americans under 65, direct-purchase insurance (or multiple types): 12.8% (Alabama: 9.7%)
> Americans under 65, Tricare/military insurance (or many types): 5.1% (Alabama: 3.6%)
[in-text-ad]
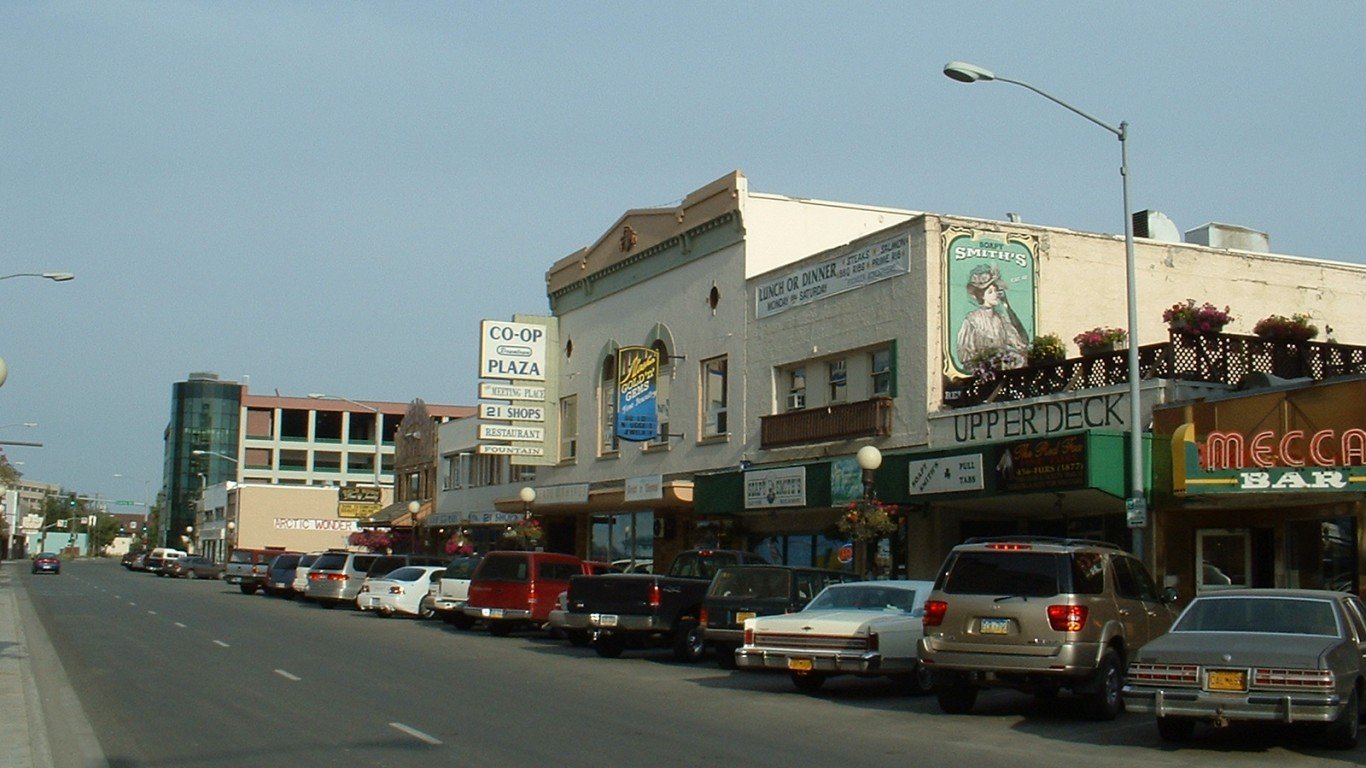
Alaska: Fairbanks
> Americans under 65, no health insurance: 9.3% (Alaska: 13.9%)
> Americans under 65, Medicare coverage (or multiple types): 0.9% (Alaska: 2.3%)
> Americans under 65, Medicaid coverage (or multiple types): 13.0% (Alaska: 22.8%)
> Americans under 65, VA coverage (or multiple types): 3.7% (Alaska: 3.1%)
> Americans under 65, employer-based insurance (or multiple types): 58.6% (Alaska: 55.0%)
> Americans under 65, direct-purchase insurance (or multiple types): 7.4% (Alaska: 6.4%)
> Americans under 65, Tricare/military insurance (or many types): 23.2% (Alaska: 9.6%)
[recirclink id=497059]
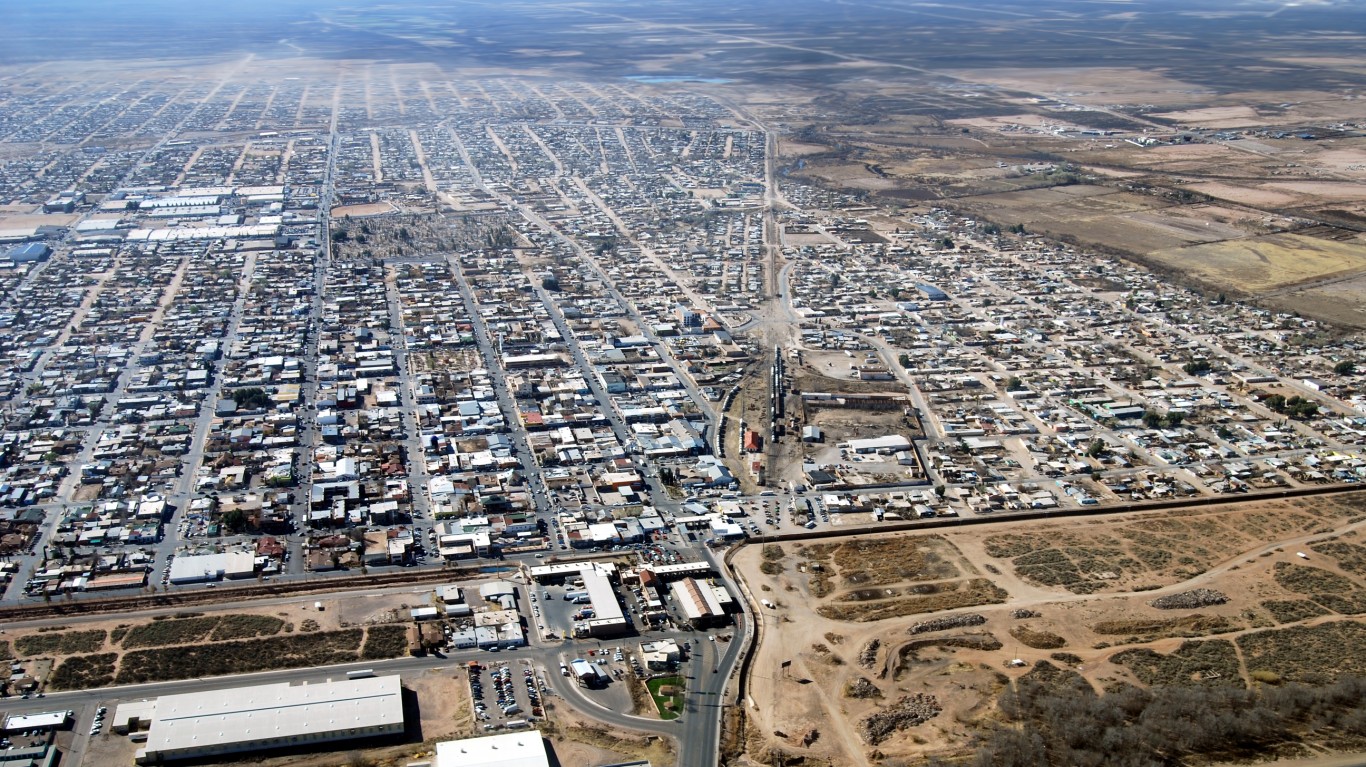
Arizona: Sierra Vista-Douglas
> Americans under 65, no health insurance: 9.4% (Arizona: 13.6%)
> Americans under 65, Medicare coverage (or multiple types): 3.5% (Arizona: 2.8%)
> Americans under 65, Medicaid coverage (or multiple types): 32.3% (Arizona: 22.8%)
> Americans under 65, VA coverage (or multiple types): 4.9% (Arizona: 1.6%)
> Americans under 65, employer-based insurance (or multiple types): 45.5% (Arizona: 56.2%)
> Americans under 65, direct-purchase insurance (or multiple types): 8.7% (Arizona: 8.5%)
> Americans under 65, Tricare/military insurance (or many types): 13.1% (Arizona: 2.4%)
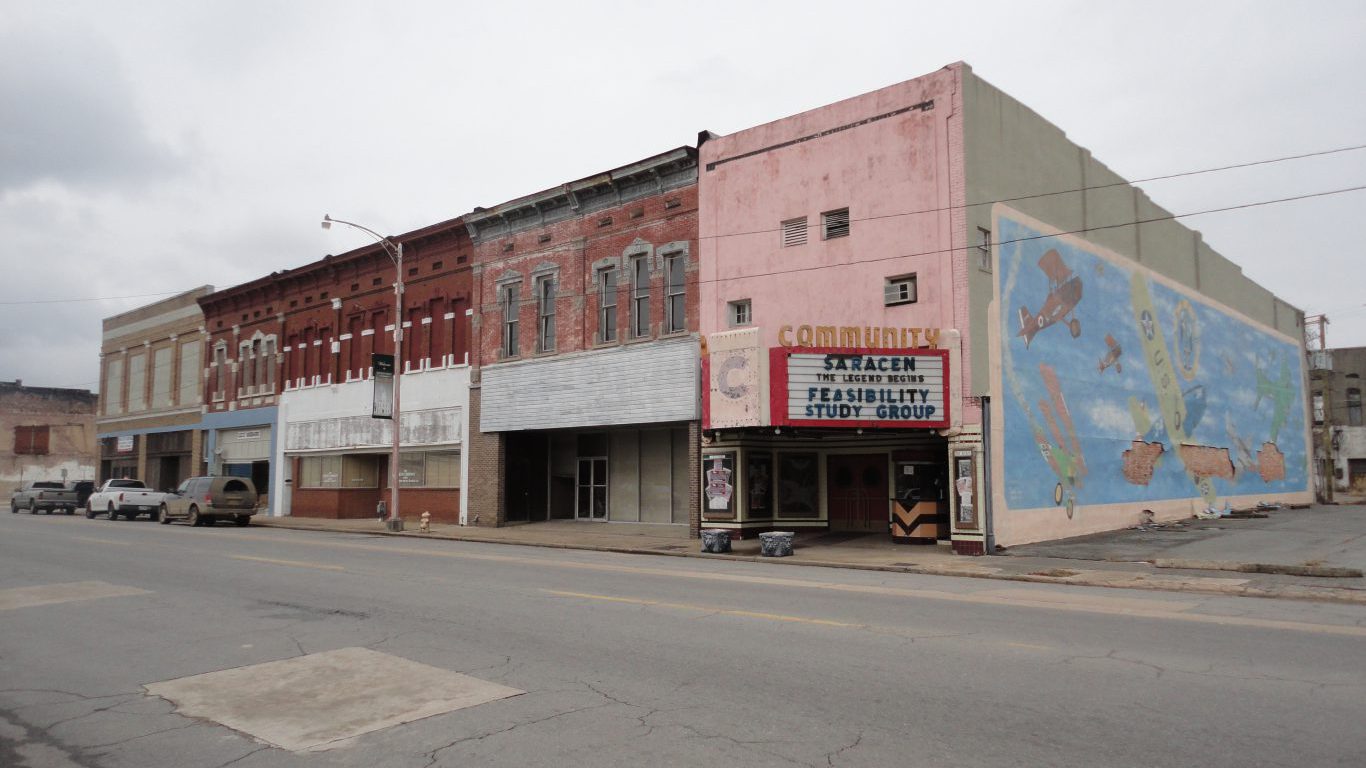
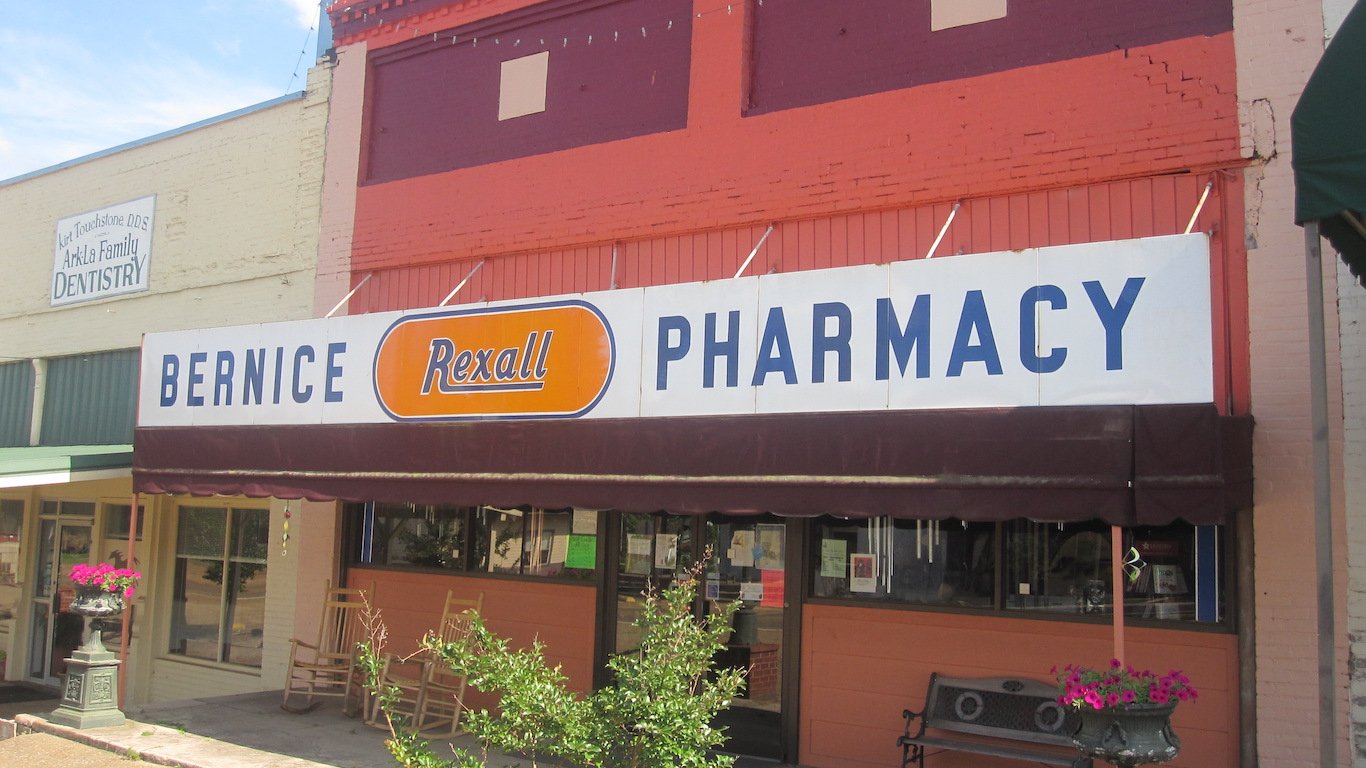
Arkansas: Pine Bluff
> Americans under 65, no health insurance: 8.8% (Arkansas: 10.9%)
> Americans under 65, Medicare coverage (or multiple types): 7.0% (Arkansas: 4.9%)
> Americans under 65, Medicaid coverage (or multiple types): 30.2% (Arkansas: 29.1%)
> Americans under 65, VA coverage (or multiple types): 0.8% (Arkansas: 1.7%)
> Americans under 65, employer-based insurance (or multiple types): 52.5% (Arkansas: 51.4%)
> Americans under 65, direct-purchase insurance (or multiple types): 10.3% (Arkansas: 9.1%)
> Americans under 65, Tricare/military insurance (or many types): 0.5% (Arkansas: 2.0%)
[in-text-ad-2]

California: San Francisco-Oakland-Berkeley
> Americans under 65, no health insurance: 5.0% (California: 8.9%)
> Americans under 65, Medicare coverage (or multiple types): 1.4% (California: 2.1%)
> Americans under 65, Medicaid coverage (or multiple types): 17.0% (California: 26.4%)
> Americans under 65, VA coverage (or multiple types): 0.5% (California: 0.9%)
> Americans under 65, employer-based insurance (or multiple types): 70.1% (California: 56.9%)
> Americans under 65, direct-purchase insurance (or multiple types): 11.2% (California: 10.4%)
> Americans under 65, Tricare/military insurance (or many types): 0.4% (California: 1.4%)

Colorado: Boulder
> Americans under 65, no health insurance: 6.1% (Colorado: 9.3%)
> Americans under 65, Medicare coverage (or multiple types): 0.9% (Colorado: 1.9%)
> Americans under 65, Medicaid coverage (or multiple types): 11.5% (Colorado: 18.1%)
> Americans under 65, VA coverage (or multiple types): 0.4% (Colorado: 1.7%)
> Americans under 65, employer-based insurance (or multiple types): 68.5% (Colorado: 62.4%)
> Americans under 65, direct-purchase insurance (or multiple types): 17.3% (Colorado: 10.5%)
> Americans under 65, Tricare/military insurance (or many types): 0.6% (Colorado: 3.4%)
[in-text-ad]

Connecticut: Hartford-East Hartford-Middletown
> Americans under 65, no health insurance: 4.7% (Connecticut: 7.0%)
> Americans under 65, Medicare coverage (or multiple types): 2.6% (Connecticut: 2.5%)
> Americans under 65, Medicaid coverage (or multiple types): 21.9% (Connecticut: 23.2%)
> Americans under 65, VA coverage (or multiple types): 0.8% (Connecticut: 0.8%)
> Americans under 65, employer-based insurance (or multiple types): 69.4% (Connecticut: 64.2%)
> Americans under 65, direct-purchase insurance (or multiple types): 8.1% (Connecticut: 8.5%)
> Americans under 65, Tricare/military insurance (or many types): 0.8% (Connecticut: 1.0%)
[recirclink id=919182]

Delaware: Dover*
> Americans under 65, no health insurance: 10.9% (Delaware: 8.1%)
> Americans under 65, Medicare coverage (or multiple types): 4.4% (Delaware: 3.3%)
> Americans under 65, Medicaid coverage (or multiple types): 23.5% (Delaware: 23.0%)
> Americans under 65, VA coverage (or multiple types): 2.0% (Delaware: 1.2%)
> Americans under 65, employer-based insurance (or multiple types): 57.4% (Delaware: 63.6%)
> Americans under 65, direct-purchase insurance (or multiple types): 6.2% (Delaware: 8.3%)
> Americans under 65, Tricare/military insurance (or many types): 9.8% (Delaware: 3.2%)
*Because Dover is the only eligible metro in Delaware, it is the metro with the best health insurance coverage by default.

Florida: Tallahassee
> Americans under 65, no health insurance: 11.3% (Florida: 16.3%)
> Americans under 65, Medicare coverage (or multiple types): 3.0% (Florida: 3.2%)
> Americans under 65, Medicaid coverage (or multiple types): 15.9% (Florida: 18.1%)
> Americans under 65, VA coverage (or multiple types): 1.6% (Florida: 1.6%)
> Americans under 65, employer-based insurance (or multiple types): 61.5% (Florida: 51.4%)
> Americans under 65, direct-purchase insurance (or multiple types): 14.0% (Florida: 14.2%)
> Americans under 65, Tricare/military insurance (or many types): 1.8% (Florida: 2.7%)
[in-text-ad-2]

Georgia: Columbus
> Americans under 65, no health insurance: 11.3% (Georgia: 15.5%)
> Americans under 65, Medicare coverage (or multiple types): 5.3% (Georgia: 3.1%)
> Americans under 65, Medicaid coverage (or multiple types): 19.8% (Georgia: 17.5%)
> Americans under 65, VA coverage (or multiple types): 4.8% (Georgia: 1.7%)
> Americans under 65, employer-based insurance (or multiple types): 51.5% (Georgia: 58.1%)
> Americans under 65, direct-purchase insurance (or multiple types): 8.5% (Georgia: 9.2%)
> Americans under 65, Tricare/military insurance (or many types): 15.4% (Georgia: 3.3%)

Hawaii: Urban Honolulu
> Americans under 65, no health insurance: 4.4% (Hawaii: 5.0%)
> Americans under 65, Medicare coverage (or multiple types): 1.8% (Hawaii: 2.0%)
> Americans under 65, Medicaid coverage (or multiple types): 16.5% (Hawaii: 19.5%)
> Americans under 65, VA coverage (or multiple types): 1.7% (Hawaii: 1.5%)
> Americans under 65, employer-based insurance (or multiple types): 69.4% (Hawaii: 66.9%)
> Americans under 65, direct-purchase insurance (or multiple types): 9.4% (Hawaii: 9.9%)
> Americans under 65, Tricare/military insurance (or many types): 10.5% (Hawaii: 7.6%)
[in-text-ad]

Idaho: Idaho Falls
> Americans under 65, no health insurance: 10.8% (Idaho: 12.8%)
> Americans under 65, Medicare coverage (or multiple types): 2.5% (Idaho: 2.7%)
> Americans under 65, Medicaid coverage (or multiple types): 19.1% (Idaho: 17.3%)
> Americans under 65, VA coverage (or multiple types): 0.8% (Idaho: 1.6%)
> Americans under 65, employer-based insurance (or multiple types): 58.0% (Idaho: 58.7%)
> Americans under 65, direct-purchase insurance (or multiple types): 16.3% (Idaho: 12.9%)
> Americans under 65, Tricare/military insurance (or many types): 0.9% (Idaho: 2.5%)
[recirclink id=924822]

Illinois: Champaign-Urbana
> Americans under 65, no health insurance: 4.7% (Illinois: 8.6%)
> Americans under 65, Medicare coverage (or multiple types): 2.5% (Illinois: 2.5%)
> Americans under 65, Medicaid coverage (or multiple types): 19.5% (Illinois: 19.7%)
> Americans under 65, VA coverage (or multiple types): 0.9% (Illinois: 0.8%)
> Americans under 65, employer-based insurance (or multiple types): 67.2% (Illinois: 64.9%)
> Americans under 65, direct-purchase insurance (or multiple types): 13.4% (Illinois: 8.3%)
> Americans under 65, Tricare/military insurance (or many types): 0.9% (Illinois: 1.0%)

Indiana: Columbus
> Americans under 65, no health insurance: 6.4% (Indiana: 10.3%)
> Americans under 65, Medicare coverage (or multiple types): 3.8% (Indiana: 3.2%)
> Americans under 65, Medicaid coverage (or multiple types): 16.6% (Indiana: 19.1%)
> Americans under 65, VA coverage (or multiple types): 0.5% (Indiana: 1.1%)
> Americans under 65, employer-based insurance (or multiple types): 71.2% (Indiana: 64.4%)
> Americans under 65, direct-purchase insurance (or multiple types): 6.3% (Indiana: 7.8%)
> Americans under 65, Tricare/military insurance (or many types): 1.7% (Indiana: 1.3%)
[in-text-ad-2]

Iowa: Waterloo-Cedar Falls
> Americans under 65, no health insurance: 3.8% (Iowa: 6.0%)
> Americans under 65, Medicare coverage (or multiple types): 2.8% (Iowa: 2.7%)
> Americans under 65, Medicaid coverage (or multiple types): 22.8% (Iowa: 21.3%)
> Americans under 65, VA coverage (or multiple types): 1.0% (Iowa: 1.3%)
> Americans under 65, employer-based insurance (or multiple types): 69.5% (Iowa: 67.6%)
> Americans under 65, direct-purchase insurance (or multiple types): 7.6% (Iowa: 8.5%)
> Americans under 65, Tricare/military insurance (or many types): 0.6% (Iowa: 1.3%)
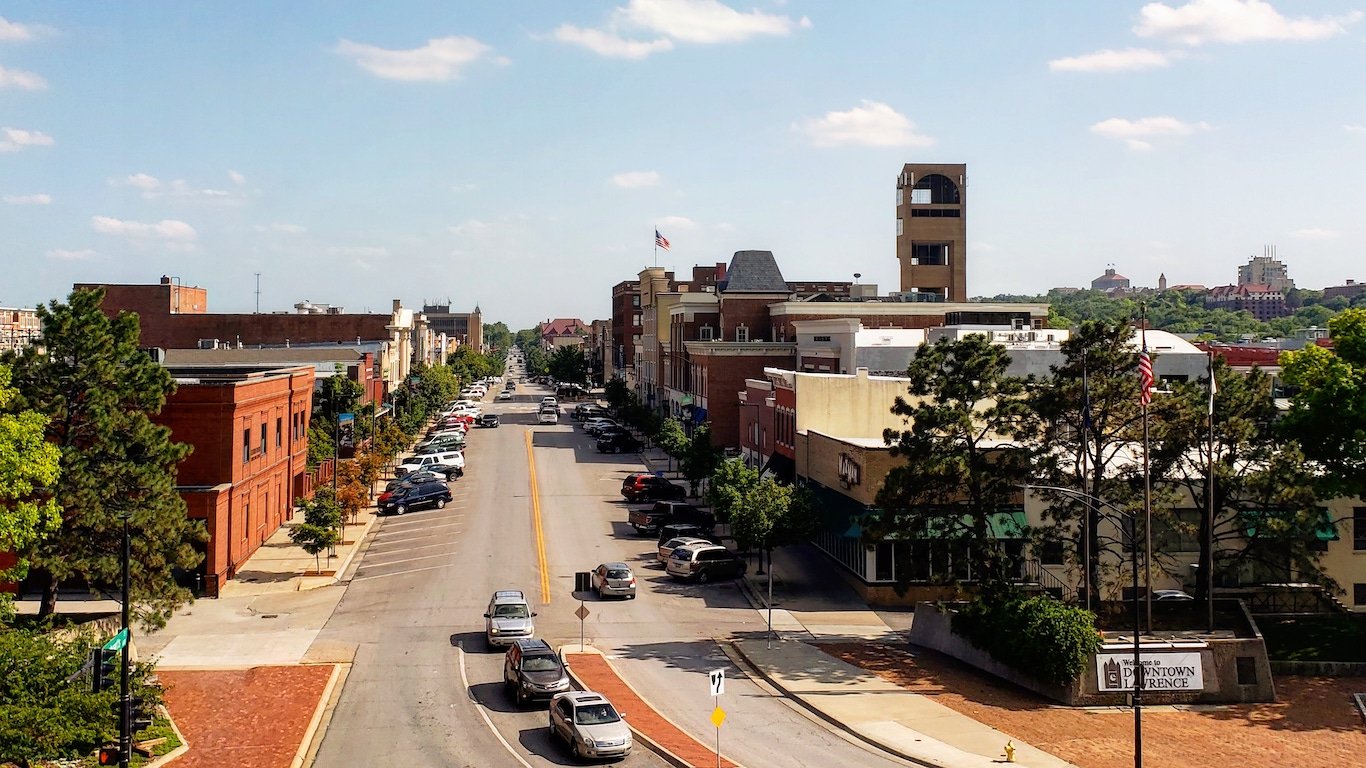
Kansas: Lawrence
> Americans under 65, no health insurance: 7.5% (Kansas: 10.9%)
> Americans under 65, Medicare coverage (or multiple types): 1.7% (Kansas: 2.7%)
> Americans under 65, Medicaid coverage (or multiple types): 9.8% (Kansas: 14.3%)
> Americans under 65, VA coverage (or multiple types): 1.2% (Kansas: 1.3%)
> Americans under 65, employer-based insurance (or multiple types): 71.2% (Kansas: 66.4%)
> Americans under 65, direct-purchase insurance (or multiple types): 13.8% (Kansas: 10.1%)
> Americans under 65, Tricare/military insurance (or many types): 2.4% (Kansas: 3.2%)
[in-text-ad]

Kentucky: Elizabethtown-Fort Knox
> Americans under 65, no health insurance: 5.5% (Kentucky: 7.7%)
> Americans under 65, Medicare coverage (or multiple types): 5.3% (Kentucky: 5.0%)
> Americans under 65, Medicaid coverage (or multiple types): 28.9% (Kentucky: 28.3%)
> Americans under 65, VA coverage (or multiple types): 4.3% (Kentucky: 1.4%)
> Americans under 65, employer-based insurance (or multiple types): 54.0% (Kentucky: 57.1%)
> Americans under 65, direct-purchase insurance (or multiple types): 4.4% (Kentucky: 7.3%)
> Americans under 65, Tricare/military insurance (or many types): 12.3% (Kentucky: 2.2%)
[recirclink id=928130]

Louisiana: Lafayette
> Americans under 65, no health insurance: 8.8% (Louisiana: 10.5%)
> Americans under 65, Medicare coverage (or multiple types): 3.6% (Louisiana: 4.0%)
> Americans under 65, Medicaid coverage (or multiple types): 28.6% (Louisiana: 31.6%)
> Americans under 65, VA coverage (or multiple types): 0.9% (Louisiana: 1.2%)
> Americans under 65, employer-based insurance (or multiple types): 54.3% (Louisiana: 50.9%)
> Americans under 65, direct-purchase insurance (or multiple types): 9.2% (Louisiana: 8.4%)
> Americans under 65, Tricare/military insurance (or many types): 1.0% (Louisiana: 2.0%)

Maine: Portland-South Portland
> Americans under 65, no health insurance: 7.0% (Maine: 10.1%)
> Americans under 65, Medicare coverage (or multiple types): 3.4% (Maine: 4.4%)
> Americans under 65, Medicaid coverage (or multiple types): 15.1% (Maine: 20.2%)
> Americans under 65, VA coverage (or multiple types): 1.2% (Maine: 1.7%)
> Americans under 65, employer-based insurance (or multiple types): 71.2% (Maine: 61.4%)
> Americans under 65, direct-purchase insurance (or multiple types): 10.1% (Maine: 10.5%)
> Americans under 65, Tricare/military insurance (or many types): 2.1% (Maine: 2.4%)
[in-text-ad-2]

Maryland: California-Lexington Park
> Americans under 65, no health insurance: 3.6% (Maryland: 6.9%)
> Americans under 65, Medicare coverage (or multiple types): 4.0% (Maryland: 2.8%)
> Americans under 65, Medicaid coverage (or multiple types): 22.2% (Maryland: 19.6%)
> Americans under 65, VA coverage (or multiple types): 2.3% (Maryland: 1.2%)
> Americans under 65, employer-based insurance (or multiple types): 61.4% (Maryland: 65.6%)
> Americans under 65, direct-purchase insurance (or multiple types): 4.6% (Maryland: 9.3%)
> Americans under 65, Tricare/military insurance (or many types): 12.9% (Maryland: 3.3%)

Massachusetts: Worcester
> Americans under 65, no health insurance: 3.7% (Massachusetts: 3.5%)
> Americans under 65, Medicare coverage (or multiple types): 2.8% (Massachusetts: 2.6%)
> Americans under 65, Medicaid coverage (or multiple types): 26.0% (Massachusetts: 23.0%)
> Americans under 65, VA coverage (or multiple types): 0.9% (Massachusetts: 0.6%)
> Americans under 65, employer-based insurance (or multiple types): 66.1% (Massachusetts: 68.1%)
> Americans under 65, direct-purchase insurance (or multiple types): 8.0% (Massachusetts: 10.2%)
> Americans under 65, Tricare/military insurance (or many types): 1.1% (Massachusetts: 0.8%)
[in-text-ad]
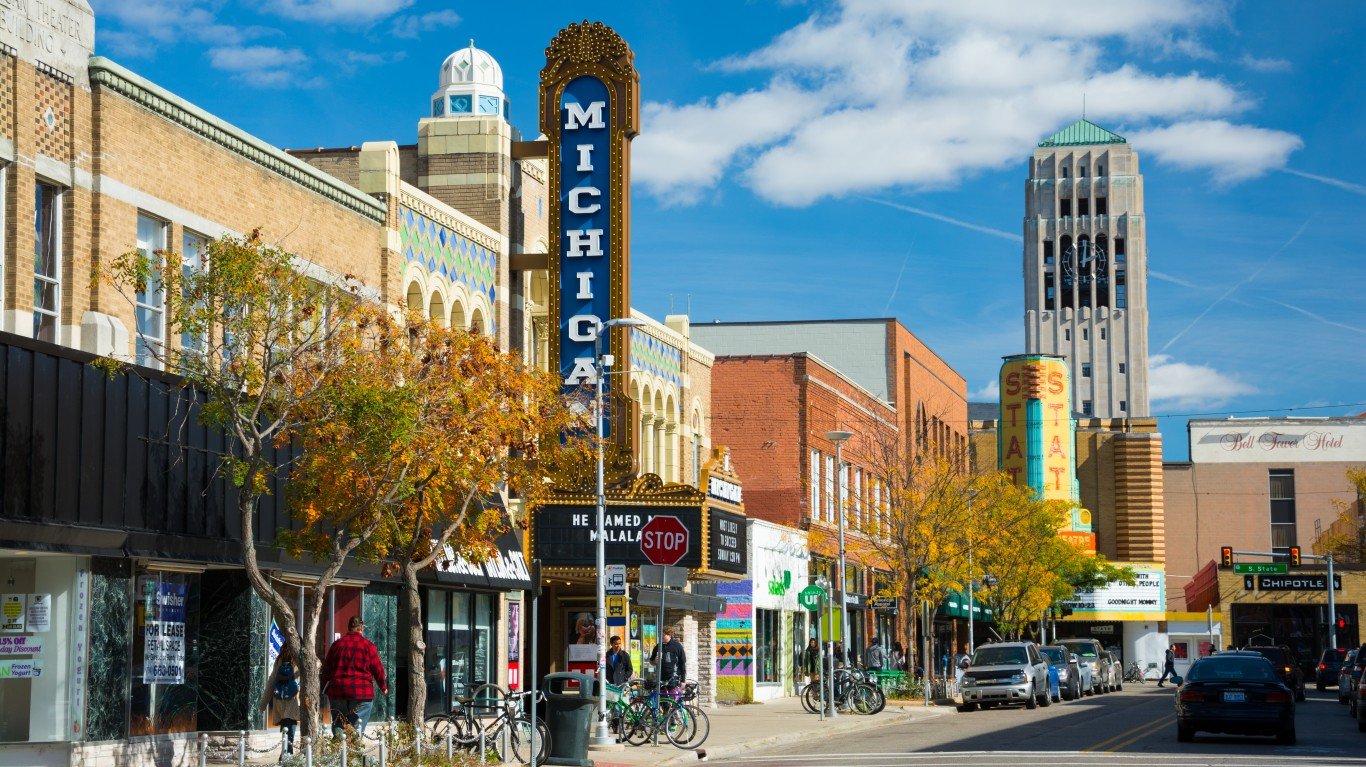
Michigan: Ann Arbor
> Americans under 65, no health insurance: 4.3% (Michigan: 6.9%)
> Americans under 65, Medicare coverage (or multiple types): 2.2% (Michigan: 3.7%)
> Americans under 65, Medicaid coverage (or multiple types): 13.9% (Michigan: 23.8%)
> Americans under 65, VA coverage (or multiple types): 1.1% (Michigan: 1.0%)
> Americans under 65, employer-based insurance (or multiple types): 72.6% (Michigan: 63.7%)
> Americans under 65, direct-purchase insurance (or multiple types): 11.5% (Michigan: 8.9%)
> Americans under 65, Tricare/military insurance (or many types): 1.0% (Michigan: 0.9%)
[recirclink id=931001]

Minnesota: Minneapolis-St. Paul-Bloomington
> Americans under 65, no health insurance: 5.2% (Minnesota: 5.8%)
> Americans under 65, Medicare coverage (or multiple types): 1.7% (Minnesota: 2.0%)
> Americans under 65, Medicaid coverage (or multiple types): 17.4% (Minnesota: 18.9%)
> Americans under 65, VA coverage (or multiple types): 0.7% (Minnesota: 0.9%)
> Americans under 65, employer-based insurance (or multiple types): 71.8% (Minnesota: 69.8%)
> Americans under 65, direct-purchase insurance (or multiple types): 8.3% (Minnesota: 8.4%)
> Americans under 65, Tricare/military insurance (or many types): 0.9% (Minnesota: 1.0%)

Mississippi: Jackson
> Americans under 65, no health insurance: 14.6% (Mississippi: 15.4%)
> Americans under 65, Medicare coverage (or multiple types): 3.2% (Mississippi: 4.5%)
> Americans under 65, Medicaid coverage (or multiple types): 22.6% (Mississippi: 25.1%)
> Americans under 65, VA coverage (or multiple types): 1.0% (Mississippi: 1.2%)
> Americans under 65, employer-based insurance (or multiple types): 54.9% (Mississippi: 50.9%)
> Americans under 65, direct-purchase insurance (or multiple types): 10.3% (Mississippi: 8.6%)
> Americans under 65, Tricare/military insurance (or many types): 1.8% (Mississippi: 2.9%)
[in-text-ad-2]

Missouri: St. Louis
> Americans under 65, no health insurance: 7.8% (Missouri: 12.0%)
> Americans under 65, Medicare coverage (or multiple types): 3.2% (Missouri: 3.7%)
> Americans under 65, Medicaid coverage (or multiple types): 15.0% (Missouri: 15.6%)
> Americans under 65, VA coverage (or multiple types): 1.2% (Missouri: 1.4%)
> Americans under 65, employer-based insurance (or multiple types): 68.8% (Missouri: 63.3%)
> Americans under 65, direct-purchase insurance (or multiple types): 8.8% (Missouri: 9.3%)
> Americans under 65, Tricare/military insurance (or many types): 2.6% (Missouri: 2.1%)

Montana: Billings
> Americans under 65, no health insurance: 6.9% (Montana: 10.2%)
> Americans under 65, Medicare coverage (or multiple types): 2.9% (Montana: 3.0%)
> Americans under 65, Medicaid coverage (or multiple types): 25.0% (Montana: 23.6%)
> Americans under 65, VA coverage (or multiple types): 1.6% (Montana: 2.2%)
> Americans under 65, employer-based insurance (or multiple types): 60.4% (Montana: 55.0%)
> Americans under 65, direct-purchase insurance (or multiple types): 12.1% (Montana: 13.6%)
> Americans under 65, Tricare/military insurance (or many types): 1.7% (Montana: 3.0%)
[in-text-ad]

Nebraska: Lincoln
> Americans under 65, no health insurance: 8.4% (Nebraska: 9.8%)
> Americans under 65, Medicare coverage (or multiple types): 1.5% (Nebraska: 2.2%)
> Americans under 65, Medicaid coverage (or multiple types): 11.0% (Nebraska: 13.4%)
> Americans under 65, VA coverage (or multiple types): 1.0% (Nebraska: 1.2%)
> Americans under 65, employer-based insurance (or multiple types): 72.3% (Nebraska: 67.2%)
> Americans under 65, direct-purchase insurance (or multiple types): 11.8% (Nebraska: 12.1%)
> Americans under 65, Tricare/military insurance (or many types): 1.5% (Nebraska: 2.6%)
[recirclink id=497059]

Nevada: Reno
> Americans under 65, no health insurance: 11.1% (Nevada: 13.4%)
> Americans under 65, Medicare coverage (or multiple types): 2.2% (Nevada: 2.4%)
> Americans under 65, Medicaid coverage (or multiple types): 14.6% (Nevada: 18.9%)
> Americans under 65, VA coverage (or multiple types): 1.8% (Nevada: 1.8%)
> Americans under 65, employer-based insurance (or multiple types): 66.7% (Nevada: 59.4%)
> Americans under 65, direct-purchase insurance (or multiple types): 8.8% (Nevada: 8.7%)
> Americans under 65, Tricare/military insurance (or many types): 1.5% (Nevada: 2.6%)

New Hampshire: Manchester-Nashua*
> Americans under 65, no health insurance: 7.9% (New Hampshire: 7.6%)
> Americans under 65, Medicare coverage (or multiple types): 3.1% (New Hampshire: 3.2%)
> Americans under 65, Medicaid coverage (or multiple types): 15.7% (New Hampshire: 14.6%)
> Americans under 65, VA coverage (or multiple types): 1.1% (New Hampshire: 1.2%)
> Americans under 65, employer-based insurance (or multiple types): 69.4% (New Hampshire: 68.8%)
> Americans under 65, direct-purchase insurance (or multiple types): 7.5% (New Hampshire: 9.1%)
> Americans under 65, Tricare/military insurance (or many types): 1.4% (New Hampshire: 1.5%)
*Because Manchester-Nashua is the only eligible metro in New Hampshire, it is the metro with the best health insurance coverage by default.
[in-text-ad-2]

New Jersey: Trenton-Princeton
> Americans under 65, no health insurance: 8.7% (New Jersey: 9.2%)
> Americans under 65, Medicare coverage (or multiple types): 2.9% (New Jersey: 2.5%)
> Americans under 65, Medicaid coverage (or multiple types): 15.8% (New Jersey: 17.4%)
> Americans under 65, VA coverage (or multiple types): 0.4% (New Jersey: 0.5%)
> Americans under 65, employer-based insurance (or multiple types): 70.9% (New Jersey: 66.4%)
> Americans under 65, direct-purchase insurance (or multiple types): 6.4% (New Jersey: 8.7%)
> Americans under 65, Tricare/military insurance (or many types): 0.3% (New Jersey: 0.7%)

New Mexico: Albuquerque
> Americans under 65, no health insurance: 9.8% (New Mexico: 12.0%)
> Americans under 65, Medicare coverage (or multiple types): 3.6% (New Mexico: 3.7%)
> Americans under 65, Medicaid coverage (or multiple types): 32.8% (New Mexico: 37.0%)
> Americans under 65, VA coverage (or multiple types): 1.8% (New Mexico: 1.7%)
> Americans under 65, employer-based insurance (or multiple types): 53.0% (New Mexico: 46.1%)
> Americans under 65, direct-purchase insurance (or multiple types): 8.2% (New Mexico: 7.6%)
> Americans under 65, Tricare/military insurance (or many types): 3.1% (New Mexico: 2.9%)
[in-text-ad]

New York: Buffalo-Cheektowaga
> Americans under 65, no health insurance: 3.2% (New York: 6.1%)
> Americans under 65, Medicare coverage (or multiple types): 3.2% (New York: 2.7%)
> Americans under 65, Medicaid coverage (or multiple types): 26.4% (New York: 26.9%)
> Americans under 65, VA coverage (or multiple types): 1.2% (New York: 0.6%)
> Americans under 65, employer-based insurance (or multiple types): 65.1% (New York: 60.2%)
> Americans under 65, direct-purchase insurance (or multiple types): 9.3% (New York: 10.8%)
> Americans under 65, Tricare/military insurance (or many types): 1.2% (New York: 0.7%)
[recirclink id=924822]

North Carolina: Greenville
> Americans under 65, no health insurance: 10.5% (North Carolina: 13.4%)
> Americans under 65, Medicare coverage (or multiple types): 4.1% (North Carolina: 3.3%)
> Americans under 65, Medicaid coverage (or multiple types): 17.6% (North Carolina: 19.2%)
> Americans under 65, VA coverage (or multiple types): 1.9% (North Carolina: 1.7%)
> Americans under 65, employer-based insurance (or multiple types): 55.2% (North Carolina: 56.7%)
> Americans under 65, direct-purchase insurance (or multiple types): 18.1% (North Carolina: 10.7%)
> Americans under 65, Tricare/military insurance (or many types): 2.4% (North Carolina: 3.6%)

North Dakota: Grand Forks
> Americans under 65, no health insurance: 4.8% (North Dakota: 8.1%)
> Americans under 65, Medicare coverage (or multiple types): 2.9% (North Dakota: 2.0%)
> Americans under 65, Medicaid coverage (or multiple types): 17.1% (North Dakota: 12.4%)
> Americans under 65, VA coverage (or multiple types): 2.1% (North Dakota: 1.6%)
> Americans under 65, employer-based insurance (or multiple types): 70.4% (North Dakota: 68.3%)
> Americans under 65, direct-purchase insurance (or multiple types): 11.0% (North Dakota: 13.6%)
> Americans under 65, Tricare/military insurance (or many types): 4.5% (North Dakota: 3.5%)
[in-text-ad-2]

Ohio: Cincinnati
> Americans under 65, no health insurance: 6.7% (Ohio: 7.8%)
> Americans under 65, Medicare coverage (or multiple types): 3.0% (Ohio: 3.1%)
> Americans under 65, Medicaid coverage (or multiple types): 17.8% (Ohio: 22.2%)
> Americans under 65, VA coverage (or multiple types): 1.2% (Ohio: 1.2%)
> Americans under 65, employer-based insurance (or multiple types): 69.4% (Ohio: 64.4%)
> Americans under 65, direct-purchase insurance (or multiple types): 7.7% (Ohio: 7.3%)
> Americans under 65, Tricare/military insurance (or many types): 1.0% (Ohio: 1.3%)

Oklahoma: Oklahoma City
> Americans under 65, no health insurance: 14.2% (Oklahoma: 16.8%)
> Americans under 65, Medicare coverage (or multiple types): 3.4% (Oklahoma: 4.0%)
> Americans under 65, Medicaid coverage (or multiple types): 16.7% (Oklahoma: 18.7%)
> Americans under 65, VA coverage (or multiple types): 1.8% (Oklahoma: 1.9%)
> Americans under 65, employer-based insurance (or multiple types): 59.9% (Oklahoma: 54.8%)
> Americans under 65, direct-purchase insurance (or multiple types): 9.1% (Oklahoma: 9.3%)
> Americans under 65, Tricare/military insurance (or many types): 3.9% (Oklahoma: 3.4%)
[in-text-ad]

Oregon: Corvallis
> Americans under 65, no health insurance: 5.6% (Oregon: 8.6%)
> Americans under 65, Medicare coverage (or multiple types): 1.8% (Oregon: 2.7%)
> Americans under 65, Medicaid coverage (or multiple types): 14.8% (Oregon: 23.0%)
> Americans under 65, VA coverage (or multiple types): 0.9% (Oregon: 1.5%)
> Americans under 65, employer-based insurance (or multiple types): 69.3% (Oregon: 61.4%)
> Americans under 65, direct-purchase insurance (or multiple types): 11.8% (Oregon: 9.4%)
> Americans under 65, Tricare/military insurance (or many types): 1.5% (Oregon: 1.4%)
[recirclink id=931001]

Pennsylvania: Johnstown
> Americans under 65, no health insurance: 4.8% (Pennsylvania: 7.0%)
> Americans under 65, Medicare coverage (or multiple types): 4.7% (Pennsylvania: 3.3%)
> Americans under 65, Medicaid coverage (or multiple types): 26.3% (Pennsylvania: 22.0%)
> Americans under 65, VA coverage (or multiple types): 1.2% (Pennsylvania: 1.0%)
> Americans under 65, employer-based insurance (or multiple types): 63.0% (Pennsylvania: 65.1%)
> Americans under 65, direct-purchase insurance (or multiple types): 7.9% (Pennsylvania: 9.2%)
> Americans under 65, Tricare/military insurance (or many types): 1.9% (Pennsylvania: 1.1%)

Rhode Island: Providence-Warwick*
> Americans under 65, no health insurance: 4.4% (Rhode Island: 4.8%)
> Americans under 65, Medicare coverage (or multiple types): 3.9% (Rhode Island: 3.9%)
> Americans under 65, Medicaid coverage (or multiple types): 24.6% (Rhode Island: 21.6%)
> Americans under 65, VA coverage (or multiple types): 0.7% (Rhode Island: 0.7%)
> Americans under 65, employer-based insurance (or multiple types): 65.4% (Rhode Island: 66.8%)
> Americans under 65, direct-purchase insurance (or multiple types): 11.0% (Rhode Island: 11.7%)
> Americans under 65, Tricare/military insurance (or many types): 1.1% (Rhode Island: 1.3%)
*Because Providence-Warwick is the only eligible metro in Rhode Island, it is the metro with the best health insurance coverage by default.
[in-text-ad-2]

South Carolina: Columbia
> Americans under 65, no health insurance: 11.4% (South Carolina: 13.2%)
> Americans under 65, Medicare coverage (or multiple types): 3.1% (South Carolina: 3.7%)
> Americans under 65, Medicaid coverage (or multiple types): 18.8% (South Carolina: 20.2%)
> Americans under 65, VA coverage (or multiple types): 2.6% (South Carolina: 1.8%)
> Americans under 65, employer-based insurance (or multiple types): 59.2% (South Carolina: 57.0%)
> Americans under 65, direct-purchase insurance (or multiple types): 10.4% (South Carolina: 10.1%)
> Americans under 65, Tricare/military insurance (or many types): 4.9% (South Carolina: 3.7%)

South Dakota: Sioux Falls
> Americans under 65, no health insurance: 8.6% (South Dakota: 12.2%)
> Americans under 65, Medicare coverage (or multiple types): 3.0% (South Dakota: 2.9%)
> Americans under 65, Medicaid coverage (or multiple types): 11.9% (South Dakota: 14.2%)
> Americans under 65, VA coverage (or multiple types): 1.3% (South Dakota: 1.8%)
> Americans under 65, employer-based insurance (or multiple types): 71.0% (South Dakota: 61.8%)
> Americans under 65, direct-purchase insurance (or multiple types): 10.2% (South Dakota: 12.8%)
> Americans under 65, Tricare/military insurance (or many types): 2.1% (South Dakota: 2.9%)
[in-text-ad]

Tennessee: Clarksville
> Americans under 65, no health insurance: 10.4% (Tennessee: 12.1%)
> Americans under 65, Medicare coverage (or multiple types): 3.8% (Tennessee: 3.4%)
> Americans under 65, Medicaid coverage (or multiple types): 22.5% (Tennessee: 21.0%)
> Americans under 65, VA coverage (or multiple types): 5.6% (Tennessee: 1.6%)
> Americans under 65, employer-based insurance (or multiple types): 46.0% (Tennessee: 58.4%)
> Americans under 65, direct-purchase insurance (or multiple types): 7.5% (Tennessee: 9.6%)
> Americans under 65, Tricare/military insurance (or many types): 24.1% (Tennessee: 2.9%)
[recirclink id=497059]

Texas: College Station-Bryan
> Americans under 65, no health insurance: 14.2% (Texas: 20.8%)
> Americans under 65, Medicare coverage (or multiple types): 2.2% (Texas: 2.3%)
> Americans under 65, Medicaid coverage (or multiple types): 14.0% (Texas: 16.2%)
> Americans under 65, VA coverage (or multiple types): 1.6% (Texas: 1.4%)
> Americans under 65, employer-based insurance (or multiple types): 60.5% (Texas: 54.8%)
> Americans under 65, direct-purchase insurance (or multiple types): 12.9% (Texas: 8.6%)
> Americans under 65, Tricare/military insurance (or many types): 2.5% (Texas: 2.3%)

Utah: Logan
> Americans under 65, no health insurance: 7.0% (Utah: 10.8%)
> Americans under 65, Medicare coverage (or multiple types): 1.4% (Utah: 1.5%)
> Americans under 65, Medicaid coverage (or multiple types): 13.8% (Utah: 9.8%)
> Americans under 65, VA coverage (or multiple types): 0.2% (Utah: 0.8%)
> Americans under 65, employer-based insurance (or multiple types): 68.7% (Utah: 68.8%)
> Americans under 65, direct-purchase insurance (or multiple types): 13.8% (Utah: 12.5%)
> Americans under 65, Tricare/military insurance (or many types): 1.3% (Utah: 1.9%)
[in-text-ad-2]

Vermont: Burlington-South Burlington*
> Americans under 65, no health insurance: 4.3% (Vermont: 5.6%)
> Americans under 65, Medicare coverage (or multiple types): 2.6% (Vermont: 4.1%)
> Americans under 65, Medicaid coverage (or multiple types): 21.5% (Vermont: 25.8%)
> Americans under 65, VA coverage (or multiple types): 0.9% (Vermont: 1.1%)
> Americans under 65, employer-based insurance (or multiple types): 66.9% (Vermont: 60.6%)
> Americans under 65, direct-purchase insurance (or multiple types): 10.0% (Vermont: 10.3%)
> Americans under 65, Tricare/military insurance (or many types): 1.5% (Vermont: 1.6%)
*Because Burlington-South Burlington is the only eligible metro in Vermont, it is the metro with the best health insurance coverage by default.
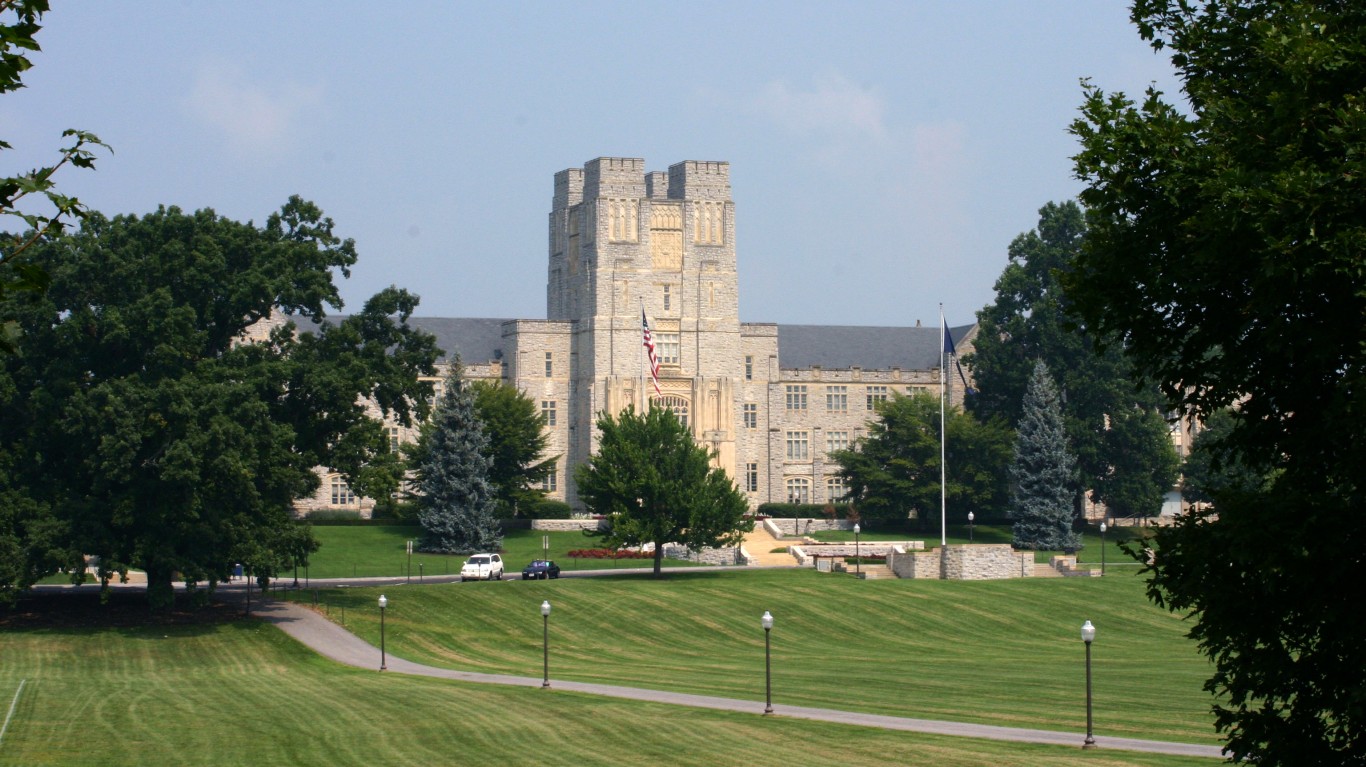
Virginia: Blacksburg-Christiansburg
> Americans under 65, no health insurance: 7.7% (Virginia: 9.3%)
> Americans under 65, Medicare coverage (or multiple types): 6.8% (Virginia: 2.8%)
> Americans under 65, Medicaid coverage (or multiple types): 12.5% (Virginia: 14.5%)
> Americans under 65, VA coverage (or multiple types): 1.6% (Virginia: 2.3%)
> Americans under 65, employer-based insurance (or multiple types): 66.4% (Virginia: 64.4%)
> Americans under 65, direct-purchase insurance (or multiple types): 10.1% (Virginia: 9.3%)
> Americans under 65, Tricare/military insurance (or many types): 1.5% (Virginia: 6.9%)
[in-text-ad]

Washington: Bremerton-Silverdale-Port Orchard
> Americans under 65, no health insurance: 6.0% (Washington: 7.7%)
> Americans under 65, Medicare coverage (or multiple types): 2.8% (Washington: 2.4%)
> Americans under 65, Medicaid coverage (or multiple types): 16.6% (Washington: 21.4%)
> Americans under 65, VA coverage (or multiple types): 2.4% (Washington: 1.5%)
> Americans under 65, employer-based insurance (or multiple types): 65.4% (Washington: 63.7%)
> Americans under 65, direct-purchase insurance (or multiple types): 8.1% (Washington: 8.3%)
> Americans under 65, Tricare/military insurance (or many types): 18.1% (Washington: 3.4%)
[recirclink id=919182]

West Virginia: Morgantown
> Americans under 65, no health insurance: 4.7% (West Virginia: 8.3%)
> Americans under 65, Medicare coverage (or multiple types): 3.7% (West Virginia: 5.5%)
> Americans under 65, Medicaid coverage (or multiple types): 19.3% (West Virginia: 30.0%)
> Americans under 65, VA coverage (or multiple types): 1.4% (West Virginia: 2.2%)
> Americans under 65, employer-based insurance (or multiple types): 69.5% (West Virginia: 57.4%)
> Americans under 65, direct-purchase insurance (or multiple types): 7.9% (West Virginia: 5.7%)
> Americans under 65, Tricare/military insurance (or many types): 2.2% (West Virginia: 1.8%)

Wisconsin: Madison
> Americans under 65, no health insurance: 4.3% (Wisconsin: 6.8%)
> Americans under 65, Medicare coverage (or multiple types): 1.9% (Wisconsin: 2.7%)
> Americans under 65, Medicaid coverage (or multiple types): 11.5% (Wisconsin: 17.6%)
> Americans under 65, VA coverage (or multiple types): 1.0% (Wisconsin: 1.1%)
> Americans under 65, employer-based insurance (or multiple types): 78.1% (Wisconsin: 69.5%)
> Americans under 65, direct-purchase insurance (or multiple types): 9.2% (Wisconsin: 8.8%)
> Americans under 65, Tricare/military insurance (or many types): 0.9% (Wisconsin: 1.0%)
[in-text-ad-2]

Wyoming: Cheyenne
> Americans under 65, no health insurance: 8.9% (Wyoming: 14.8%)
> Americans under 65, Medicare coverage (or multiple types): 2.0% (Wyoming: 2.4%)
> Americans under 65, Medicaid coverage (or multiple types): 11.7% (Wyoming: 12.3%)
> Americans under 65, VA coverage (or multiple types): 2.2% (Wyoming: 1.7%)
> Americans under 65, employer-based insurance (or multiple types): 66.5% (Wyoming: 62.6%)
> Americans under 65, direct-purchase insurance (or multiple types): 8.8% (Wyoming: 10.8%)
> Americans under 65, Tricare/military insurance (or many types): 10.8% (Wyoming: 2.8%)
Methodology
To determine the metro with the best health insurance coverage in every state, 24/7 Wall St. reviewed one-year estimates of the percentage of the noninstitutionalized civilian population under 65 without health insurance from the U.S. Census Bureau’s 2019 American Community Survey.
We used the 384 metropolitan statistical areas as delineated by the United States Office of Management and Budget and used by the Census Bureau as our definition of metros.
We selected the under 65 age group because Americans become eligible for Medicare at age 65, and the uninsured rate for the population above this age is less than 1% nationwide. However, because the Census doesn’t publish insurance coverage estimates specifically for the under 65 age group, we aggregated the data from more granular age breakouts.
Each metro was ranked within its state by its under 65 uninsured rate. Since many metros cross state lines, the metro was assigned to the state of its first-listed principal city. Thus, the Washington-Arlington-Alexandria, DC-VA-MD-WV metro area was excluded as it is principally in the District of Columbia.
The share of the population covered by each type of insurance — Medicare, Medicaid, VA, employer, direct-purchase, and Tricare/military — are for the same cohort and are also aggregated from one-year ACS estimates. The estimates reflect people who are covered by that type of insurance alone or in combination with other types on the list. So, when a person is covered by more than one type of insurance, they are included in each group.
Contact [email protected] for any questions or corrections.