These Are the Cities With the Most UFO Sightings
Unidentified flying objects have been a hot topic since the Office of the Director of National Intelligence delivered an unclassified report to Congress titled “Preliminary Assessment: Unidentified Aerial Phenomena” in July. People are less likely to dismiss reported sightings as…

Unidentified flying objects have been a hot topic since the Office of the Director of National Intelligence delivered an unclassified report to Congress titled “Preliminary Assessment: Unidentified Aerial Phenomena” in July. People are less likely to dismiss reported sightings as the product of overactive imaginations when the government is taking them seriously.
The numbers of reported sightings have been increasing in recent years: There were 6,281 reported sightings in 2019 and 7,267 in 2020. Those figures vary greatly by location. Some states have more sightings per capita, as do some cities. (These are the states with the most UFO sightings.)
24/7 Tempo has identified the cities with the most UFO sightings, based on data provided by Cheryl Costa and Linda Miller, authors of “UFO Sightings Desk Reference: United States of America 2001-2020.” This ranking shows the relative likelihood of state residents reporting UFO sightings.
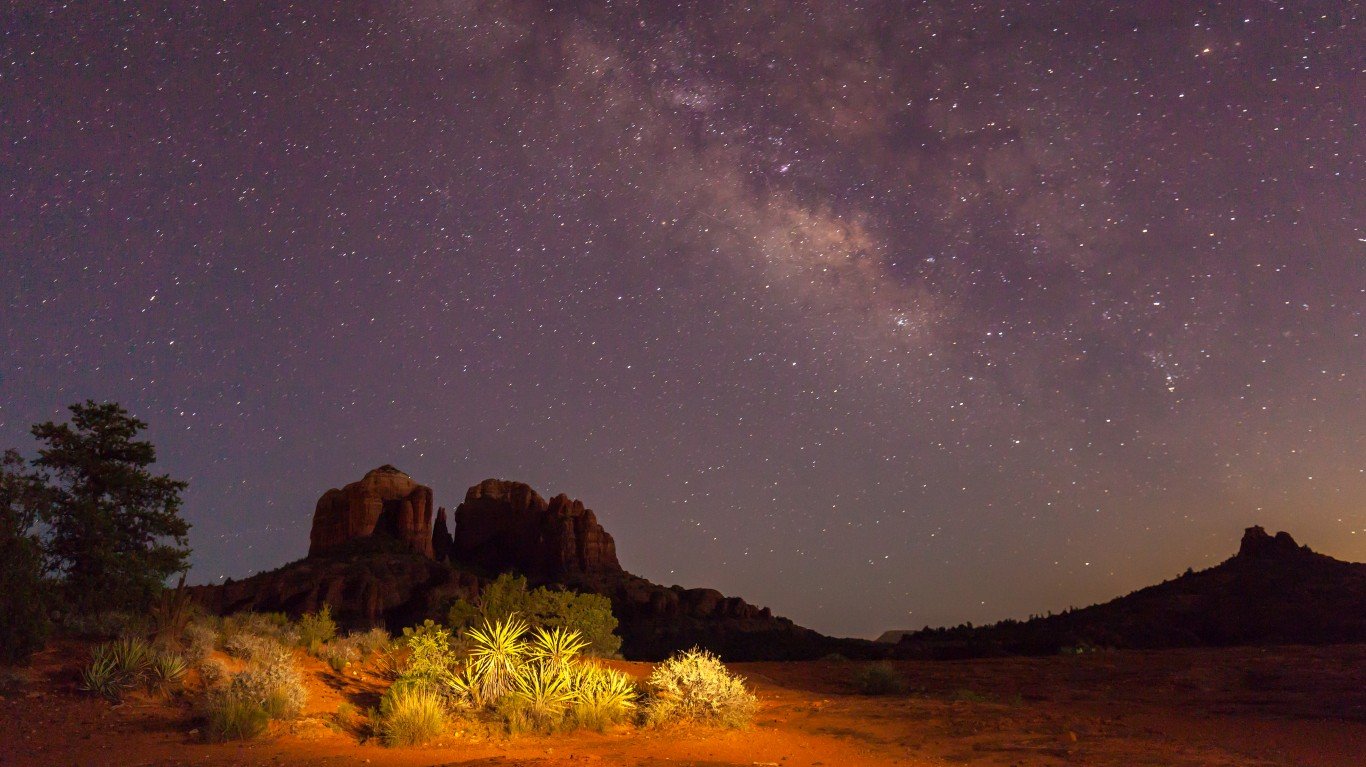
Sedona, Arizona, tops our list, with 1,608 sightings per 100,000 residents. There’s no obvious reason why, although visibility is generally good in the desert and Arizona is home to several leading observatories. In February, the pilot of an American Airlines flight bound for Phoenix reported a close encounter with a UFO “that almost looked like a cruise missile.”
In past years, suggested explanations for sightings in Arizona have included the many flying school planes in the state and flares dropped by military aircraft. (Here is why scientists think there is life on other planets.)
The No. 2 and No. 3 spots are taken by Myrtle Beach and North Myrtle Beach in South Carolina, with 1,223 and 1,111 sightings per 100,000 residents, respectively. The area has a well-documented history of multiple sightings and once boasted a visitor attraction called “Encounters UFO Experience.”
Click here to see the cities with the most UFO sightings
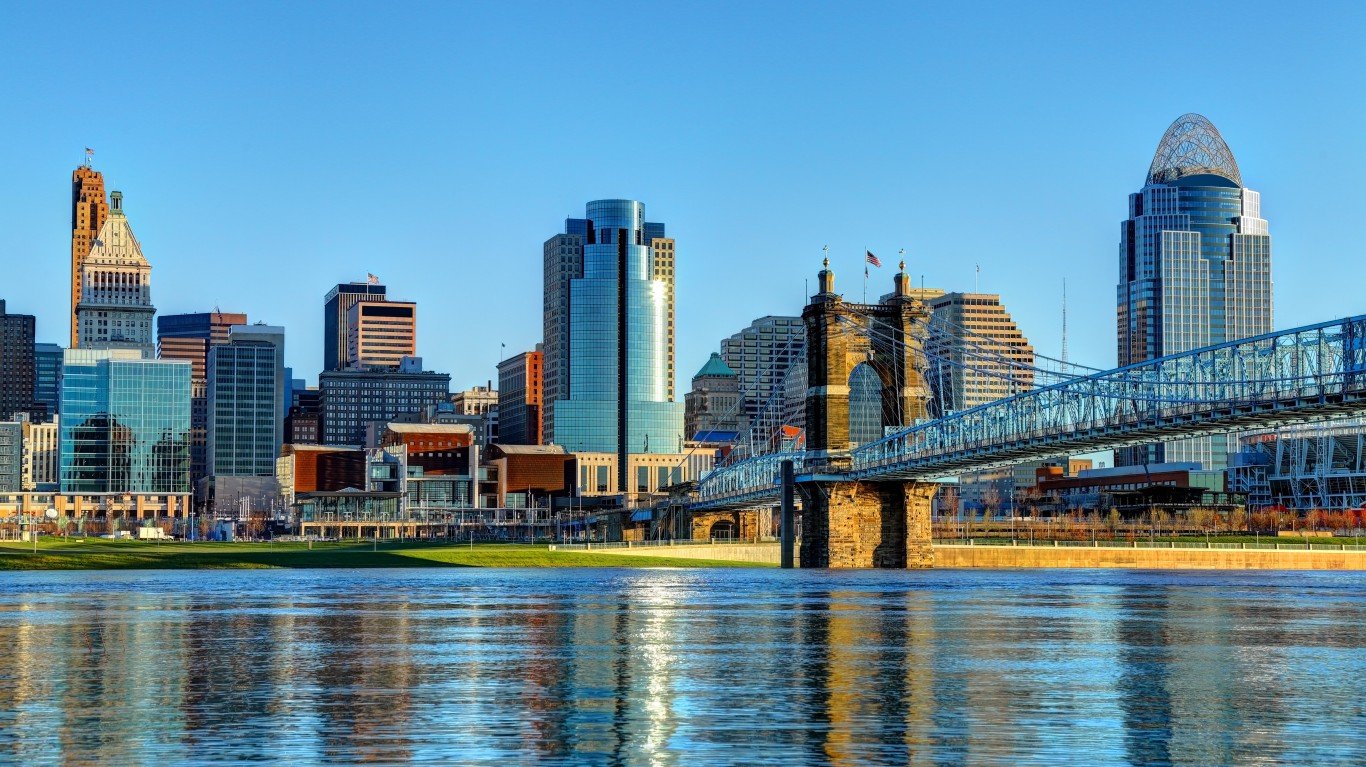
50. Cincinnati, Ohio
> 2001-2020 sightings per 100K: 75.32
> Total sightings: 227
> Population 2019: 301,394
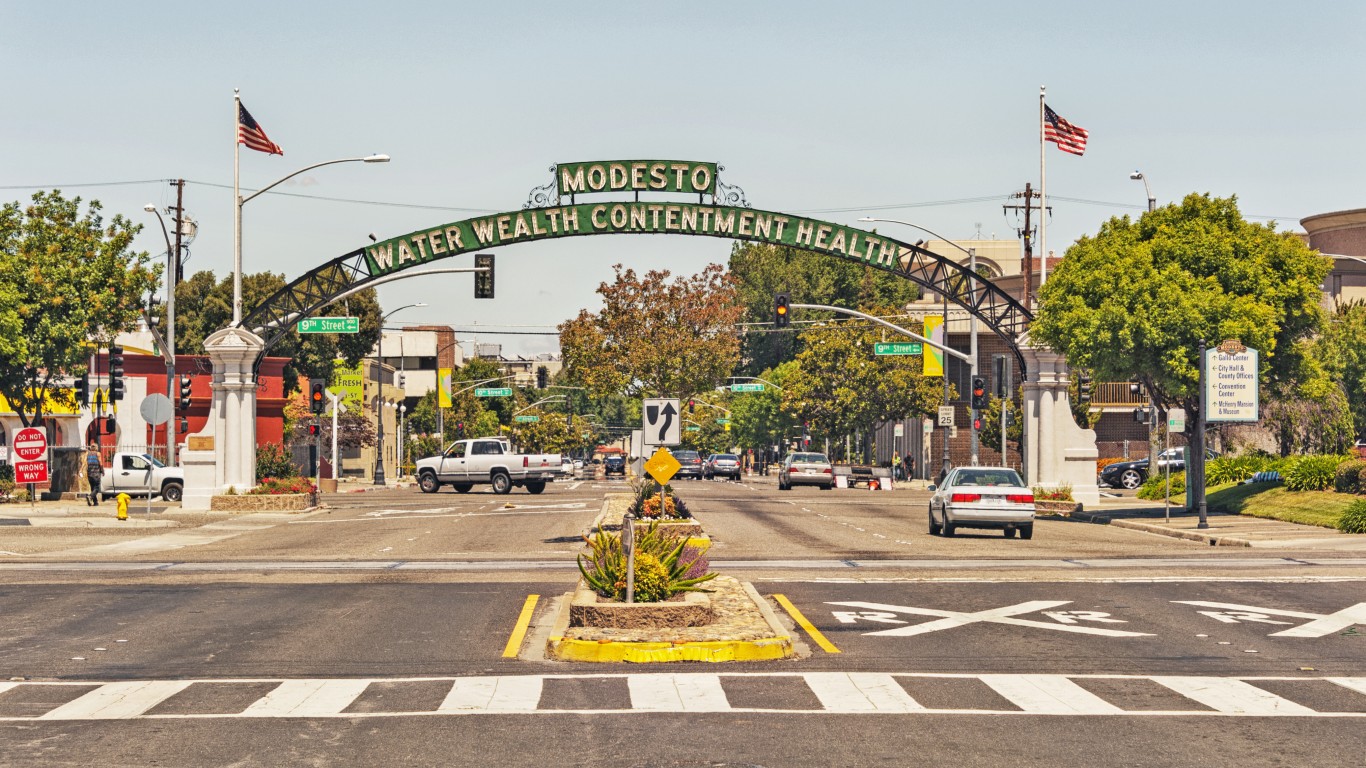
49. Modesto, California
> 2001-2020 sightings per 100K: 78.08
> Total sightings: 166
> Population 2019: 212,616
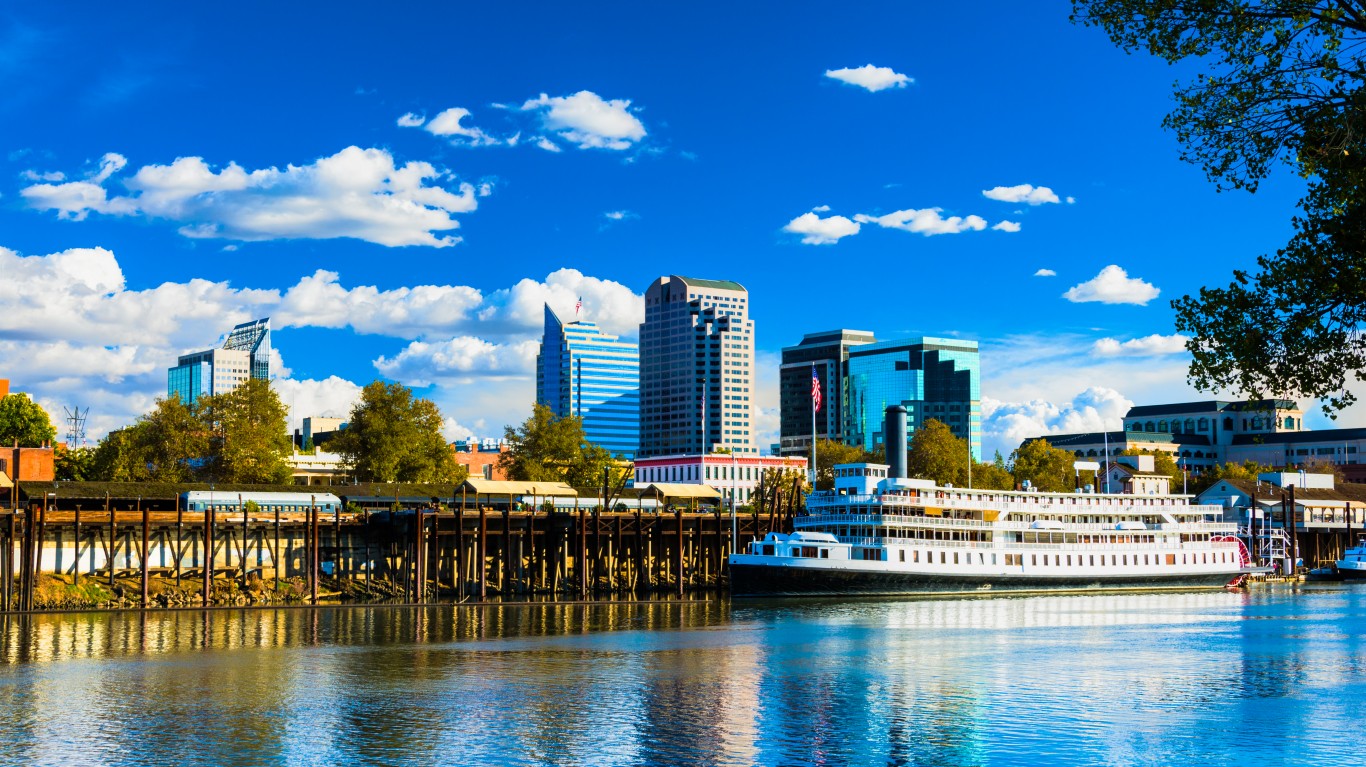
48. Sacramento, California
> 2001-2020 sightings per 100K: 79.85
> Total sightings: 400
> Population 2019: 500,930
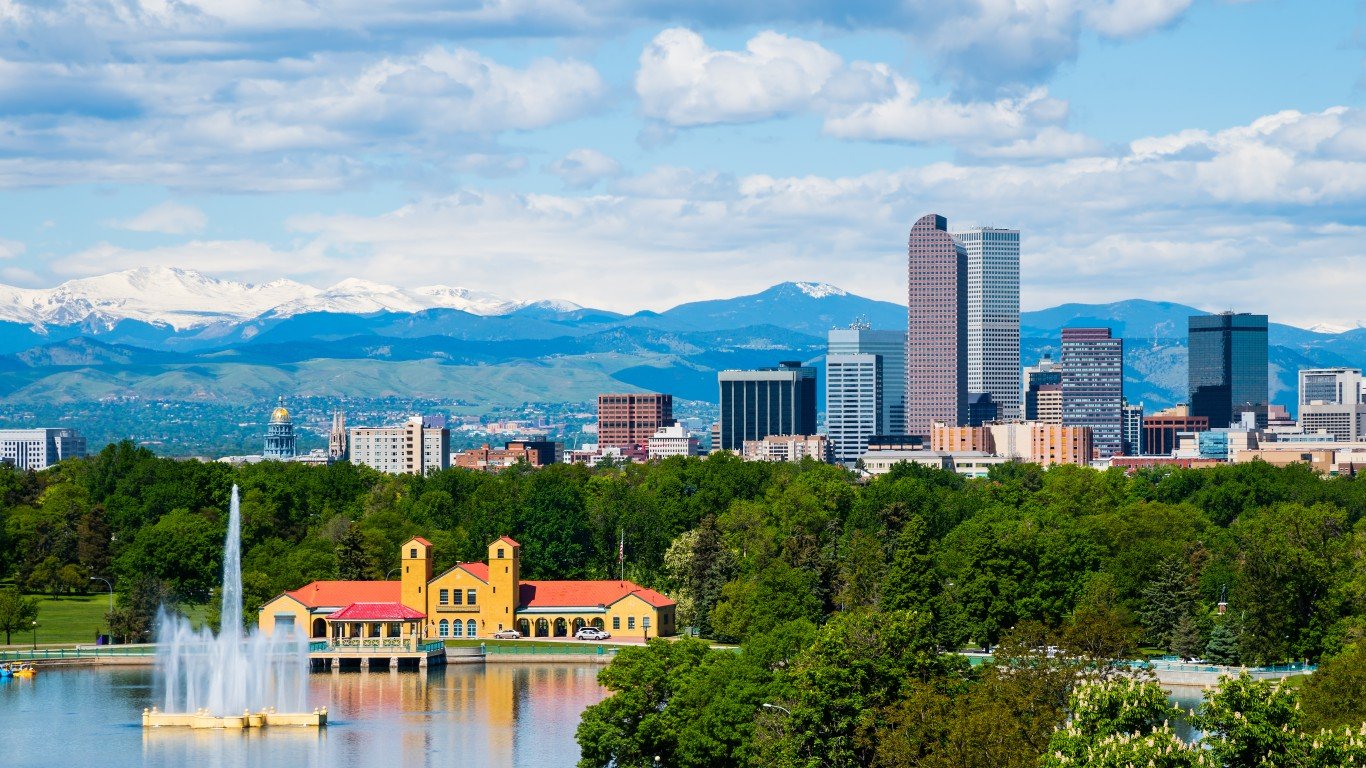
47. Denver, Colorado
> 2001-2020 sightings per 100K: 79.93
> Total sightings: 564
> Population 2019: 705,576
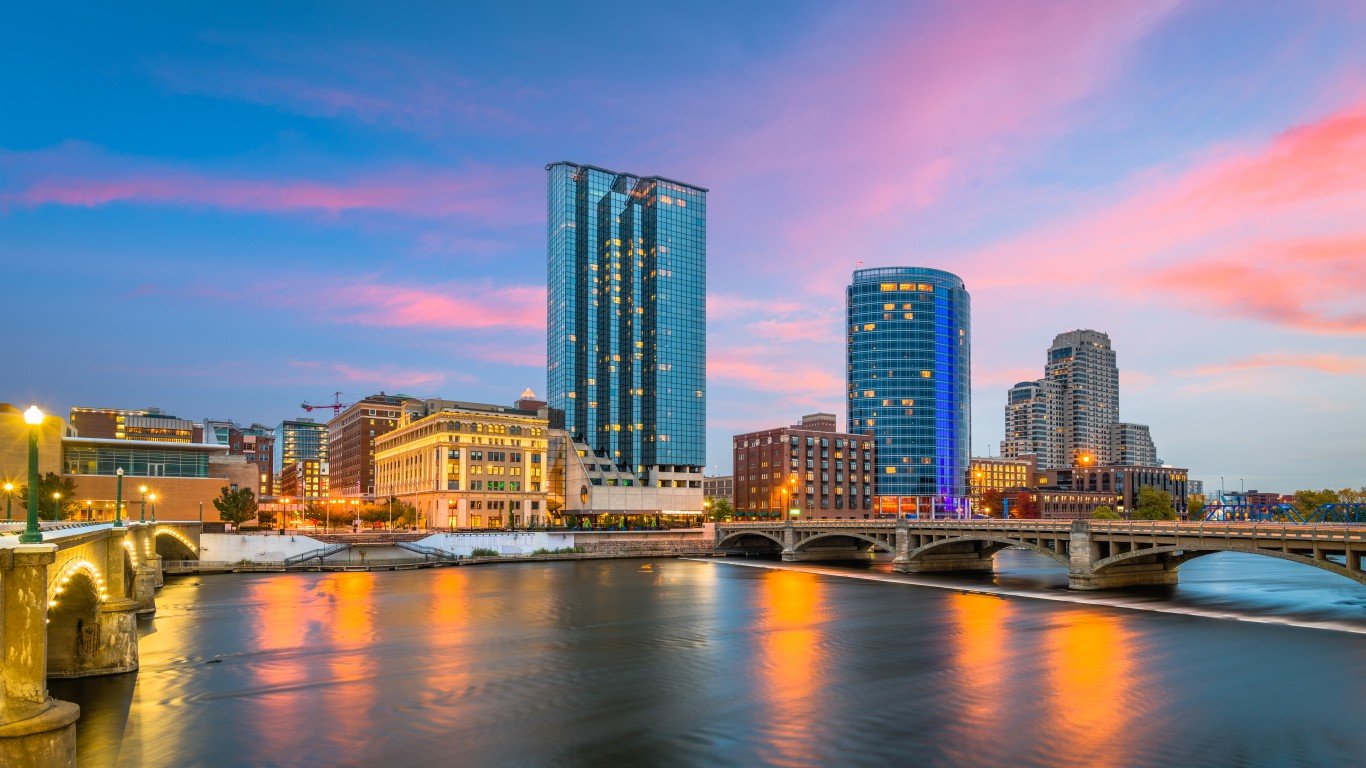
46. Grand Rapids, Michigan
> 2001-2020 sightings per 100K: 82.16
> Total sightings: 163
> Population 2019: 198,401
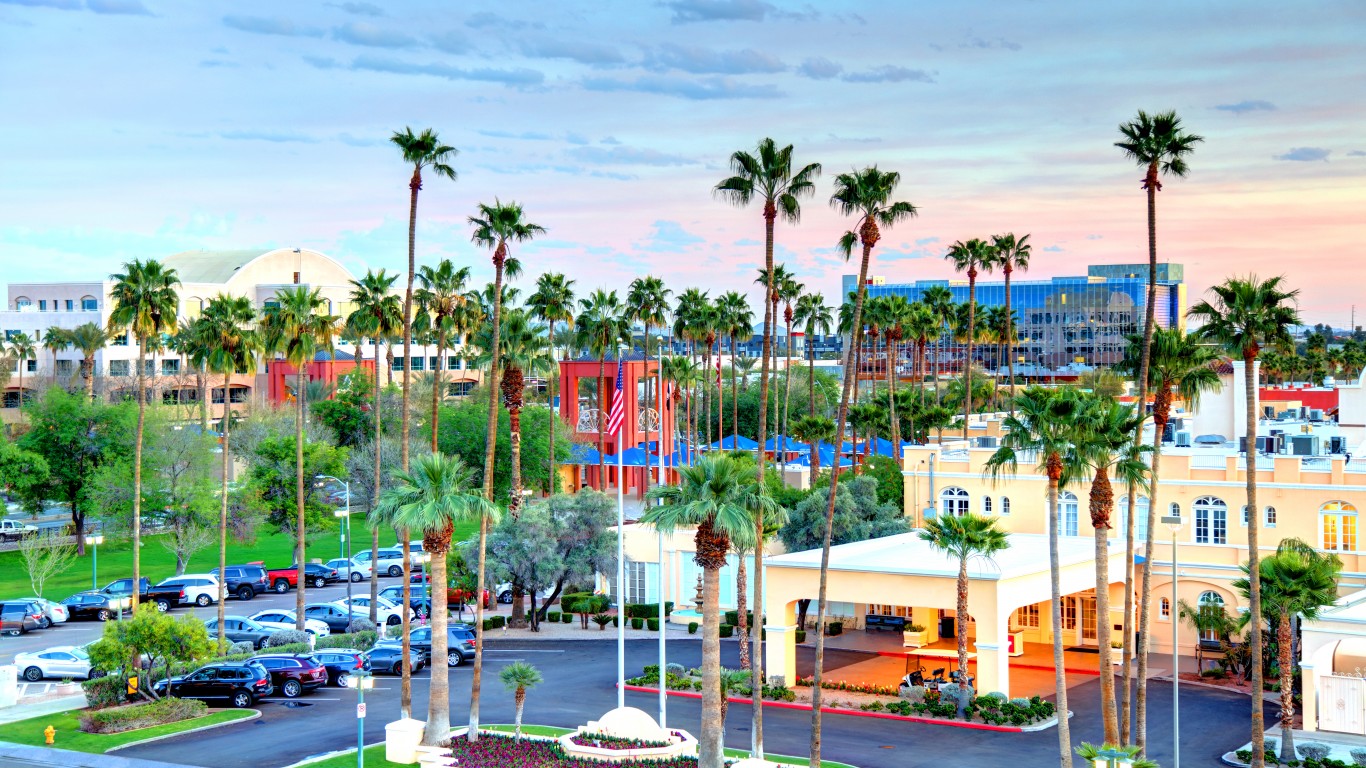
45. Chandler, Arizona
> 2001-2020 sightings per 100K: 82.71
> Total sightings: 209
> Population 2019: 252,692
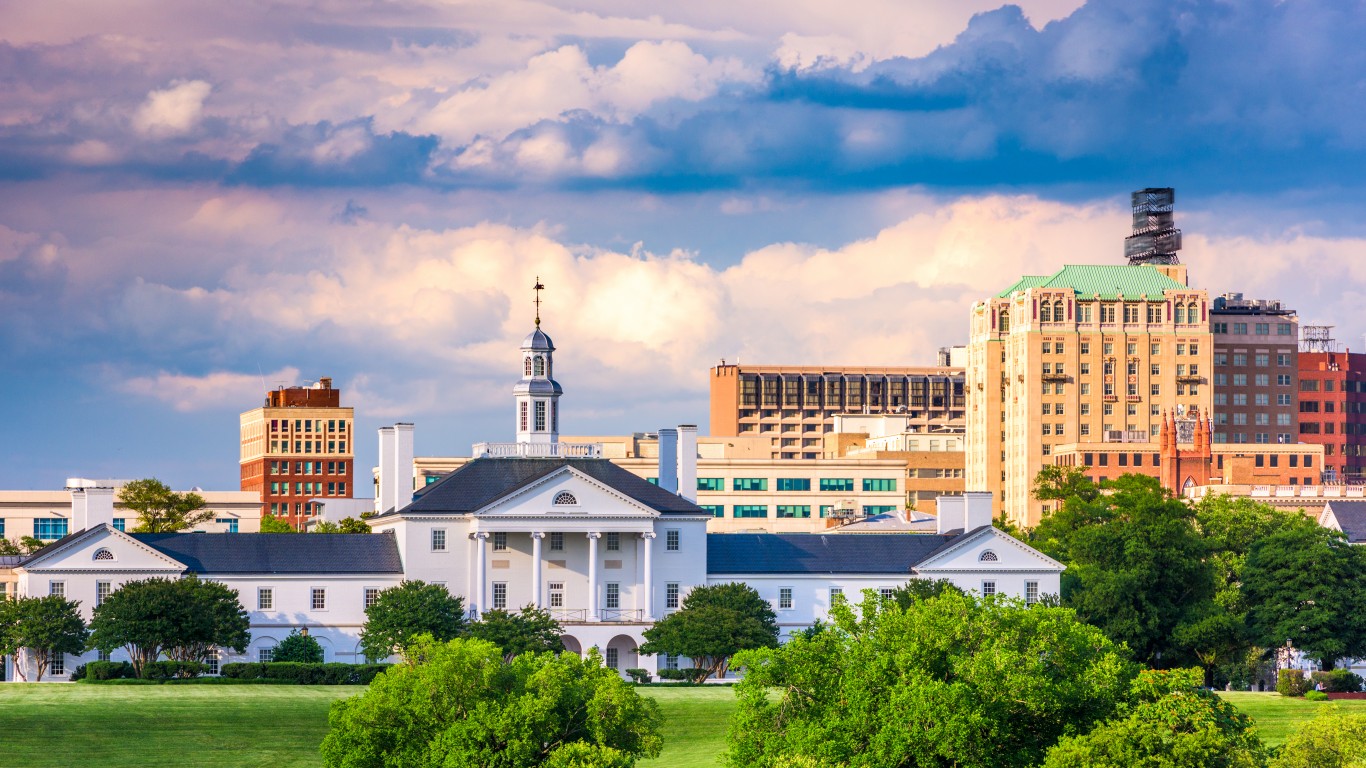
44. Richmond, Virginia
> 2001-2020 sightings per 100K: 86.49
> Total sightings: 196
> Population 2019: 226,622
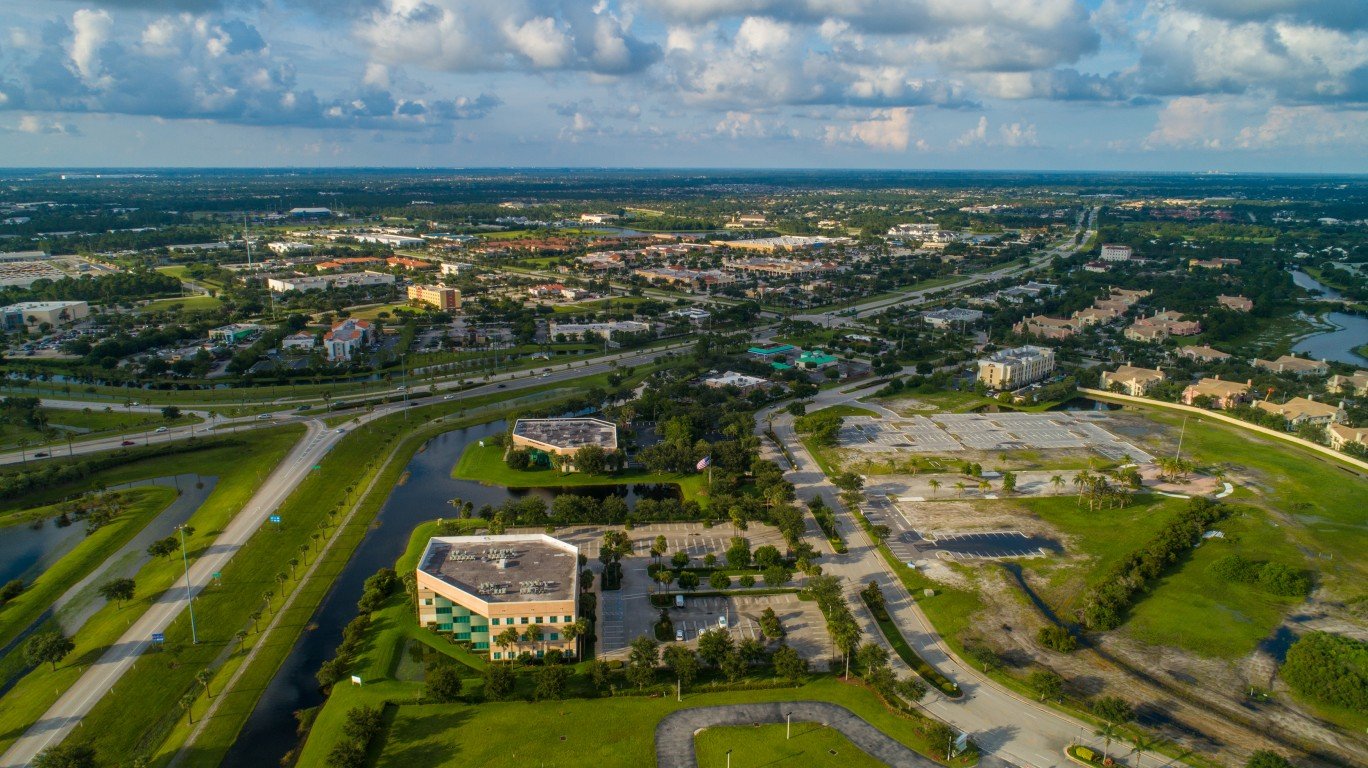
43. Port St. Lucie, Florida
> 2001-2020 sightings per 100K: 87.12
> Total sightings: 165
> Population 2019: 189,396
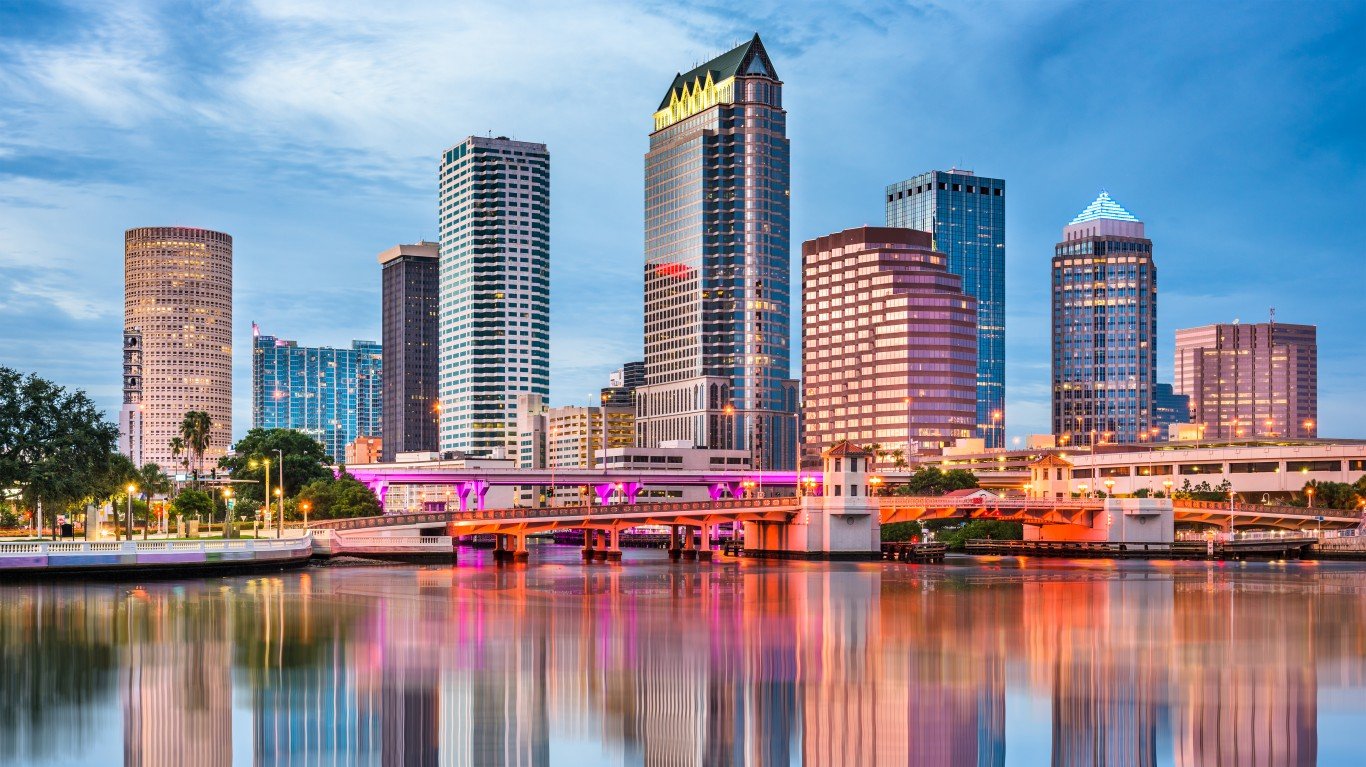
42. Tampa, Florida
> 2001-2020 sightings per 100K: 87.13
> Total sightings: 338
> Population 2019: 387,916
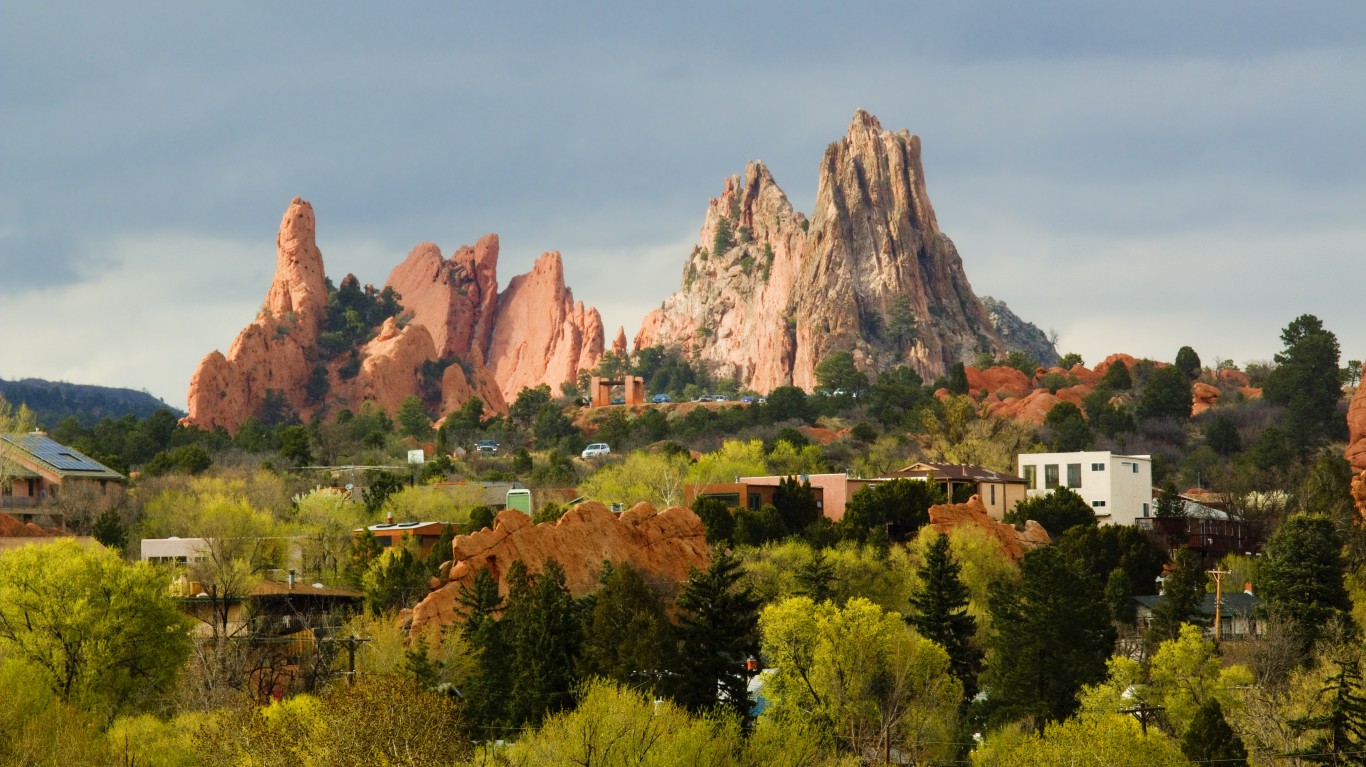
41. Colorado Springs, Colorado
> 2001-2020 sightings per 100K: 87.34
> Total sightings: 406
> Population 2019: 464,871
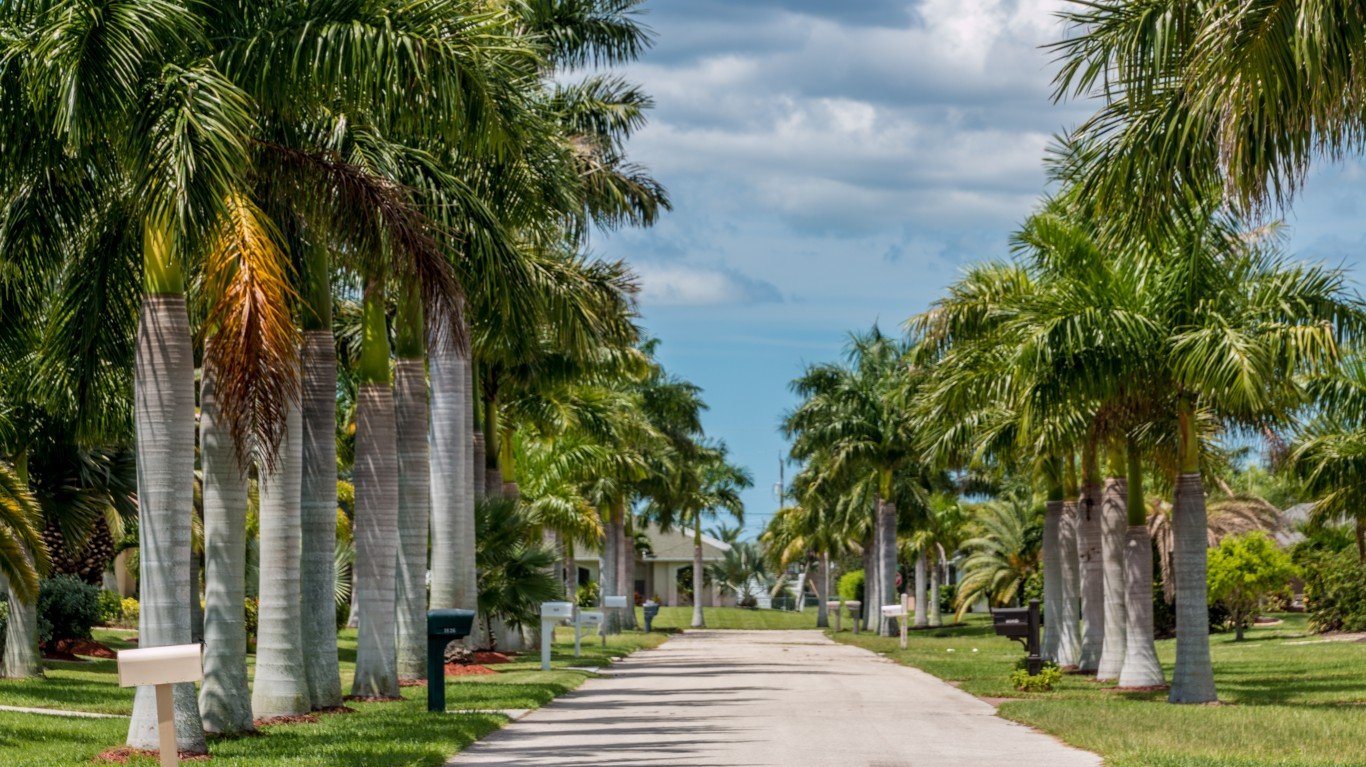
40. Cape Coral, Florida
> 2001-2020 sightings per 100K: 88.07
> Total sightings: 162
> Population 2019: 183,942
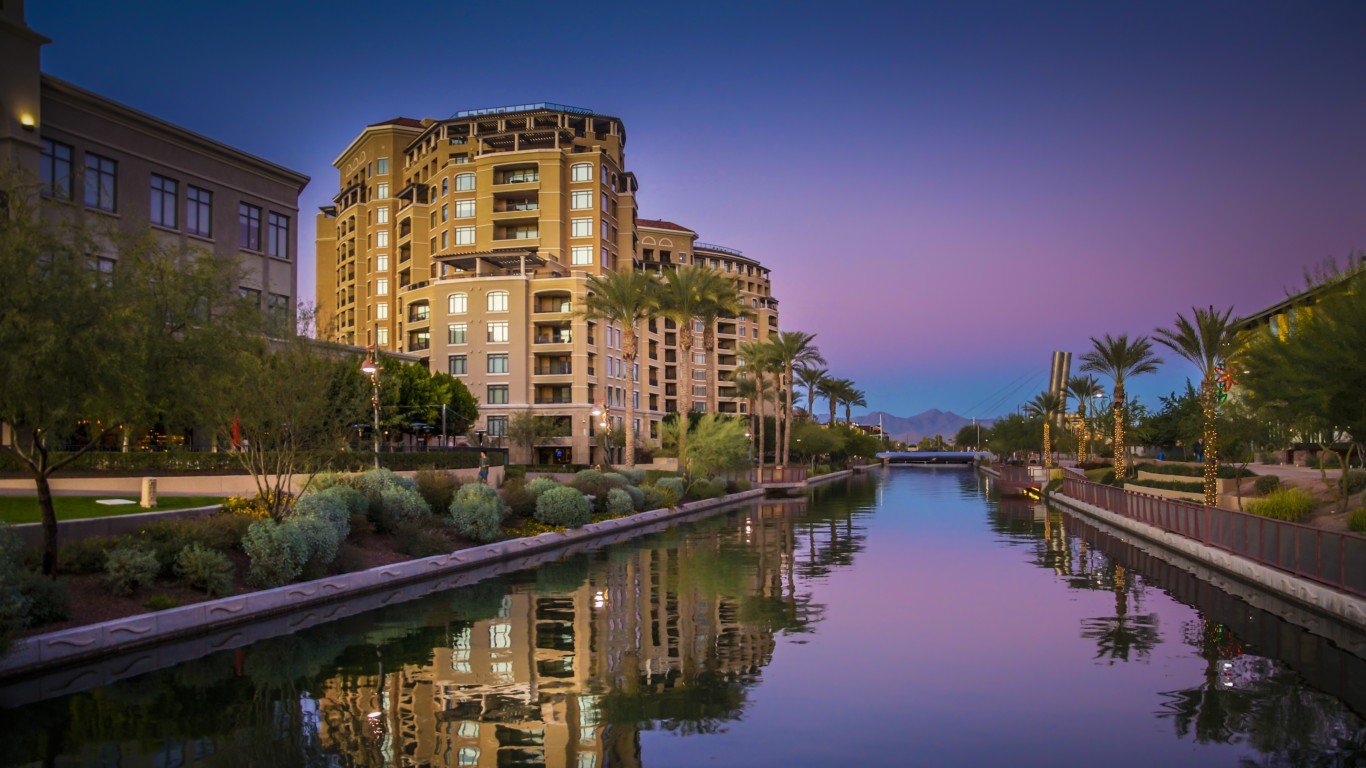
39. Scottsdale, Arizona
> 2001-2020 sightings per 100K: 90.98
> Total sightings: 228
> Population 2019: 250,602
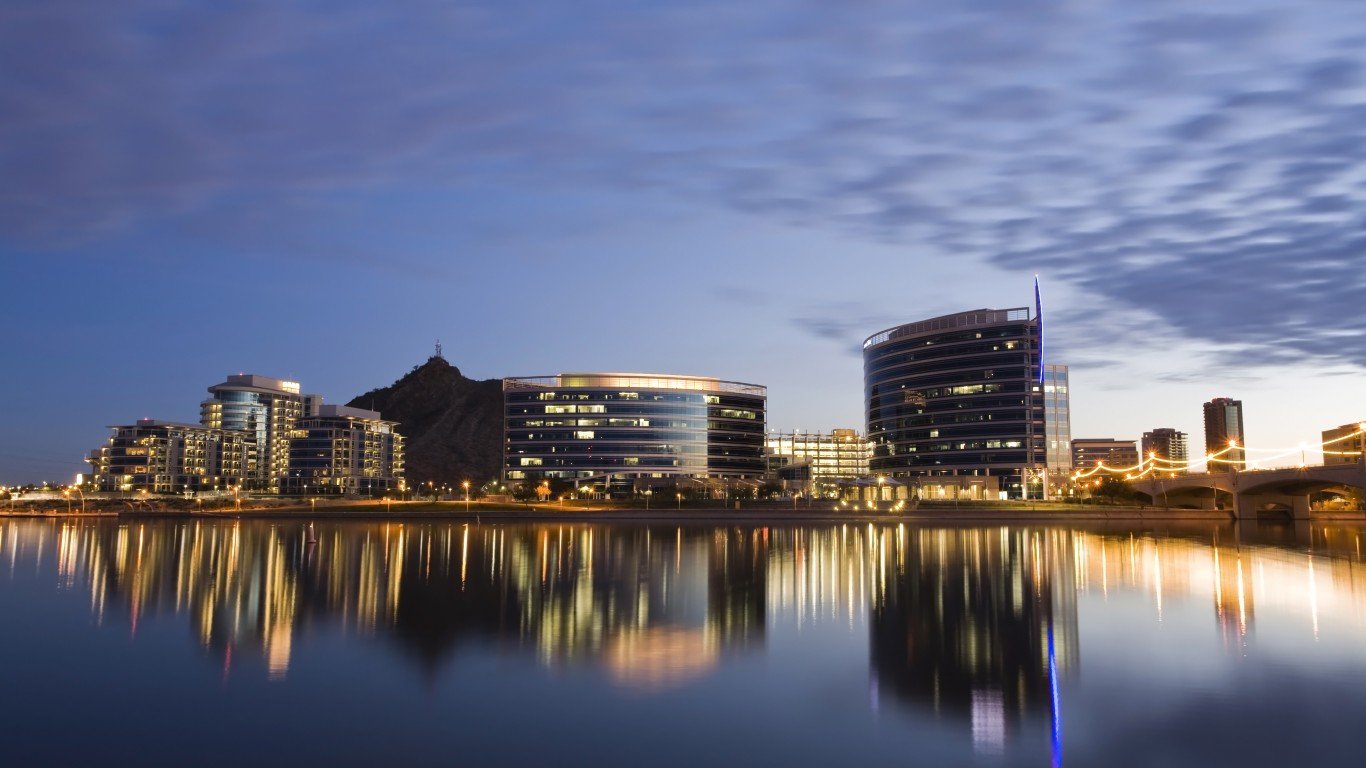
38. Tempe, Arizona
> 2001-2020 sightings per 100K: 91.22
> Total sightings: 171
> Population 2019: 187,454
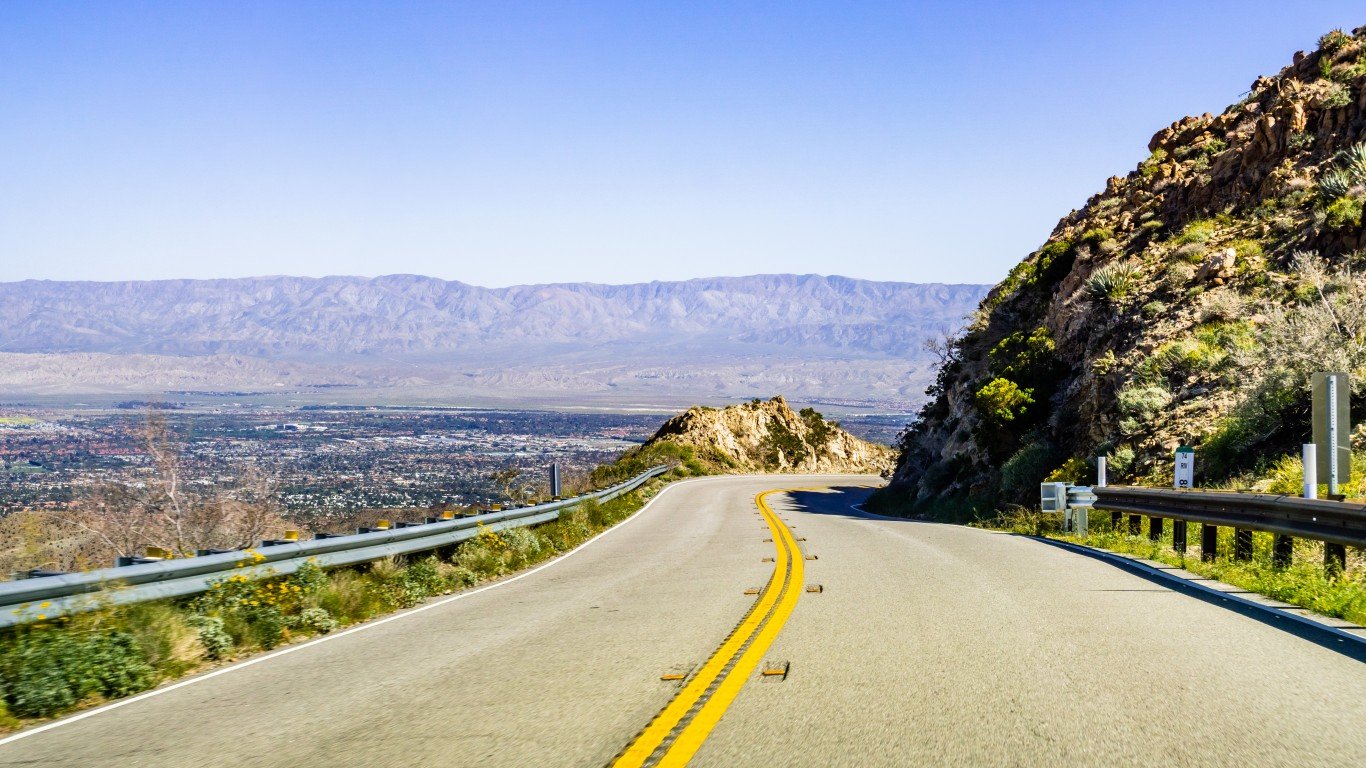
37. Santa Rosa, California
> 2001-2020 sightings per 100K: 91.26
> Total sightings: 164
> Population 2019: 179,701
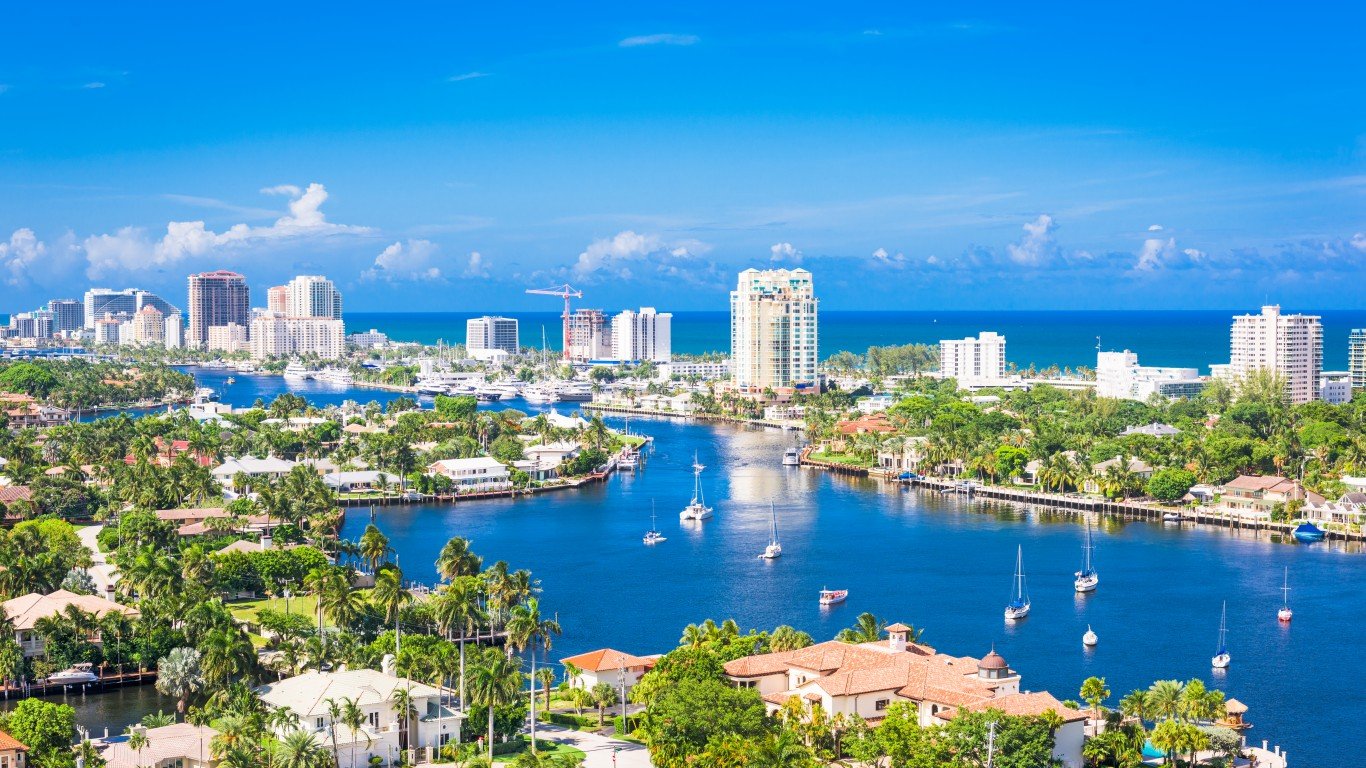
36. Fort Lauderdale, Florida
> 2001-2020 sightings per 100K: 91.60
> Total sightings: 165
> Population 2019: 180,124
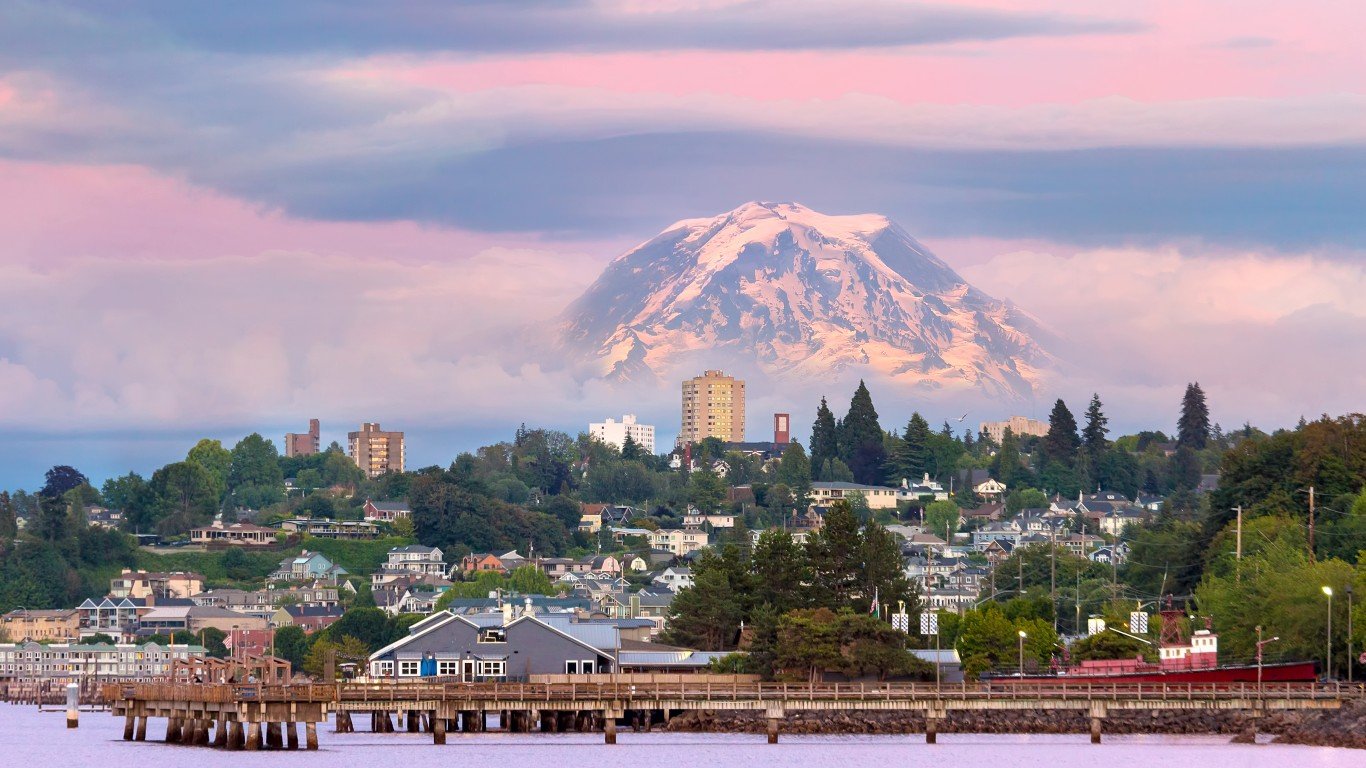
35. Tacoma, Washington
> 2001-2020 sightings per 100K: 93.95
> Total sightings: 200
> Population 2019: 212,869
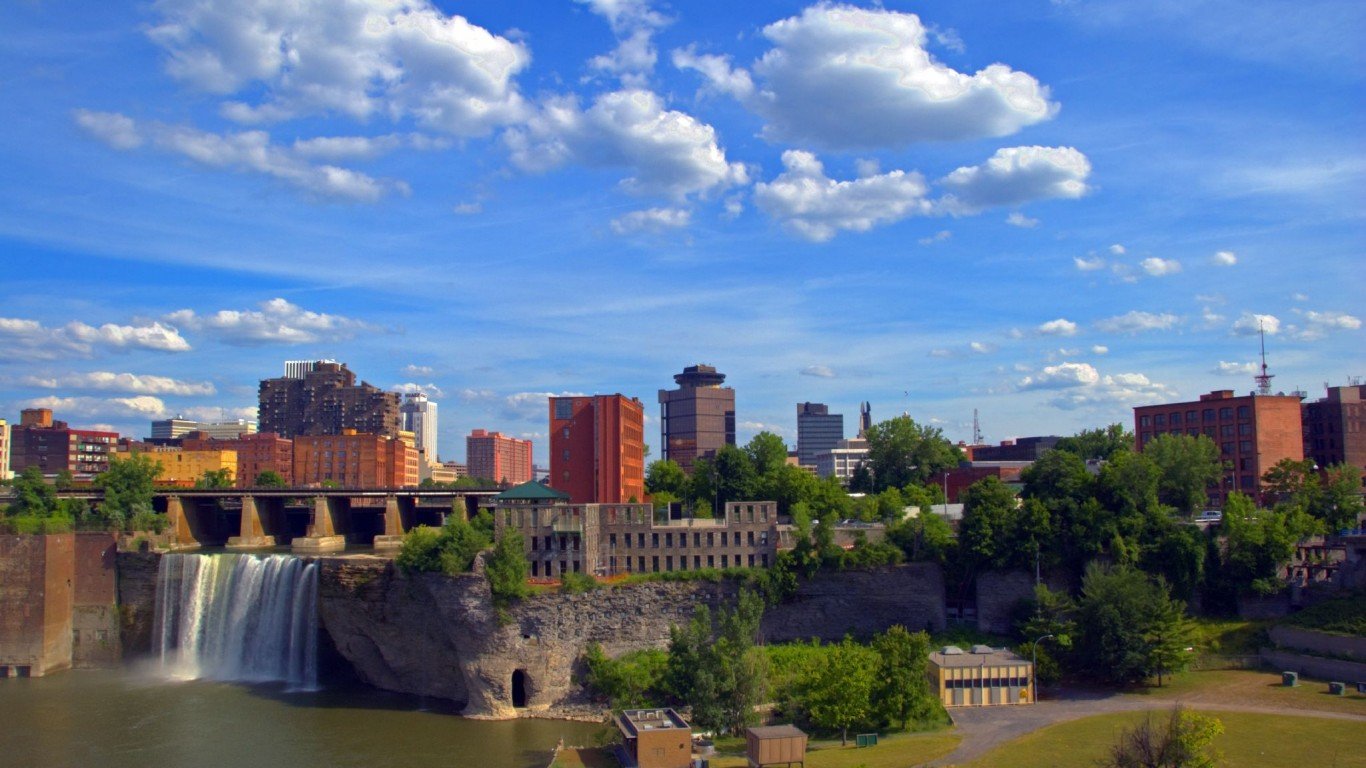
34. Rochester, New York
> 2001-2020 sightings per 100K: 95.72
> Total sightings: 198
> Population 2019: 206,848
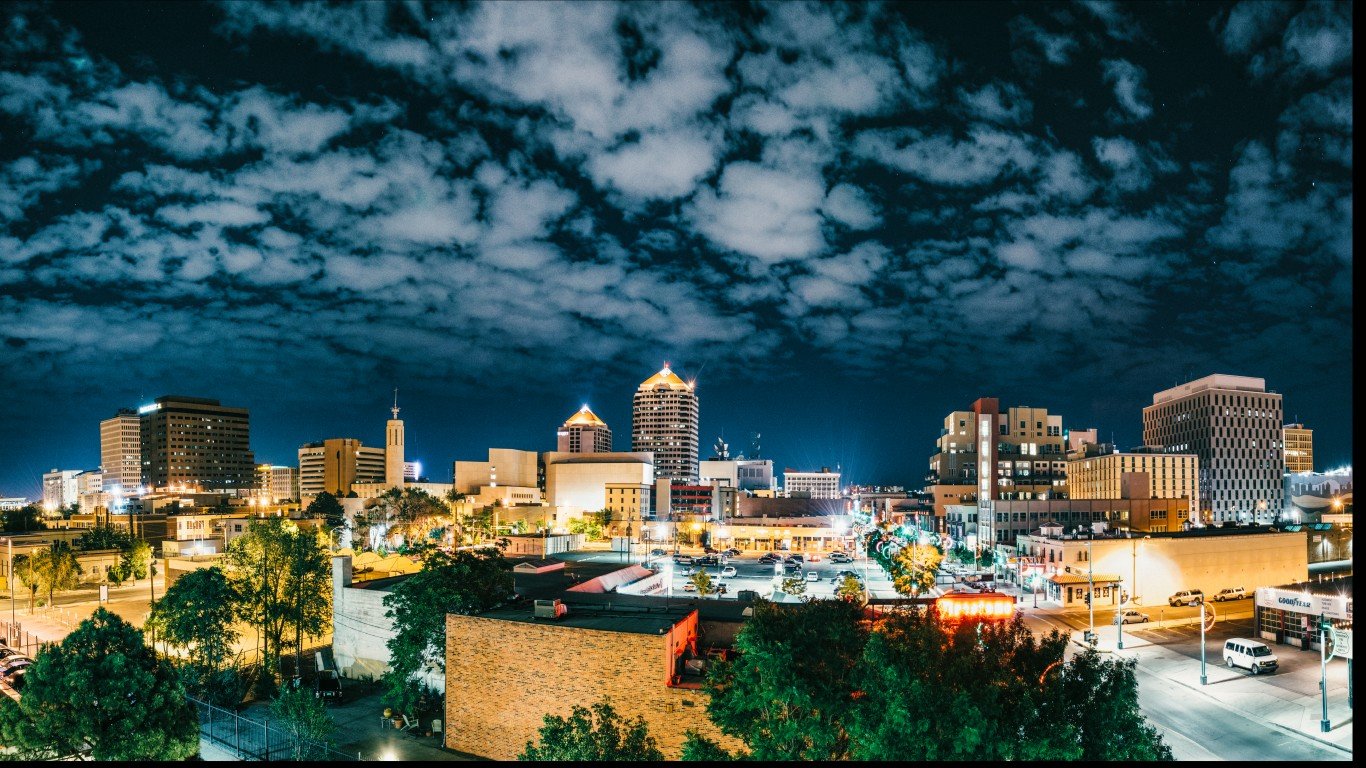
33. Albuquerque, New Mexico
> 2001-2020 sightings per 100K: 96.72
> Total sightings: 541
> Population 2019: 559,374
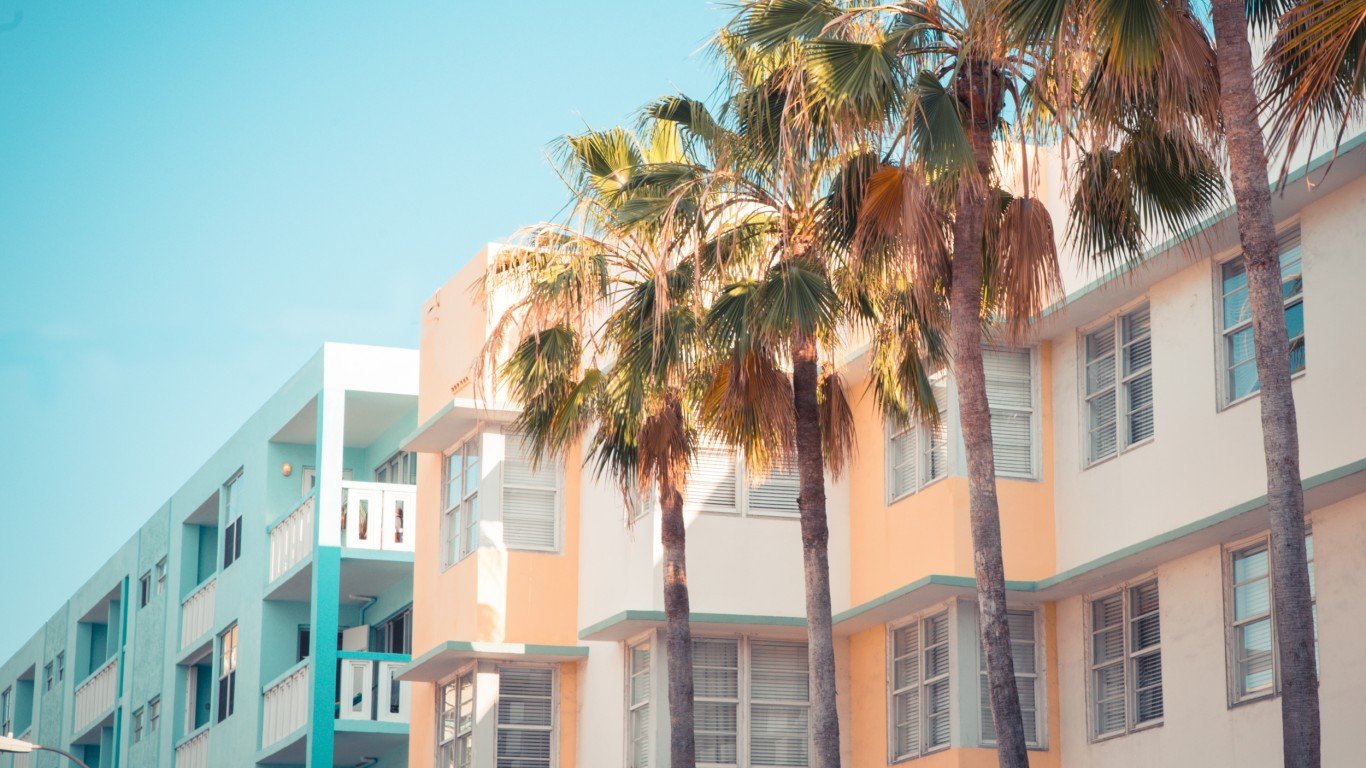
32. Miami, Florida
> 2001-2020 sightings per 100K: 98.18
> Total sightings: 446
> Population 2019: 454,279
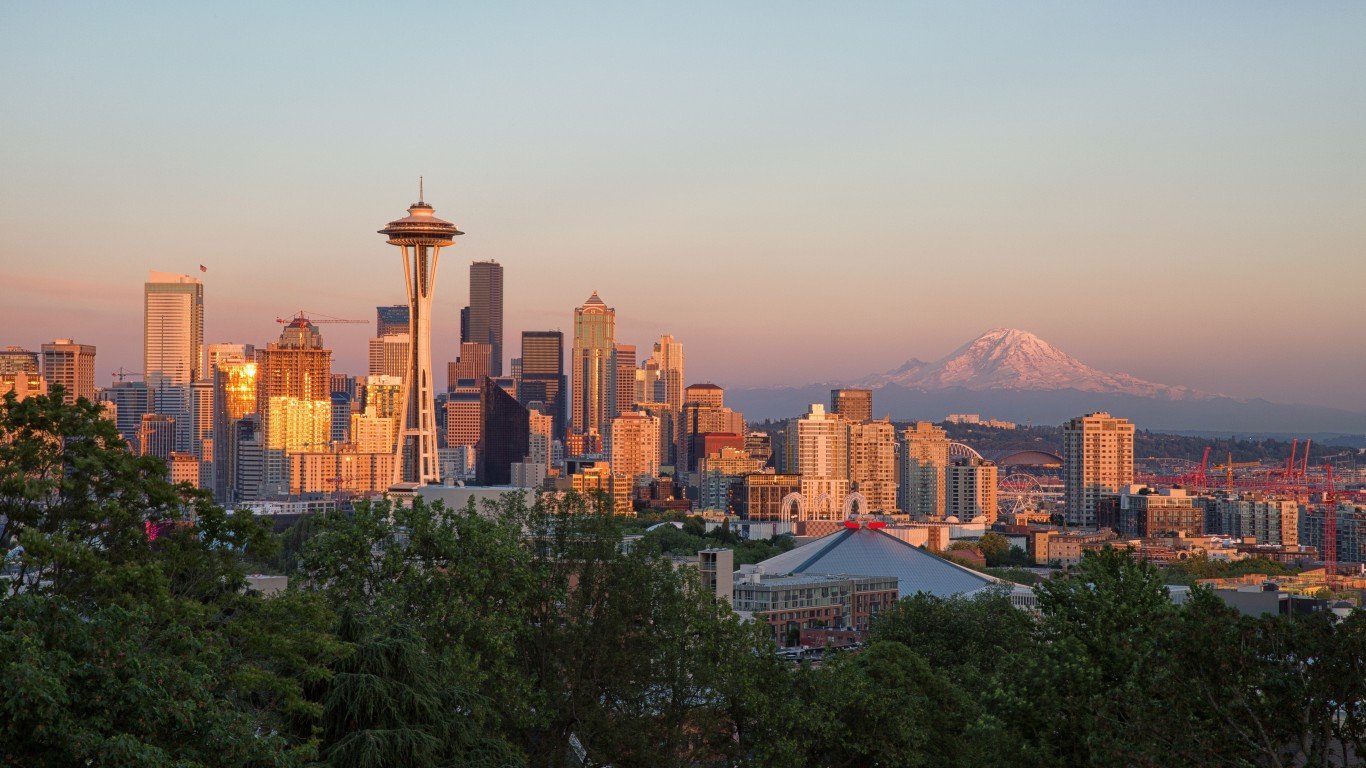
31. Seattle, Washington
> 2001-2020 sightings per 100K: 101.20
> Total sightings: 733
> Population 2019: 724,305
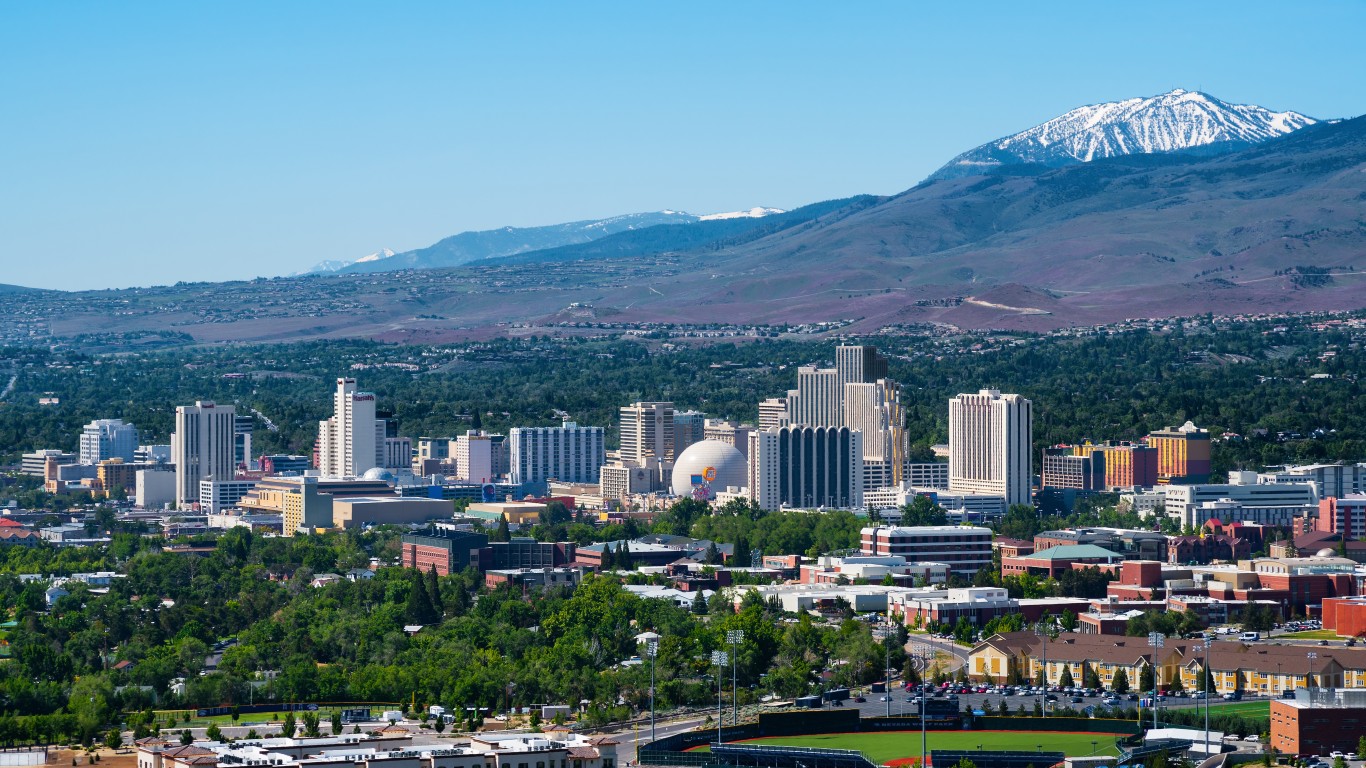
30. Reno, Nevada
> 2001-2020 sightings per 100K: 105.88
> Total sightings: 261
> Population 2019: 246,500
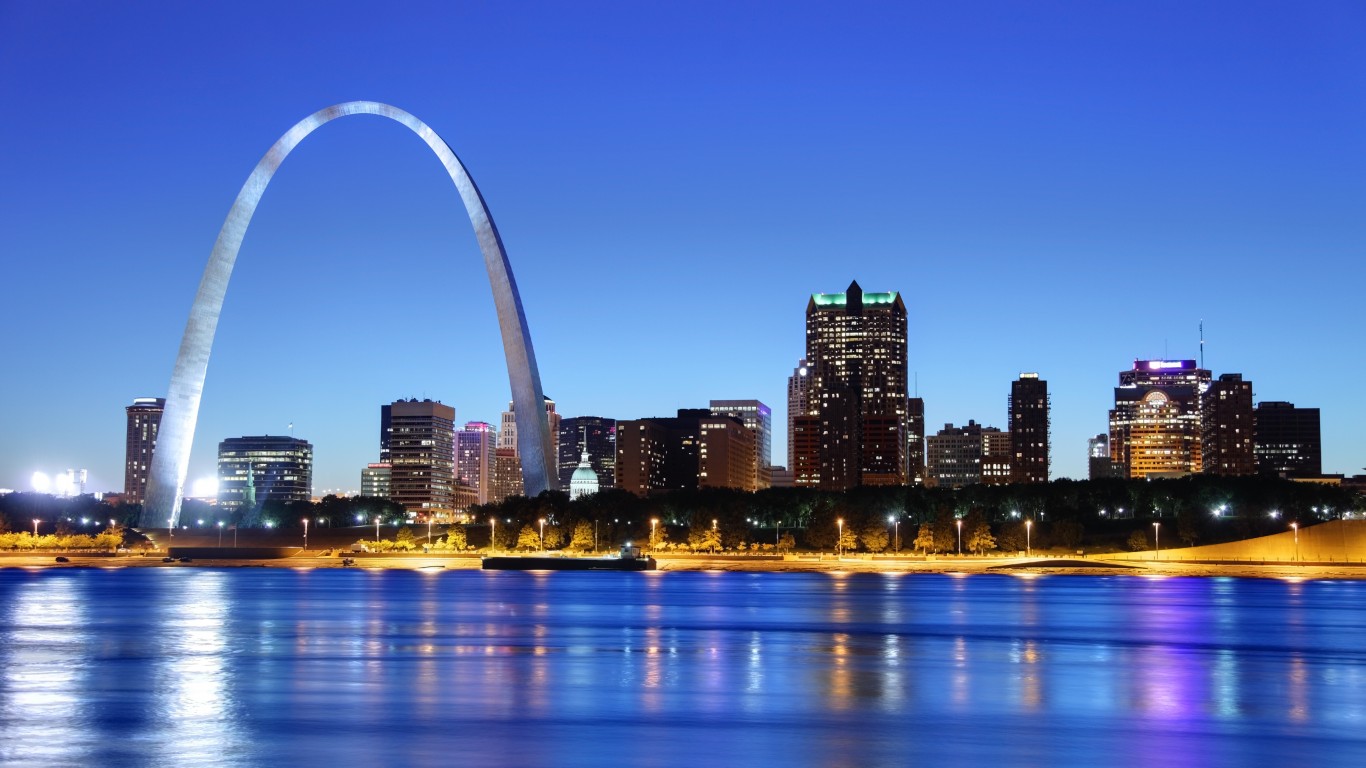
29. St. Louis, Missouri
> 2001-2020 sightings per 100K: 106.11
> Total sightings: 327
> Population 2019: 308,174
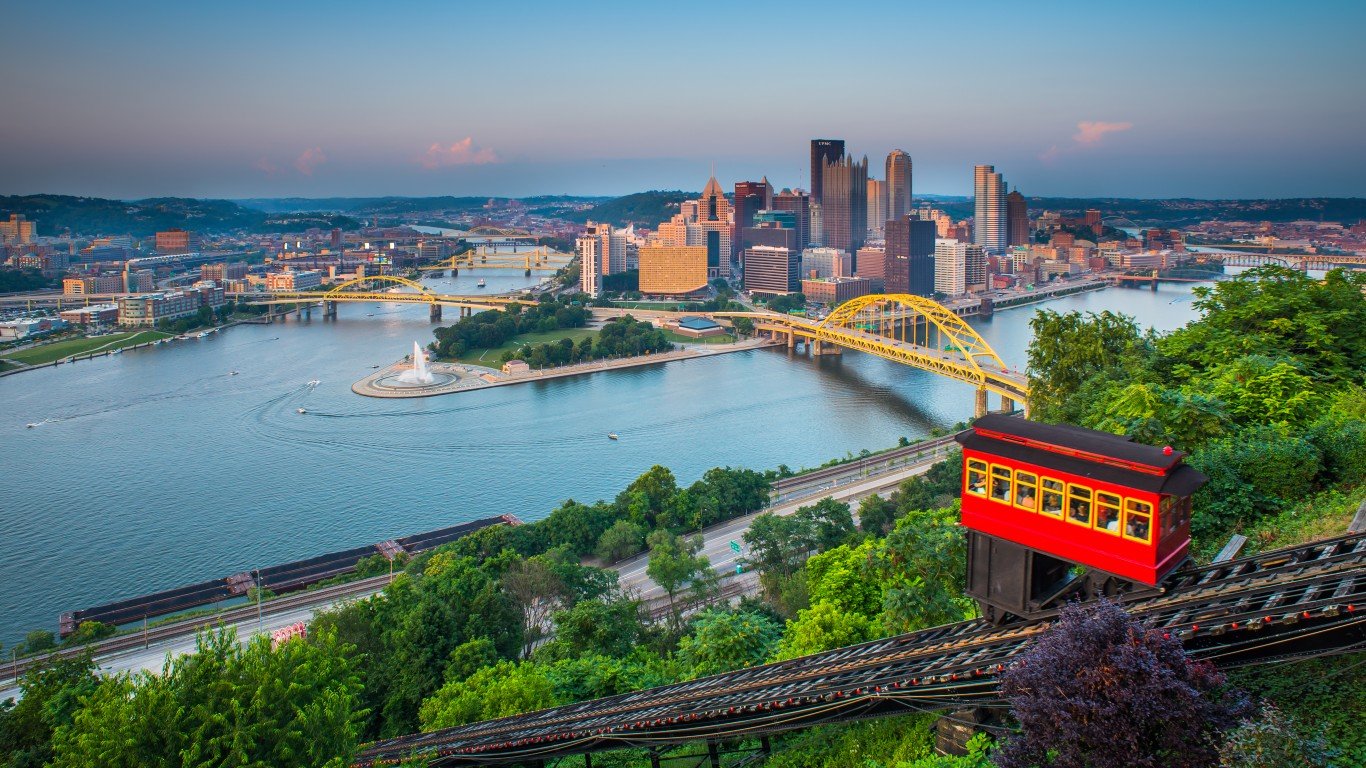
28. Pittsburgh, Pennsylvania
> 2001-2020 sightings per 100K: 110.19
> Total sightings: 333
> Population 2019: 302,205
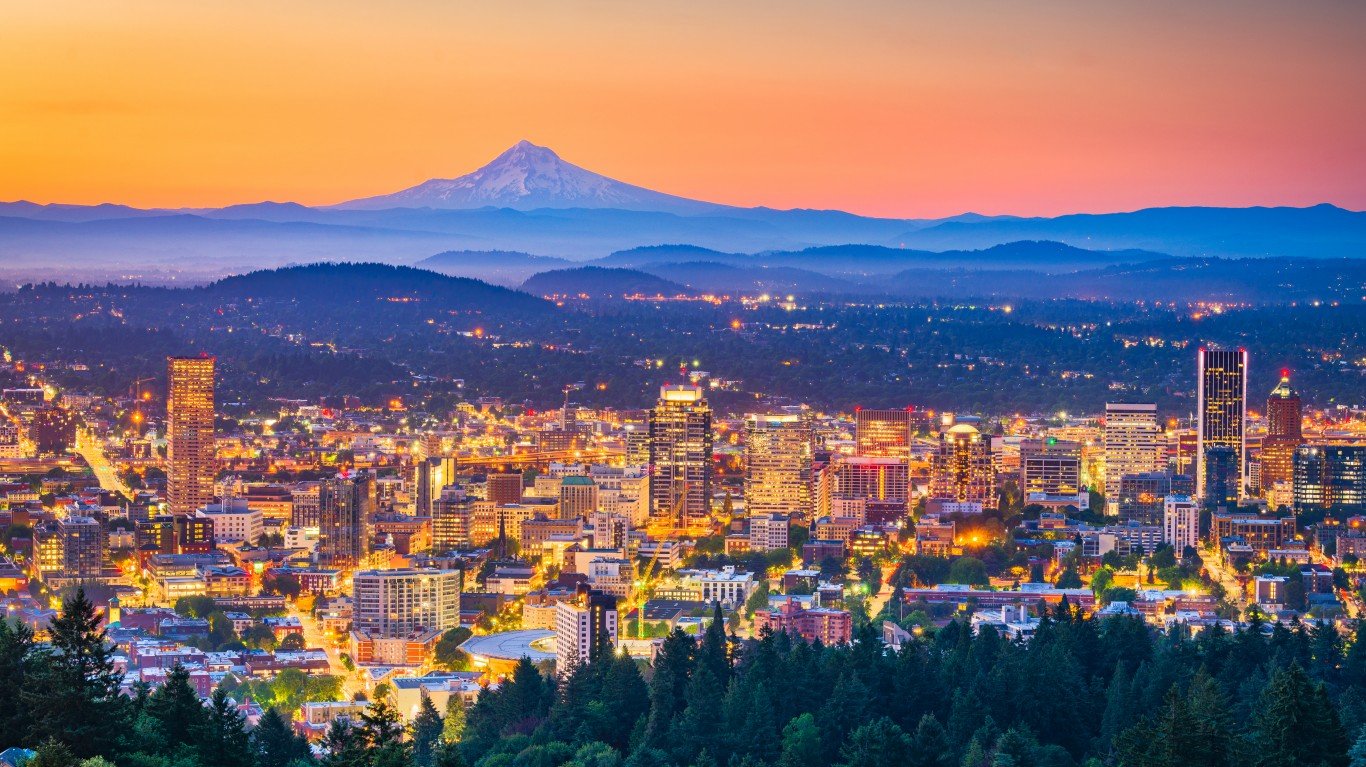
27. Portland, Oregon
> 2001-2020 sightings per 100K: 110.34
> Total sightings: 712
> Population 2019: 645,291
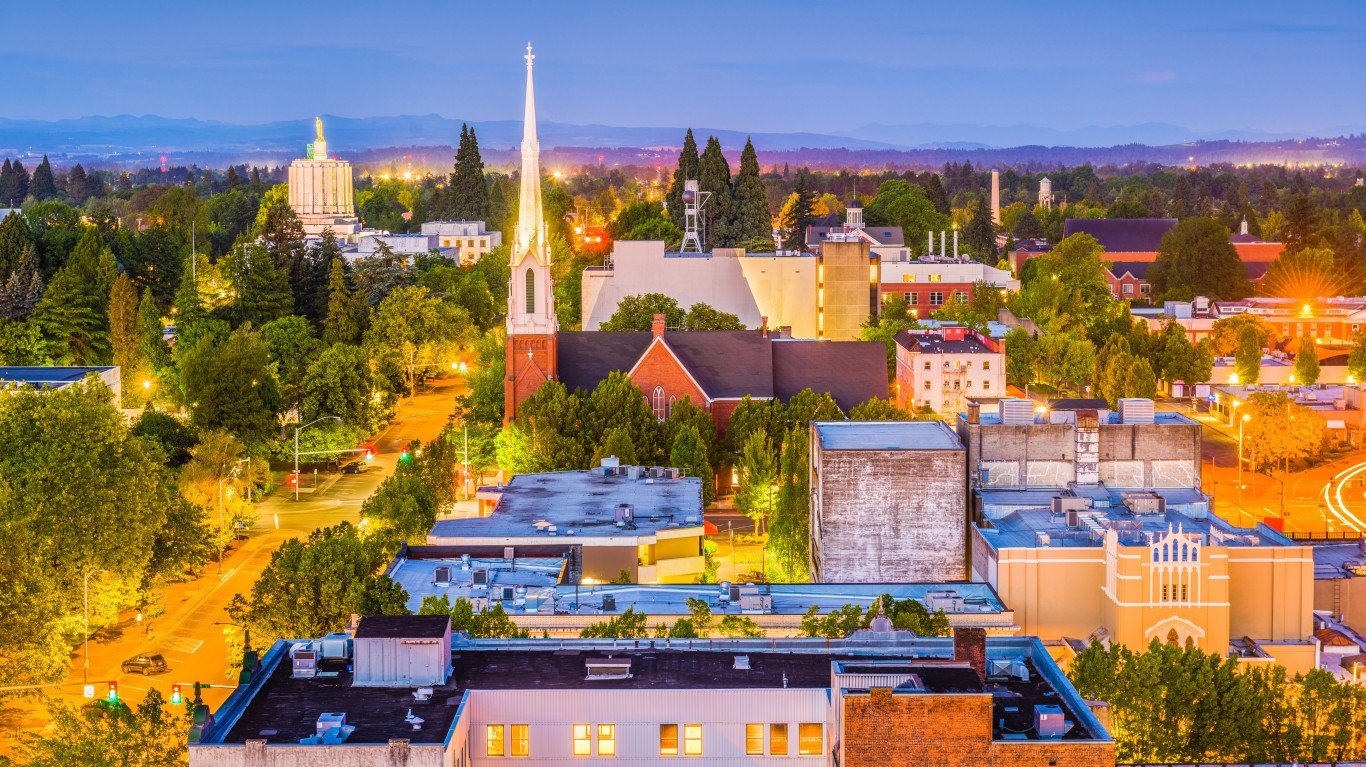
26. Salem, Oregon
> 2001-2020 sightings per 100K: 115.21
> Total sightings: 195
> Population 2019: 169,259
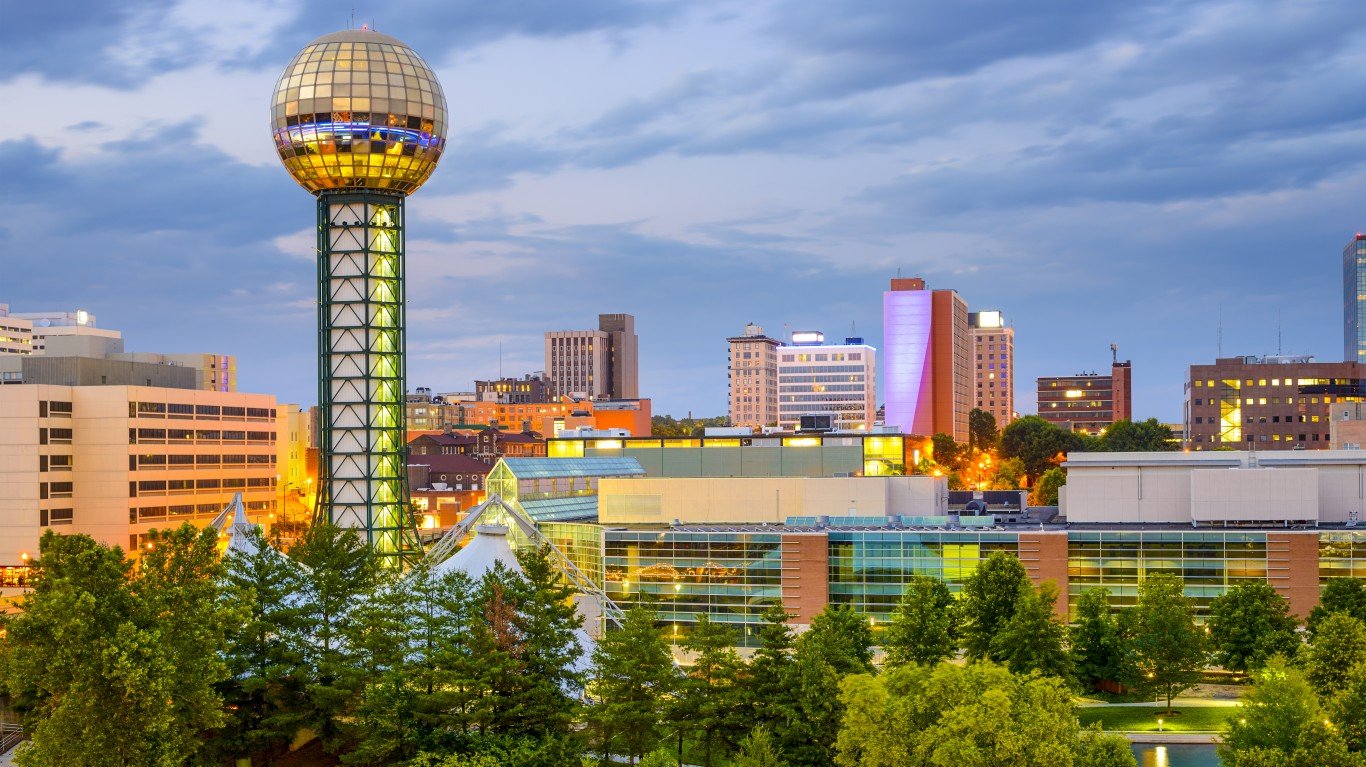
25. Knoxville, Tennessee
> 2001-2020 sightings per 100K: 115.48
> Total sightings: 215
> Population 2019: 186,173
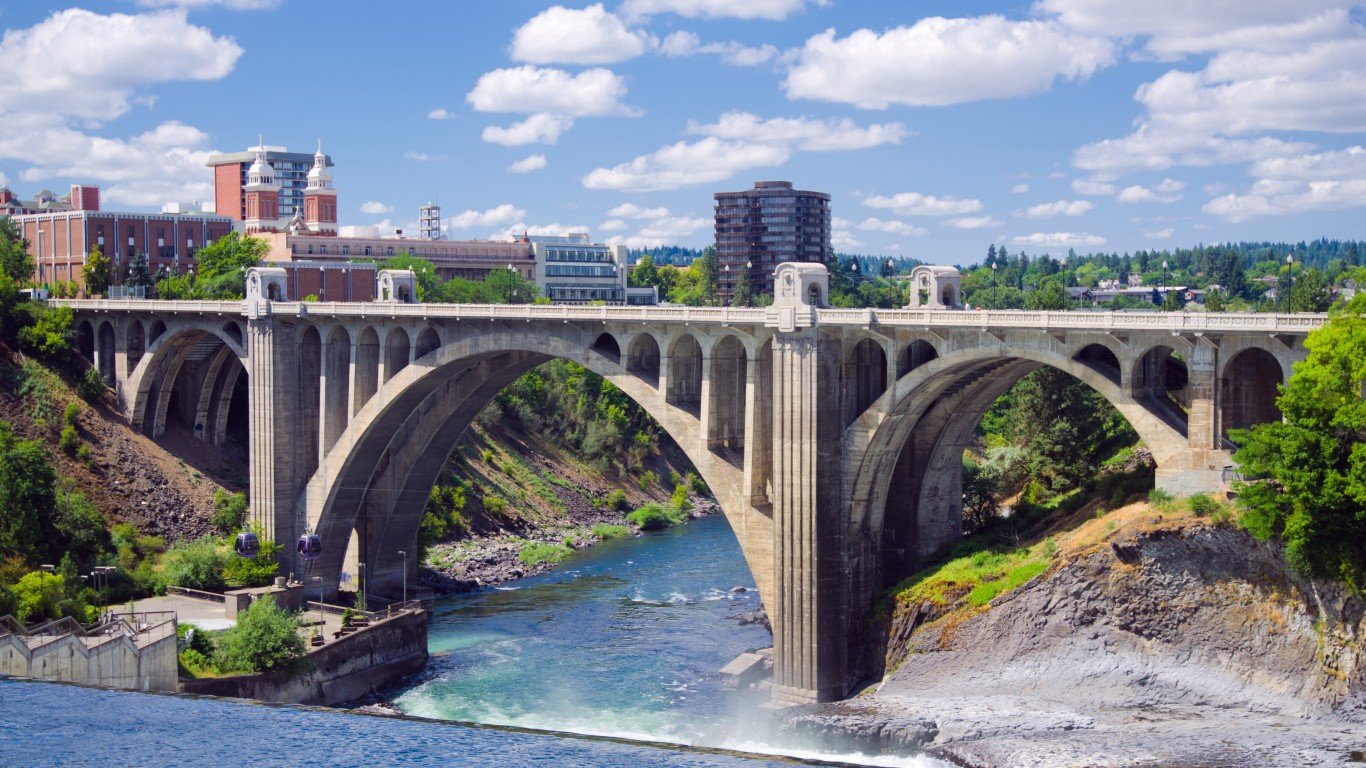
24. Spokane, Washington
> 2001-2020 sightings per 100K: 116.86
> Total sightings: 254
> Population 2019: 217,353
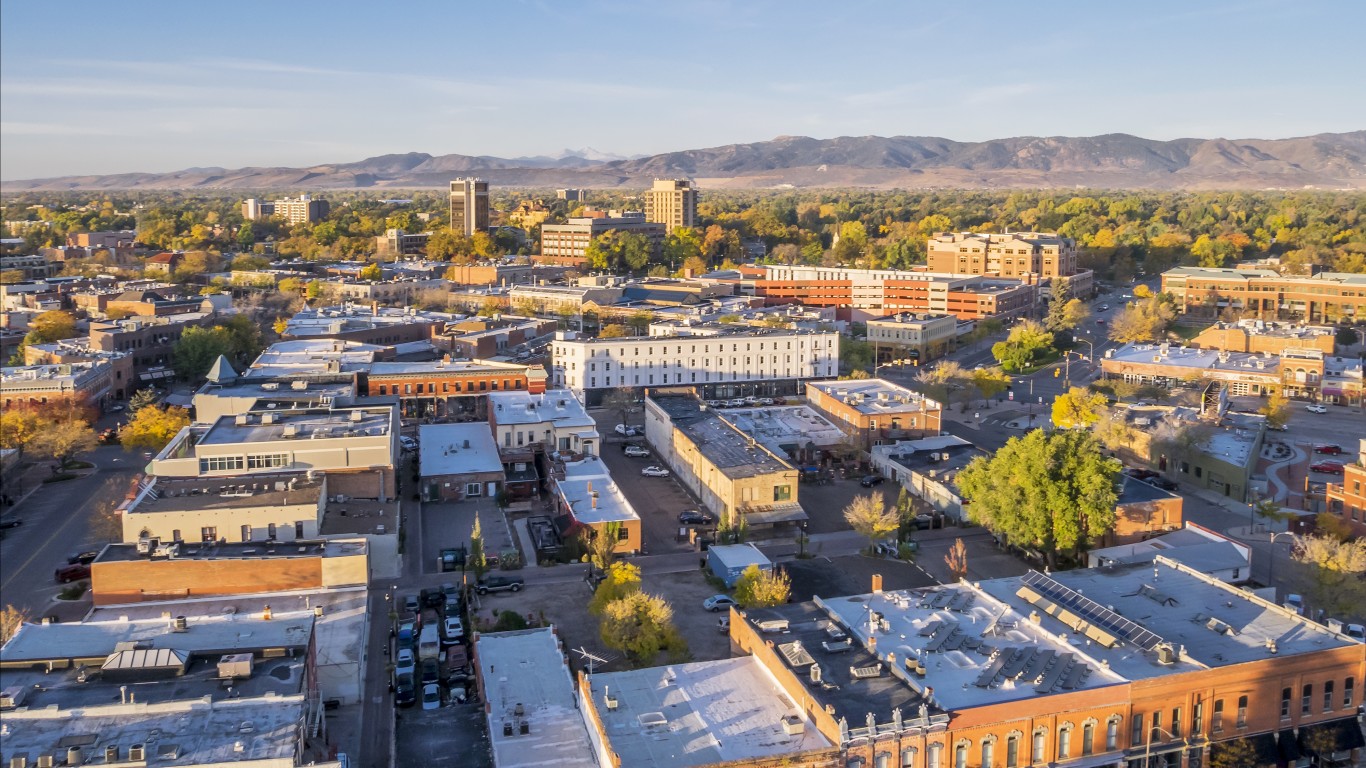
23. Fort Collins, Colorado
> 2001-2020 sightings per 100K: 121.37
> Total sightings: 201
> Population 2019: 165,609
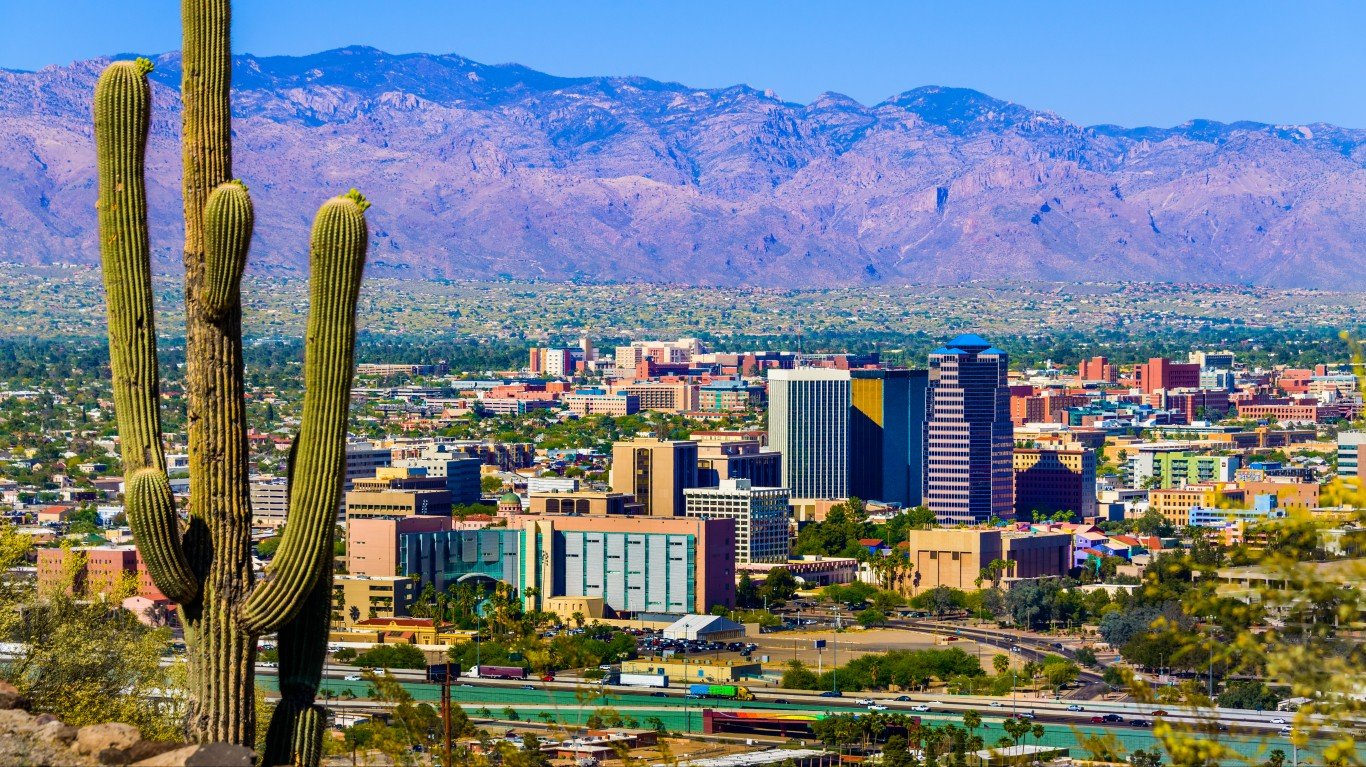
22. Tucson, Arizona
> 2001-2020 sightings per 100K: 124.84
> Total sightings: 676
> Population 2019: 541,482
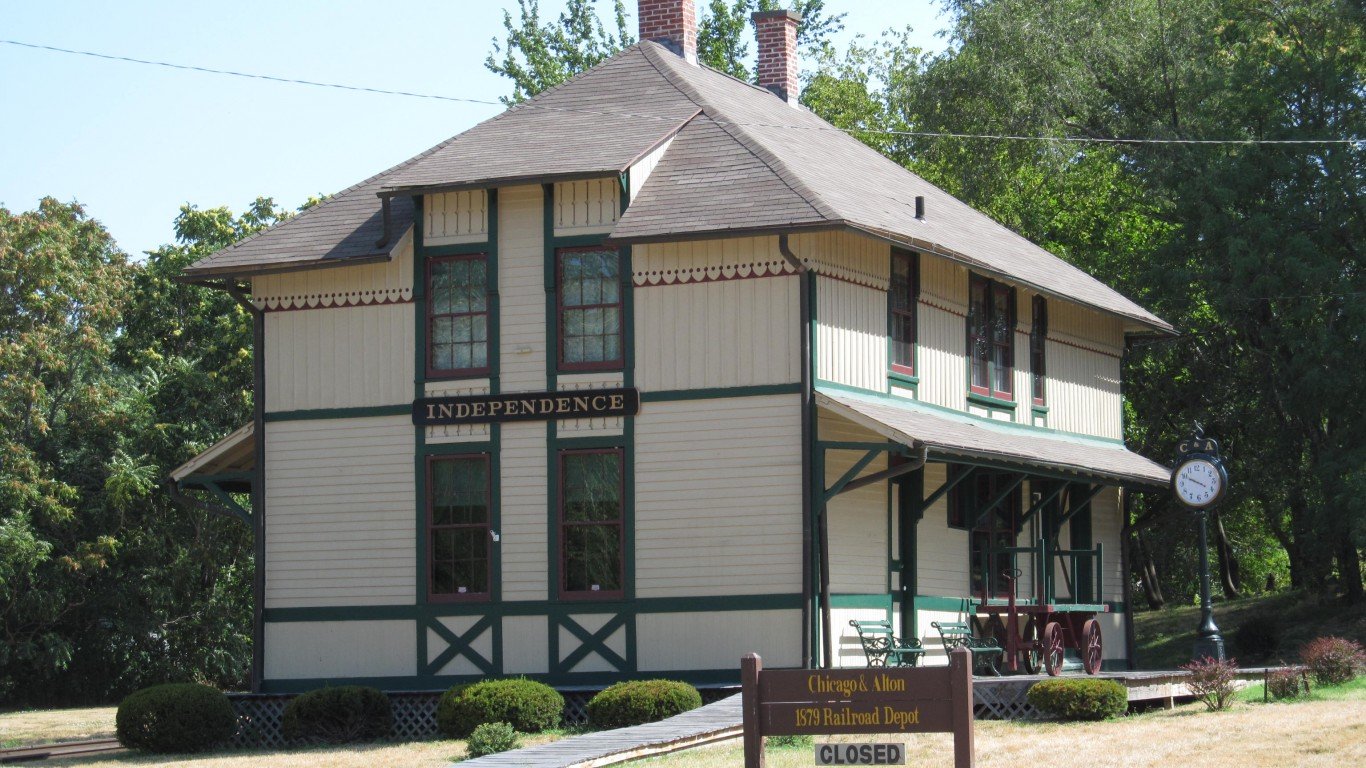
21. Independence, Missouri
> 2001-2020 sightings per 100K: 140.07
> Total sightings: 164
> Population 2019: 117,084
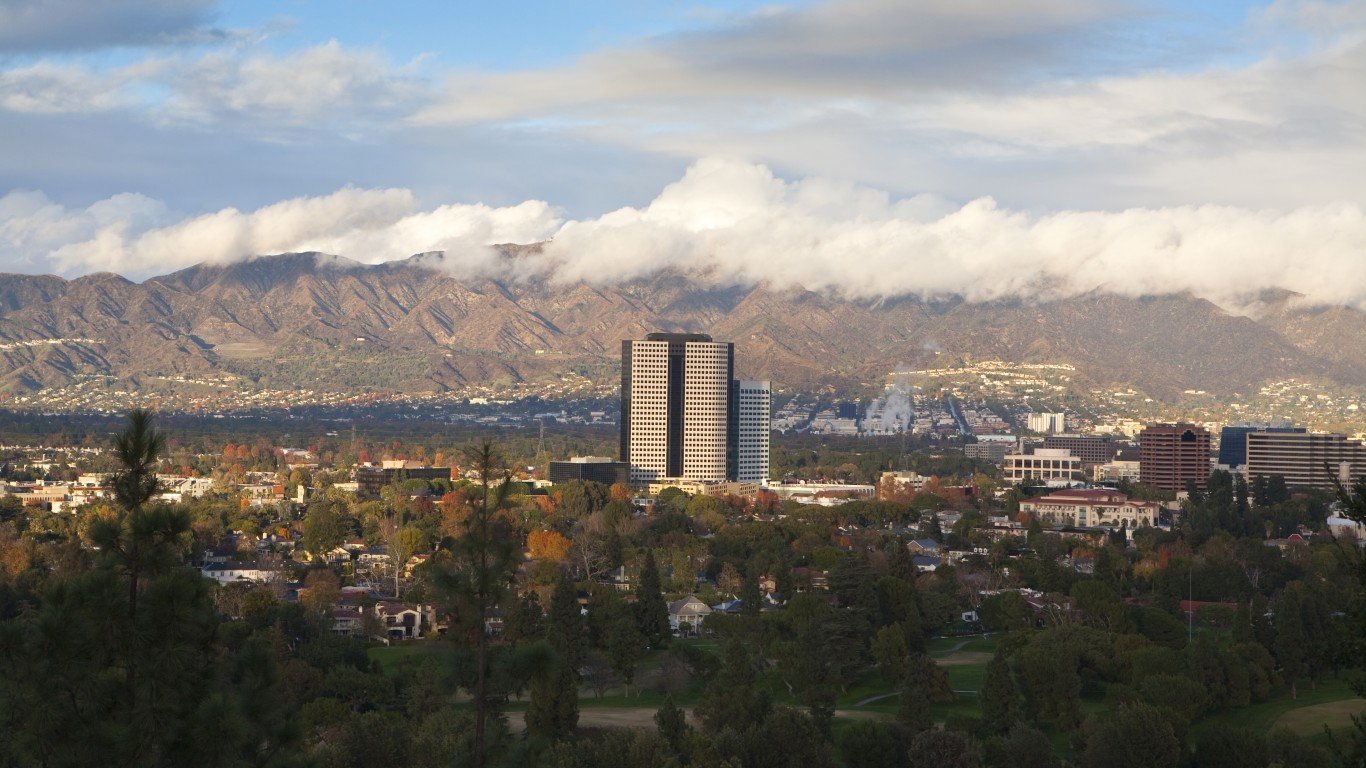
20. Burbank, California
> 2001-2020 sightings per 100K: 146.57
> Total sightings: 152
> Population 2019: 103,703
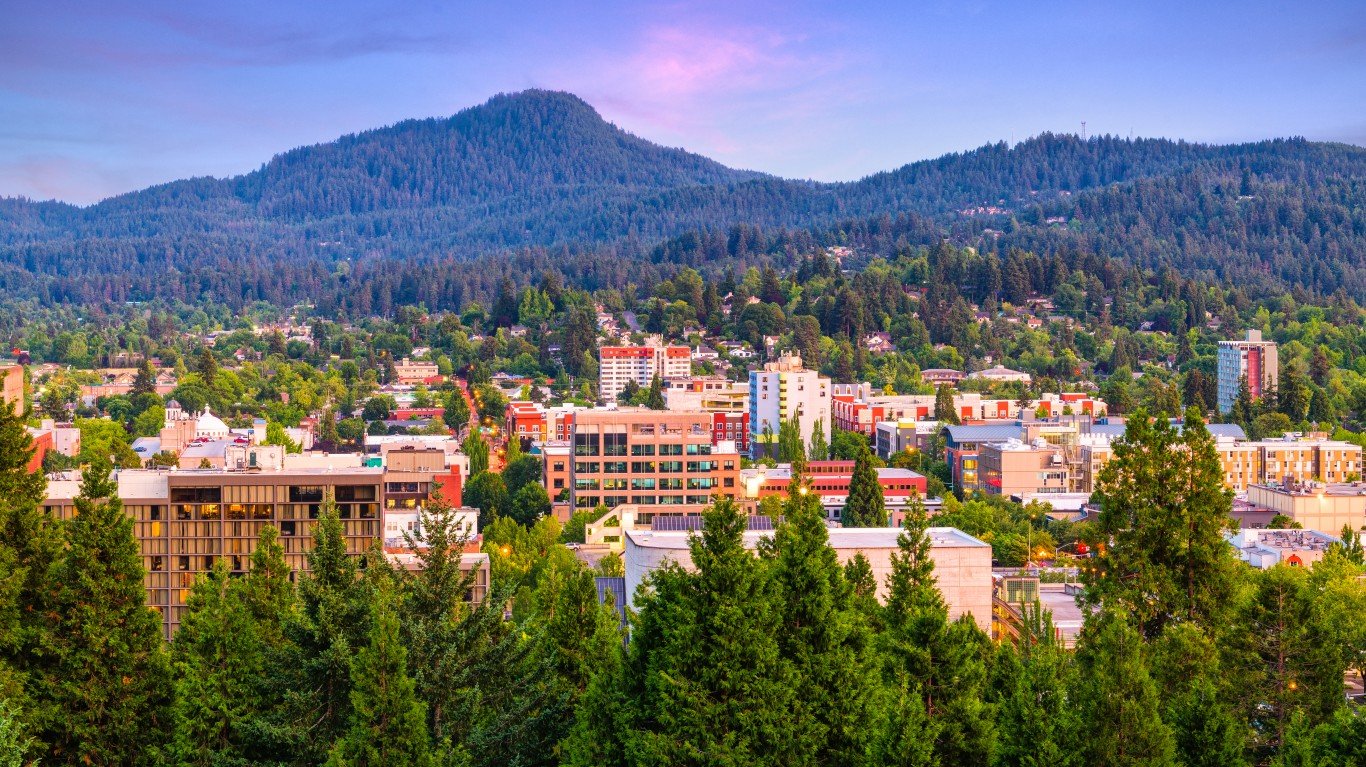
19. Eugene, Oregon
> 2001-2020 sightings per 100K: 148.54
> Total sightings: 250
> Population 2019: 168,302
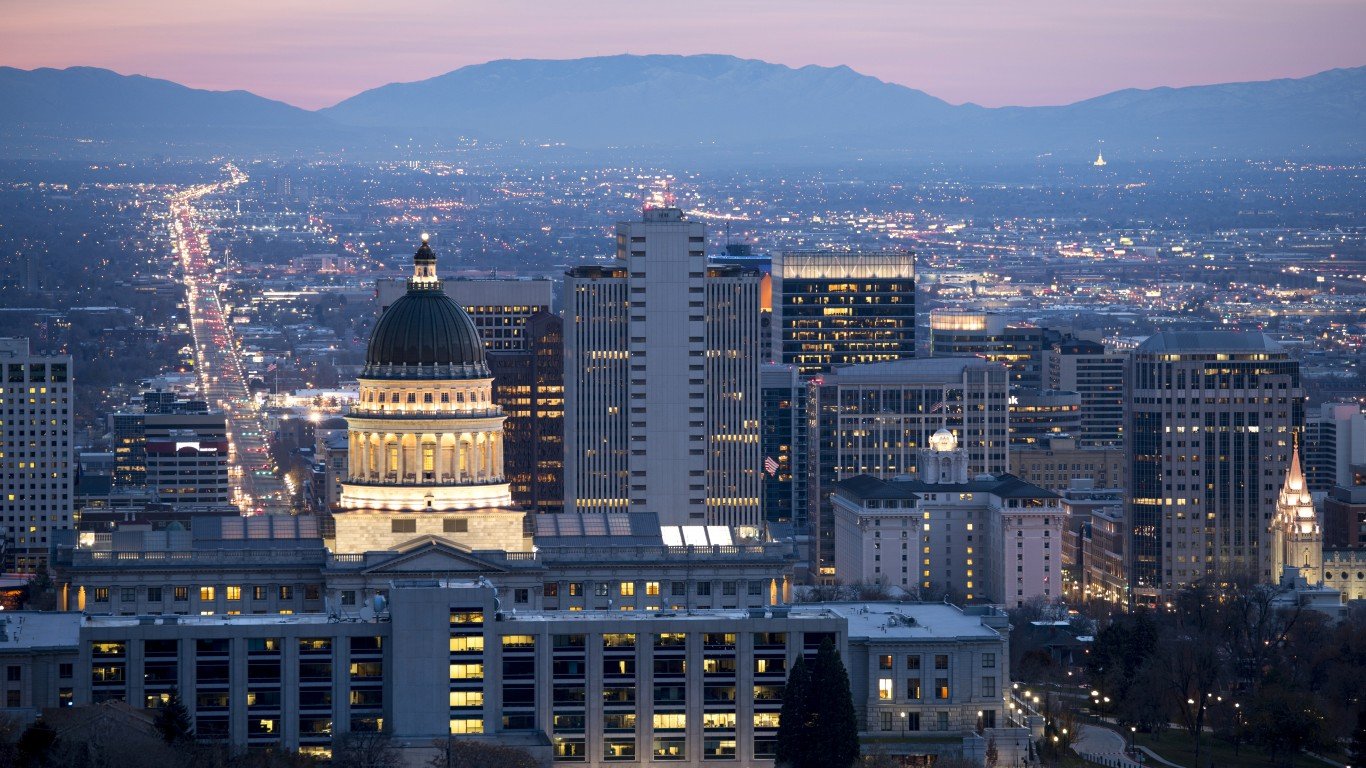
18. Salt Lake City, Utah
> 2001-2020 sightings per 100K: 151.20
> Total sightings: 299
> Population 2019: 197,756
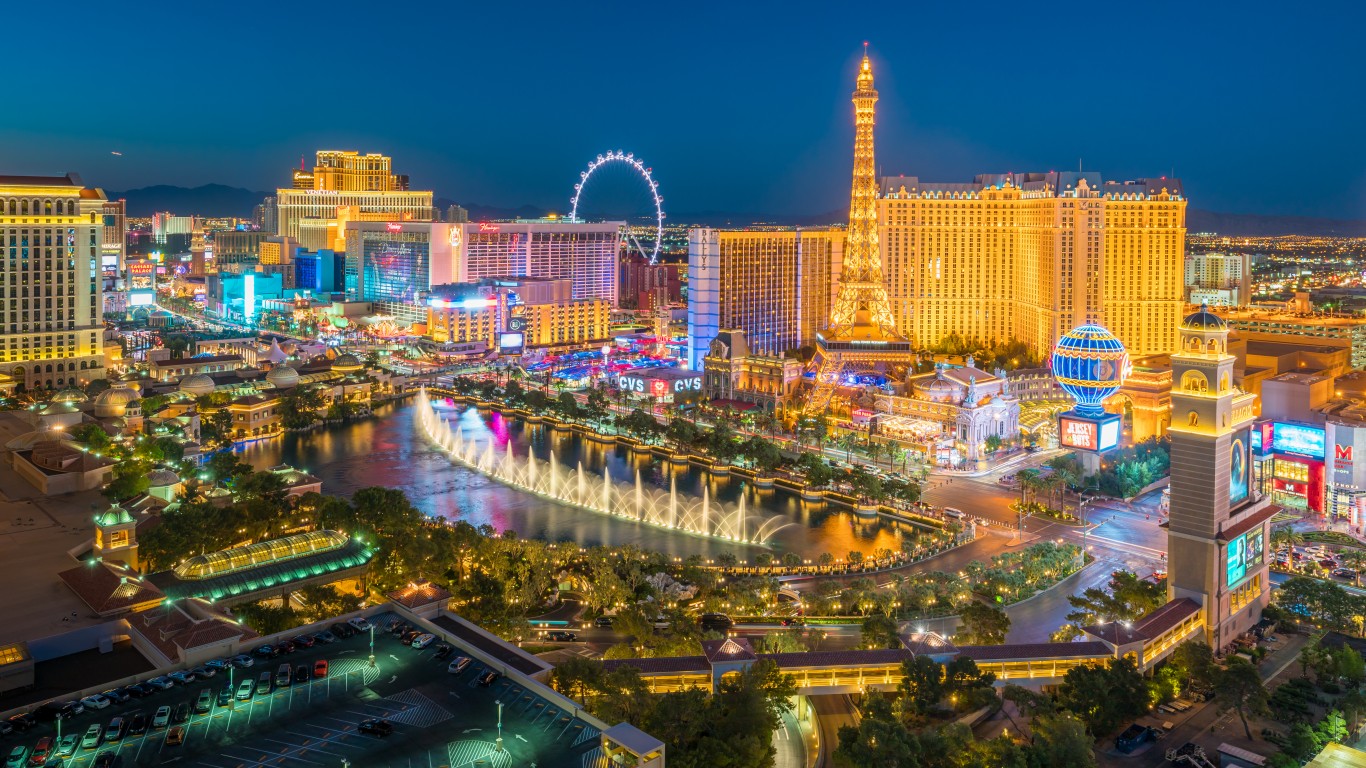
17. Las Vegas, Nevada
> 2001-2020 sightings per 100K: 152.81
> Total sightings: 970
> Population 2019: 634,773
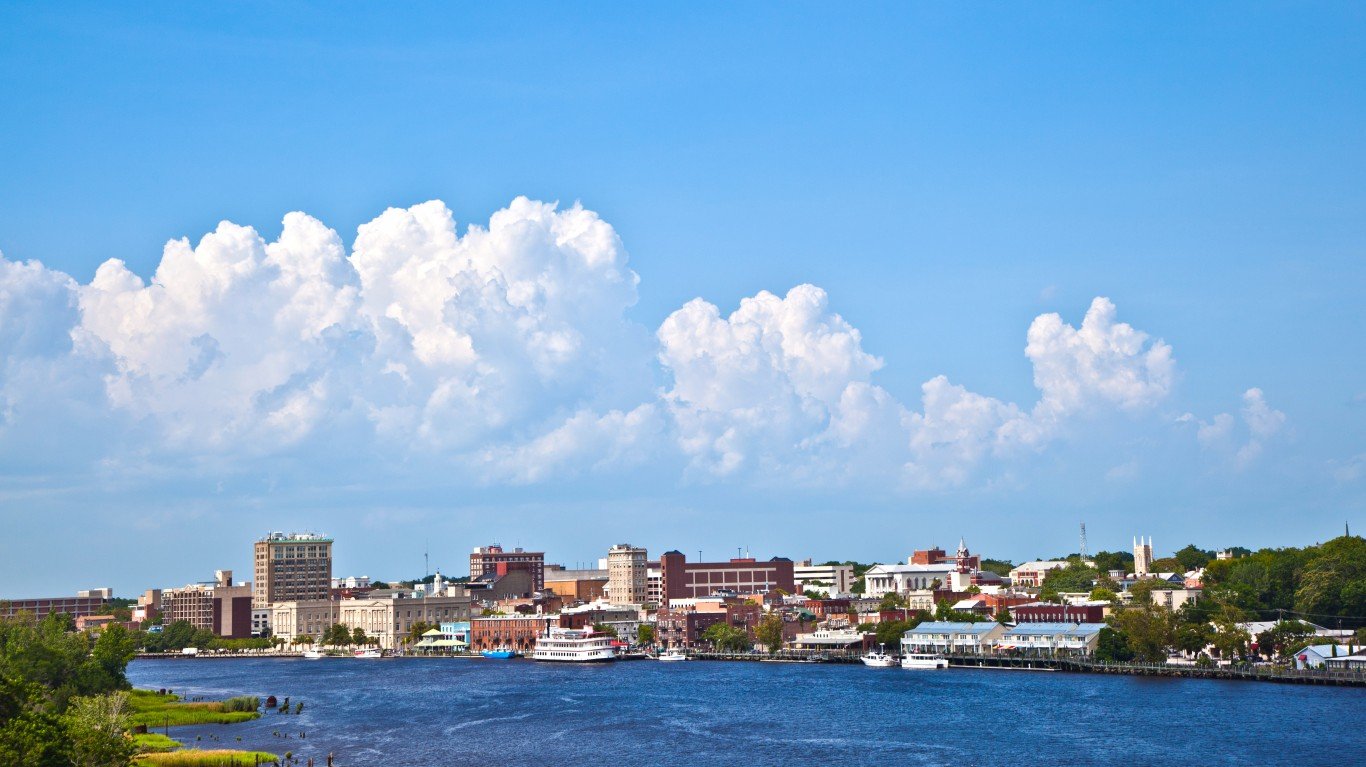
16. Wilmington, North Carolina
> 2001-2020 sightings per 100K: 163.90
> Total sightings: 197
> Population 2019: 120,194
15. Vancouver, Washington
> 2001-2020 sightings per 100K: 166.71
> Total sightings: 301
> Population 2019: 180,556
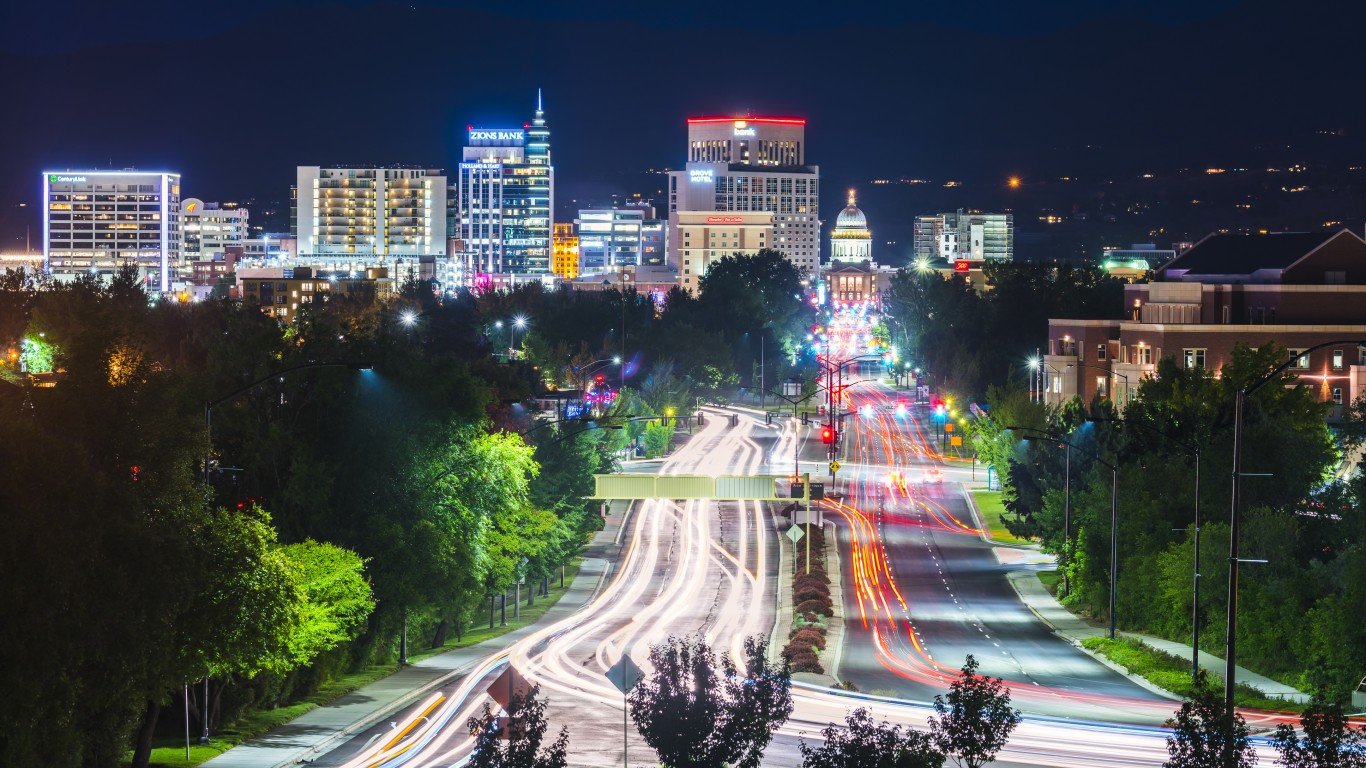
14. Boise city, Idaho
> 2001-2020 sightings per 100K: 173.81
> Total sightings: 393
> Population 2019: 226,115
13. Everett, Washington
> 2001-2020 sightings per 100K: 174.01
> Total sightings: 191
> Population 2019: 109,766
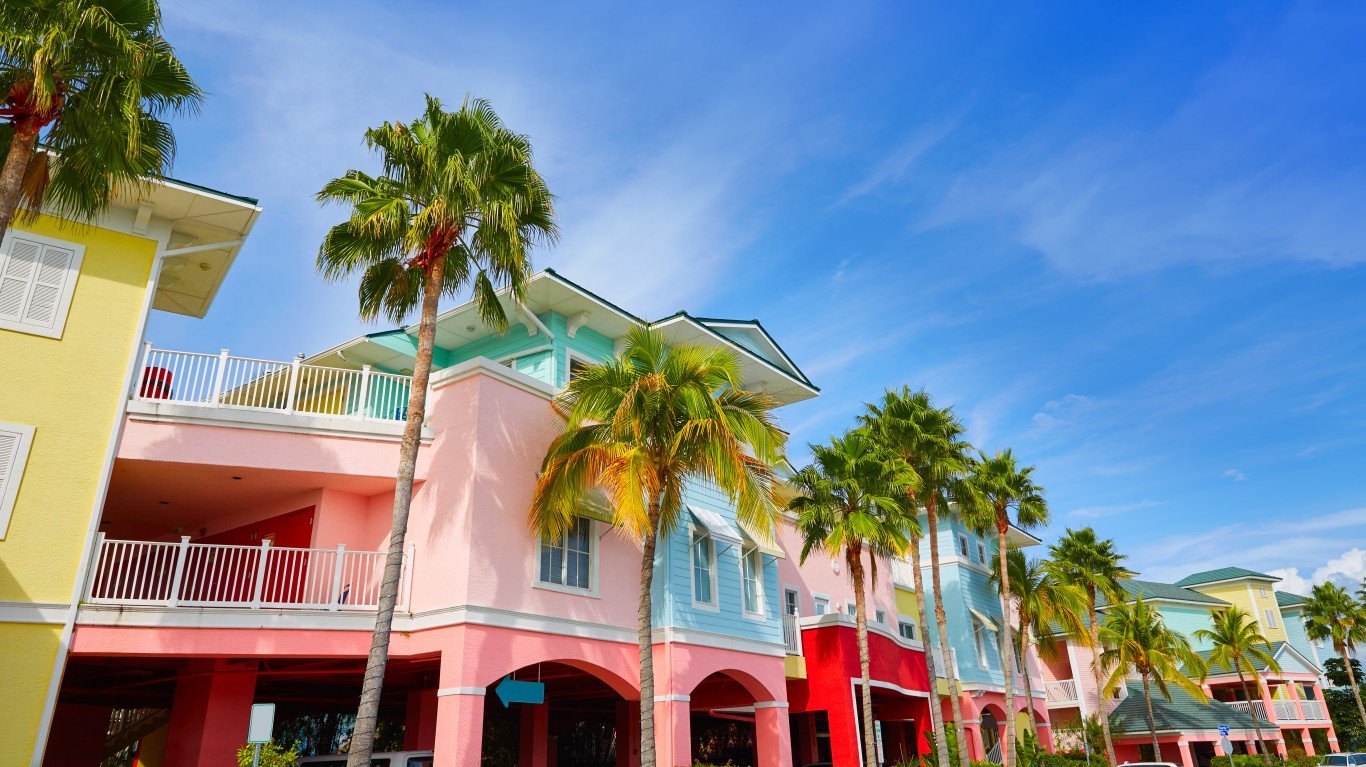
12. Fort Myers, Florida
> 2001-2020 sightings per 100K: 187.67
> Total sightings: 150
> Population 2019: 79,927
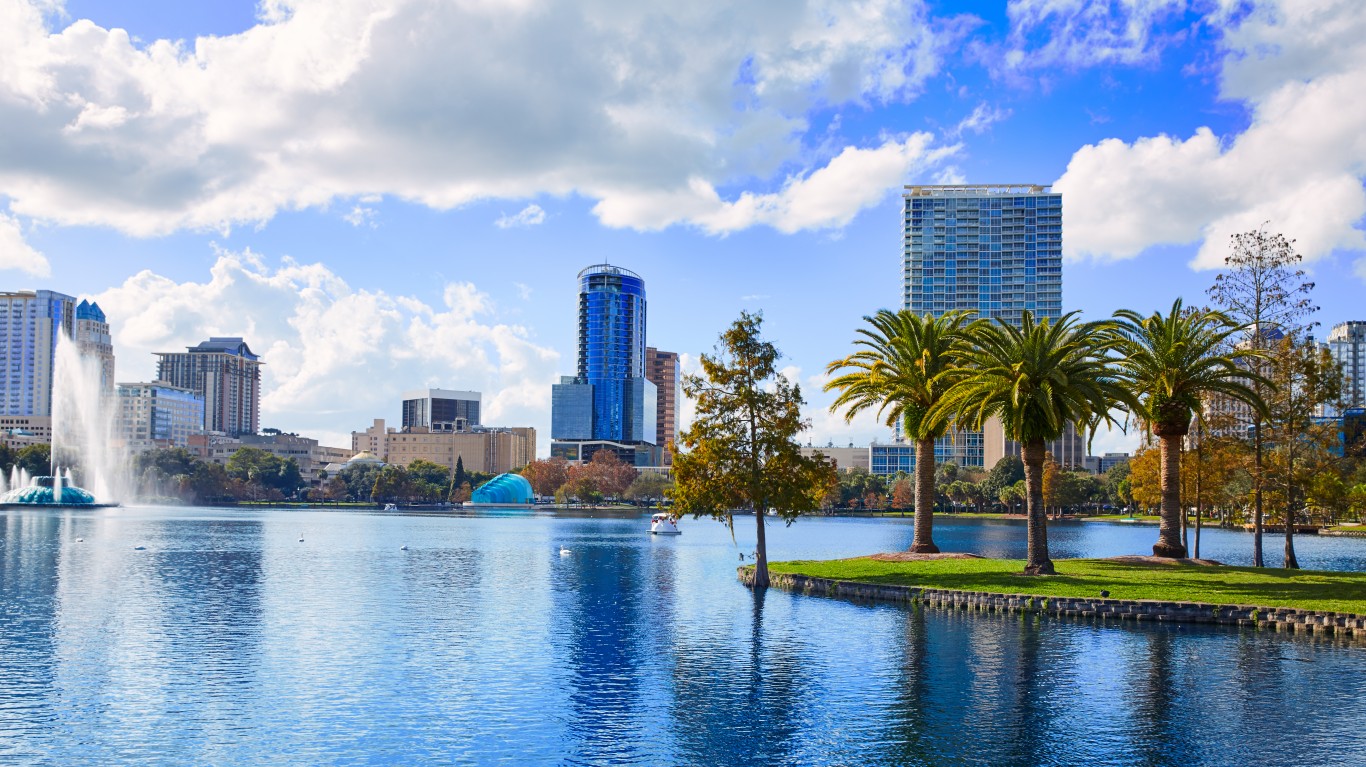
11. Orlando, Florida
> 2001-2020 sightings per 100K: 191.93
> Total sightings: 539
> Population 2019: 280,832
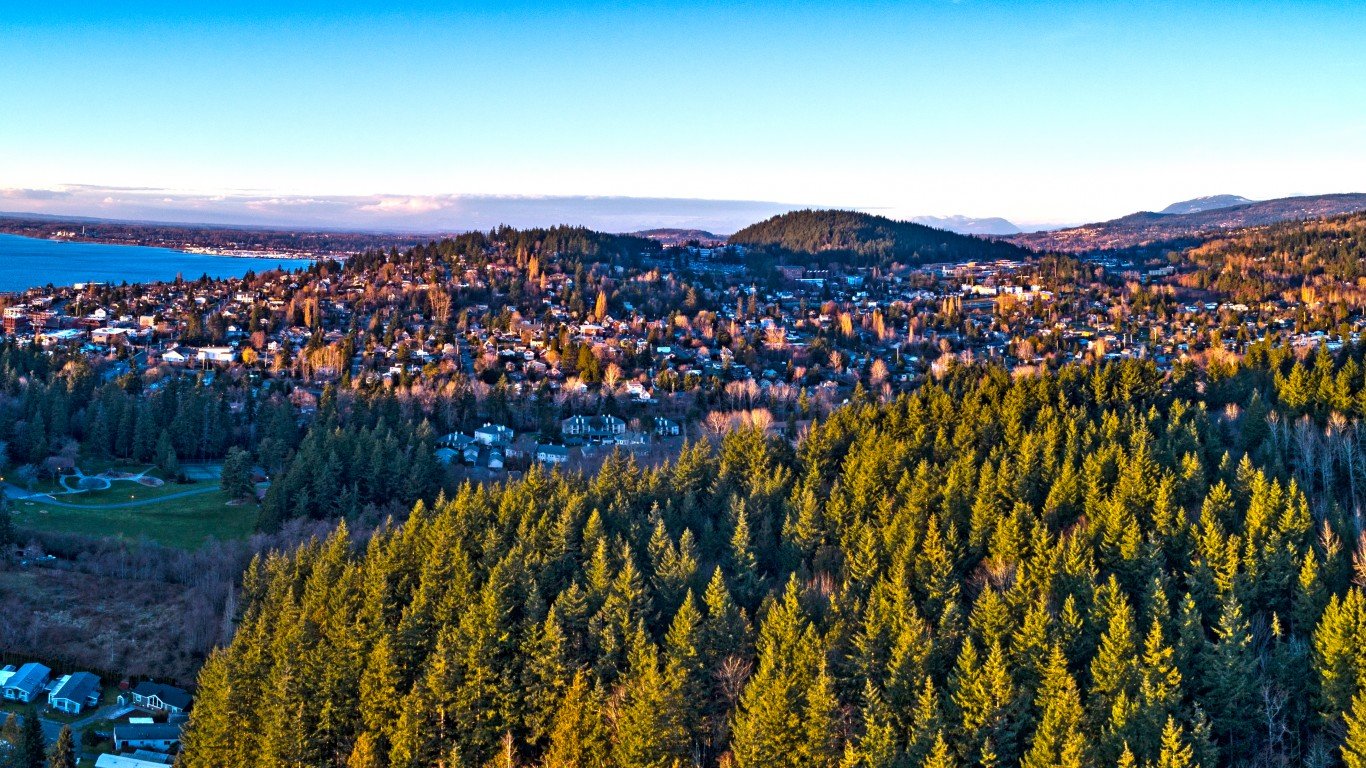
10. Bellingham, Washington
> 2001-2020 sightings per 100K: 205.04
> Total sightings: 182
> Population 2019: 88,764
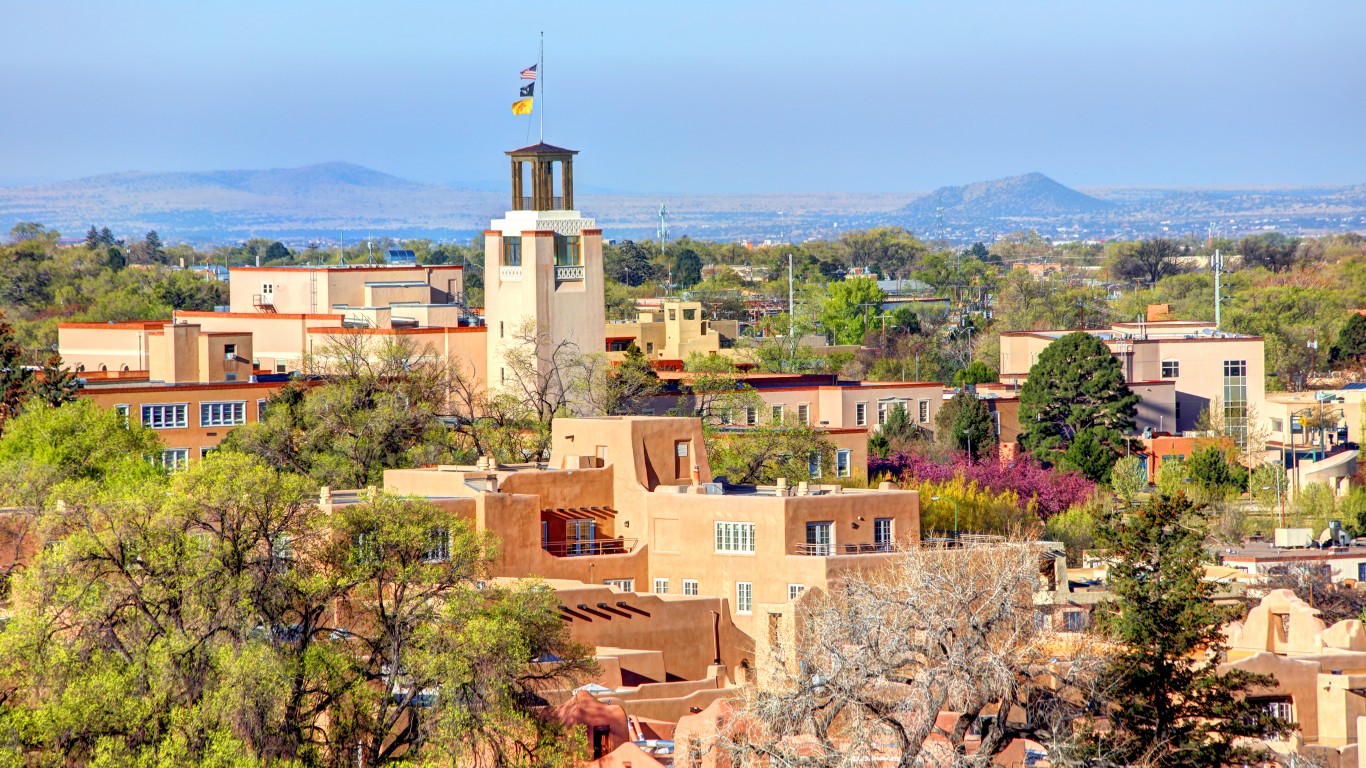
9. Santa Fe, New Mexico
> 2001-2020 sightings per 100K: 216.87
> Total sightings: 182
> Population 2019: 83,922
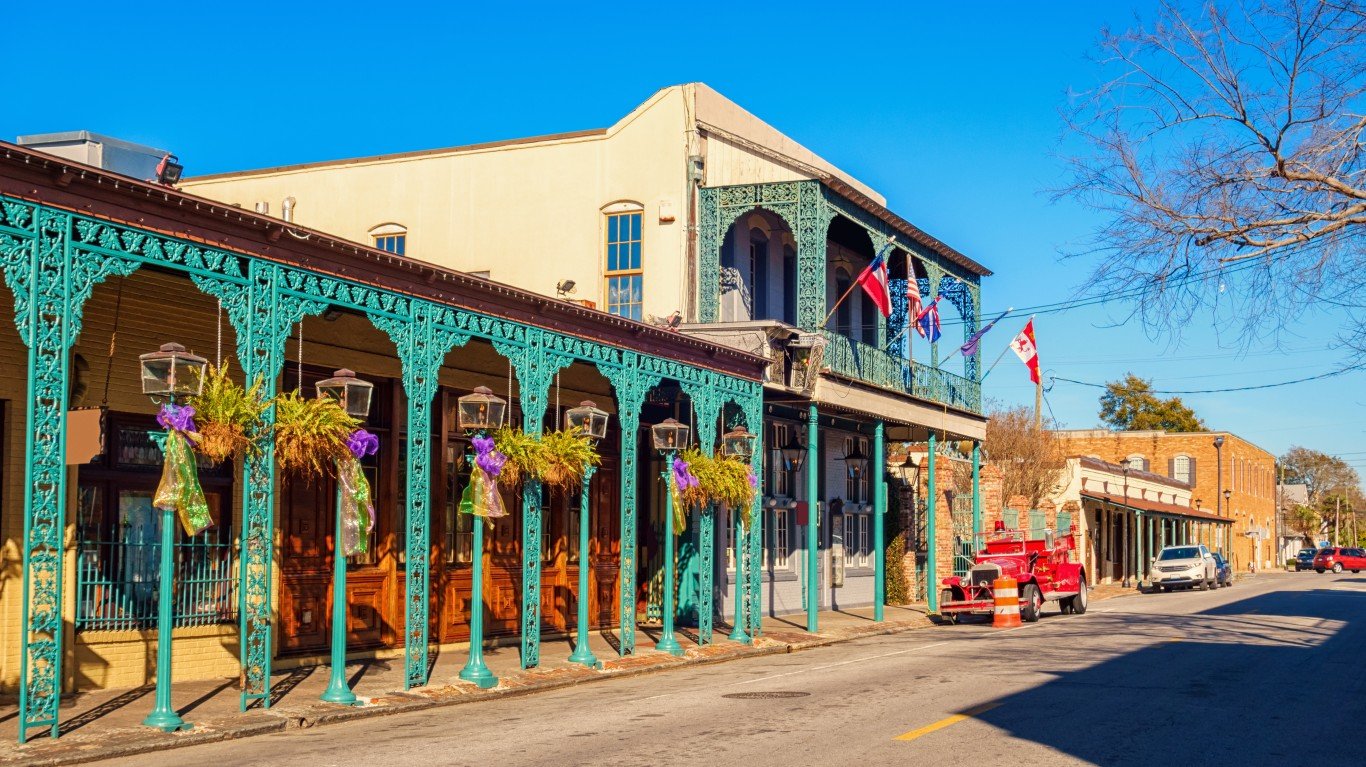
8. Pensacola, Florida
> 2001-2020 sightings per 100K: 305.84
> Total sightings: 161
> Population 2019: 52,642
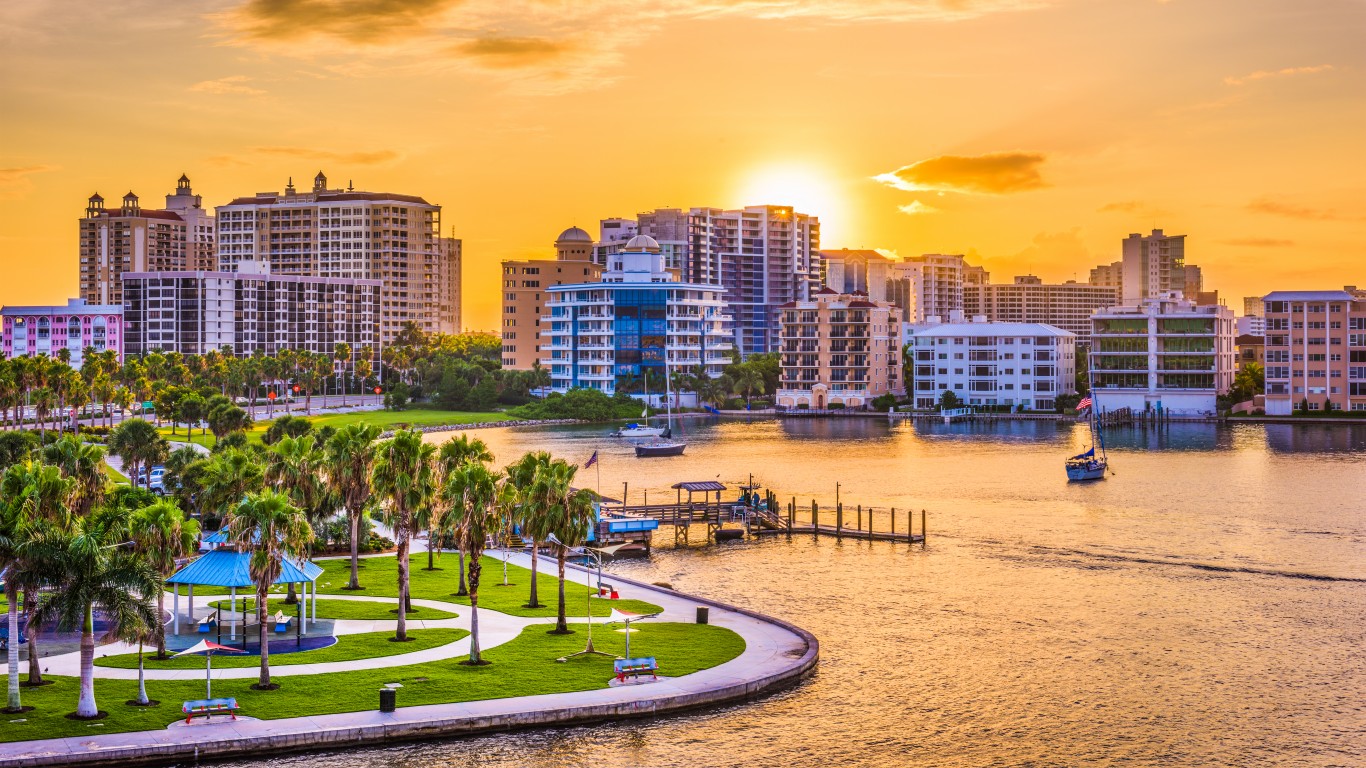
7. Sarasota, Florida
> 2001-2020 sightings per 100K: 307.45
> Total sightings: 175
> Population 2019: 56,919
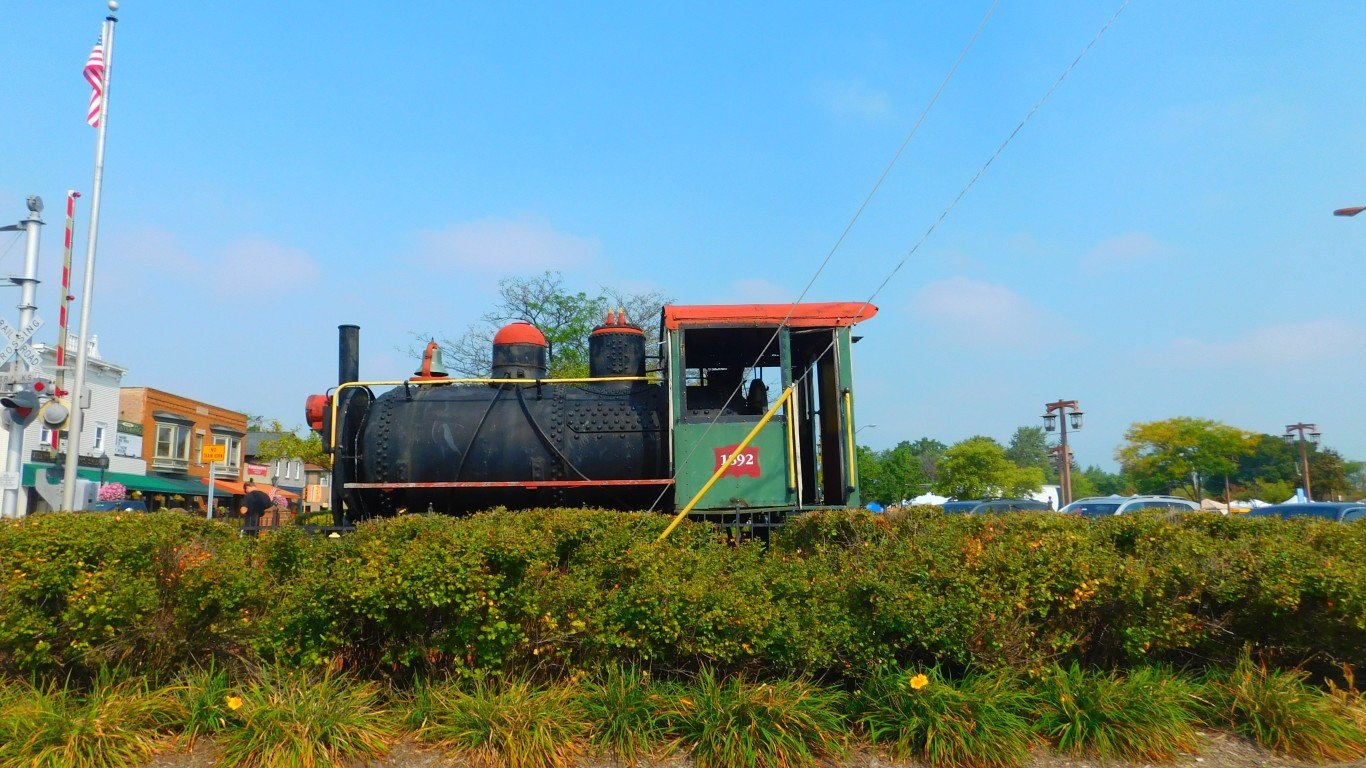
6. Tinley Park, Illinois
> 2001-2020 sightings per 100K: 316.79
> Total sightings: 179
> Population 2019: 56,505
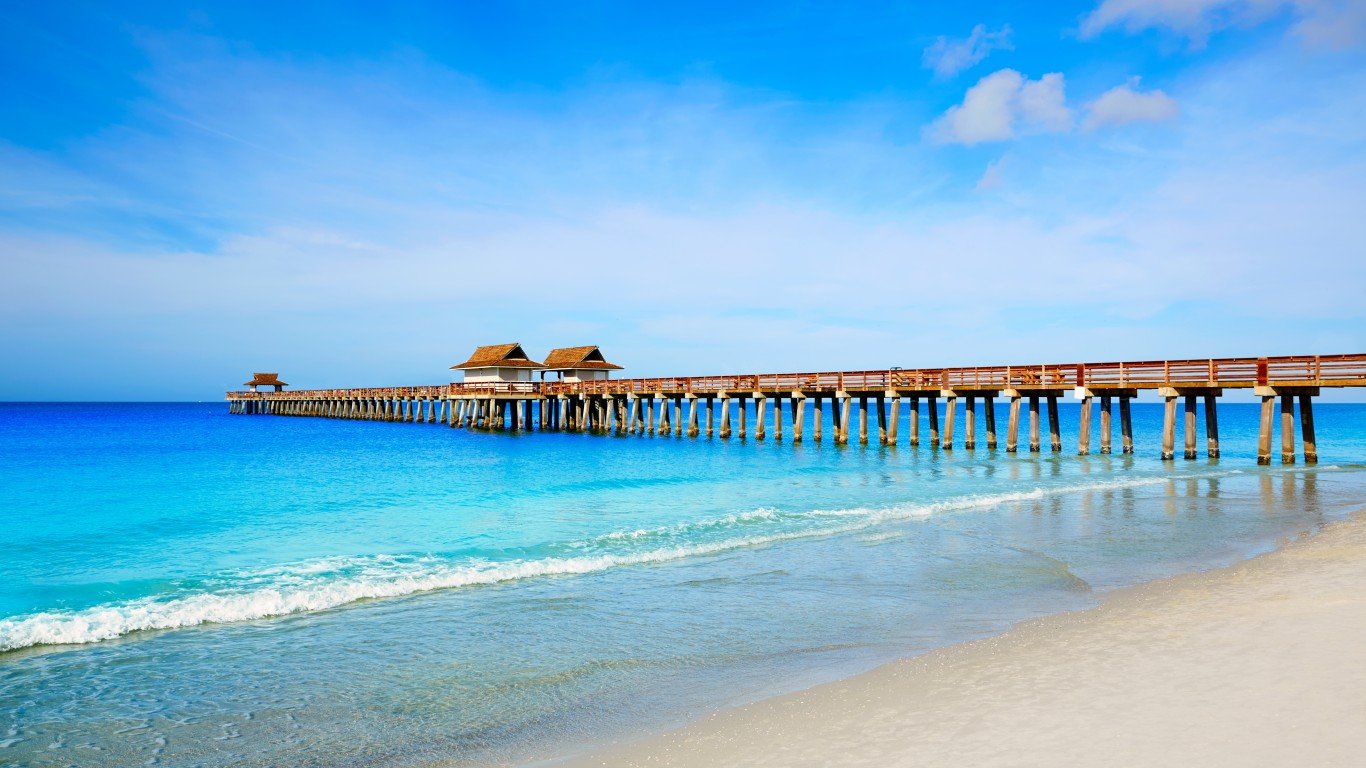
5. Naples, Florida
> 2001-2020 sightings per 100K: 779.39
> Total sightings: 170
> Population 2019: 21,812
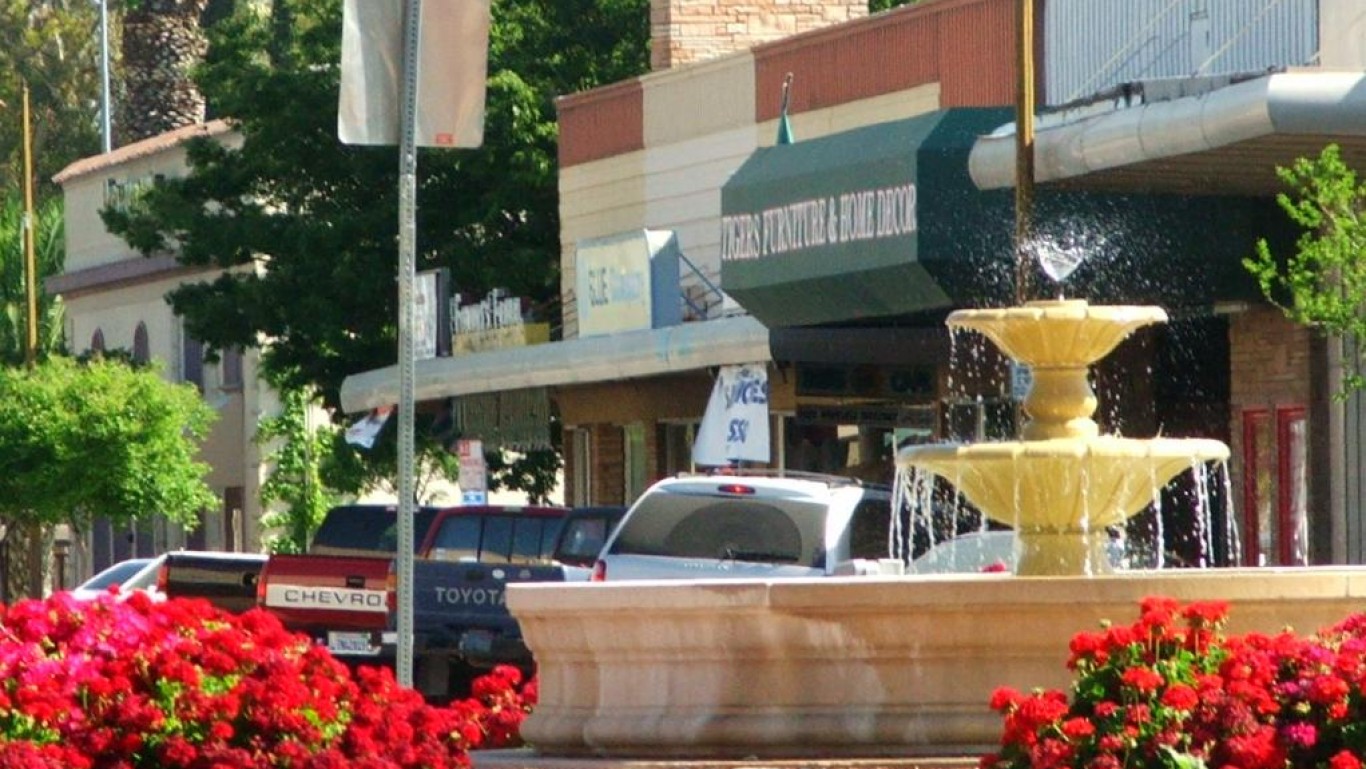
4. Patterson, California
> 2001-2020 sightings per 100K: 861.05
> Total sightings: 190
> Population 2019: 22,066
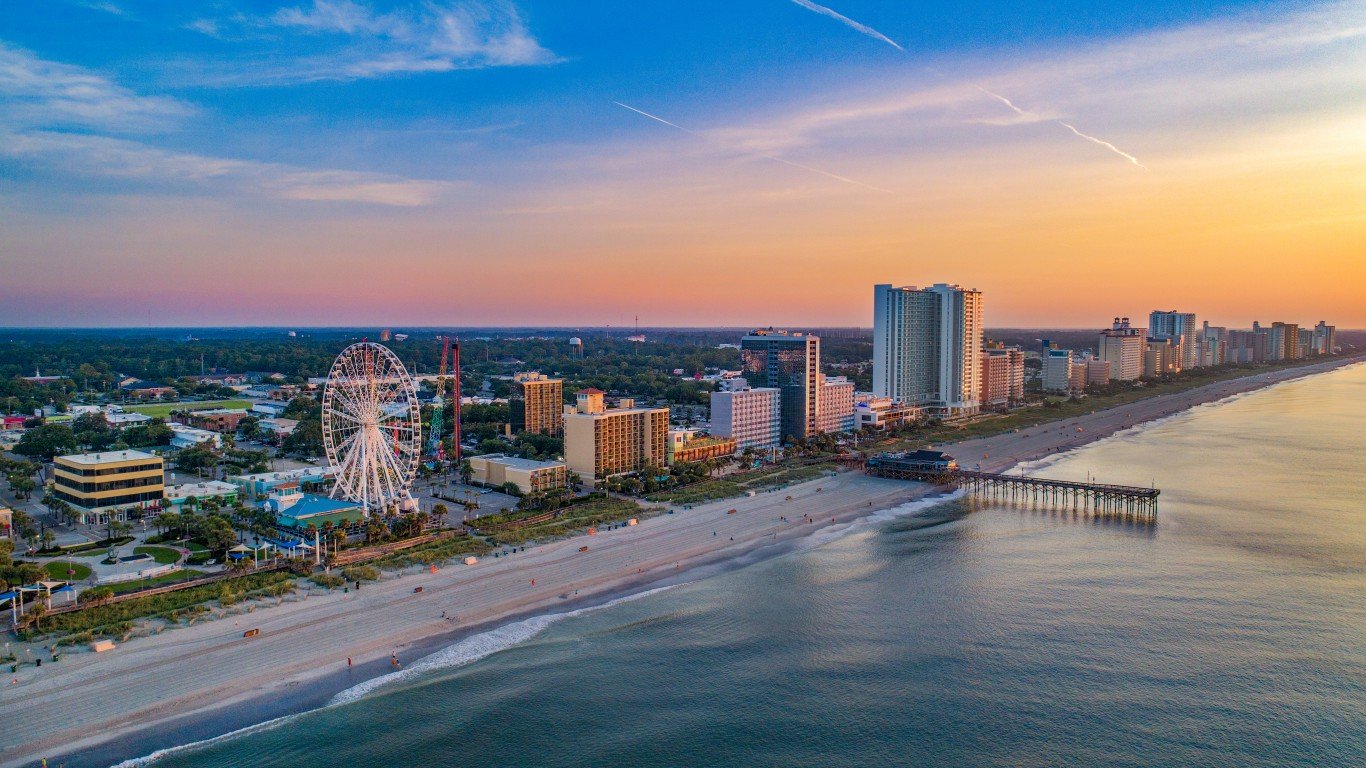
3. North Myrtle Beach, South Carolina
> 2001-2020 sightings per 100K: 1,111.11
> Total sightings: 180
> Population 2019: 16,200
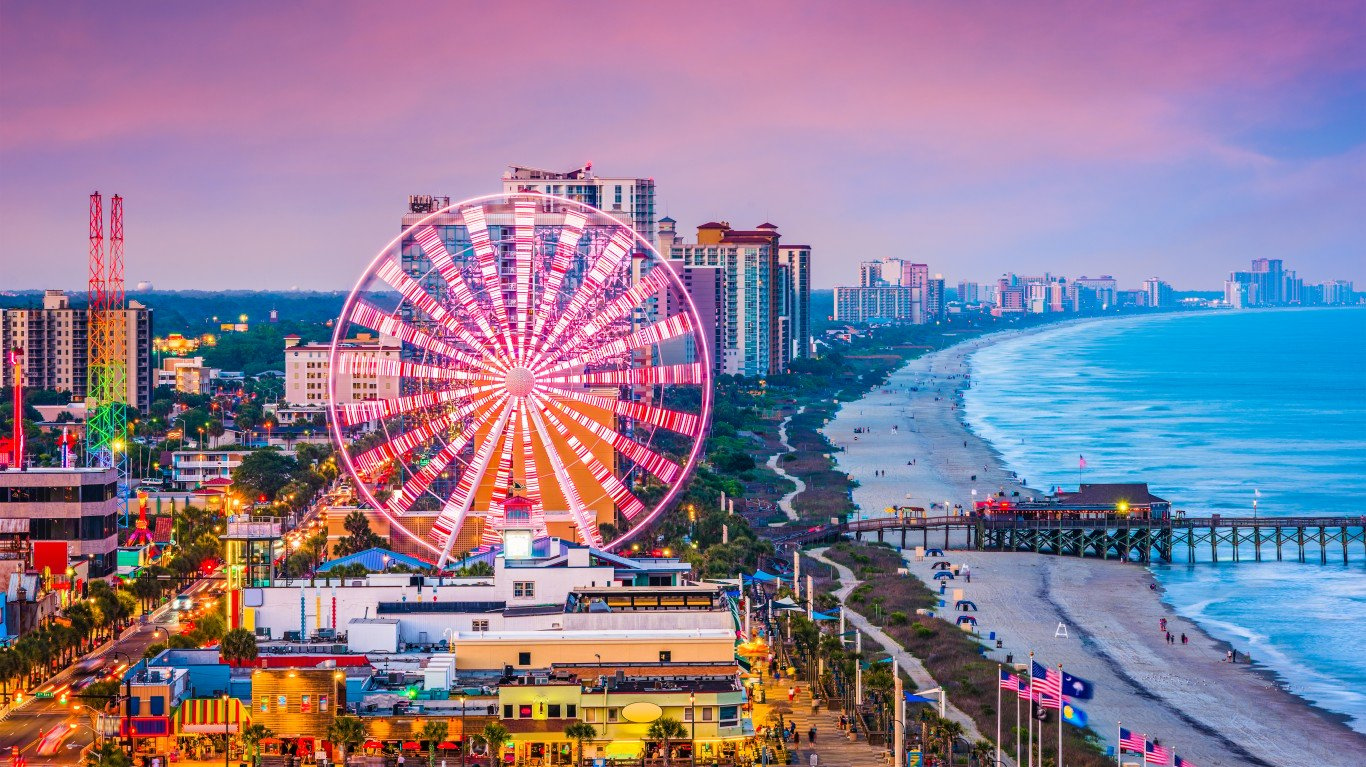
2. Myrtle Beach, South Carolina
> 2001-2020 sightings per 100K: 1,223.24
> Total sightings: 400
> Population 2019: 32,700
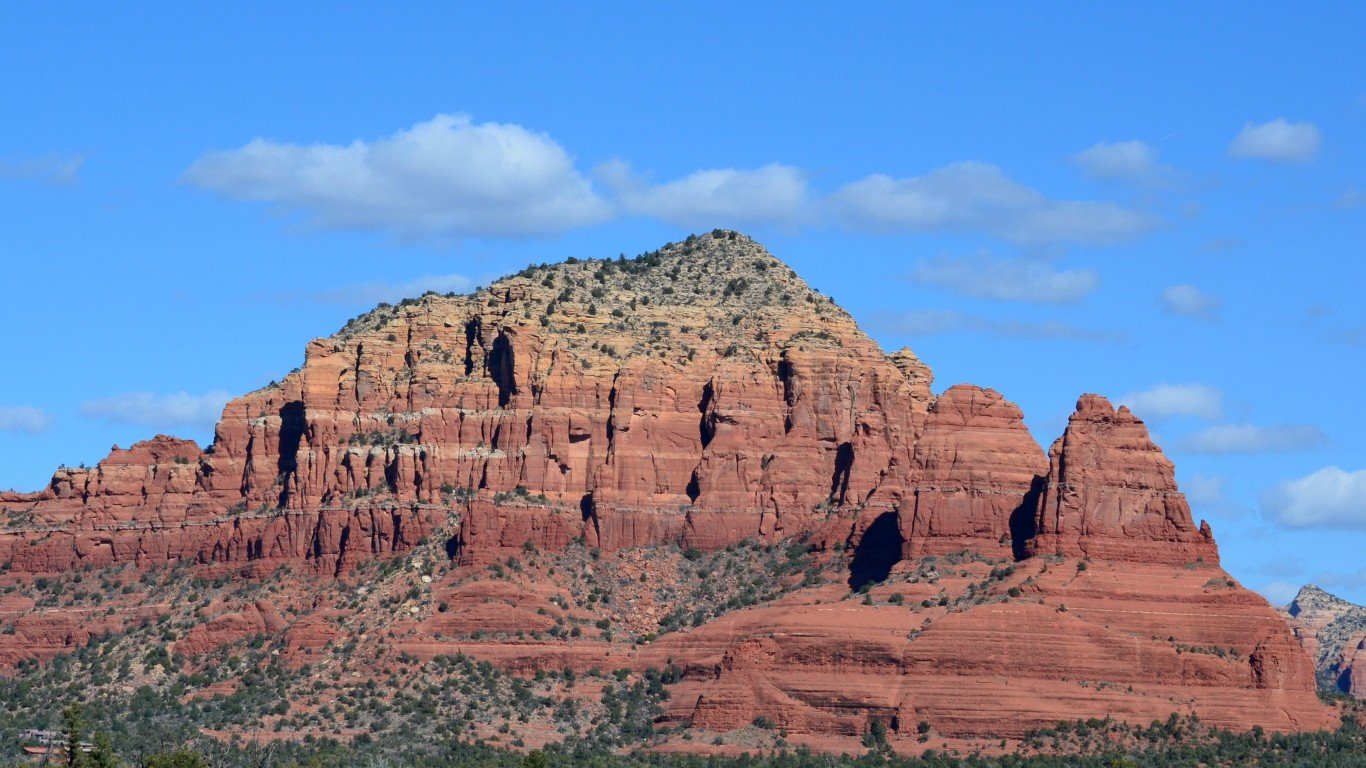
1. Sedona, Arizona
> 2001-2020 sightings per 100K: 1,608.22
> Total sightings: 166
> Population 2019: 10,322
Contact [email protected] for any questions or corrections.
Sarah Burns is an editor and writer at 24/7 Wall St. She previously worked at AOL and MSN. She began her career in book publishing at Viking Press/Penguin Books and has been writing and editing general and financial news stories for the last 15 years.
In addition to 24/7 Wall St. and 24/7 Tempo, her stories have appeared in USA Today, MSN, MarketWatch, Business Insider, and Yahoo Finance.
Sarah has edited numerous travel and garden books. She teaches urban farming in New York City public schools and is an instructor at the New York Botanical Garden. She graduated from Bowdoin College in Maine with a bachelor’s degree in English. She is based in New York City.