Burger King is one of the best-known fast food chains in the country. Although it is smaller than McDonald’s, a higher percentage of its restaurants are in the United States and the “Home of the Whopper” has proved to be a serious rival in the Burger Wars. (See where it ranks among the best burgers you can get at a fast food restaurant.)
Which states have the most Burger Kings, both total and per capita? To answer that question, 24/7 Tempo reviewed data collected by NiceRx, a patient assistance program and medication access company, using numbers for total fast-food restaurants taken from the U.S. Census Bureau and tracking the nation’s ten most popular chains as determined by ScrapeHero.com. (Population figures are five-year estimates from the U.S. Census Bureau’s 2019 American Community Survey.) We then ranked the states by their per capita Burger King population per 100,000 residents, lowest to highest. Ties were broken using the total number of Burger King restaurants in the state.
Click here to see the Burger King capitals of America
Alabama and West Virginia tied for the No. 1 spot, each with 3.5 Burger Kings per 100,000 people. They’re followed by Louisiana, with 3.4. As with McDonald’s, Burger Kings are more heavily concentrated in poorer and more rural states. Although it’s not surprising that the company has such a heavy footprint in Southern states, as it’s headquartered in Florida, it also has a strong presence in North and South Dakota (unlike McDonald’s, for some reason).
The states with the fewest Burger Kings are Alaska and Vermont, each with 1.1 per 100,000 people, followed by California with 1.4. There’s no geographic trend evident, as these states are about as far apart from each other geographically as it’s possible to get. It’s an often-quoted fact that Vermont is the only state whose capital doesn’t have a McDonald’s, but it doesn’t have a Burger King either. Montpelier favors small businesses over big corporations, although chains have a presence nearby. (These are the most successful restaurant chains in America.)

50. Vermont
> All Burger King restaurants per 100K people: 1.1
> Total Burger King restaurants: 7 — the lowest
> Total population in 2019: 623,989 — 2nd lowest
[in-text-ad]

49. Alaska
> All Burger King restaurants per 100K people: 1.1
> Total Burger King restaurants: 8 — 2nd lowest
> Total population in 2019: 731,545 — 3rd lowest
[recirclink id=950584]

48. California
> All Burger King restaurants per 100K people: 1.4
> Total Burger King restaurants: 553 — 3rd highest
> Total population in 2019: 39,512,223 — the highest

47. Oklahoma
> All Burger King restaurants per 100K people: 1.6
> Total Burger King restaurants: 63 — 15th lowest
> Total population in 2019: 3,956,971 — 23rd lowest
[in-text-ad-2]

46. Washington
> All Burger King restaurants per 100K people: 1.6
> Total Burger King restaurants: 122 — 21st highest
> Total population in 2019: 7,614,893 — 13th highest

45. Massachusetts
> All Burger King restaurants per 100K people: 1.7
> Total Burger King restaurants: 117 — 24th highest
> Total population in 2019: 6,892,503 — 15th highest
[in-text-ad]

44. Connecticut
> All Burger King restaurants per 100K people: 1.8
> Total Burger King restaurants: 64 — 16th lowest
> Total population in 2019: 3,565,287 — 22nd lowest
[recirclink id=971281]

43. New York
> All Burger King restaurants per 100K people: 1.8
> Total Burger King restaurants: 350 — 4th highest
> Total population in 2019: 19,453,561 — 4th highest

42. Hawaii
> All Burger King restaurants per 100K people: 2.0
> Total Burger King restaurants: 28 — 9th lowest
> Total population in 2019: 1,415,872 — 11th lowest
[in-text-ad-2]

41. Idaho
> All Burger King restaurants per 100K people: 2.0
> Total Burger King restaurants: 36 — 12th lowest
> Total population in 2019: 1,787,065 — 12th lowest

40. Oregon
> All Burger King restaurants per 100K people: 2.0
> Total Burger King restaurants: 84 — 23rd lowest
> Total population in 2019: 4,217,737 — 24th lowest
[in-text-ad]

39. Colorado
> All Burger King restaurants per 100K people: 2.0
> Total Burger King restaurants: 115 — 25th highest
> Total population in 2019: 5,758,736 — 21st highest
[recirclink id=877266]

38. Maryland
> All Burger King restaurants per 100K people: 2.0
> Total Burger King restaurants: 121 — 22nd highest
> Total population in 2019: 6,045,680 — 19th highest

37. Texas
> All Burger King restaurants per 100K people: 2.0
> Total Burger King restaurants: 580 — the highest
> Total population in 2019: 28,995,881 — 2nd highest
[in-text-ad-2]

36. Delaware
> All Burger King restaurants per 100K people: 2.1
> Total Burger King restaurants: 20 — 4th lowest
> Total population in 2019: 973,764 — 6th lowest

35. Nevada
> All Burger King restaurants per 100K people: 2.1
> Total Burger King restaurants: 65 — 17th lowest
> Total population in 2019: 3,080,156 — 19th lowest
[in-text-ad]

34. Minnesota
> All Burger King restaurants per 100K people: 2.1
> Total Burger King restaurants: 118 — 23rd highest
> Total population in 2019: 5,639,632 — 22nd highest
[recirclink id=877802]

33. Wisconsin
> All Burger King restaurants per 100K people: 2.1
> Total Burger King restaurants: 122 — 20th highest
> Total population in 2019: 5,822,434 — 20th highest

32. Missouri
> All Burger King restaurants per 100K people: 2.1
> Total Burger King restaurants: 129 — 19th highest
> Total population in 2019: 6,137,428 — 18th highest
[in-text-ad-2]

31. New Jersey
> All Burger King restaurants per 100K people: 2.1
> Total Burger King restaurants: 187 — 13th highest
> Total population in 2019: 8,882,190 — 11th highest

30. Pennsylvania
> All Burger King restaurants per 100K people: 2.1
> Total Burger King restaurants: 269 — 9th highest
> Total population in 2019: 12,801,989 — 5th highest
[in-text-ad]

29. Montana
> All Burger King restaurants per 100K people: 2.2
> Total Burger King restaurants: 24 — 6th lowest
> Total population in 2019: 1,068,778 — 8th lowest
[recirclink id=857205]

28. Utah
> All Burger King restaurants per 100K people: 2.2
> Total Burger King restaurants: 71 — 20th lowest
> Total population in 2019: 3,205,958 — 21st lowest

27. Rhode Island
> All Burger King restaurants per 100K people: 2.3
> Total Burger King restaurants: 24 — 7th lowest
> Total population in 2019: 1,059,361 — 7th lowest
[in-text-ad-2]

26. New Hampshire
> All Burger King restaurants per 100K people: 2.3
> Total Burger King restaurants: 31 — 10th lowest
> Total population in 2019: 1,359,711 — 10th lowest

25. Kansas
> All Burger King restaurants per 100K people: 2.3
> Total Burger King restaurants: 67 — 19th lowest
> Total population in 2019: 2,913,314 — 16th lowest
[in-text-ad]

24. Kentucky
> All Burger King restaurants per 100K people: 2.3
> Total Burger King restaurants: 103 — 25th lowest
> Total population in 2019: 4,467,673 — 25th lowest
[recirclink id=950584]

23. Virginia
> All Burger King restaurants per 100K people: 2.3
> Total Burger King restaurants: 196 — 11th highest
> Total population in 2019: 8,535,519 — 12th highest

22. North Carolina
> All Burger King restaurants per 100K people: 2.3
> Total Burger King restaurants: 241 — 10th highest
> Total population in 2019: 10,488,084 — 9th highest
[in-text-ad-2]

21. Illinois
> All Burger King restaurants per 100K people: 2.4
> Total Burger King restaurants: 304 — 6th highest
> Total population in 2019: 12,671,821 — 6th highest

20. Maine
> All Burger King restaurants per 100K people: 2.5
> Total Burger King restaurants: 34 — 11th lowest
> Total population in 2019: 1,344,212 — 9th lowest
[in-text-ad]

19. Arizona
> All Burger King restaurants per 100K people: 2.5
> Total Burger King restaurants: 182 — 15th highest
> Total population in 2019: 7,278,717 — 14th highest
[recirclink id=971281]

18. New Mexico
> All Burger King restaurants per 100K people: 2.6
> Total Burger King restaurants: 55 — 13th lowest
> Total population in 2019: 2,096,829 — 15th lowest

17. Iowa
> All Burger King restaurants per 100K people: 2.6
> Total Burger King restaurants: 82 — 22nd lowest
> Total population in 2019: 3,155,070 — 20th lowest
[in-text-ad-2]

16. Georgia
> All Burger King restaurants per 100K people: 2.6
> Total Burger King restaurants: 276 — 8th highest
> Total population in 2019: 10,617,423 — 8th highest

15. Arkansas
> All Burger King restaurants per 100K people: 2.7
> Total Burger King restaurants: 81 — 21st lowest
> Total population in 2019: 3,017,804 — 18th lowest
[in-text-ad]

14. Tennessee
> All Burger King restaurants per 100K people: 2.7
> Total Burger King restaurants: 184 — 14th highest
> Total population in 2019: 6,829,174 — 16th highest
[recirclink id=877266]
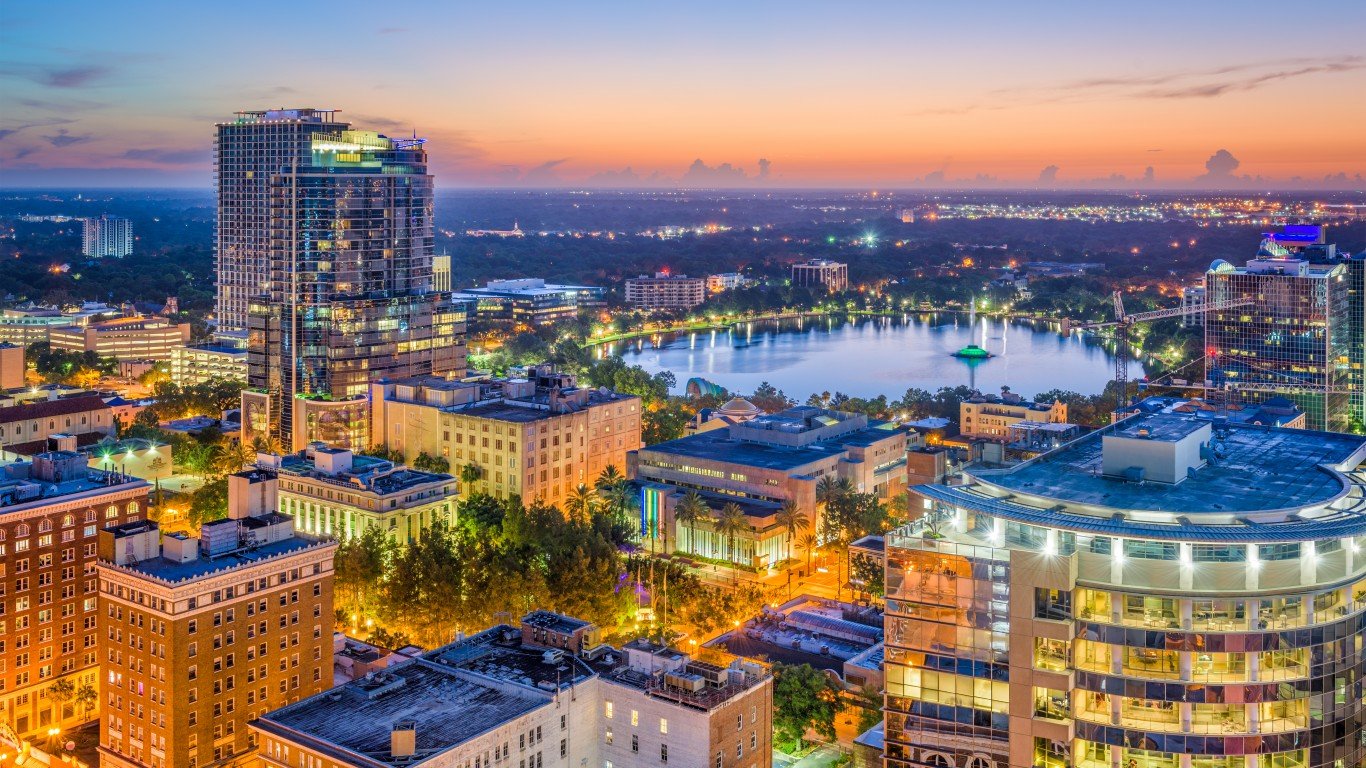
13. Florida
> All Burger King restaurants per 100K people: 2.7
> Total Burger King restaurants: 580 — 2nd highest
> Total population in 2019: 21,477,737 — 3rd highest
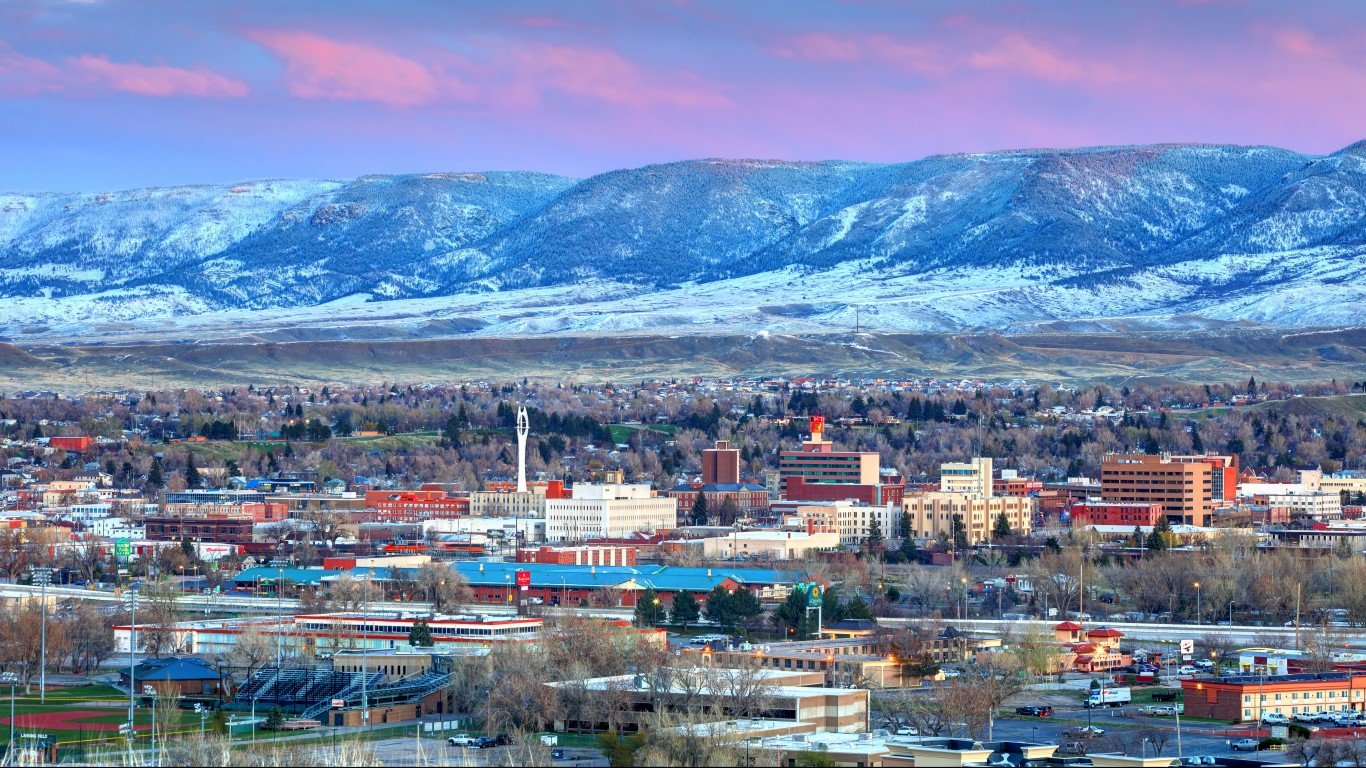
12. Wyoming
> All Burger King restaurants per 100K people: 2.8
> Total Burger King restaurants: 16 — 3rd lowest
> Total population in 2019: 578,759 — the lowest
[in-text-ad-2]

11. North Dakota
> All Burger King restaurants per 100K people: 2.8
> Total Burger King restaurants: 21 — 5th lowest
> Total population in 2019: 762,062 — 4th lowest
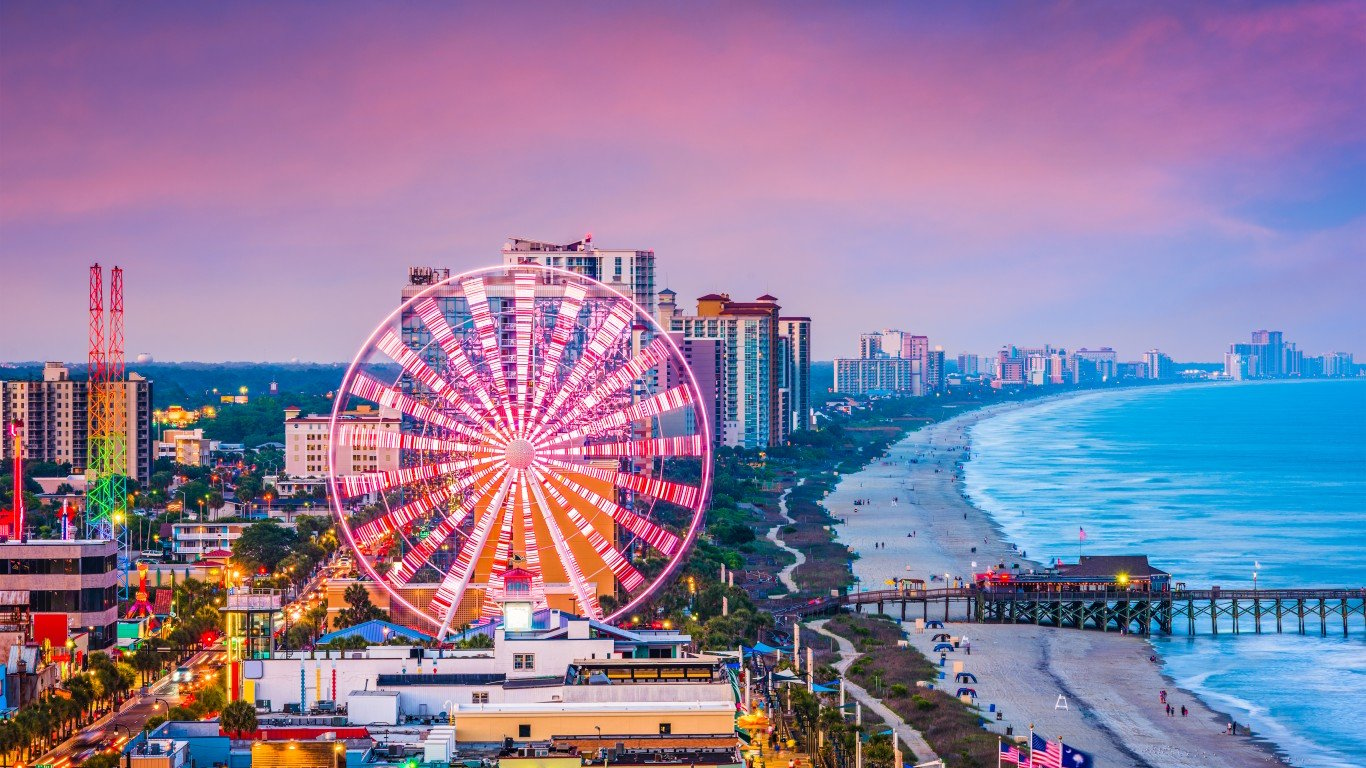
10. South Carolina
> All Burger King restaurants per 100K people: 2.9
> Total Burger King restaurants: 149 — 18th highest
> Total population in 2019: 5,148,714 — 23rd highest
[in-text-ad]

9. Indiana
> All Burger King restaurants per 100K people: 2.9
> Total Burger King restaurants: 195 — 12th highest
> Total population in 2019: 6,732,219 — 17th highest
[recirclink id=877802]

8. Michigan
> All Burger King restaurants per 100K people: 2.9
> Total Burger King restaurants: 290 — 7th highest
> Total population in 2019: 9,986,857 — 10th highest

7. Ohio
> All Burger King restaurants per 100K people: 2.9
> Total Burger King restaurants: 339 — 5th highest
> Total population in 2019: 11,689,100 — 7th highest
[in-text-ad-2]

6. Mississippi
> All Burger King restaurants per 100K people: 3.0
> Total Burger King restaurants: 89 — 24th lowest
> Total population in 2019: 2,976,149 — 17th lowest

5. South Dakota
> All Burger King restaurants per 100K people: 3.1
> Total Burger King restaurants: 27 — 8th lowest
> Total population in 2019: 884,659 — 5th lowest
[in-text-ad]

4. Nebraska
> All Burger King restaurants per 100K people: 3.4
> Total Burger King restaurants: 66 — 18th lowest
> Total population in 2019: 1,934,408 — 14th lowest
[recirclink id=857205]

3. Louisiana
> All Burger King restaurants per 100K people: 3.4
> Total Burger King restaurants: 158 — 17th highest
> Total population in 2019: 4,648,794 — 25th highest

2. West Virginia
> All Burger King restaurants per 100K people: 3.5
> Total Burger King restaurants: 63 — 14th lowest
> Total population in 2019: 1,792,147 — 13th lowest
[in-text-ad-2]
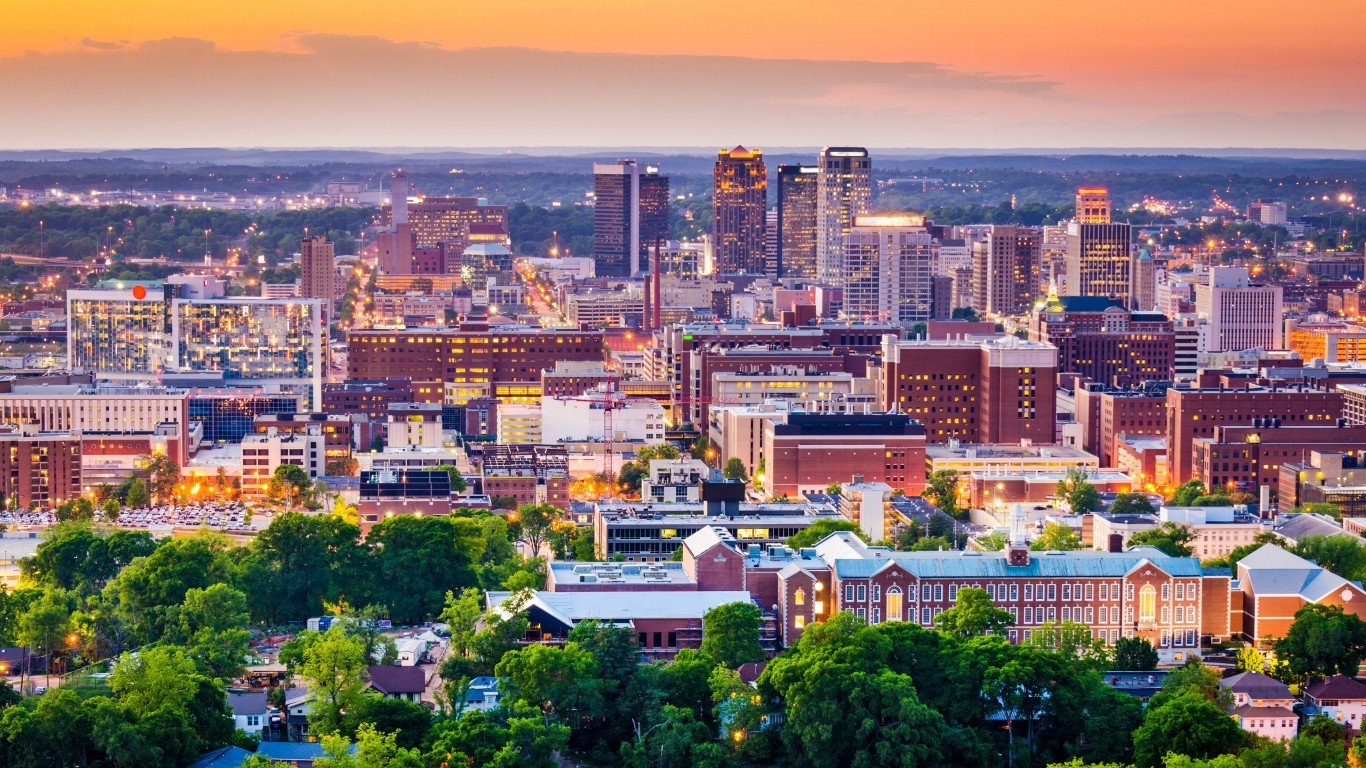
1. Alabama
> All Burger King restaurants per 100K people: 3.5
> Total Burger King restaurants: 172 — 16th highest
> Total population in 2019: 4,903,185 — 24th highest
Contact [email protected] for any questions or corrections.