Of all the most serious crimes tracked by the FBI — known as Part I offenses — larceny is by far the most common. There were 4.6 million cases of larceny-theft reported in the United States in 2020, accounting for nearly 60% of all Part I offenses, which also include murder, assault, robbery, rаpe, vehicle theft, and burglary.
Larceny is a classification of crime that includes all nonviolent theft, with the exception of motor-vehicle theft. Common examples of larceny include purse snatching, pick pocketing, shoplifting, and bicycle theft. According to the most recent available estimates from the FBI, larceny-thefts result in an estimated $5.9 billion in losses to victims annually.
Though larceny-theft is relatively widespread in the United States, in some parts of the country, Americans are at especially high risk of being the victim of theft.
Using data from the FBI’s 2020 Uniform Crime Report, 24/7 Wall St. identified the metro areas with the highest larceny-theft rates. Metropolitan areas are ranked by the number of larcenies reported for every 100,000 people.
In every metro area on this list, larceny theft rates are far higher than — and in some cases more than double — the national rate of 1,398 incidents per 100,000 people. The largest share of metro areas on this list are in the South, including six in Louisiana and another six in Texas.
Larceny is one of three criminal offenses that make up the property crime rate. Due in large part to higher than average larceny rates, in every metro area on this list, the overall property crime rate exceeds the national rate of 1,958 incidents per 100,000 people. Here is a look at the city with the most property crimes in every state.
Click here to see the metros with the most larceny – thefts
Click here to read our detailed methodology

50. Tulsa, OK
> 2020 larceny-thefts per 100K people: 1,908.0
> Total larceny-thefts: 19,185 — 36th most of 281 metros
> Property crimes per 100K people: 3,109.7 — 24th most of 276 metros
> Total property crimes: 31,267 — 31st most of 276 metros
> Population: 998,655
[in-text-ad]
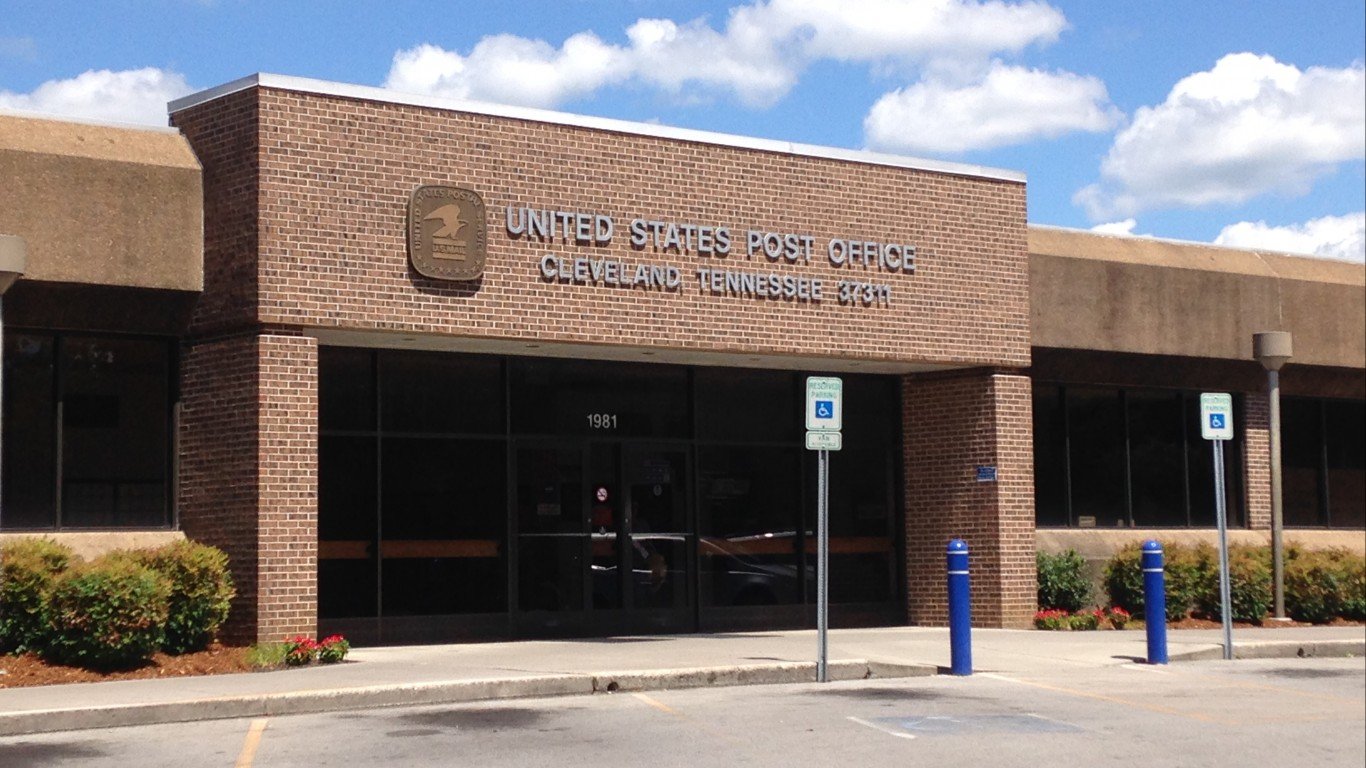
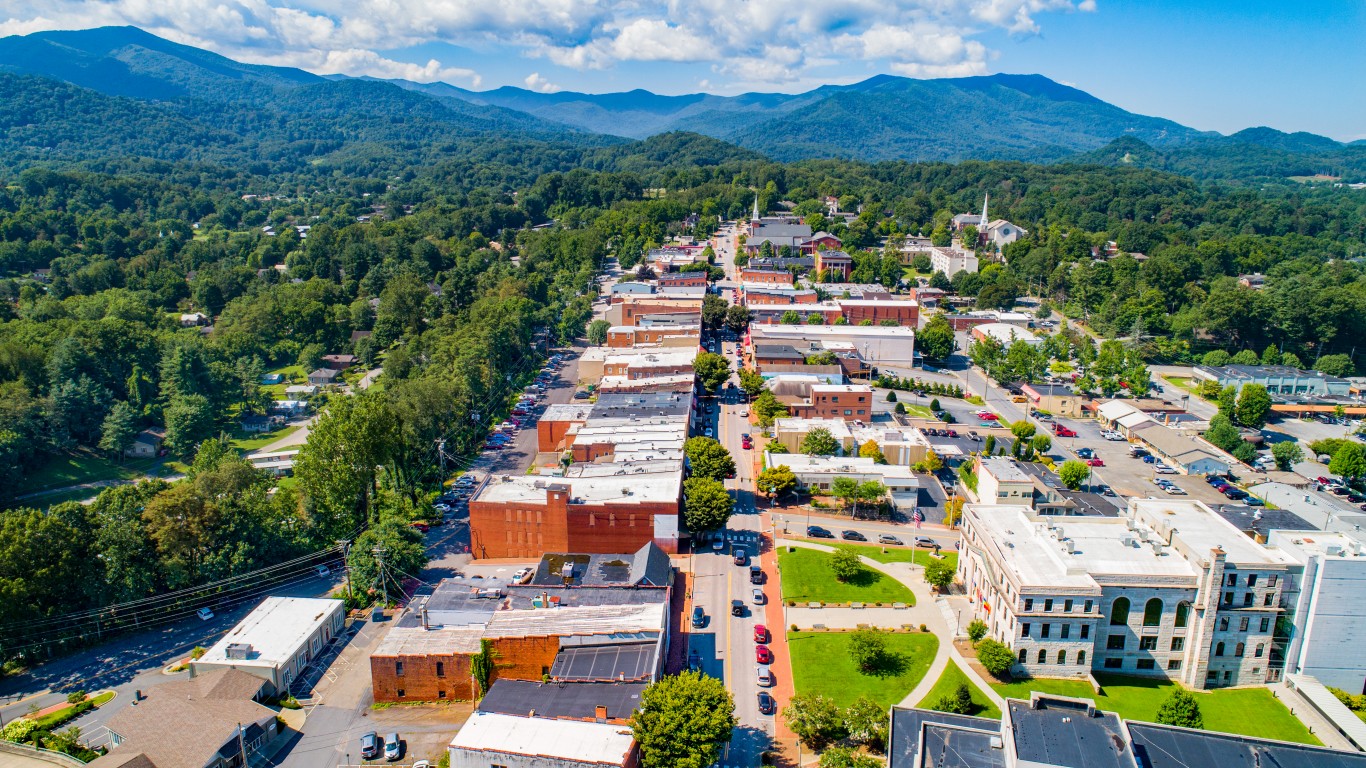
49. Cleveland, TN
> 2020 larceny-thefts per 100K people: 1,922.2
> Total larceny-thefts: 2,422 — 93rd fewest of 281 metros
> Property crimes per 100K people: 2,696.8 — 51st most of 276 metros
> Total property crimes: 3,398 — 95th fewest of 276 metros
> Population: 126,801
[recirclink id=966311]
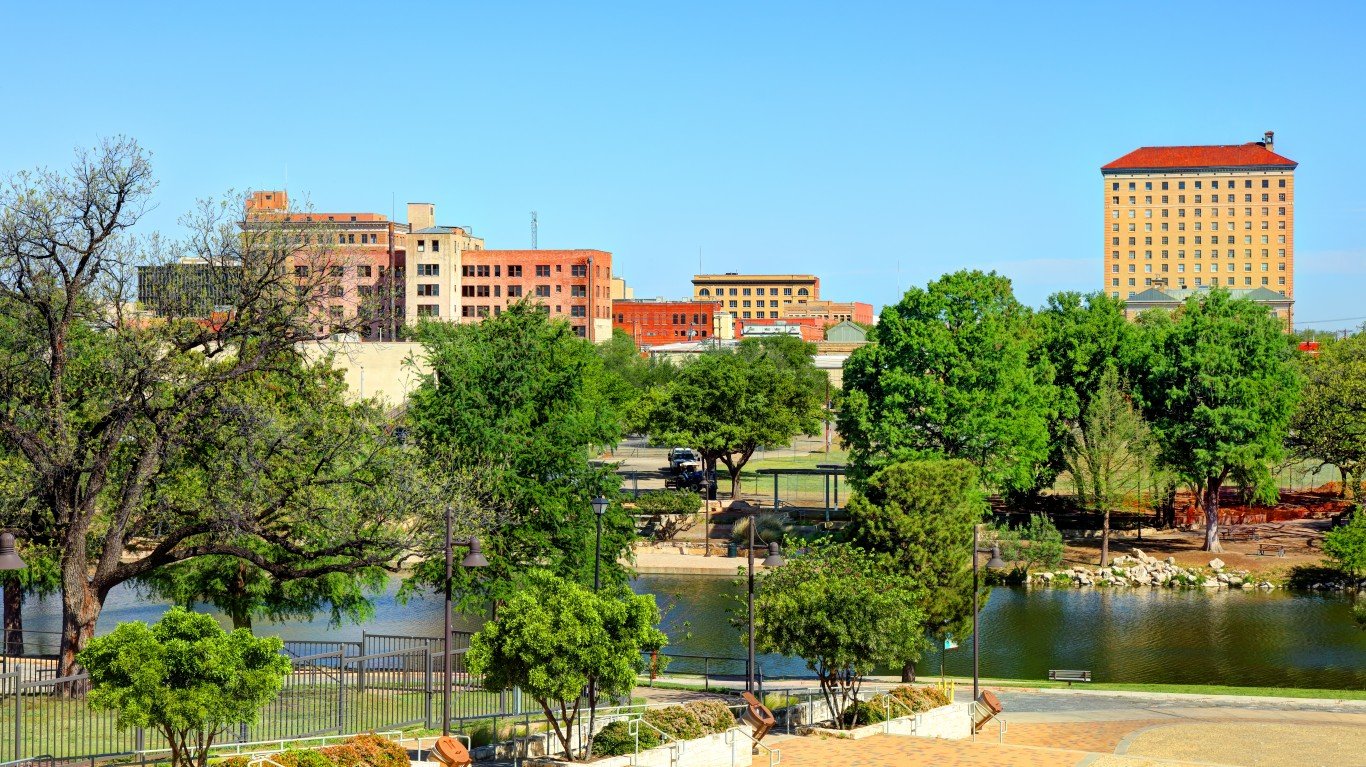
48. San Angelo, TX
> 2020 larceny-thefts per 100K people: 1,928.9
> Total larceny-thefts: 2,365 — 89th fewest of 281 metros
> Property crimes per 100K people: 2,658.1 — 54th most of 276 metros
> Total property crimes: 3,259 — 90th fewest of 276 metros
> Population: 121,376
47. Odessa, TX
> 2020 larceny-thefts per 100K people: 1,931.8
> Total larceny-thefts: 3,270 — 128th fewest of 281 metros
> Property crimes per 100K people: 2,956.8 — 33rd most of 276 metros
> Total property crimes: 5,005 — 138th fewest of 276 metros
> Population: 166,223
[in-text-ad-2]

46. Rapid City, SD
> 2020 larceny-thefts per 100K people: 1,948.8
> Total larceny-thefts: 2,804 — 110th fewest of 281 metros
> Property crimes per 100K people: 2,971.1 — 32nd most of 276 metros
> Total property crimes: 4,275 — 120th fewest of 276 metros
> Population: 142,191

45. San Francisco-Oakland-Berkeley, CA
> 2020 larceny-thefts per 100K people: 1,965.0
> Total larceny-thefts: 92,931 — 4th most of 281 metros
> Property crimes per 100K people: 3,008.2 — 30th most of 276 metros
> Total property crimes: 142,267 — 3rd most of 276 metros
> Population: 4,731,803
[in-text-ad]
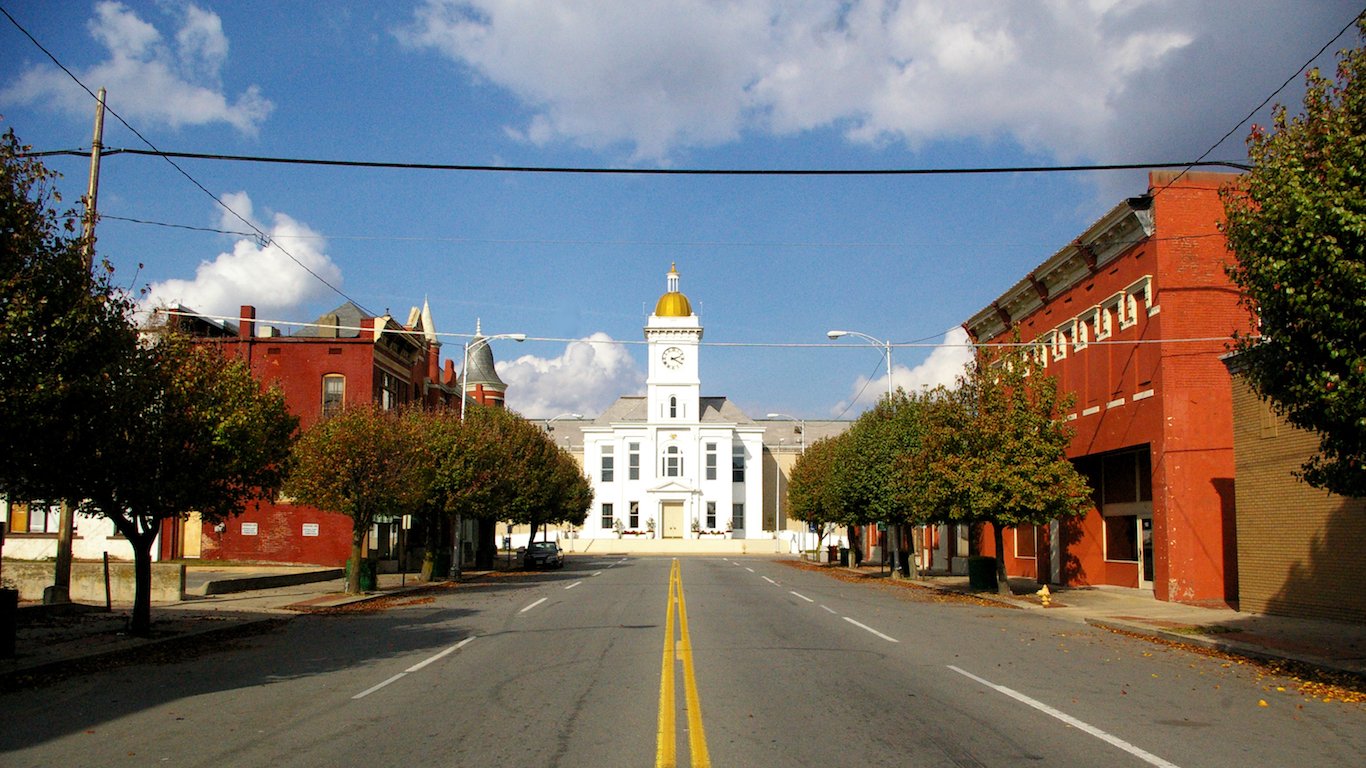
44. Pine Bluff, AR
> 2020 larceny-thefts per 100K people: 1,976.0
> Total larceny-thefts: 1,710 — 60th fewest of 281 metros
> Property crimes per 100K people: 3,048.3 — 28th most of 276 metros
> Total property crimes: 2,638 — 66th fewest of 276 metros
> Population: 89,437
[recirclink id=972847]

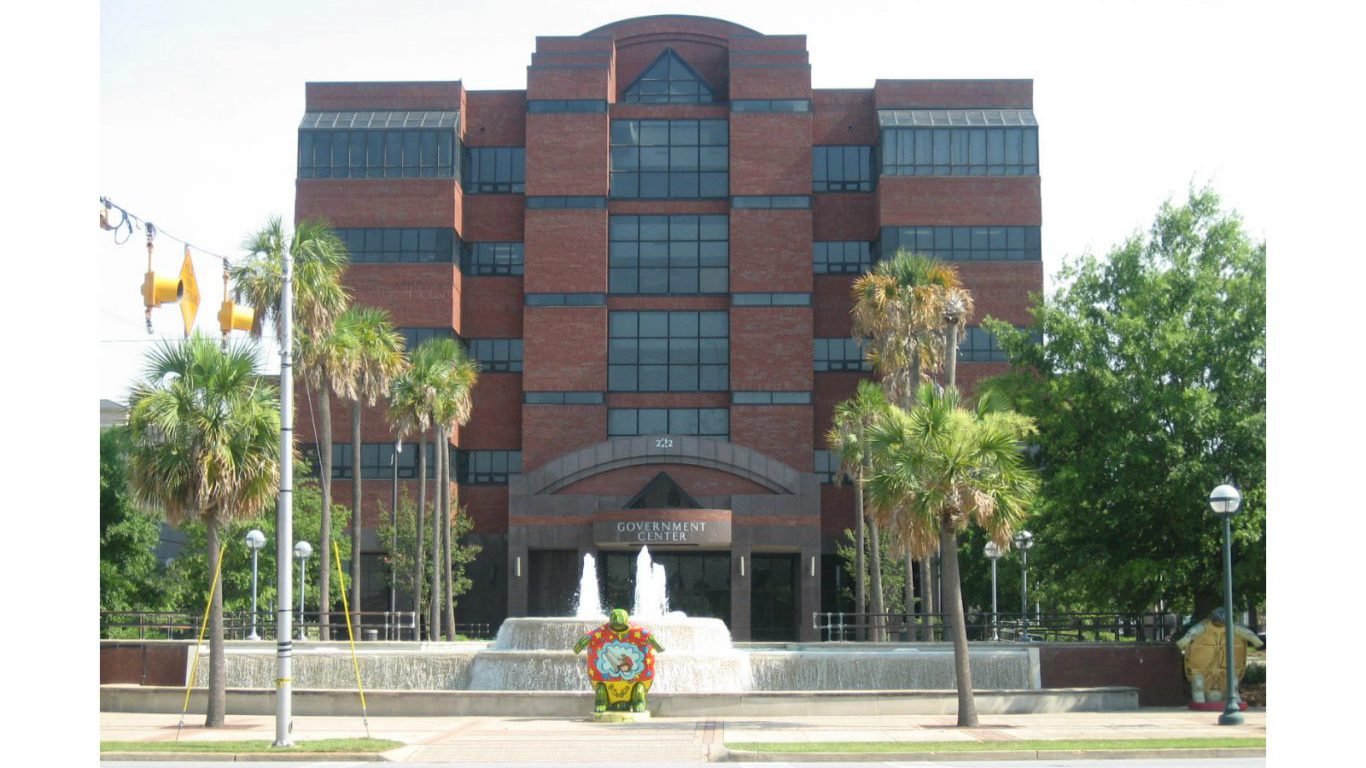
43. Panama City, FL
> 2020 larceny-thefts per 100K people: 1,982.8
> Total larceny-thefts: 3,467 — 134th fewest of 281 metros
> Property crimes per 100K people: 2,645.6 — 56th most of 276 metros
> Total property crimes: 4,626 — 127th fewest of 276 metros
> Population: 174,705

42. Sumter, SC
> 2020 larceny-thefts per 100K people: 2,011.4
> Total larceny-thefts: 2,824 — 111th fewest of 281 metros
> Property crimes per 100K people: 2,743.6 — 49th most of 276 metros
> Total property crimes: 3,852 — 110th fewest of 276 metros
> Population: 140,466
[in-text-ad-2]

41. Amarillo, TX
> 2020 larceny-thefts per 100K people: 2,015.3
> Total larceny-thefts: 5,354 — 102nd most of 281 metros
> Property crimes per 100K people: 3,042.5 — 29th most of 276 metros
> Total property crimes: 8,083 — 96th most of 276 metros
> Population: 269,447
40. Albany, GA
> 2020 larceny-thefts per 100K people: 2,026.6
> Total larceny-thefts: 2,953 — 120th fewest of 281 metros
> Property crimes per 100K people: 2,937.9 — 35th most of 276 metros
> Total property crimes: 4,281 — 121st fewest of 276 metros
> Population: 147,384
[in-text-ad]

39. Cheyenne, WY
> 2020 larceny-thefts per 100K people: 2,031.6
> Total larceny-thefts: 2,045 — 75th fewest of 281 metros (tied)
> Property crimes per 100K people: 2,599.8 — 59th most of 276 metros
> Total property crimes: 2,617 — 63rd fewest of 276 metros
> Population: 99,500
[recirclink id=988051]
38. Springfield, OH
> 2020 larceny-thefts per 100K people: 2,037.4
> Total larceny-thefts: 2,719 — 107th fewest of 281 metros (tied)
> Property crimes per 100K people: 2,901.3 — 38th most of 276 metros
> Total property crimes: 3,872 — 112th fewest of 276 metros
> Population: 134,083

37. San Antonio-New Braunfels, TX
> 2020 larceny-thefts per 100K people: 2,049.1
> Total larceny-thefts: 53,095 — 9th most of 281 metros
> Property crimes per 100K people: 2,808.9 — 45th most of 276 metros
> Total property crimes: 72,783 — 9th most of 276 metros
> Population: 2,550,960
[in-text-ad-2]
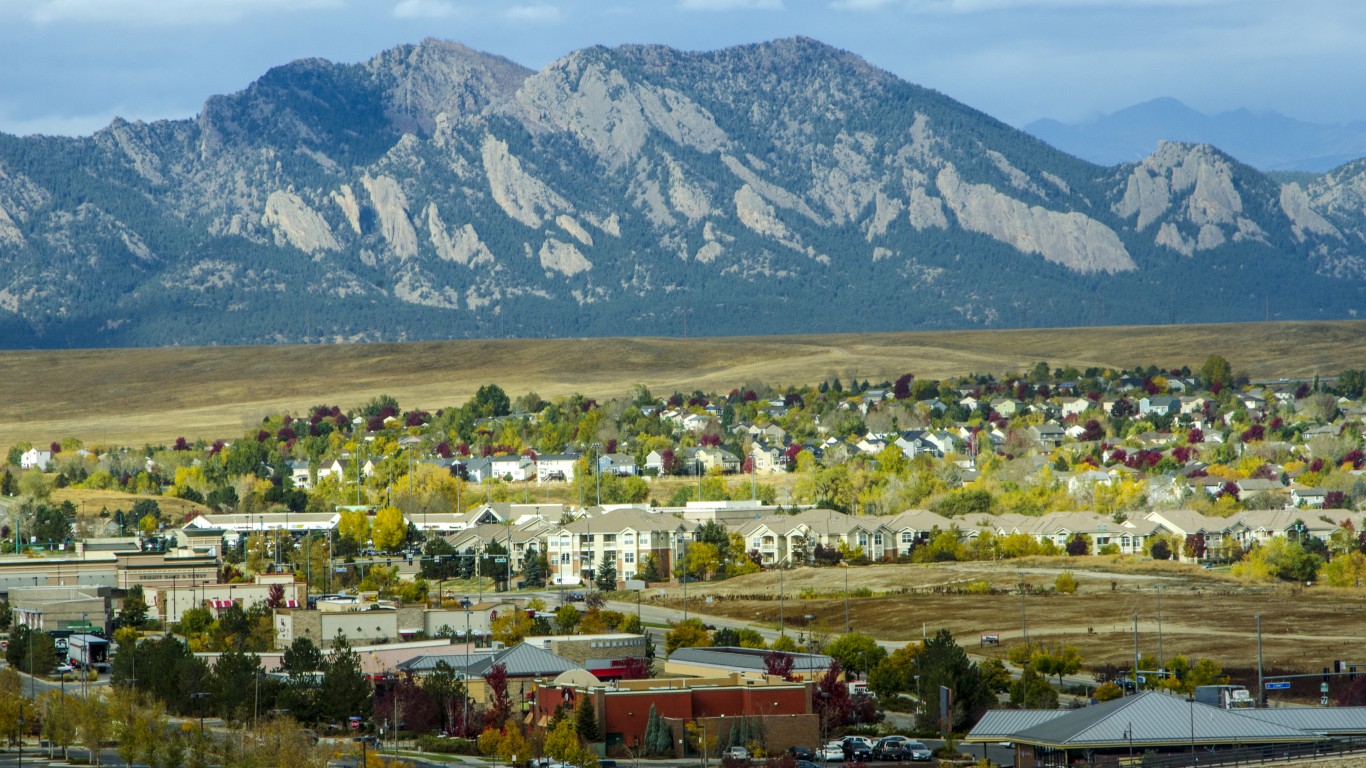
36. Boulder, CO
> 2020 larceny-thefts per 100K people: 2,051.3
> Total larceny-thefts: 6,723 — 84th most of 281 metros
> Property crimes per 100K people: 2,760.1 — 46th most of 276 metros
> Total property crimes: 9,046 — 85th most of 276 metros
> Population: 326,196
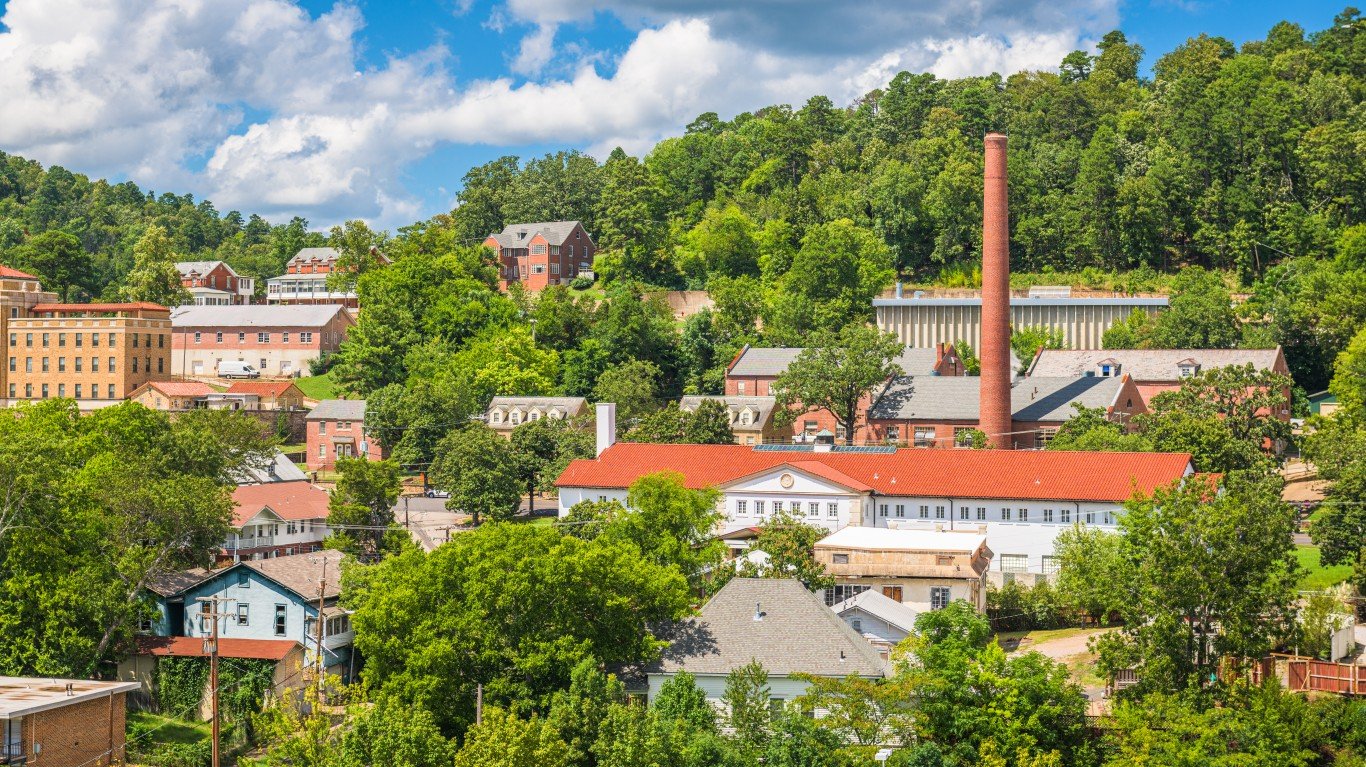
35. Hot Springs, AR
> 2020 larceny-thefts per 100K people: 2,056.9
> Total larceny-thefts: 2,052 — 77th fewest of 281 metros
> Property crimes per 100K people: 3,583.5 — 12th most of 276 metros
> Total property crimes: 3,575 — 102nd fewest of 276 metros
> Population: 99,386
[in-text-ad]

34. Missoula, MT
> 2020 larceny-thefts per 100K people: 2,058.7
> Total larceny-thefts: 2,492 — 98th fewest of 281 metros
> Property crimes per 100K people: 2,544.5 — 64th most of 276 metros
> Total property crimes: 3,080 — 80th fewest of 276 metros
> Population: 119,600
[recirclink id=1002128]

33. New Orleans-Metairie, LA
> 2020 larceny-thefts per 100K people: 2,061.9
> Total larceny-thefts: 26,290 — 27th most of 281 metros
> Property crimes per 100K people: 2,754.6 — 47th most of 276 metros
> Total property crimes: 35,121 — 26th most of 276 metros
> Population: 1,270,530

32. Salem, OR
> 2020 larceny-thefts per 100K people: 2,064.3
> Total larceny-thefts: 9,015 — 68th most of 281 metros
> Property crimes per 100K people: 2,853.6 — 40th most of 276 metros
> Total property crimes: 12,462 — 67th most of 276 metros
> Population: 433,903
[in-text-ad-2]

31. Bismarck, ND
> 2020 larceny-thefts per 100K people: 2,064.4
> Total larceny-thefts: 2,677 — 104th fewest of 281 metros
> Property crimes per 100K people: 2,847.1 — 41st most of 276 metros
> Total property crimes: 3,692 — 106th fewest of 276 metros
> Population: 129,115

30. Fort Smith, AR-OK
> 2020 larceny-thefts per 100K people: 2,074.6
> Total larceny-thefts: 5,199 — 104th most of 281 metros
> Property crimes per 100K people: 2,882.6 — 39th most of 276 metros
> Total property crimes: 7,224 — 105th most of 276 metros
> Population: 249,152
[in-text-ad]

29. Seattle-Tacoma-Bellevue, WA
> 2020 larceny-thefts per 100K people: 2,083.1
> Total larceny-thefts: 83,956 — 5th most of 281 metros
> Property crimes per 100K people: 3,156.9 — 23rd most of 276 metros
> Total property crimes: 127,233 — 5th most of 276 metros
> Population: 3,979,845
[recirclink id=1007332]

28. Denver-Aurora-Lakewood, CO
> 2020 larceny-thefts per 100K people: 2,124.7
> Total larceny-thefts: 63,699 — 7th most of 281 metros
> Property crimes per 100K people: 3,302.7 — 19th most of 276 metros
> Total property crimes: 99,017 — 7th most of 276 metros
> Population: 2,967,239

27. Corpus Christi, TX
> 2020 larceny-thefts per 100K people: 2,139.6
> Total larceny-thefts: 9,208 — 66th most of 281 metros
> Property crimes per 100K people: 2,943.6 — 34th most of 276 metros
> Total property crimes: 12,668 — 66th most of 276 metros
> Population: 429,024
[in-text-ad-2]

26. La Crosse-Onalaska, WI-MN
> 2020 larceny-thefts per 100K people: 2,175.5
> Total larceny-thefts: 2,975 — 121st fewest of 281 metros
> Property crimes per 100K people: 2,501.6 — 67th most of 276 metros
> Total property crimes: 3,421 — 97th fewest of 276 metros
> Population: 136,616

25. Grand Junction, CO
> 2020 larceny-thefts per 100K people: 2,180.7
> Total larceny-thefts: 3,361 — 131st fewest of 281 metros
> Property crimes per 100K people: 2,980.7 — 31st most of 276 metros
> Total property crimes: 4,594 — 125th fewest of 276 metros
> Population: 154,210
[in-text-ad]

24. Chattanooga, TN-GA
> 2020 larceny-thefts per 100K people: 2,181.2
> Total larceny-thefts: 12,414 — 52nd most of 281 metros
> Property crimes per 100K people: 3,070.2 — 27th most of 276 metros
> Total property crimes: 17,474 — 50th most of 276 metros
> Population: 566,153
[recirclink id=966311]

23. Tucson, AZ
> 2020 larceny-thefts per 100K people: 2,265.9
> Total larceny-thefts: 24,023 — 29th most of 281 metros
> Property crimes per 100K people: 2,824.8 — 44th most of 276 metros
> Total property crimes: 29,948 — 33rd most of 276 metros
> Population: 1,047,279

22. Medford, OR
> 2020 larceny-thefts per 100K people: 2,279.6
> Total larceny-thefts: 5,058 — 110th most of 281 metros
> Property crimes per 100K people: 2,834.4 — 42nd most of 276 metros
> Total property crimes: 6,289 — 121st most of 276 metros
> Population: 220,944
[in-text-ad-2]

21. Little Rock-North Little Rock-Conway, AR
> 2020 larceny-thefts per 100K people: 2,291.0
> Total larceny-thefts: 17,116 — 37th most of 281 metros
> Property crimes per 100K people: 3,178.5 — 22nd most of 276 metros
> Total property crimes: 23,746 — 39th most of 276 metros
> Population: 744,483

20. Albuquerque, NM
> 2020 larceny-thefts per 100K people: 2,303.5
> Total larceny-thefts: 21,278 — 31st most of 281 metros
> Property crimes per 100K people: 3,654.1 — 9th most of 276 metros
> Total property crimes: 33,754 — 30th most of 276 metros
> Population: 914,480
[in-text-ad]
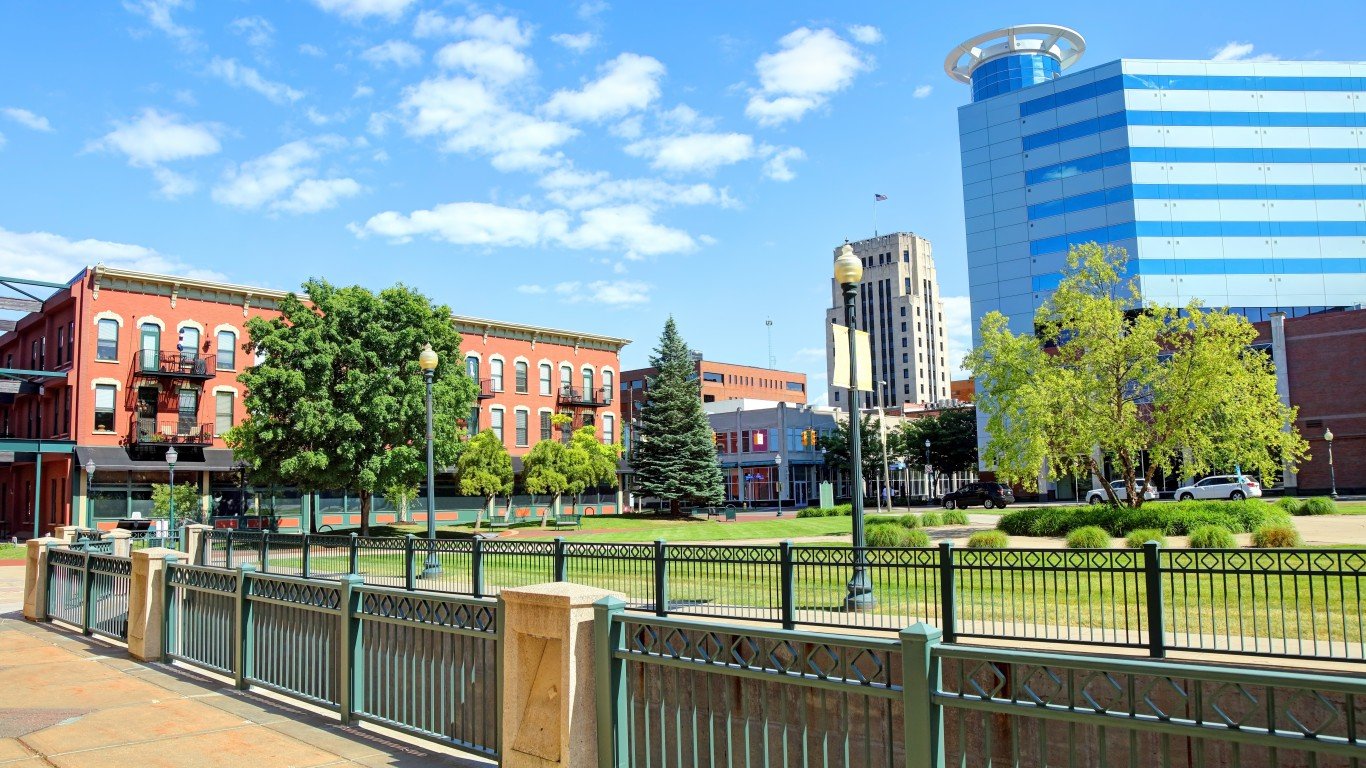
19. Kalamazoo-Portage, MI
> 2020 larceny-thefts per 100K people: 2,311.5
> Total larceny-thefts: 6,144 — 90th most of 281 metros
> Property crimes per 100K people: 3,306.6 — 18th most of 276 metros
> Total property crimes: 8,789 — 90th most of 276 metros
> Population: 265,066
[recirclink id=972847]

18. Columbia, SC
> 2020 larceny-thefts per 100K people: 2,378.9
> Total larceny-thefts: 20,161 — 34th most of 281 metros
> Property crimes per 100K people: 3,272.0 — 21st most of 276 metros
> Total property crimes: 27,730 — 35th most of 276 metros
> Population: 839,039
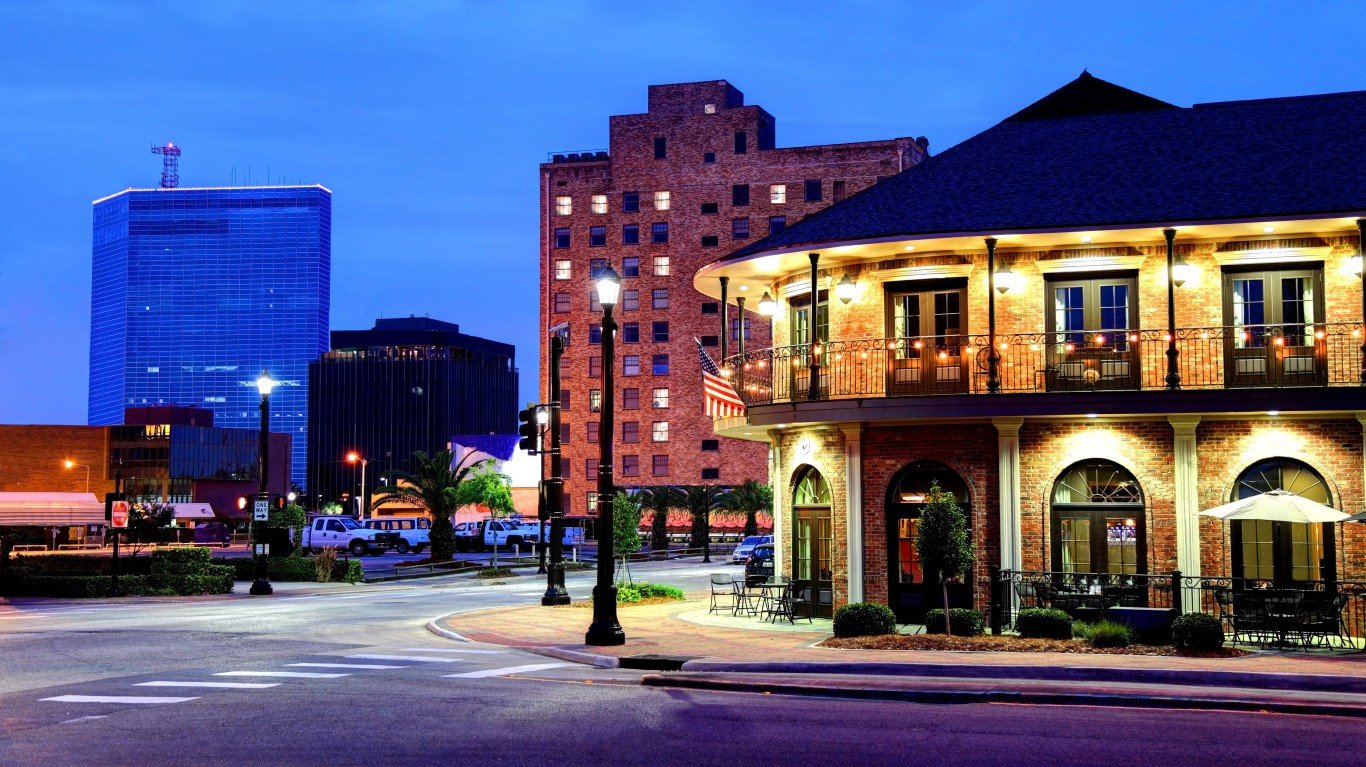
17. Lake Charles, LA
> 2020 larceny-thefts per 100K people: 2,404.5
> Total larceny-thefts: 5,070 — 109th most of 281 metros
> Property crimes per 100K people: 3,813.6 — 5th most of 276 metros
> Total property crimes: 8,041 — 97th most of 276 metros
> Population: 209,035
[in-text-ad-2]
16. Springfield, MO
> 2020 larceny-thefts per 100K people: 2,412.5
> Total larceny-thefts: 11,433 — 57th most of 281 metros
> Property crimes per 100K people: 3,301.7 — 20th most of 276 metros
> Total property crimes: 15,647 — 56th most of 276 metros
> Population: 467,516

15. Baton Rouge, LA
> 2020 larceny-thefts per 100K people: 2,413.3
> Total larceny-thefts: 20,637 — 33rd most of 281 metros
> Property crimes per 100K people: 3,091.0 — 26th most of 276 metros
> Total property crimes: 26,433 — 36th most of 276 metros
> Population: 854,884
[in-text-ad]

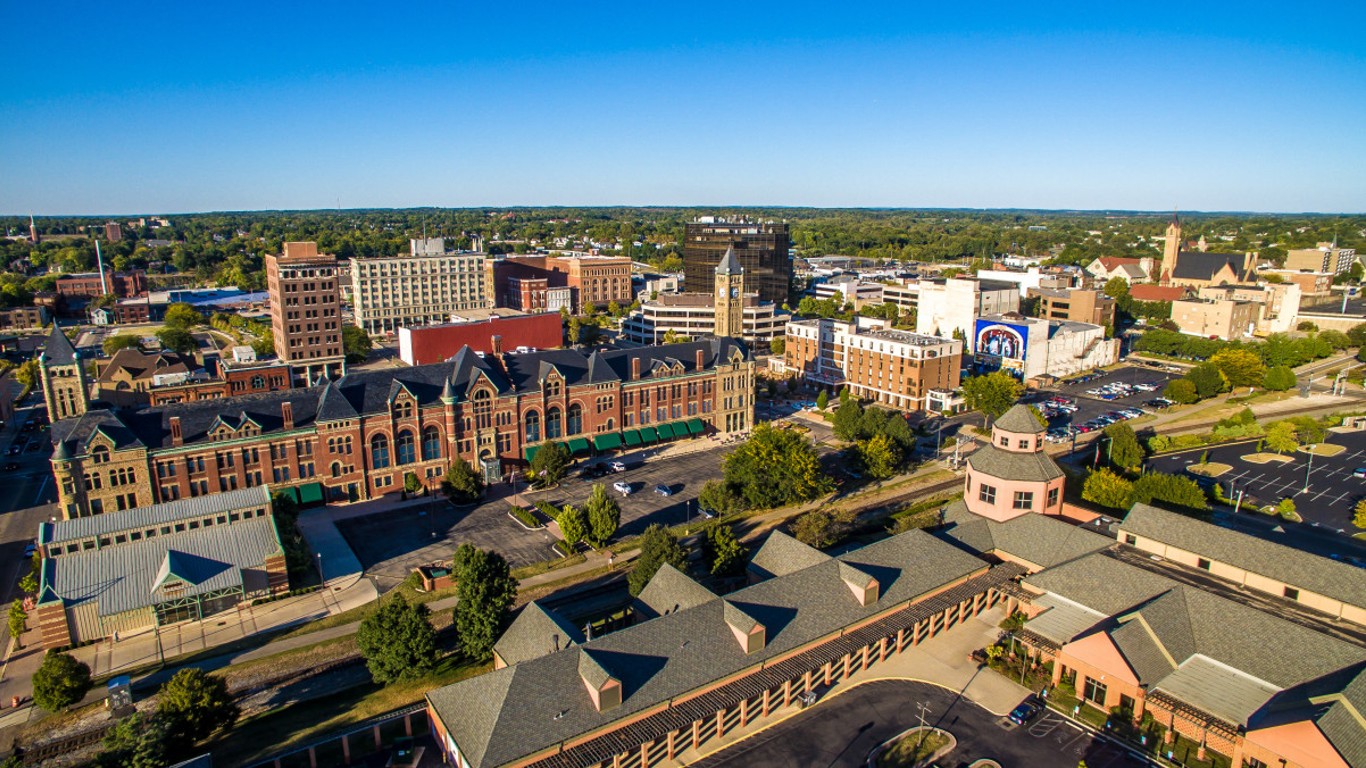
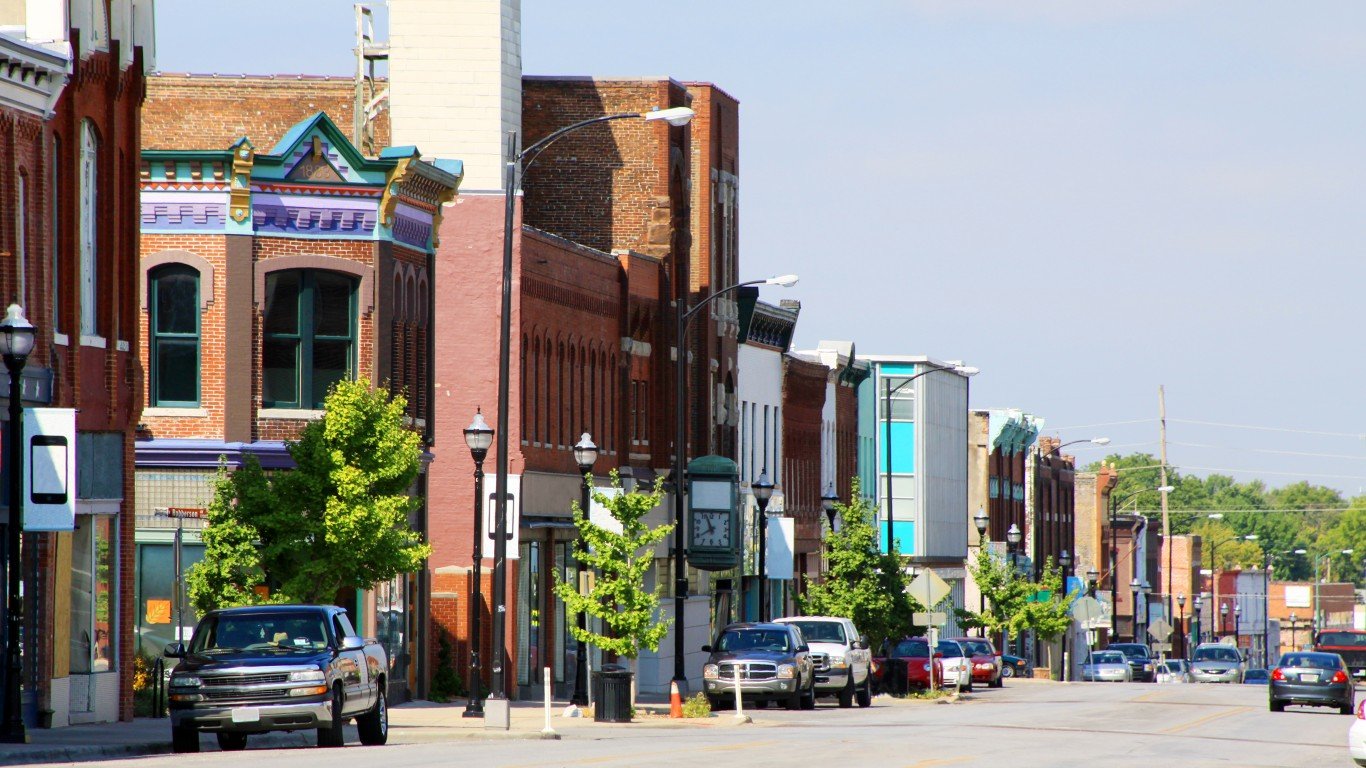
14. St. Joseph, MO-KS
> 2020 larceny-thefts per 100K people: 2,451.8
> Total larceny-thefts: 3,063 — 124th fewest of 281 metros
> Property crimes per 100K people: 3,541.3 — 13th most of 276 metros
> Total property crimes: 4,424 — 124th fewest of 276 metros
> Population: 125,411
[recirclink id=988051]

13. Billings, MT
> 2020 larceny-thefts per 100K people: 2,456.1
> Total larceny-thefts: 4,512 — 122nd most of 281 metros
> Property crimes per 100K people: 3,471.9 — 16th most of 276 metros
> Total property crimes: 6,378 — 118th most of 276 metros
> Population: 181,667
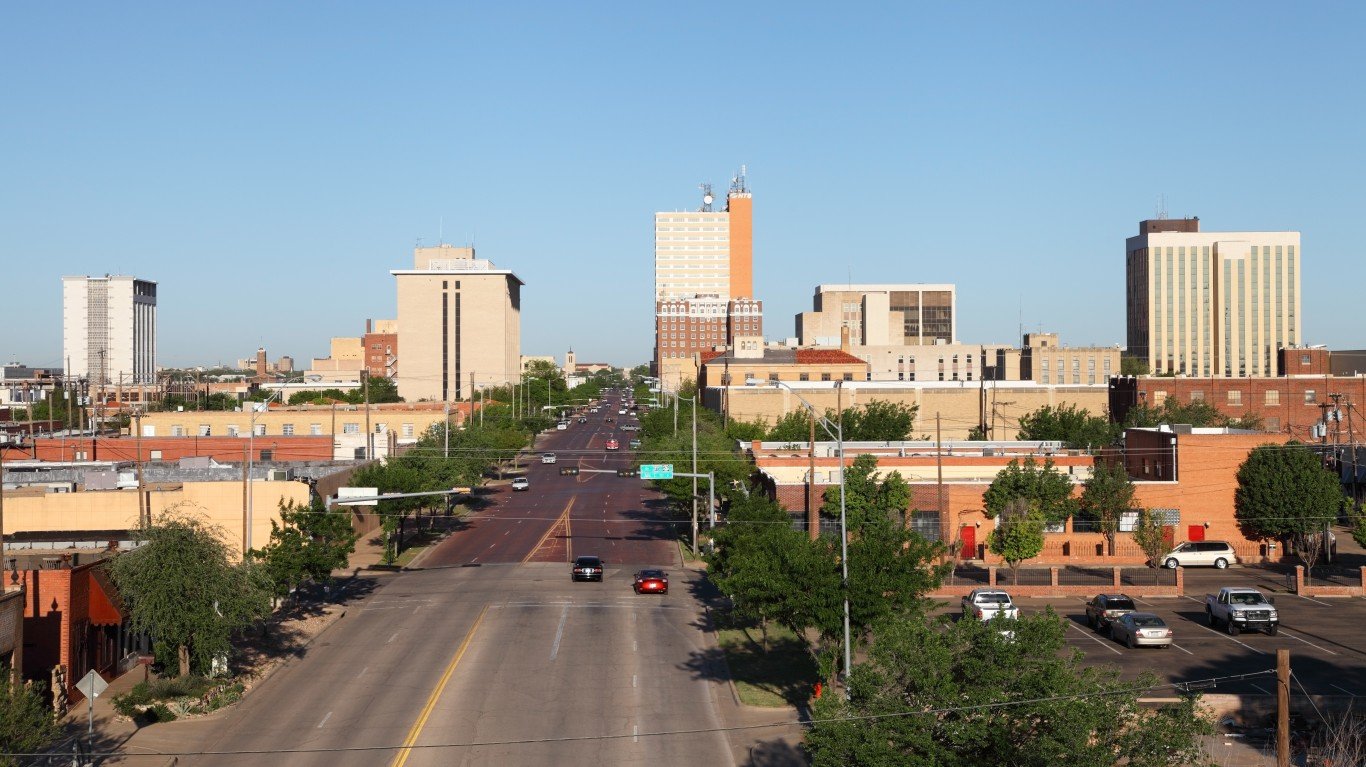
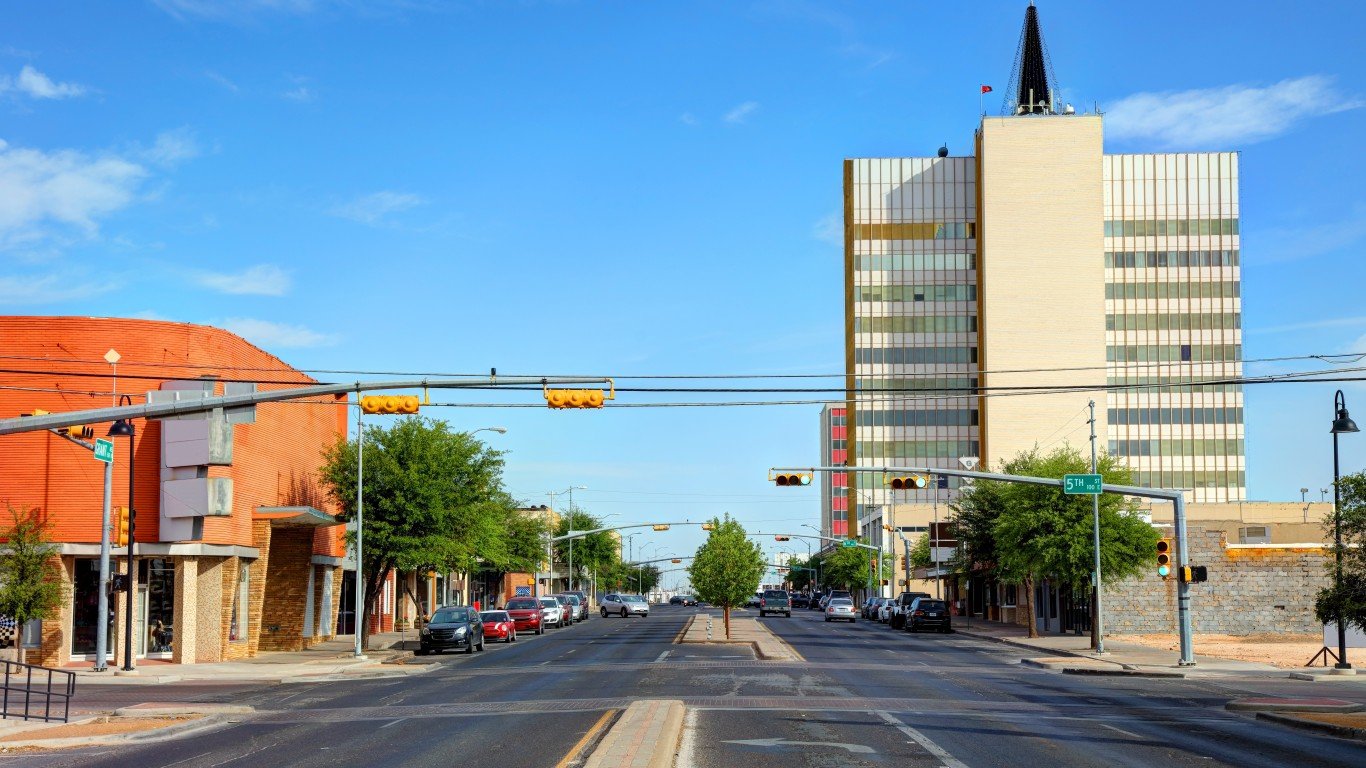
12. Lubbock, TX
> 2020 larceny-thefts per 100K people: 2,487.1
> Total larceny-thefts: 8,075 — 75th most of 281 metros
> Property crimes per 100K people: 3,682.4 — 7th most of 276 metros
> Total property crimes: 11,956 — 72nd most of 276 metros
> Population: 321,982
[in-text-ad-2]
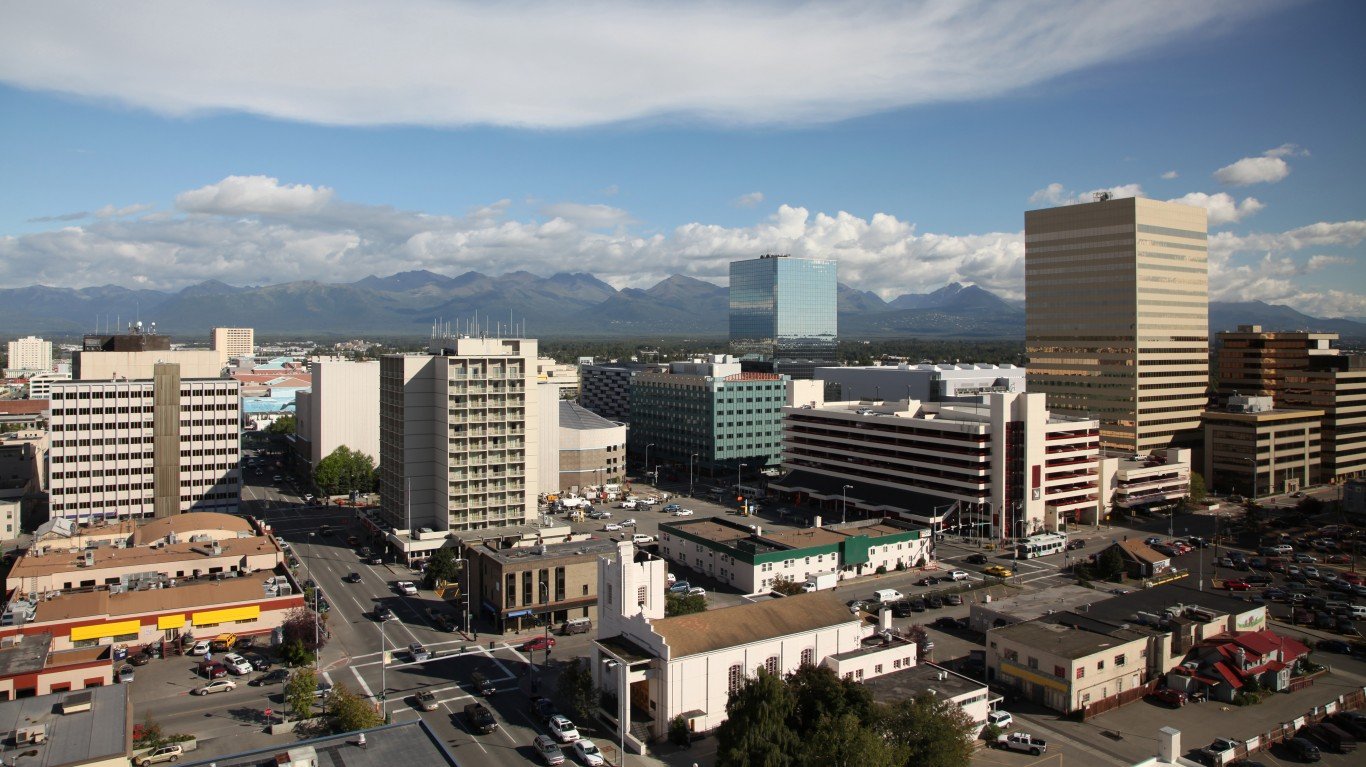
11. Anchorage, AK
> 2020 larceny-thefts per 100K people: 2,523.4
> Total larceny-thefts: 7,703 — 79th most of 281 metros
> Property crimes per 100K people: 3,404.7 — 17th most of 276 metros
> Total property crimes: 10,393 — 79th most of 276 metros
> Population: 396,317
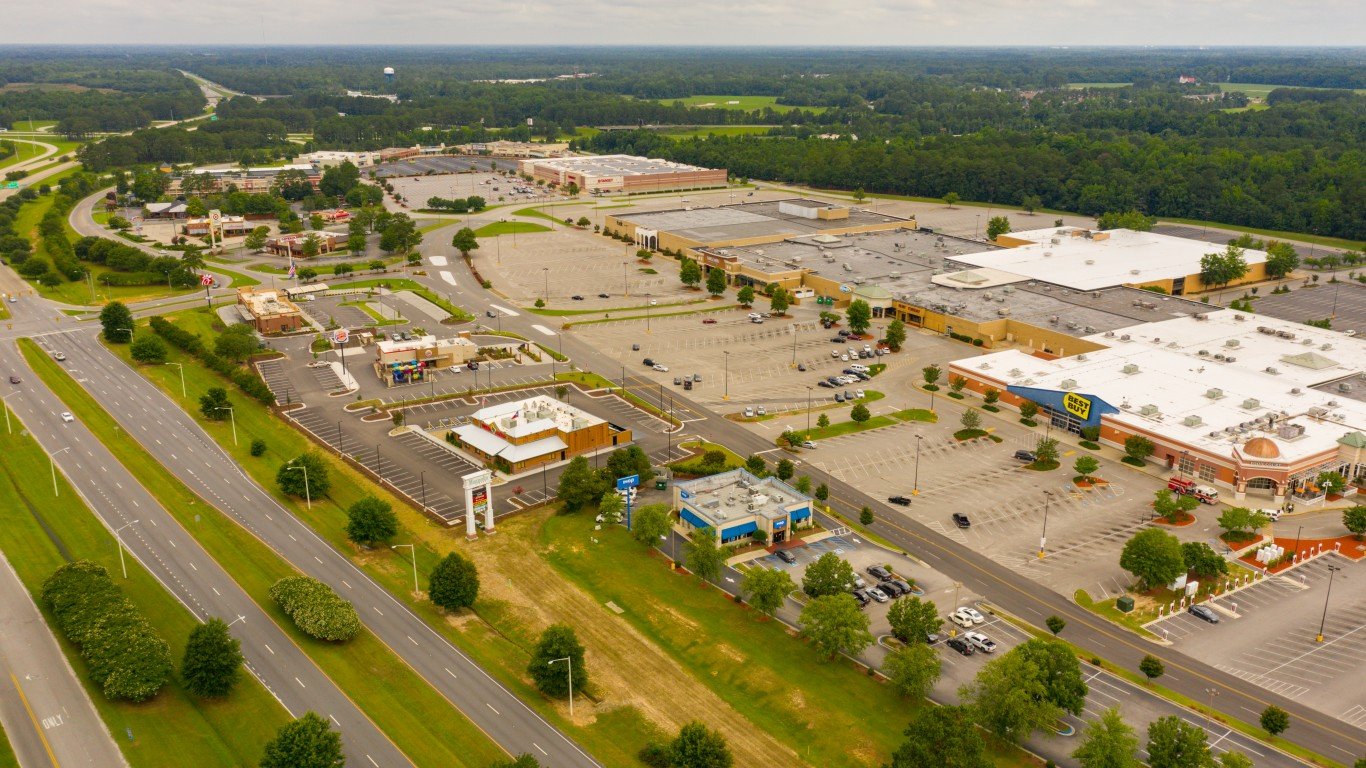
10. Florence, SC
> 2020 larceny-thefts per 100K people: 2,524.5
> Total larceny-thefts: 5,177 — 105th most of 281 metros
> Property crimes per 100K people: 3,600.8 — 10th most of 276 metros
> Total property crimes: 7,384 — 102nd most of 276 metros
> Population: 204,911
[in-text-ad]

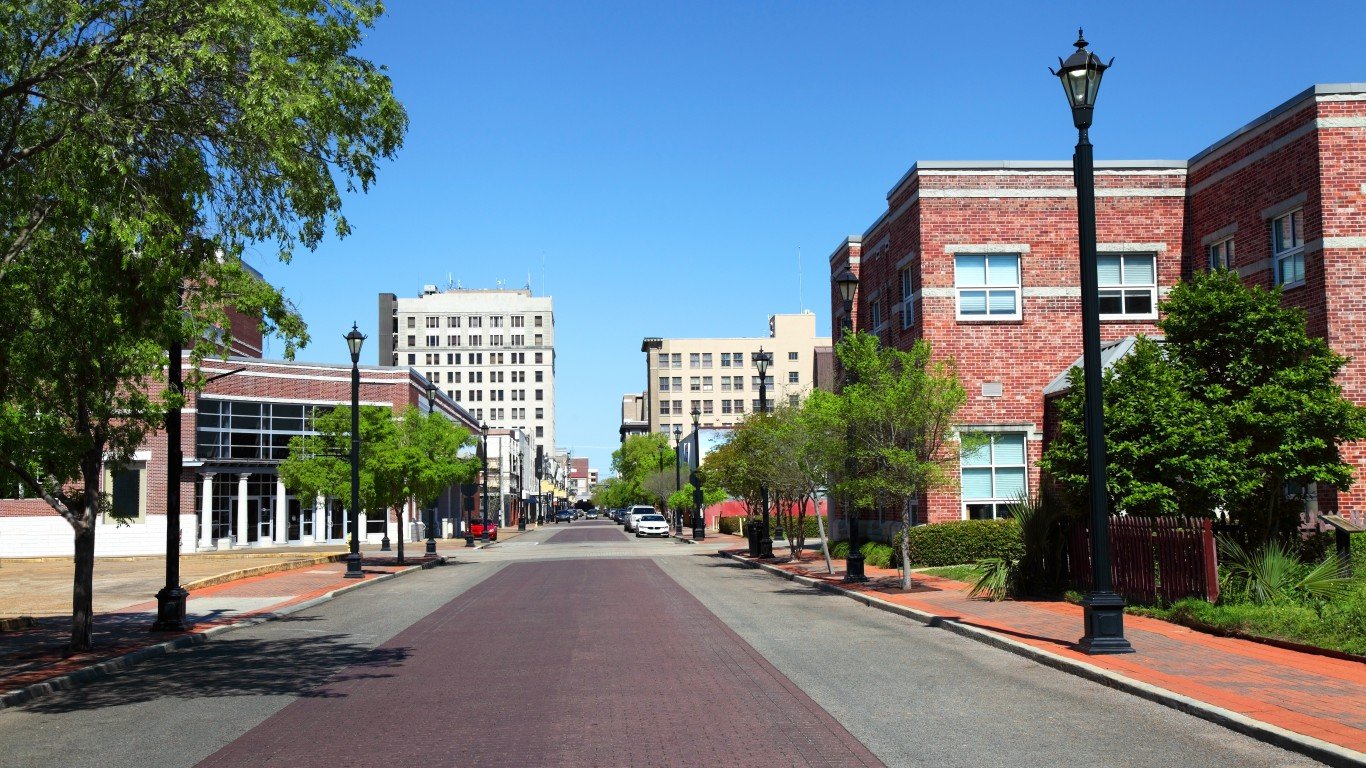
9. Monroe, LA
> 2020 larceny-thefts per 100K people: 2,536.2
> Total larceny-thefts: 5,049 — 111th most of 281 metros
> Property crimes per 100K people: 3,654.3 — 8th most of 276 metros
> Total property crimes: 7,275 — 103rd most of 276 metros
> Population: 200,261
[recirclink id=1002128]

8. Spokane-Spokane Valley, WA
> 2020 larceny-thefts per 100K people: 2,594.6
> Total larceny-thefts: 14,863 — 44th most of 281 metros
> Property crimes per 100K people: 3,478.6 — 15th most of 276 metros
> Total property crimes: 19,927 — 47th most of 276 metros
> Population: 568,521

7. Joplin, MO
> 2020 larceny-thefts per 100K people: 2,646.4
> Total larceny-thefts: 4,761 — 116th most of 281 metros
> Property crimes per 100K people: 3,531.9 — 14th most of 276 metros
> Total property crimes: 6,354 — 119th most of 276 metros
> Population: 179,564
[in-text-ad-2]
6. Alexandria, LA
> 2020 larceny-thefts per 100K people: 2,647.0
> Total larceny-thefts: 4,004 — 133rd most of 281 metros
> Property crimes per 100K people: 4,018.7 — 2nd most of 276 metros
> Total property crimes: 6,079 — 123rd most of 276 metros
> Population: 152,037

5. Shreveport-Bossier City, LA
> 2020 larceny-thefts per 100K people: 2,681.3
> Total larceny-thefts: 10,533 — 59th most of 281 metros
> Property crimes per 100K people: 3,588.1 — 11th most of 276 metros
> Total property crimes: 14,095 — 60th most of 276 metros
> Population: 394,706
[in-text-ad]

4. Memphis, TN-MS-AR
> 2020 larceny-thefts per 100K people: 2,693.4
> Total larceny-thefts: 36,321 — 15th most of 281 metros
> Property crimes per 100K people: 3,718.5 — 6th most of 276 metros
> Total property crimes: 50,144 — 13th most of 276 metros
> Population: 1,344,910
[recirclink id=1007332]

3. Salt Lake City, UT
> 2020 larceny-thefts per 100K people: 2,842.9
> Total larceny-thefts: 35,429 — 16th most of 281 metros
> Property crimes per 100K people: 3,816.8 — 4th most of 276 metros
> Total property crimes: 47,566 — 18th most of 276 metros
> Population: 1,232,696

2. Fairbanks, AK
> 2020 larceny-thefts per 100K people: 2,961.5
> Total larceny-thefts: 975 — 12th fewest of 281 metros
> Property crimes per 100K people: 4,152.2 — the most of 276 metros
> Total property crimes: 1,367 — 16th fewest of 276 metros
> Population: 96,849
[in-text-ad-2]

1. Great Falls, MT
> 2020 larceny-thefts per 100K people: 3,335.0
> Total larceny-thefts: 2,719 — 107th fewest of 281 metros (tied)
> Property crimes per 100K people: 3,999.8 — 3rd most of 276 metros
> Total property crimes: 3,261 — 91st fewest of 276 metros
> Population: 81,366
Methodology
To determine the metro area with the highest larceny-theft rates, 24/7 Wall St. reviewed larceny-theft figures from the FBI’s 2020 Uniform Crime Report.
Limited data was available in the 2020 UCR for areas in Alabama, Maryland, Pennsylvania, and Illinois, though metro areas in these states were not excluded from analysis. Metro areas for which the boundaries defined by the FBI match the boundaries as defined by the U.S. Census Bureau were considered.
Data for property crime — a category that includes larceny-theft, burglary, and motor vehicle theft — also came from the 2020 FBI UCR. Population figures are one-year estimates from the U.S. Census Bureau’s 2019 American Community Survey. However, these estimates were not used to calculate crime rates. Crime rates per 100,000 people were calculated using population figures provided by the FBI in the 2020 UCR.
Contact [email protected] for any questions or corrections.