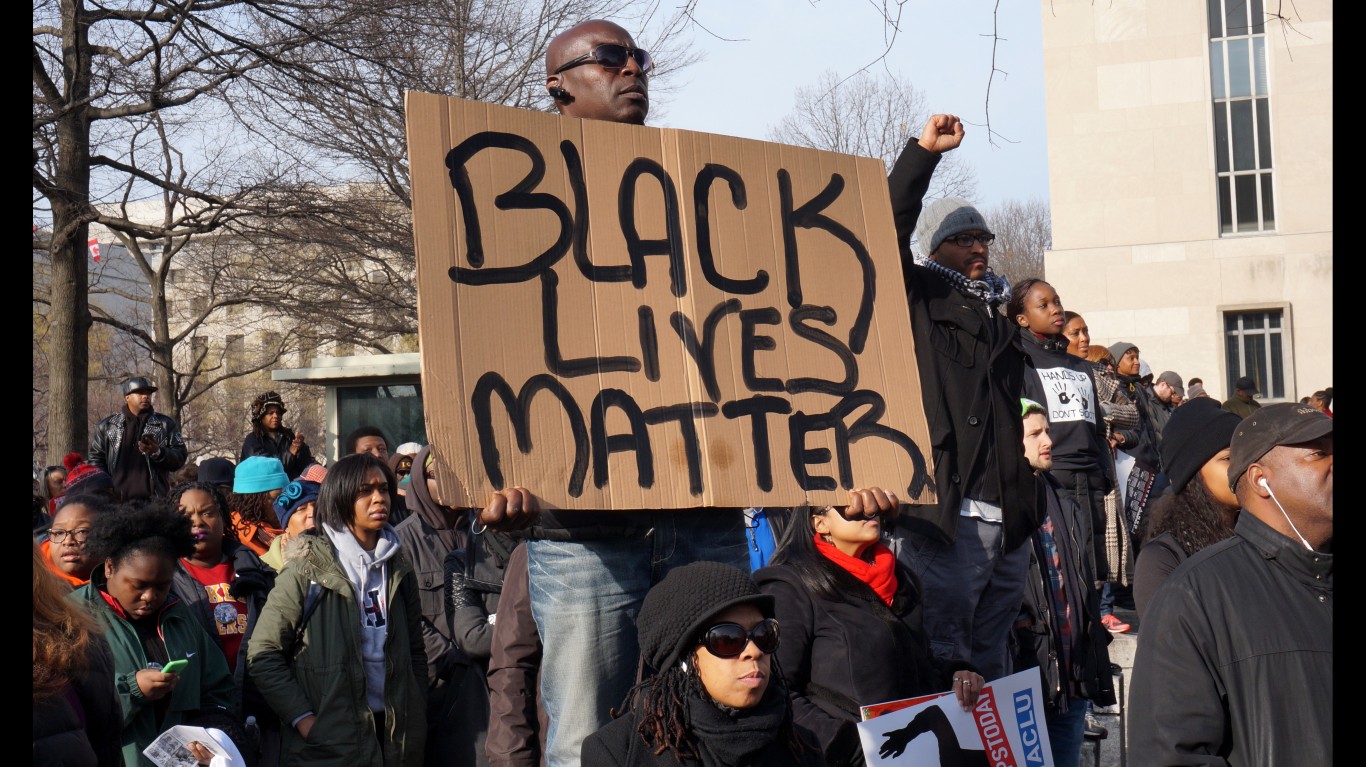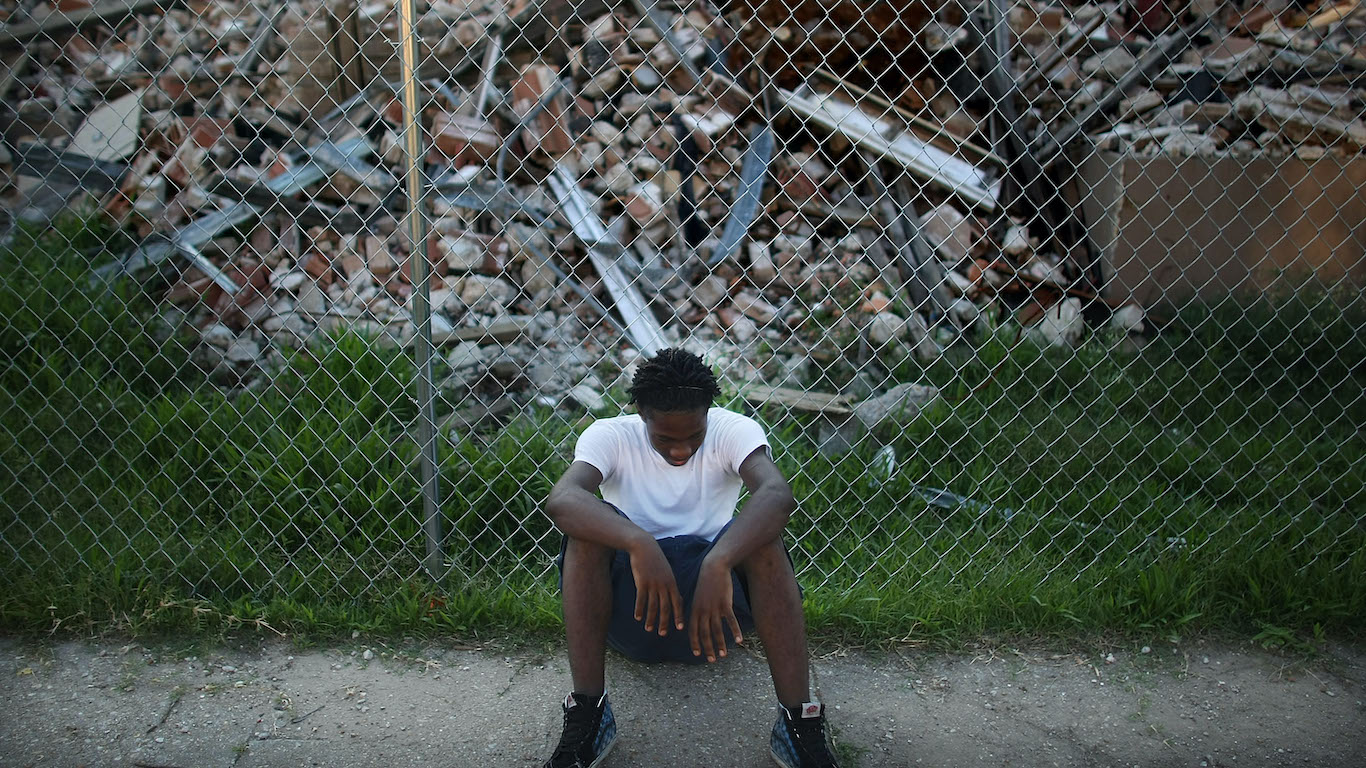
The May 2020 murder of George Floyd brought the U.S. into an era of racial reckoning. The tragedy, in which an unarmed Black man was killed in broad daylight by a white police officer, sparked global outrage and, in the U.S., put racial inequity at the center of the national conversation.
From slavery to the Jim Crow era, the United States has a centuries-long history of government-sanctioned racism. While such laws have been long since repealed, their legacies loom large and have shaped much of the racial inequity evident in the United States to this day.
With far fewer opportunities than white Americans have generally had to build intergenerational wealth through education, homeownership, and employment, Black Americans today are more than twice as likely as their white counterparts to live below the poverty line. Additionally, the typical Black household earns just 63 cents for every dollar a typical white household earns, and African American workers are also more than twice as likely to be unemployed as white workers.
While disparities such as these span the country, they are far more pronounced in certain areas. Using data from the U.S. Census Bureau, 24/7 Wall St. created an index to measure socioeconomic disparities between Black and white Americans by congressional districts to identify the worst congressional districts for Black Americans.
It is important to note that congressional districts, unlike cities, towns, or counties, are not managed by a central municipality and can span multiple cities, parts of cities, or be encompassed within one single city. The borders of congressional districts can also shift every 10 years due to redistricting, a process many states are undertaking currently.
As such, congressional representatives – who face reelection every two years – are limited in their power to affect change and address issues of social and economic inequality within their district. Still, congressmen and congresswomen do have the power to write, amend, and vote on legislation at the national level and bring federal money to their district.
Most of the congressional districts on this list are located in the Midwest, around cities that remain heavily segregated due to restrictive housing covenants in the early 20th century. Many are also located in the South and around industrial cities in the Northeast. The vast majority of these districts are represented by Democrats – many of whom list civil rights among their top political priorities.
Click here to see the worst voting districts for Black Americans
Click here to read our detailed methodology
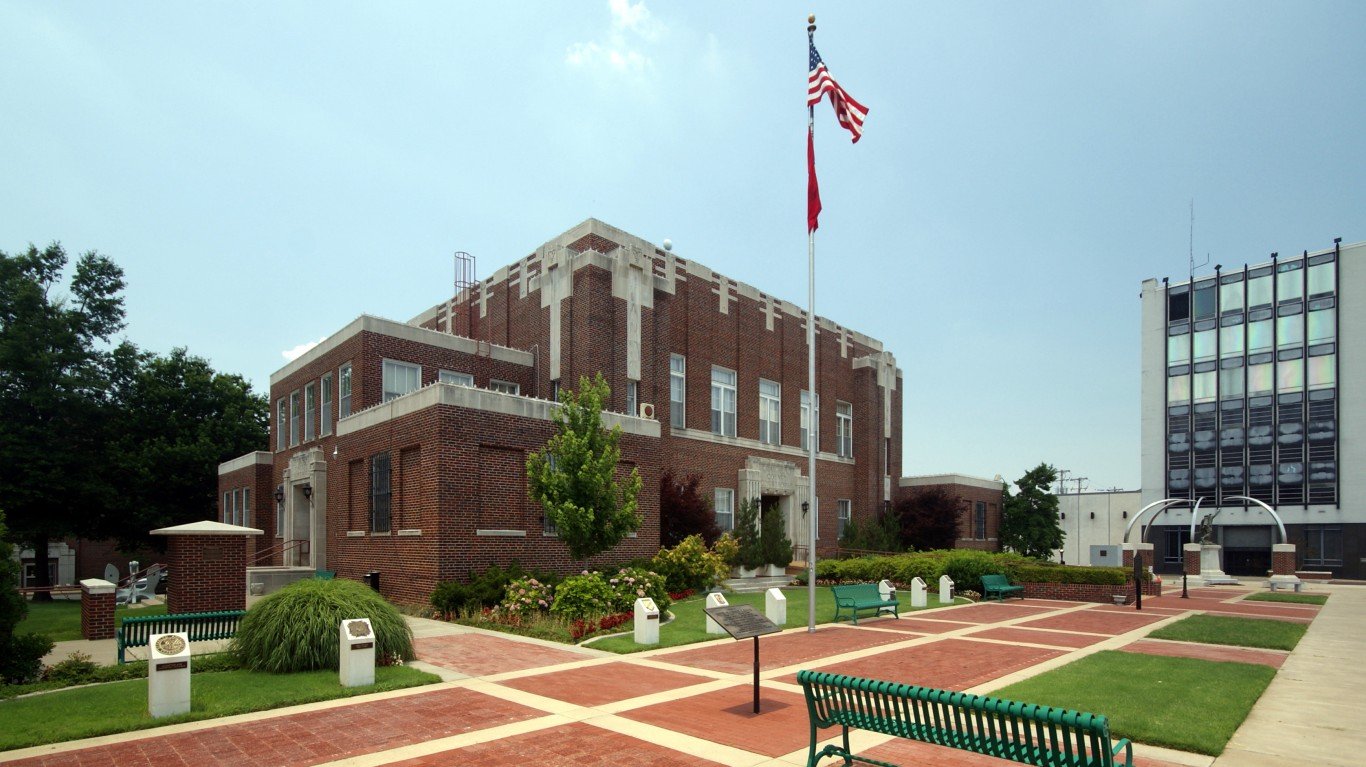
30. Arkansas’ 1st Congressional District
> Current representative: Rep. Rick Crawford (R)
> Major city covered by district: Jonesboro
> Poverty rate: 34.1% Black; 15.2% white
> Unemployment rate: 12.5% Black; 5.0% white
> Homeownership rate: 39.8% Black; 71.3% white
Many living in Arkansas’ 1st Congressional District are struggling financially – but the burden is disproportionately shouldered by the area’s Black residents. The typical Black area household earns just $28,241 a year, over $18,000 less than the local median income of $46,316 among white households. Black area residents are also twice as likely to be unemployed and twice as likely to live below the poverty line as their white counterparts.
The district, which covers the entire eastern border of the state and extends as far west as Searcy County, has been represented by Republican Congressman Rick Crawford since 2011.
[in-text-ad]
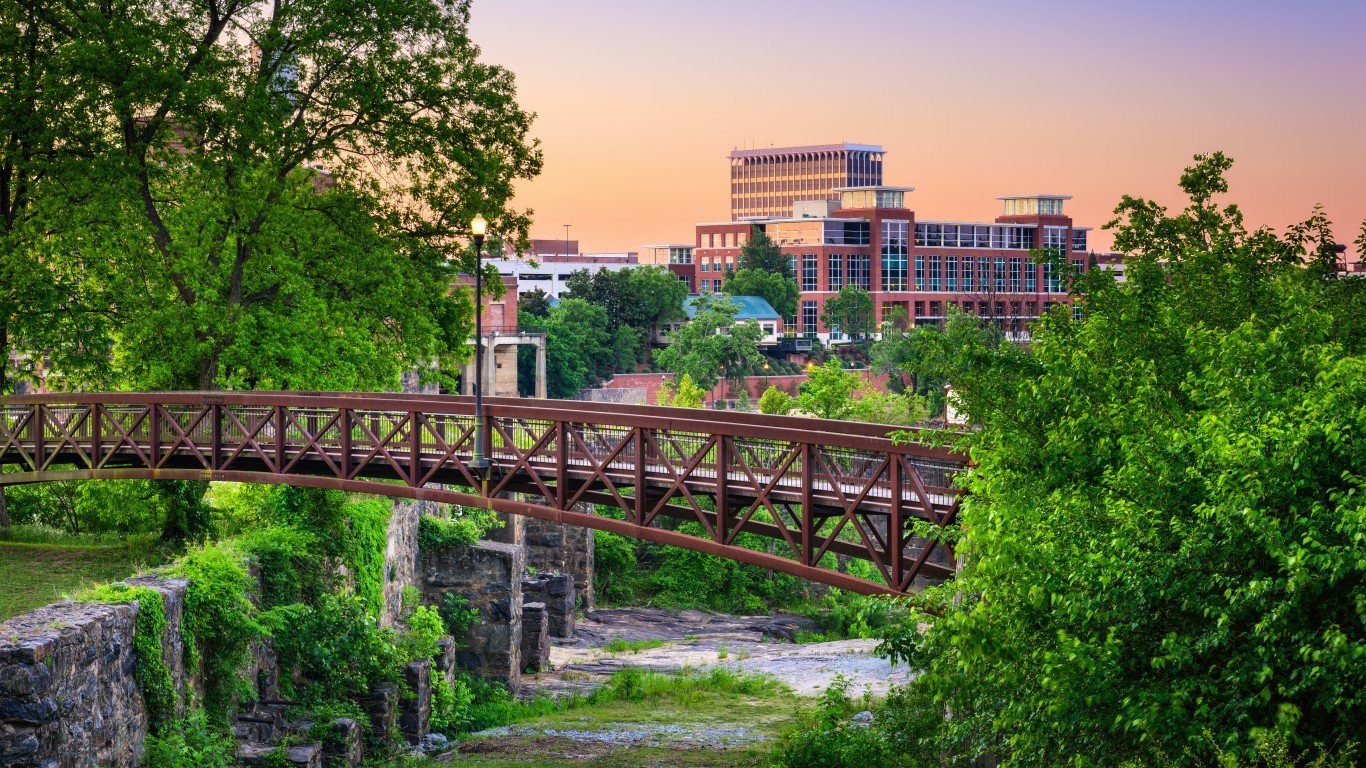
29. Georgia’s 2nd Congressional District
> Current representative: Rep. Sanford D. Bishop Jr. (D)
> Major city covered by district: Columbus
> Poverty rate: 34.1% Black; 14.6% white
> Unemployment rate: 13.2% Black; 5.7% white
> Homeownership rate: 43.0% Black; 70.1% white
Georgia’s 2nd Congressional District is one of several districts in the South to rank on this list. The South’s legacy of segregation continues to impact generations of Black Americans, leading to continued inequality. In Georgia’s 2nd, most Black households earn less than $30,000 a year, while most white households earn about $53,000 or more. Black area residents are also twice as likely to be unemployed and twice as likely to live below the poverty line as their white counterparts.
The district, which covers the southwestern corner of the state, has been represented by Democratic Congressman Sanford Bishop Jr. since 1993. Bishop is currently serving as the Chairman of the Agriculture, Rural Development, Food and Drug Administration, and Related Agencies Appropriations Subcommittee.
[recirclink id=996411]
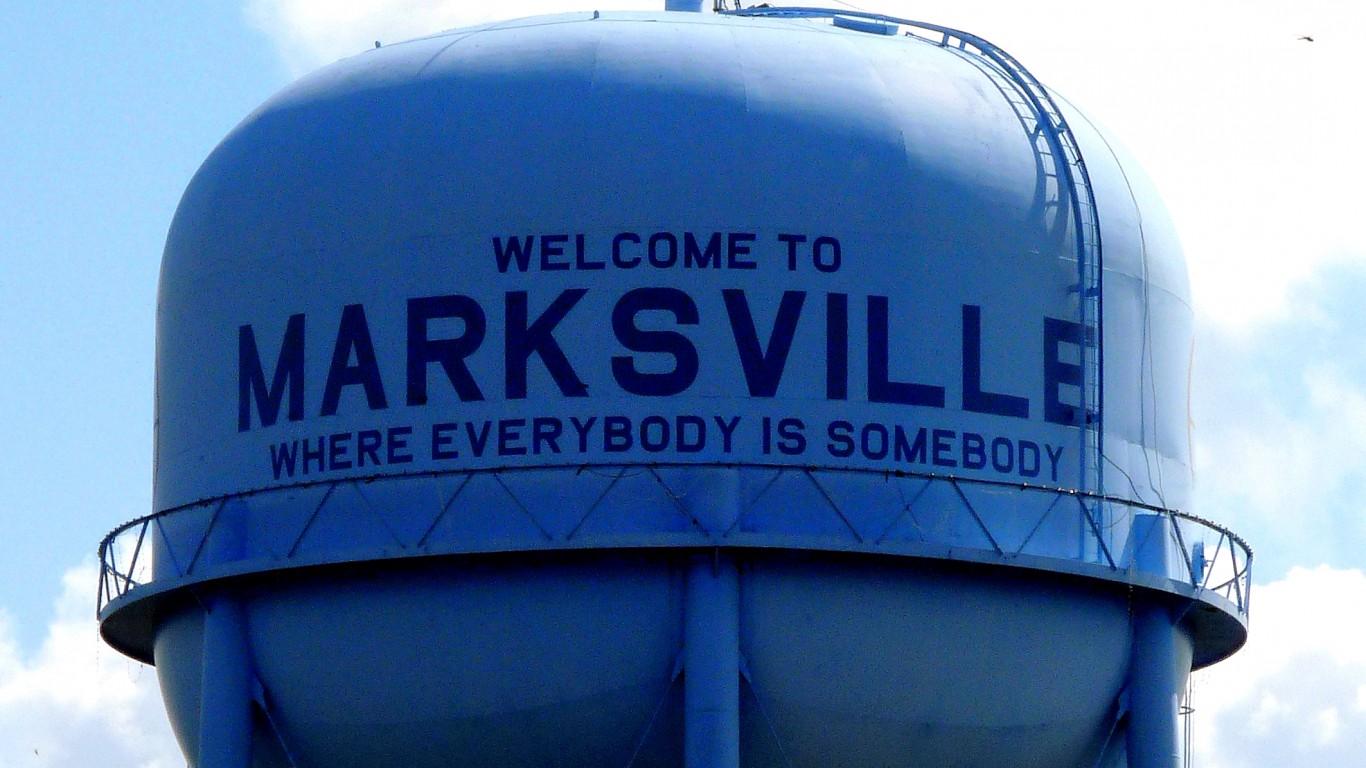
28. Louisiana’s 5th Congressional District
> Current representative: Rep. Julia Letlow (R)
> Major city covered by district: Monroe
> Poverty rate: 39.1% Black; 15.6% white
> Unemployment rate: 9.8% Black; 5.3% white
> Homeownership rate: 43.9% Black; 75.4% white
Louisiana’s 5th Congressional District is a geographically large district that covers much of the state’s eastern border and includes the cities of Monroe and Alexandria. Across the district, 39.1% of Black residents live below the poverty line compared to 15.6% of white residents. Such disparities are partially the result of disparate conditions in the labor market. The 9.8% unemployment rate among the Black labor force is nearly double the 5.3% jobless rate among the district’s white labor force.
The district is currently represented by Republican Julia Letlow. Letlow rose to the position in a special election to fill the seat after her husband Luke Letlow passed away from complications due to COVID-19 days before he was to be sworn in for his first term.
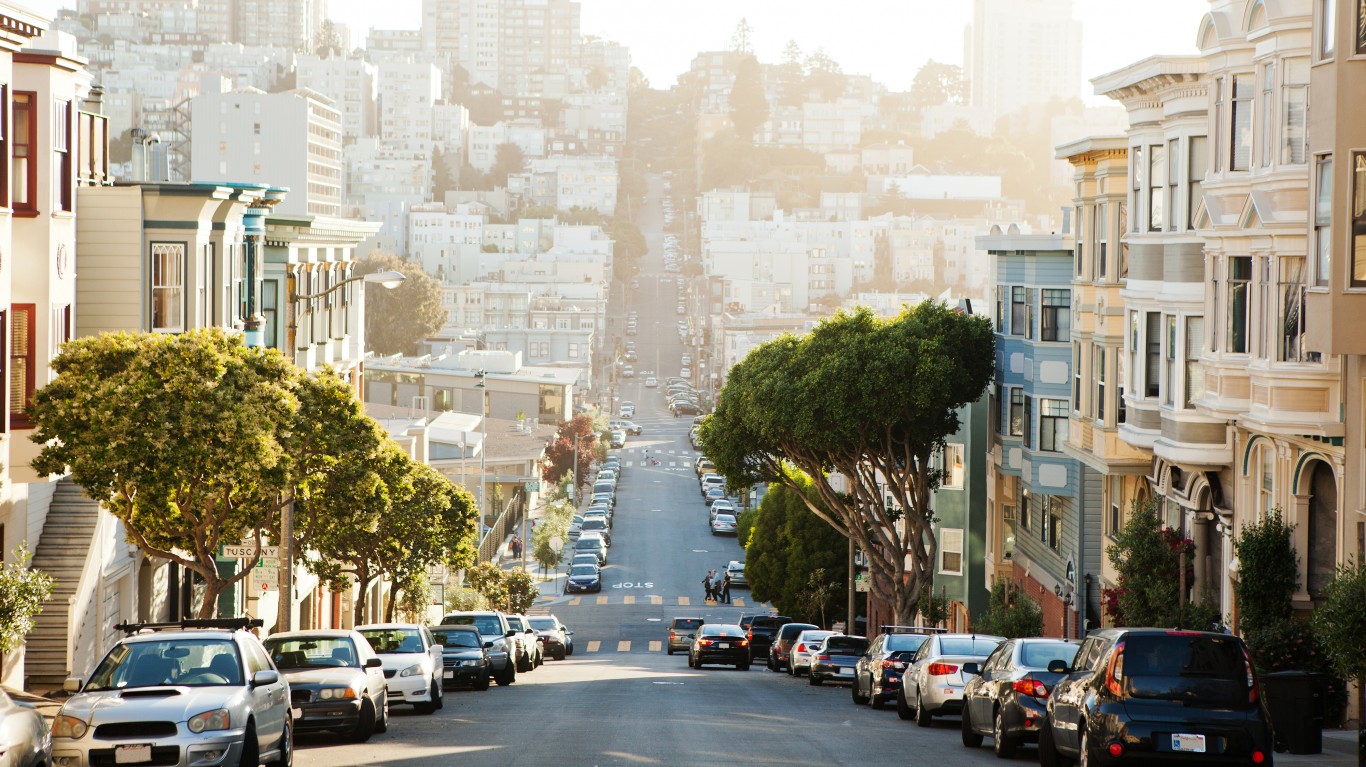
27. California’s 13th Congressional District
> Current representative: Rep. Barbara Lee (D)
> Major city covered by district: Oakland
> Poverty rate: 23.0% Black; 9.3% white
> Unemployment rate: 9.0% Black; 4.3% white
> Homeownership rate: 30.4% Black; 52.4% white
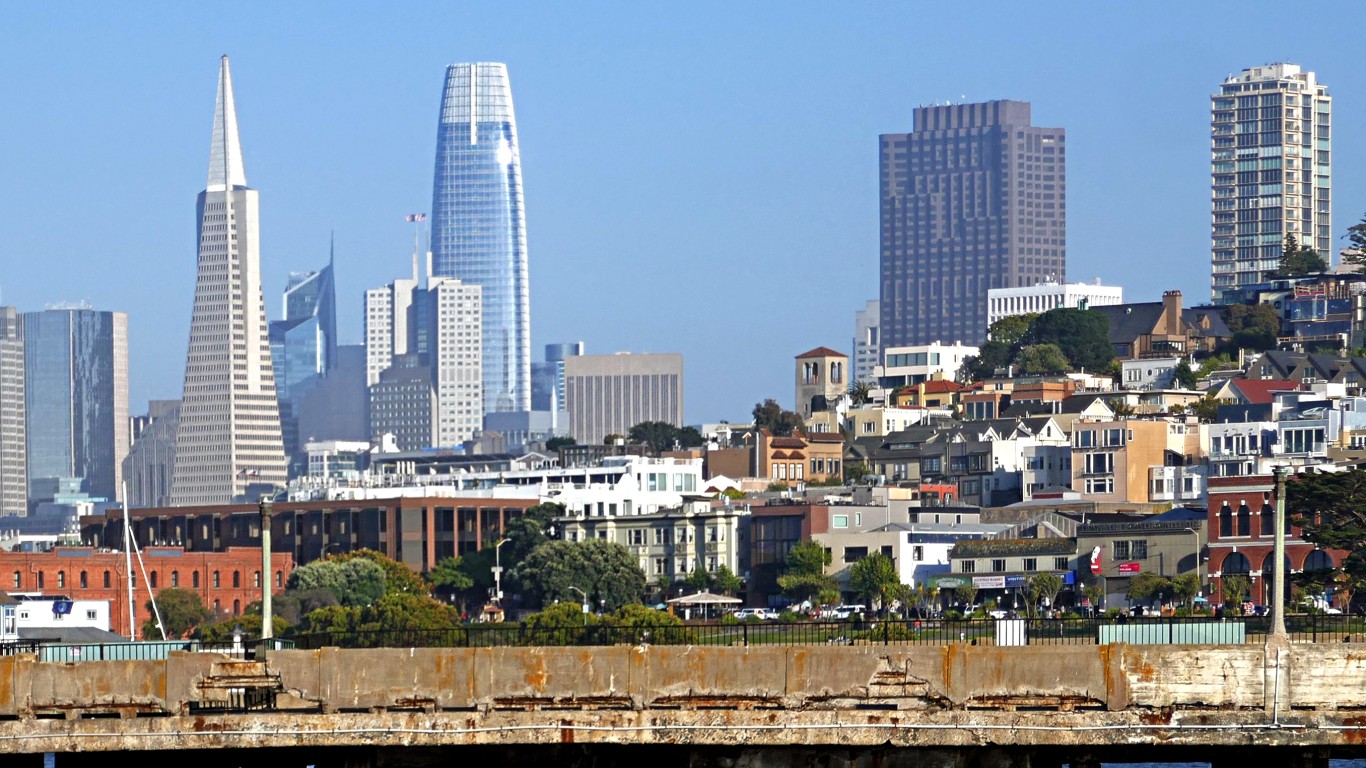
California’s 13th District is the state’s only congressional district to rank on this list. The district is located along the eastern shore of San Francisco Bay and includes the cities of Oakland and Berkeley. The area has a high degree of income inequality, and much of that inequality is apparent along racial lines. Most Black households in the area earn less than $45,000 a year, while most white households earn more than $108,000 annually. Income disparity is partially a product of the area’s racial disparities in employment. At 9.0%, the area’s Black unemployment rate is more than double the 4.3% white jobless rate.
The district is represented by Democrat Barbara Lee, whose career in politics predates her 1998 election to the U.S. Congress. Throughout her career, Lee has worked to advance civil rights, criminal justice reform, and poverty reduction. She is currently the highest ranking African American woman in the House Democratic leadership.
[in-text-ad-2]
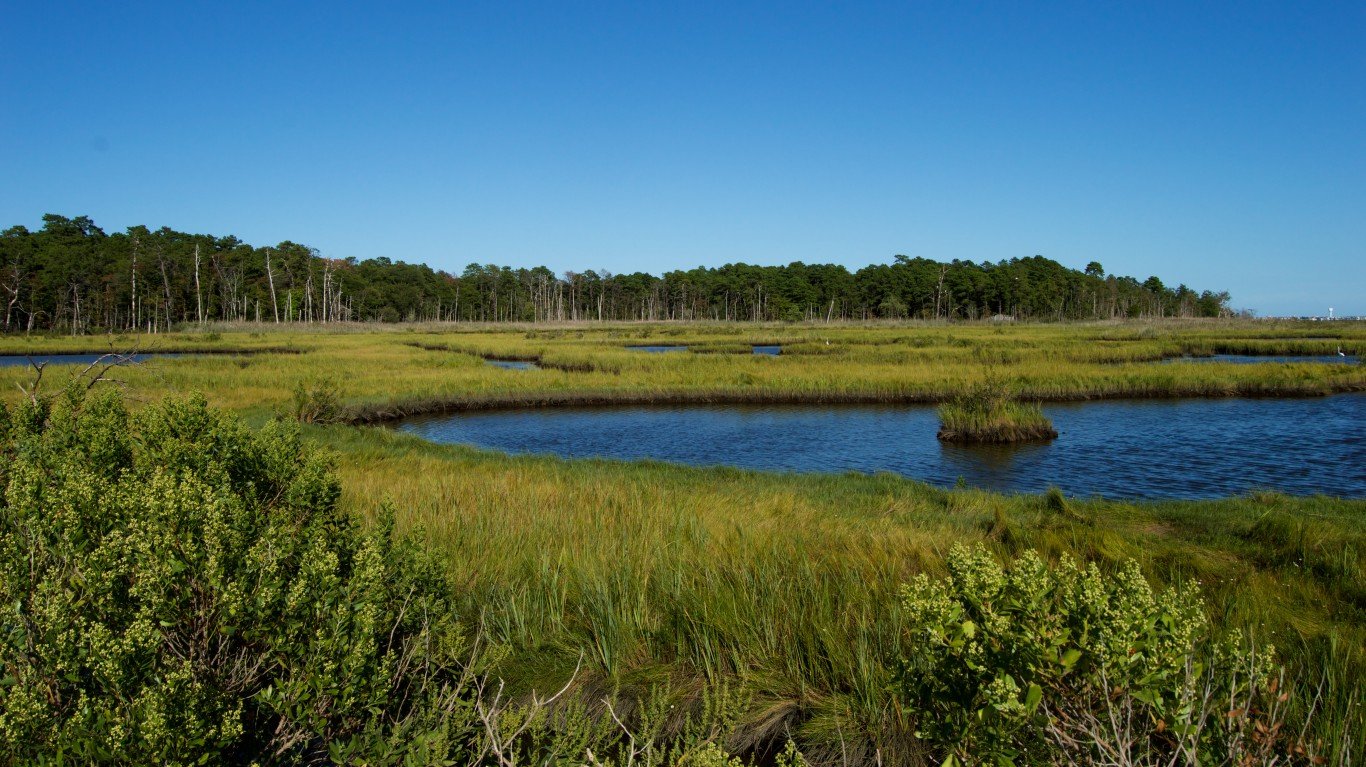
26. New Jersey’s 2nd Congressional District
> Current representative: Rep. Jefferson Van Drew (R)
> Major city covered by district: Atlantic City
> Poverty rate: 23.8% Black; 8.9% white
> Unemployment rate: 12.3% Black; 6.0% white
> Homeownership rate: 43.8% Black; 78.4% white
New Jersey’s 2nd Congressional District covers the southern end of the state and includes Atlantic City and Cape May. The district has some of the worst socioeconomic disparities along racial lines in the country. Black district residents are more than twice as likely as white residents to live below the poverty line and more than twice as likely to be unemployed.
Rep. Jefferson Van Drew currently represents the district in Washington. The former Democrat switched parties in 2020 to support former President Donald Trump and is now a Republican. Van Drew has been in office since 2019.
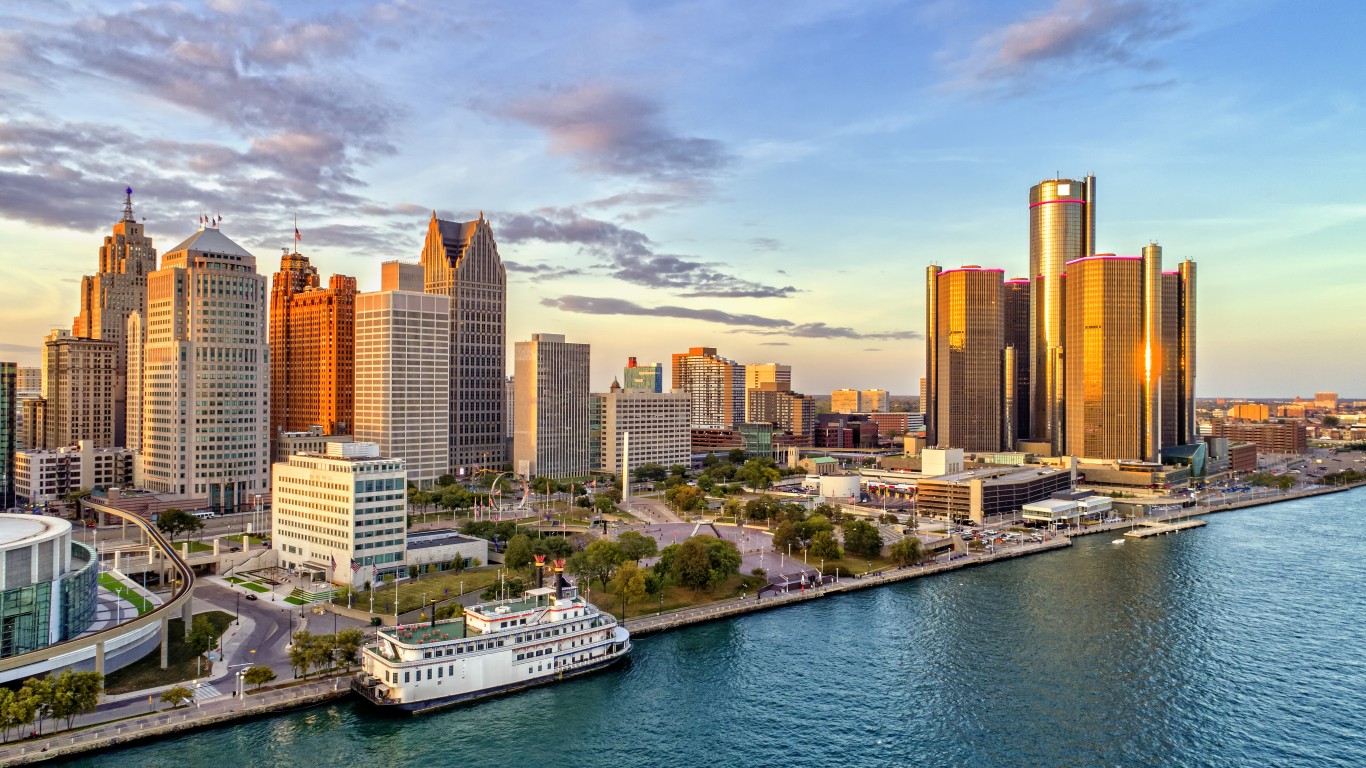
25. Michigan’s 14th Congressional District
> Current representative: Rep. Brenda Lawrence (D)
> Major city covered by district: Detroit
> Poverty rate: 26.0% Black; 14.1% white
> Unemployment rate: 14.4% Black; 4.9% white
> Homeownership rate: 46.2% Black; 70.7% white
Michigan’s 14th Congressional District has some of the worst racial socioeconomic disparities in the United States. Black labor force participants in the area are nearly three times more likely than their white counterparts to be unemployed. These disparities in the labor market likely exacerbate income inequality. The median household income among white households in the area of $67,326 is about $28,000 higher than the median income amone local Black households.
The majority Black district, which covers parts of Detroit and the surrounding area, has been represented in Washington by Detroit native Brenda Lawrence since January 2015. Before being elected to the U.S. Congress Lawrence served as the first African American and the first female mayor of Southfield, Michigan, a city that lies within the 14th District. Lawrence sits on several committees and caucuses, including the House Appropriations Committee and the House Oversight and Reform Committee.
[in-text-ad]
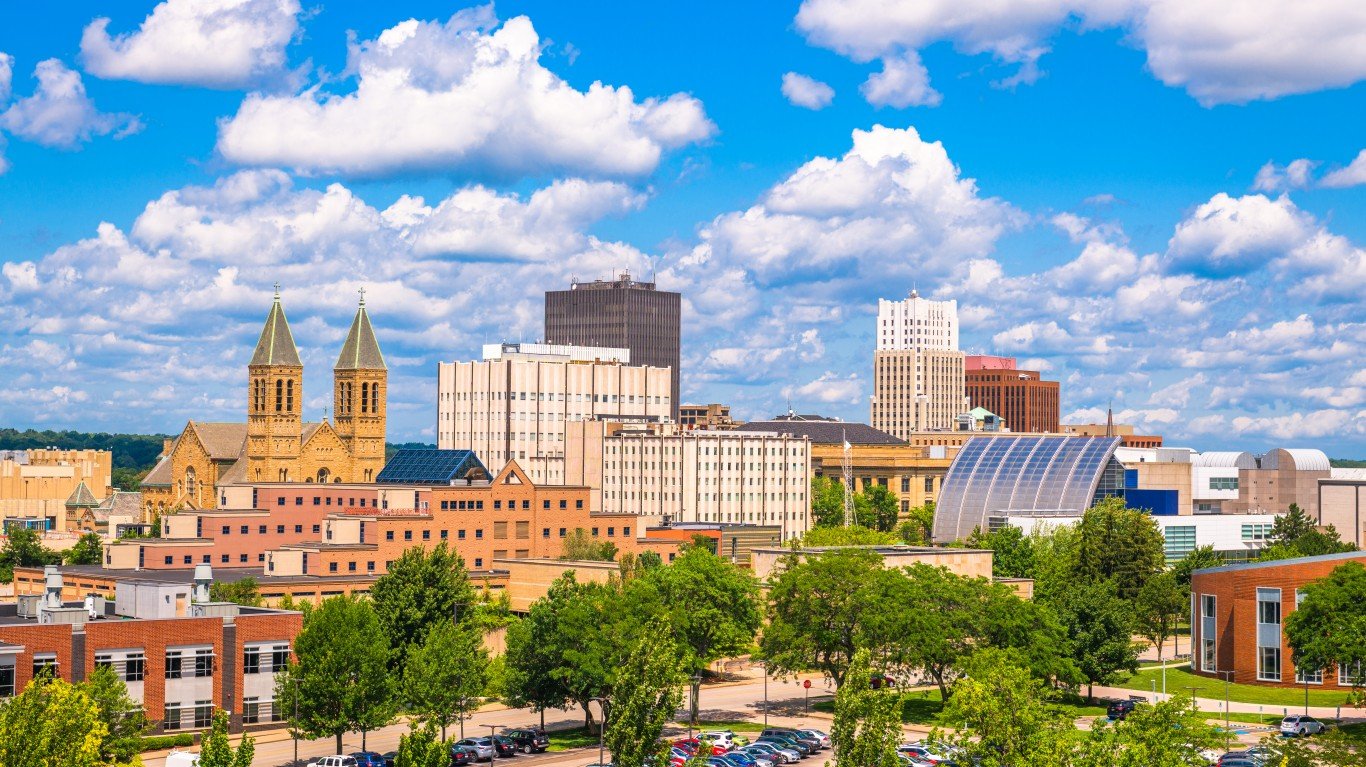
24. Ohio’s 13th Congressional District
> Current representative: Rep. Tim Ryan (D)
> Major city covered by district: Akron
> Poverty rate: 34.8% Black; 14.0% white
> Unemployment rate: 13.2% Black; 5.4% white
> Homeownership rate: 35.6% Black; 68.7% white
Ohio’s 13th Congressional District extends east from Akron to the Pennsylvania border and includes the city of Youngstown. The district is one of many in the Midwest to have significant disparities in key socioeconomic measures between white and Black residents. For example, at 13.2%, the district’s Black unemployment rate is more than double the 5.4% white unemployment rate. Black area residents are also about half as likely to own a home as their white counterparts and are more than twice as likely to live below the poverty line.
Democrat Tim Ryan serves as the district’s congressional representative and is currently in his 10th consecutive term. An Ohio native, Ryan is currently campaigning for the U.S. Senate and has made ending the racial disparities that are prevalent in his district a core campaign promise. His pledges include investing in public schools, universal pre-K, expanding accountability for law enforcement, and protecting voting rights.
[recirclink id=967245]
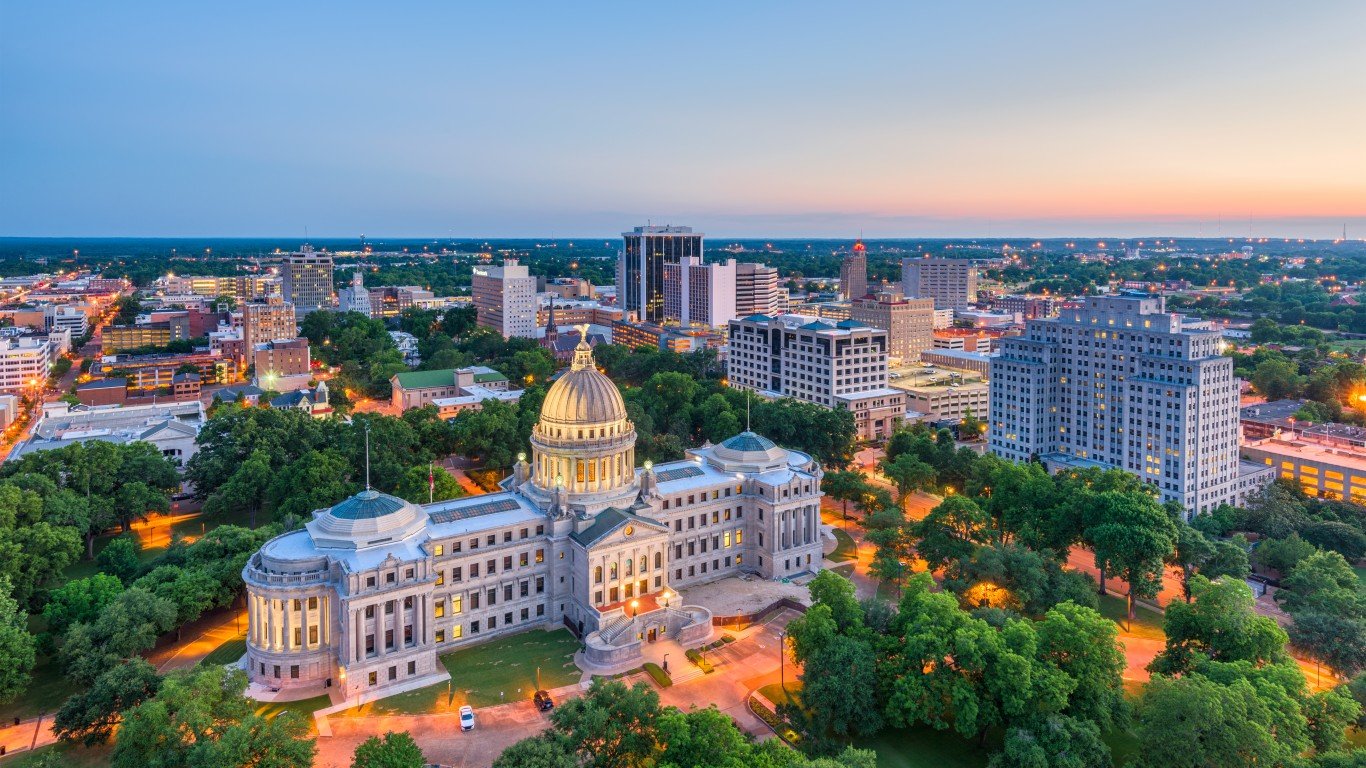
23. Mississippi’s 2nd Congressional District
> Current representative: Rep. Bennie G. Thompson (D)
> Major city covered by district: Jackson
> Poverty rate: 33.7% Black; 12.6% white
> Unemployment rate: 12.9% Black; 4.9% white
> Homeownership rate: 51.4% Black; 79.4% white
Mississippi’s 2nd Congressional District covers much of the state’s western border, large portions of the Delta region, and parts of the city of Jackson, the state capital. It also has the worst disparities in key socioeconomic indicators of any congressional district in the state. Black residents in the area are more than twice as likely to live below the poverty line and more than twice as likely to be unemployed as their white counterparts.
The district is represented by Bennie Thompson, the longest serving African American elected official in Mississippi and the only Democrat in the state’s Congressional Delegation. Thompson has consistently advocated for civil rights throughout his 13 terms in office.
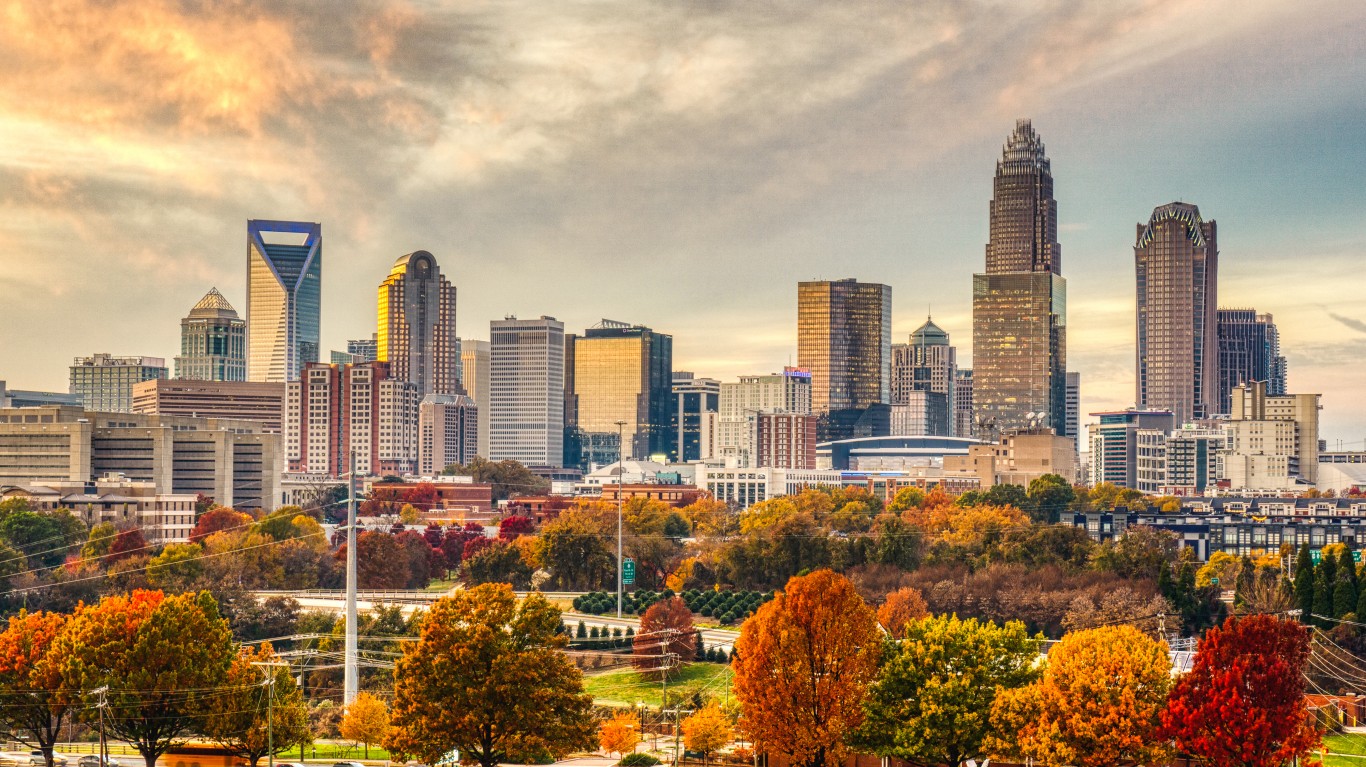
22. North Carolina’s 9th Congressional District
> Current representative: Rep. Dan Bishop (R)
> Major city covered by district: Charlotte
> Poverty rate: 26.8% Black; 9.1% white
> Unemployment rate: 10.2% Black; 3.9% white
> Homeownership rate: 52.0% Black; 78.0% white
North Carolina’s 9th Congressional District, represented by Republican Dan Bishop, has some of the worst inequality along racial lines in the country. The district, which extends eastward from the southeast portion of Charlotte, has a 10.2% Black unemployment rate, well above the 3.9% rate among the white population. The area’s disparities in the labor market exacerbate economic inequality. More than one in every four Black residents of the district live below the poverty line, compared to fewer than one in every 10 white residents.
Bishop, a Charlotte native, has served the district since 2019. Prior to rising to national office, he served in the state legislature, and among other positions advocated for school choice and voter ID laws.
[in-text-ad-2]

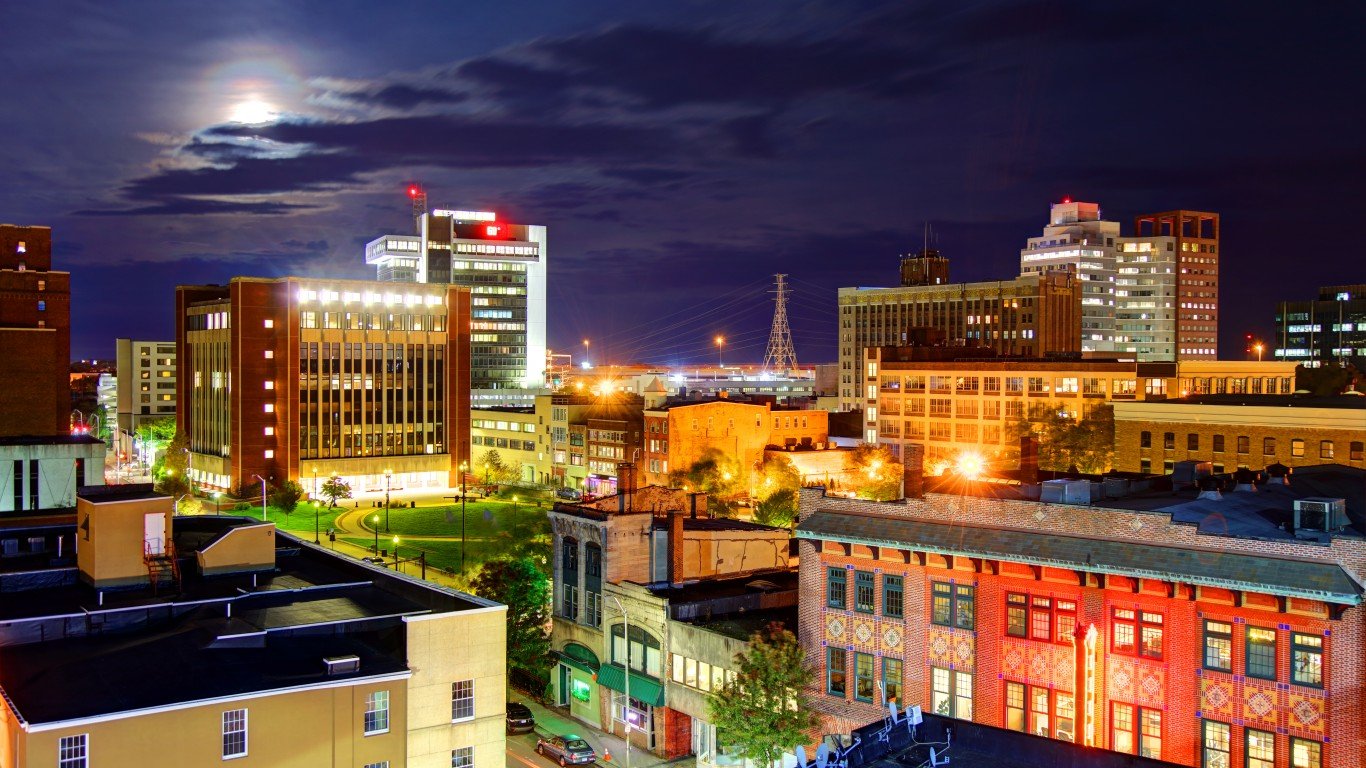
21. Pennsylvania’s 10th Congressional District
> Current representative: Rep. Scott Perry (R)
> Major city covered by district: Harrisburg
> Poverty rate: 24.1% Black; 7.9% white
> Unemployment rate: 10.7% Black; 3.4% white
> Homeownership rate: 32.4% Black; 73.4% white
Pennsylvania’s 10th District, which includes Harrisburg, the state capital, is one of several congressional districts in Pennsylvania to have some of the highest levels of racial socioeconomic inequality in the country. An estimated 24.1% of Black area residents live below the poverty line, a larger share than the 23.0% Black poverty rate nationwide. Meanwhile, the local white poverty rate of 7.9% is considerably lower than the national 11.1% white poverty rate. Homeownership is one of the most practical ways to build wealth in the United States, and in the 10th district, the Black homeownership rate of 32.4% is less than half the 73.4% white homeownership rate.
Pennsylvania native Scott Perry represents the district and serves on the House Committees on Transportation & Infrastructure, and Foreign Affairs. Perry is one of many congressional Republicans who push the false narrative of mass fraud in the 2020 presidential election.
20. Connecticut’s 4th Congressional District
> Current representative: Rep. Jim Himes (D)
> Major city covered by district: Bridgeport
> Poverty rate: 15.0% Black; 6.9% white
> Unemployment rate: 11.4% Black; 5.6% white
> Homeownership rate: 38.4% Black; 72.8% white
Connecticut’s 4th Congressional District, which covers parts of southwestern Connecticut along Long Island Sound, including the cities of Bridgeport and Stamford, is the only district in New England where at least 10% of the population are Black to rank on this list. The typical Black household in the area earns $51,259 per year, less than half the median income of $115,595 among white area households. Black residents in the district are also twice as likely to be unemployed and twice as likely to live below the poverty line as their white counterparts.
The district has been represented by Jim Himes for over a decade. A former Goldman Sachs executive, Himes now serves as the Chair of the Select Committee on Economic Disparity and Fairness in Growth, which was created to address growing wealth inequality in the United States. Himes is also a co-sponsor of the John Lewis Voting Rights Advancement Act, which would allow for federal oversight of state and local voting policies with the stated goal of ensuring equal voting rights. Though it passed in the House, the bill failed to pass in the Senate.
[in-text-ad]
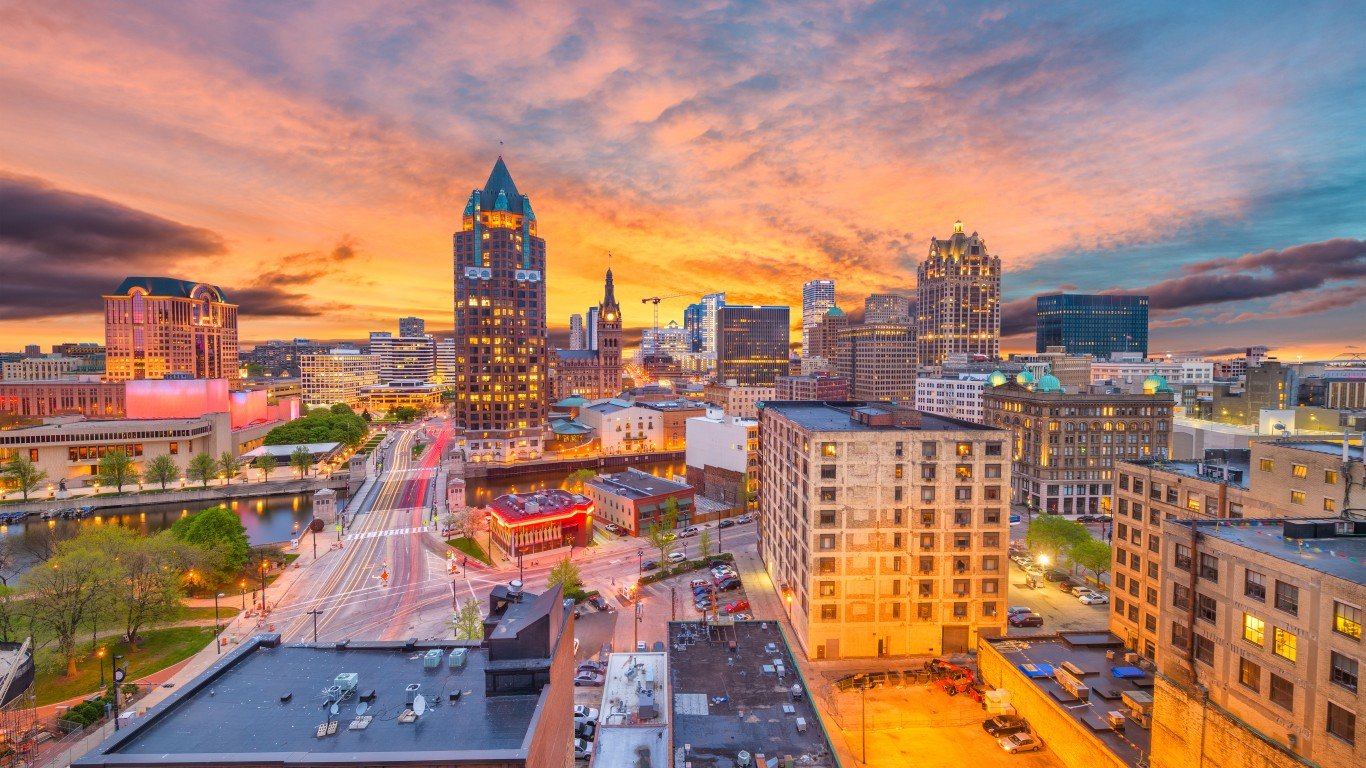
19. Wisconsin’s 4th Congressional District
> Current representative: Rep. Gwen Moore (D)
> Major city covered by district: Milwaukee
> Poverty rate: 32.7% Black; 14.5% white
> Unemployment rate: 10.7% Black; 3.5% white
> Homeownership rate: 27.1% Black; 57.3% white
Wisconsin’s 4th Congressional District is one of many Midwesterm districts with wide socioeconomic gaps along racial lines. Due to discriminatory housing policies in the early part of the 20th century, Milwaukee, located in the 4th district, is one of the most segregated cities in the country. The effects of policies like redlining and other racist housing covenants are still evident in the area. The Black homeownership rate in the district of 27.1% is well below the 57.3% white homeownership rate. Homeownership is one of the most practical ways to build wealth in the United States, and Black Milwaukee area residents are more than twice as likely to live in poverty as white residents.
The district is represented by Gwen Moore, who became the first African American in Wisconsin history to serve in the U.S. House of Representatives when she was sworn in in January 2005. As a congresswoman, Moore has taken up several initiatives to address inequality in minority communities, including pushing for affordable housing, expanding economic opportunities, and fighting discriminatory hiring and predatory lending practices, according to her campaign.
[recirclink id=804448]
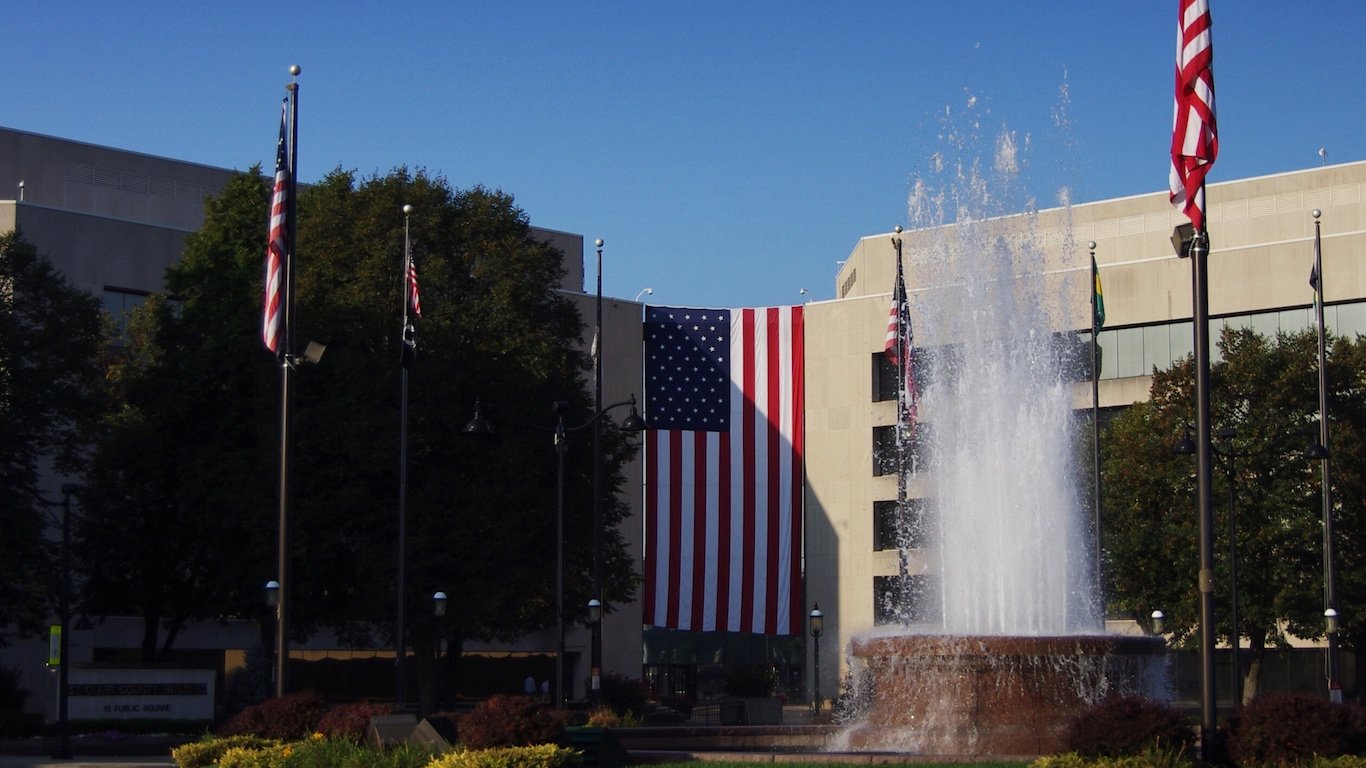
18. Illinois’ 12th Congressional District
> Current representative: Rep. Mike Bost (R)
> Major city covered by district: Belleville
> Poverty rate: 33.1% Black; 12.5% white
> Unemployment rate: 13.6% Black; 5.4% white
> Homeownership rate: 37.8% Black; 73.8% white
Black residents of the 12th Congressional District in Illinois are more than twice as likely as their white counterparts to be unemployed. The consequences of the disparities in employment are equally stark. Most Black households in the area earn less than $30,000 a year, while the median income among white households is about $56,000 annually.
The district, which covers much of southwestern Illinois, has been represented by Republican Mike Bost since January 2015. Bost’s reelection campaign addresses issues related to a range of issues, including national defense, border security, energy independence, and reduced government spending.
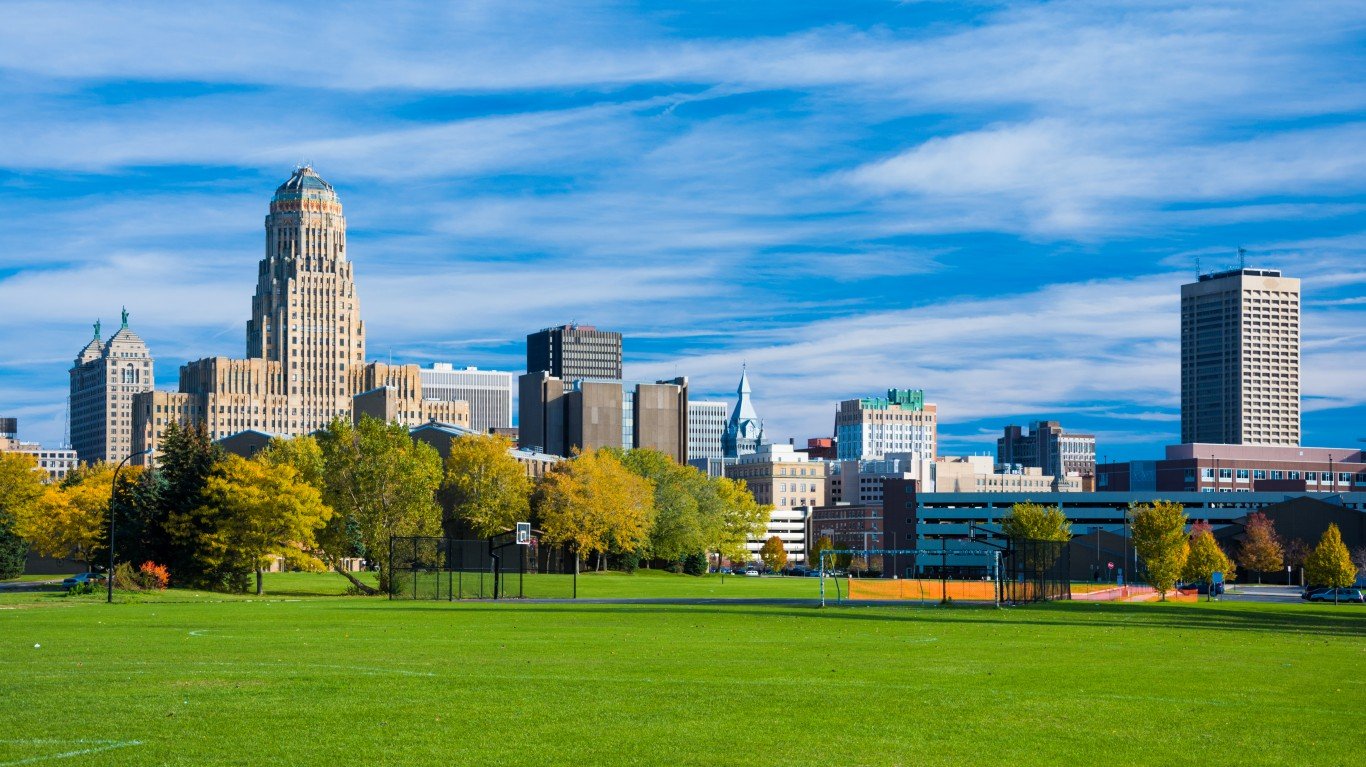
17. New York’s 26th Congressional District
> Current representative: Rep. Brian Higgins (D)
> Major city covered by district: Buffalo
> Poverty rate: 32.7% Black; 11.6% white
> Unemployment rate: 10.1% Black; 3.7% white
> Homeownership rate: 32.5% Black; 67.8% white
New York’s 26th Congressional District is a majority white district with the worst racial inequality in the state. The district covers a portion of New York’s western border and includes Buffalo, the most populous city in the state after New York City. Black district residents are nearly three times more likely than white residents to live below the poverty line, partially due to disparities in the labor market. The local Black unemployment rate of 10.1% is more than double the 3.7% white jobless rate.
The district is represented by Democrat Brian Higgins, who has served in the House since 2005. As a congressional representative, Higgins has brought millions of federal dollars for the development of Buffalo, including block grant funds for investing in economically distressed neighborhoods and providing incentives for homeownership in underserved communities.
[in-text-ad-2]
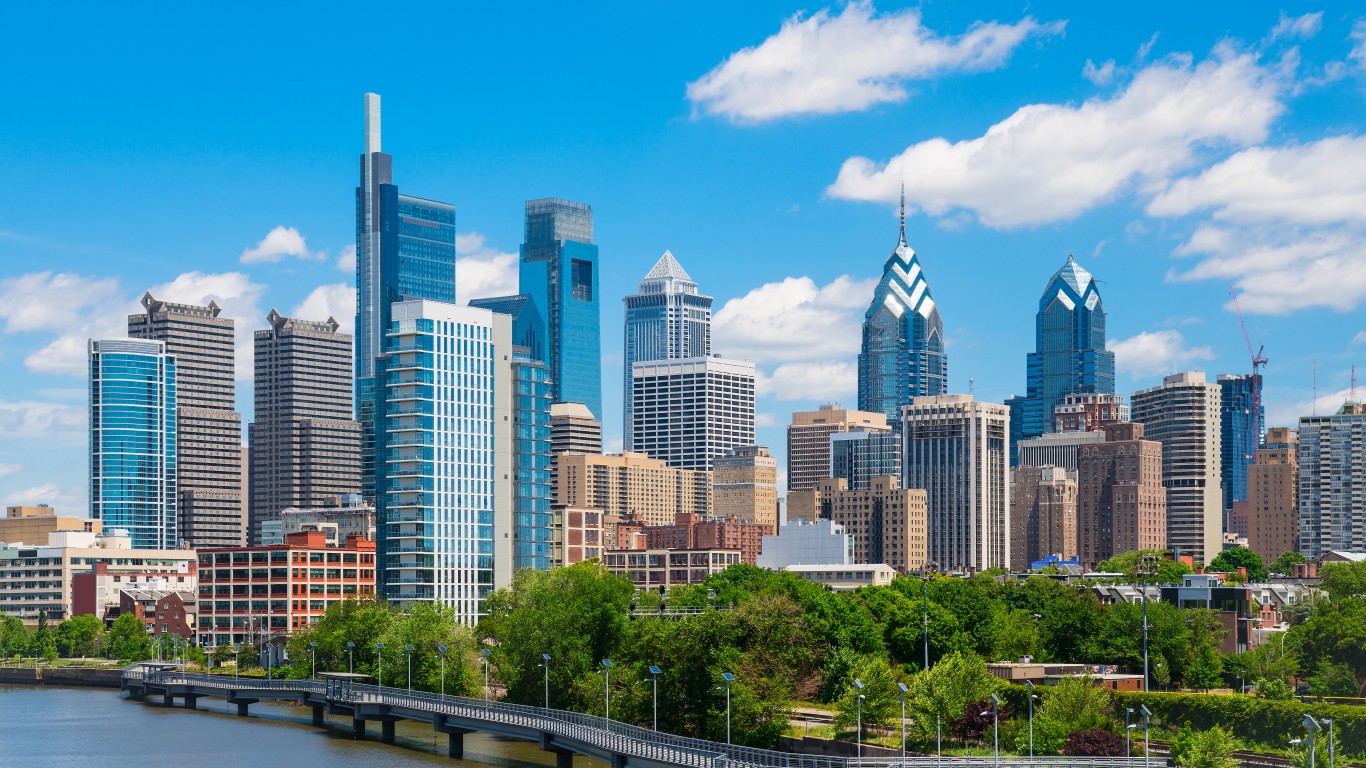
16. Pennsylvania’s 3rd Congressional District
> Current representative: Rep. Dwight Evans (D)
> Major city covered by district: Philadelphia
> Poverty rate: 29.8% Black; 13.9% white
> Unemployment rate: 12.6% Black; 3.7% white
> Homeownership rate: 50.3% Black; 48.2% white
The 3rd Congressional District in Pennsylvania is a majority Black district that covers much of Philadelphia. The typical Black area household earns just $33,000 a year, less than half the median income of about $78,400 among white area households. Black residents are also more than three times as likely to be unemployed as white residents. Unlike most districts on this list, however, the local Black homeownership rate is slightly higher than it is among white residents.
A heavily Democratic district, Pennsylvania’s 3rd is currently represented by Democrat Dwight Evans. His recent initiatives in Congress include criminal justice reform and economic development. He is currently campaigning on issues of urban development and affordable housing.
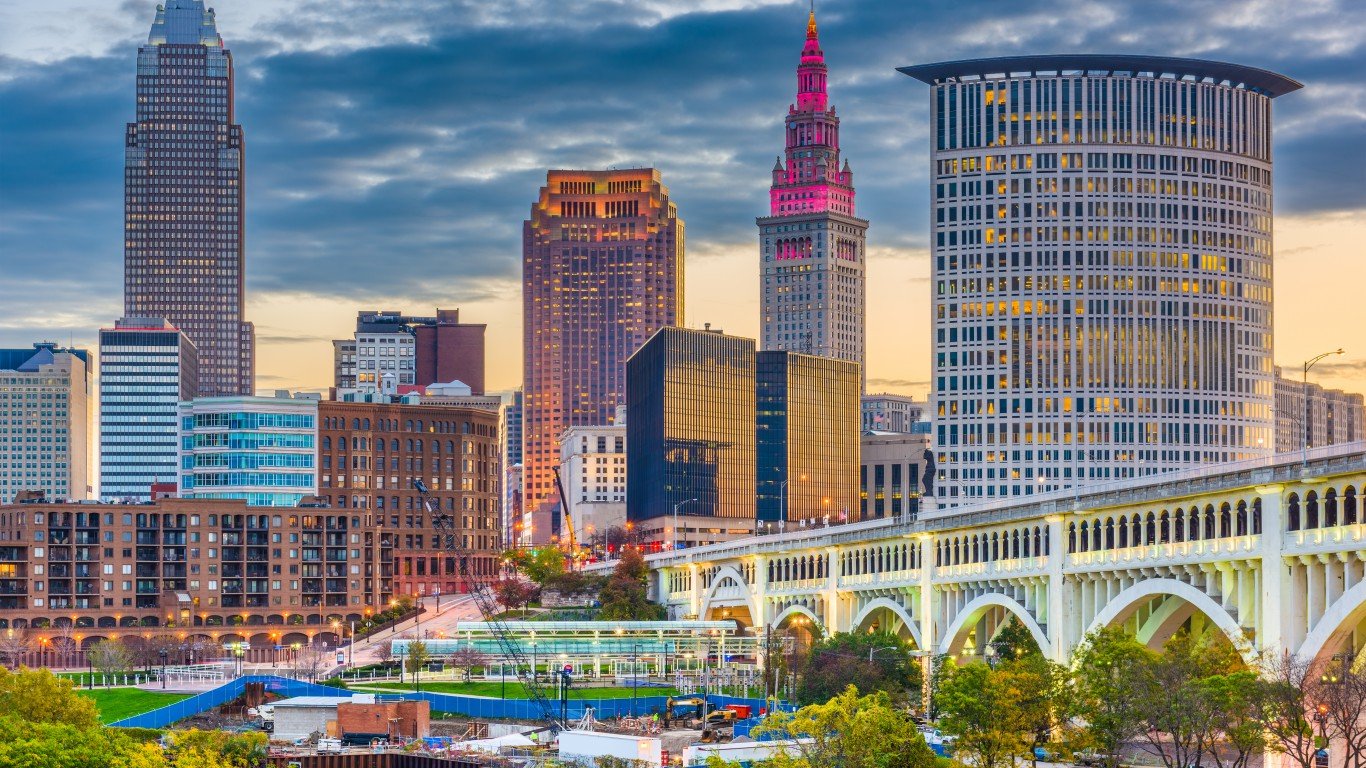
15. Ohio’s 11th Congressional District
> Current representative: Rep. Shontel M. Brown (D)
> Major city covered by district: Cleveland
> Poverty rate: 32.0% Black; 15.0% white
> Unemployment rate: 14.6% Black; 5.4% white
> Homeownership rate: 37.6% Black; 63.9% white
Many of the congressional districts with the worst racial inequality are located in and around legacy cities in the Midwest — and Ohio’s 11th Congressional District, which covers Cleveland, is one of them. Due in large part to the legacy of redlining and other racist housing practices, racial inequality is profound in Cleveland. Across the district, the median income among Black households is just $30,052, compared to $57,704 among white households. Additionally, the Black poverty rate of 32.0% is more than double the 15.0% white poverty rate.
The district is represented in Washington by Democratic Cleveland native Shontel Brown. At the end of 2021, Brown was responsible for bringing $2.7 million in federal funding to Cleveland State University that will be used to help improve outcomes for students facing challenges, including poverty, homelessness, and racism. Her current campaign is emphasizing a list of priorities that includes strengthening civil rights laws, advancing criminal justice reform, an expansion of education and economic opportunities, and reducing poverty.
[in-text-ad]
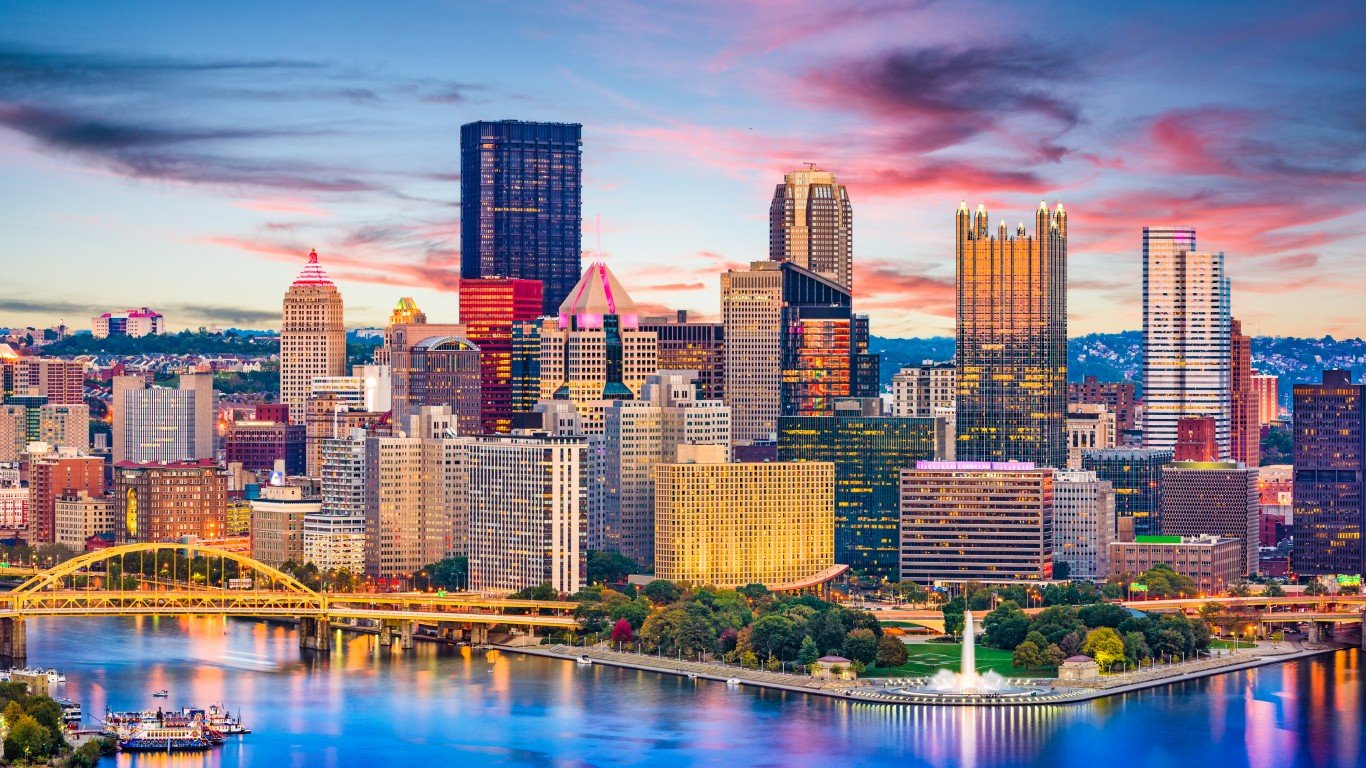
14. Pennsylvania’s 18th Congressional District
> Current representative: Rep. Michael Doyle (D)
> Major city covered by district: Pittsburgh
> Poverty rate: 30.4% Black; 10.4% white
> Unemployment rate: 11.6% Black; 4.2% white
> Homeownership rate: 30.4% Black; 66.5% white
The 18th Congressional District in Pennsylvania, which includes Pittsburgh, has a Black poverty rate of 30.4% – nearly three times the 10.4% white poverty rate. The income disparity is partially attributable to disparities in the labor market. The area’s 11.6% Black unemployment rate is more than double the 4.2% jobless rate among the local white population.
District representative Mike Doyle has listed addressing racial disparities in the United States as a priority in his current term in office. His racial justice agenda includes strengthening anti-descrimination laws and addressing structural racism by supporting criminal justice reform, closing gaps in health care, and bringing in federal dollars to struggling communities and minority-owned businesses.
[recirclink id=840983]
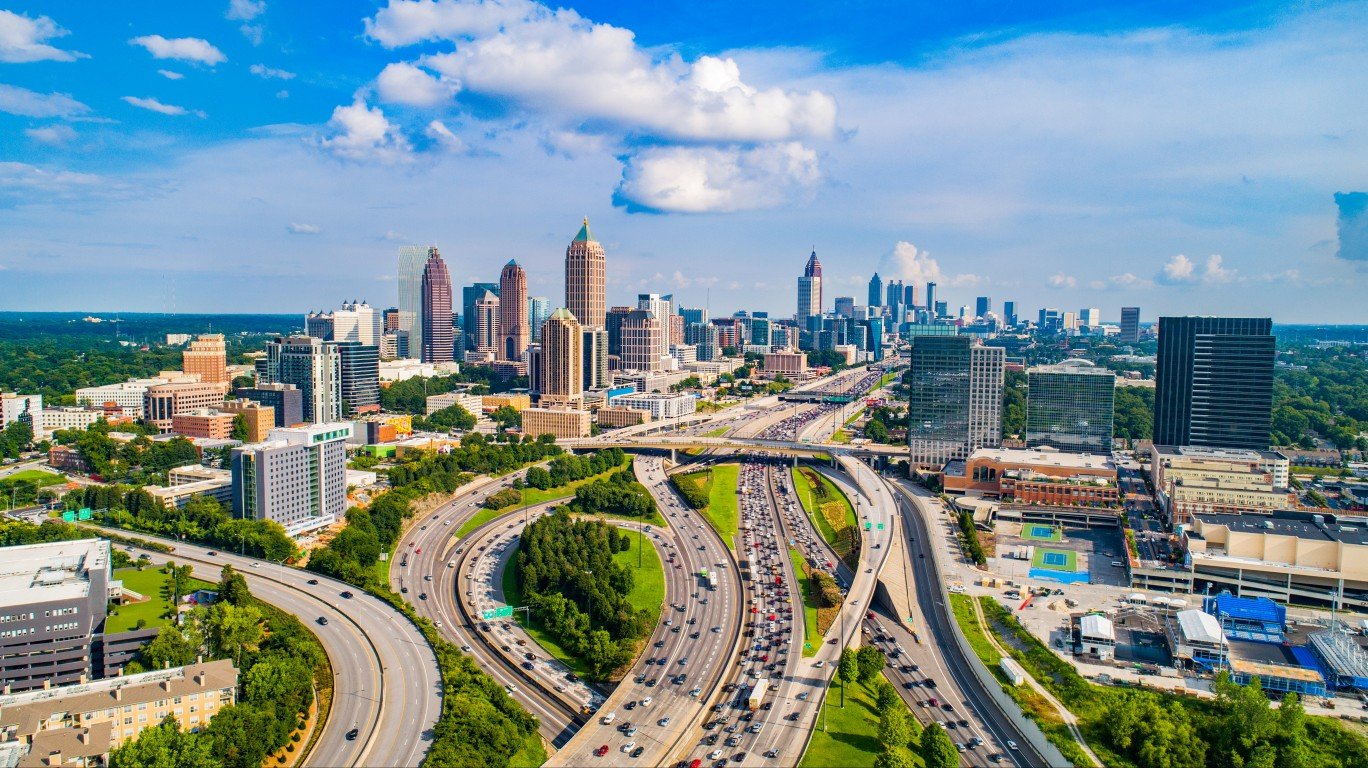
13. Georgia’s 5th Congressional District
> Current representative: Rep. Nikema Williams (D)
> Major city covered by district: Atlanta
> Poverty rate: 25.6% Black; 10.4% white
> Unemployment rate: 10.0% Black; 2.8% white
> Homeownership rate: 37.0% Black; 56.0% white
The 5th Congressional District in Georgia is a majority Black district covering most of the city of Atlanta. Inequality along racial lines in the area are especially pronounced in several economic measures. For example, the typical Black household earns $38,725 a year, less than the national median of $41,935 among Black households. Meanwhile, the typical white household in the district earns $90,069 a year, far more than the $66,536 typical white household earns nationwide. Additionally, the Black unemployment rate in the district of 10.0% is more than three times the 2.8% white poverty rate.
Served by the late Congressman John Lewis, a stalwart Democrat, from 1987 until his death in 2020, Georgia’s 5th is now represented in Washington by Democrat Nikema Williams, for whom social justice is a political priority. Williams campaign platform includes support for the John Lewis Voting Rights Act, a piece of legislation aimed at voter protections and named for her predecessor, criminal justice and police reform, and access to quality education.
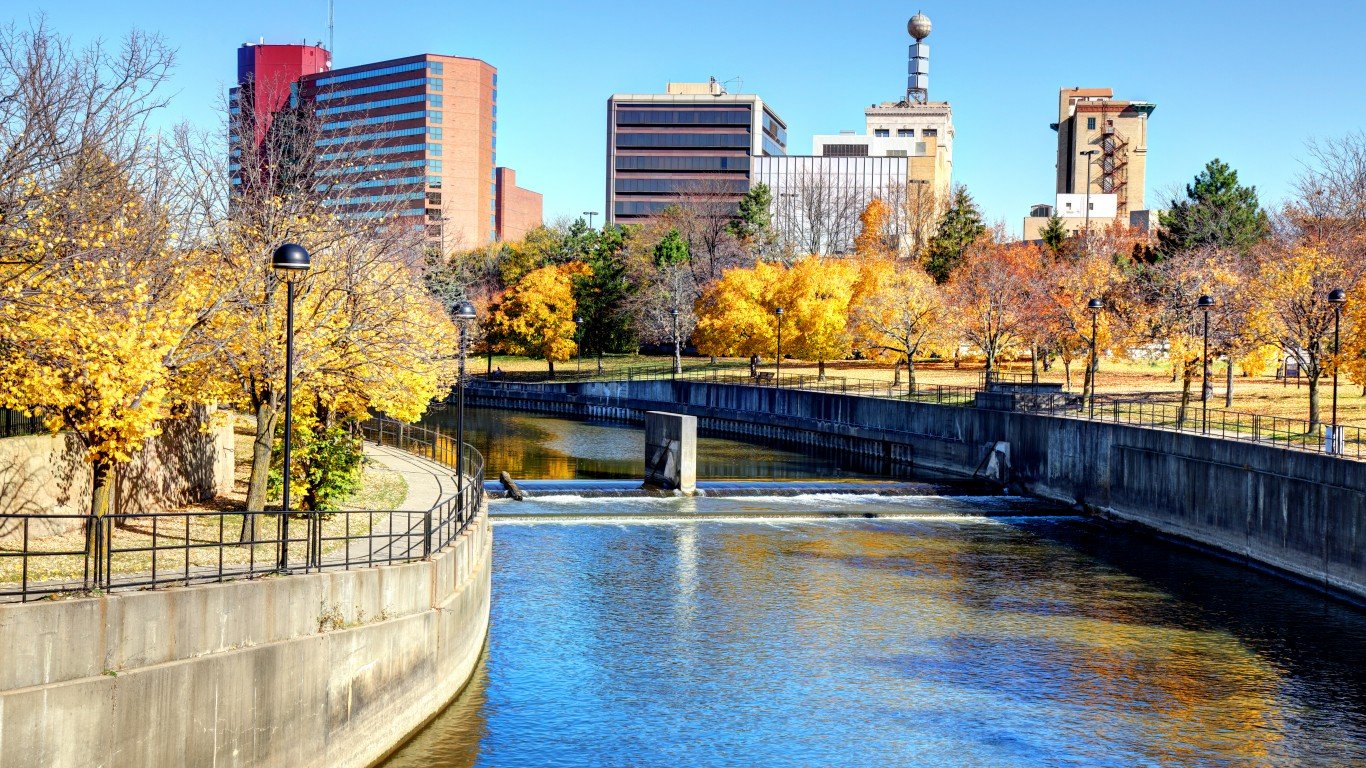
12. Michigan’s 5th Congressional District
> Current representative: Rep. Daniel Kildee (D)
> Major city covered by district: Flint
> Poverty rate: 36.2% Black; 14.7% white
> Unemployment rate: 19.3% Black; 6.4% white
> Homeownership rate: 47.1% Black; 76.7% white
Michigan’s 5th Congressional District, which includes the long beleaguered city of Flint, is home to some of the most economically troubled places in the United States — and the burden is disproportionately shouldered by Black residents. Nearly one in every five Black labor force participants are unemployed, compared to about one in every 16 white labor force participants. Meanwhile, the 36.2% Black poverty rate is more than double the 14.7% poverty rate among white area residents.
The district is currently represented by Democratic Flint native Daniel Kildee. Kildee has been in office for nearly a decade. His initiatives include support for universal pre-K and after school programs and combating urban blight and income inequality.
[in-text-ad-2]
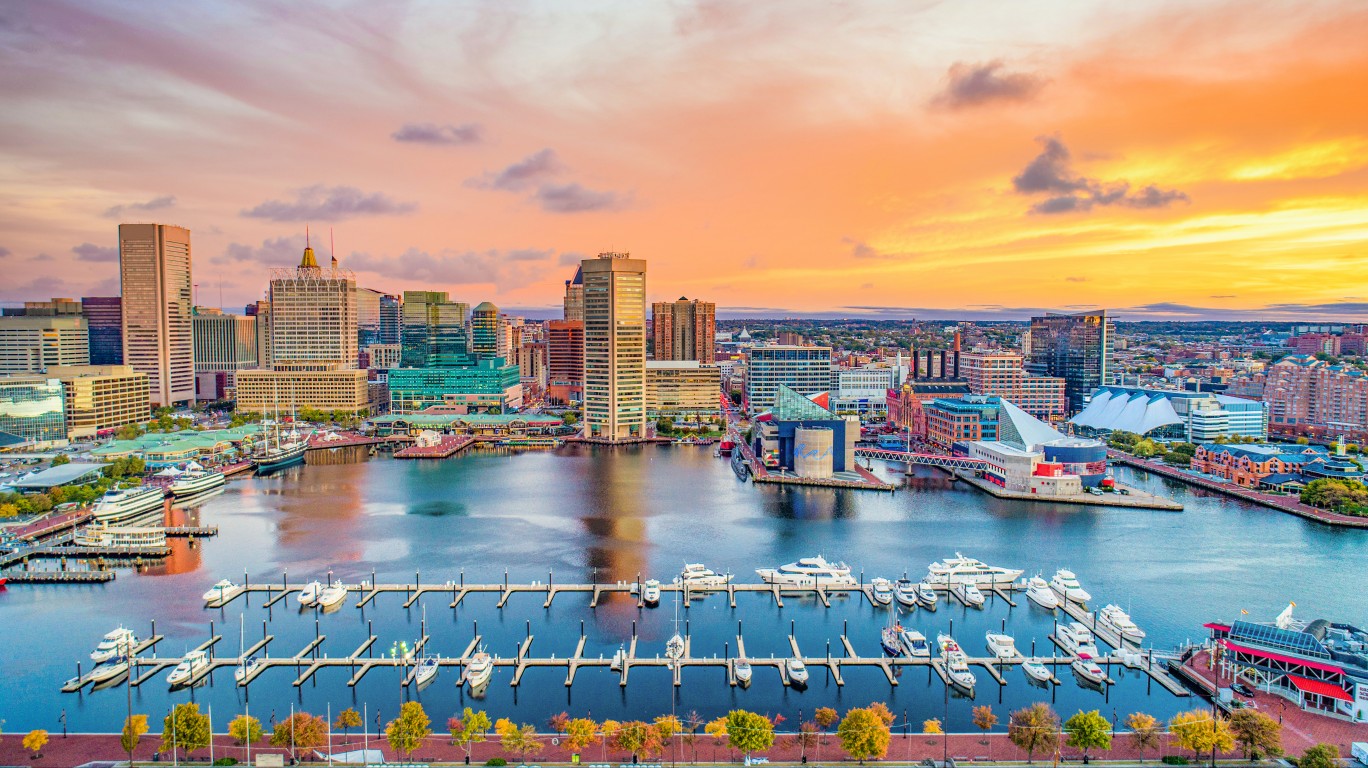
11. Maryland’s 7th Congressional District
> Current representative: Rep. Kweisi Mfume (D)
> Major city covered by district: Baltimore
> Poverty rate: 22.8% Black; 7.2% white
> Unemployment rate: 10.3% Black; 3.7% white
> Homeownership rate: 46.1% Black; 72.8% white
Maryland’s 7th Congressional District, which includes much of the city of Baltimore, has the worst racial socioeconomic disparity in the state and some of the worst nationwide. Most Black households in the majority Black district earn less than $45,000 a year, while most white households earn well over $100,000. The district’s income inequality along racial lines appears to be attributable in part to disparities in the labor market. The area’s Black unemployment rate stands at 10.3%, more than double the 3.7% white jobless rate.
The district is represented by a Baltimore native, Democratic Congressman Kweisi Mfume. Former Chairman of the Congressional Black Caucus, Mfume’s campaign priorities include improving the quality of public school education, raising the minimum wage, and fighting crime.
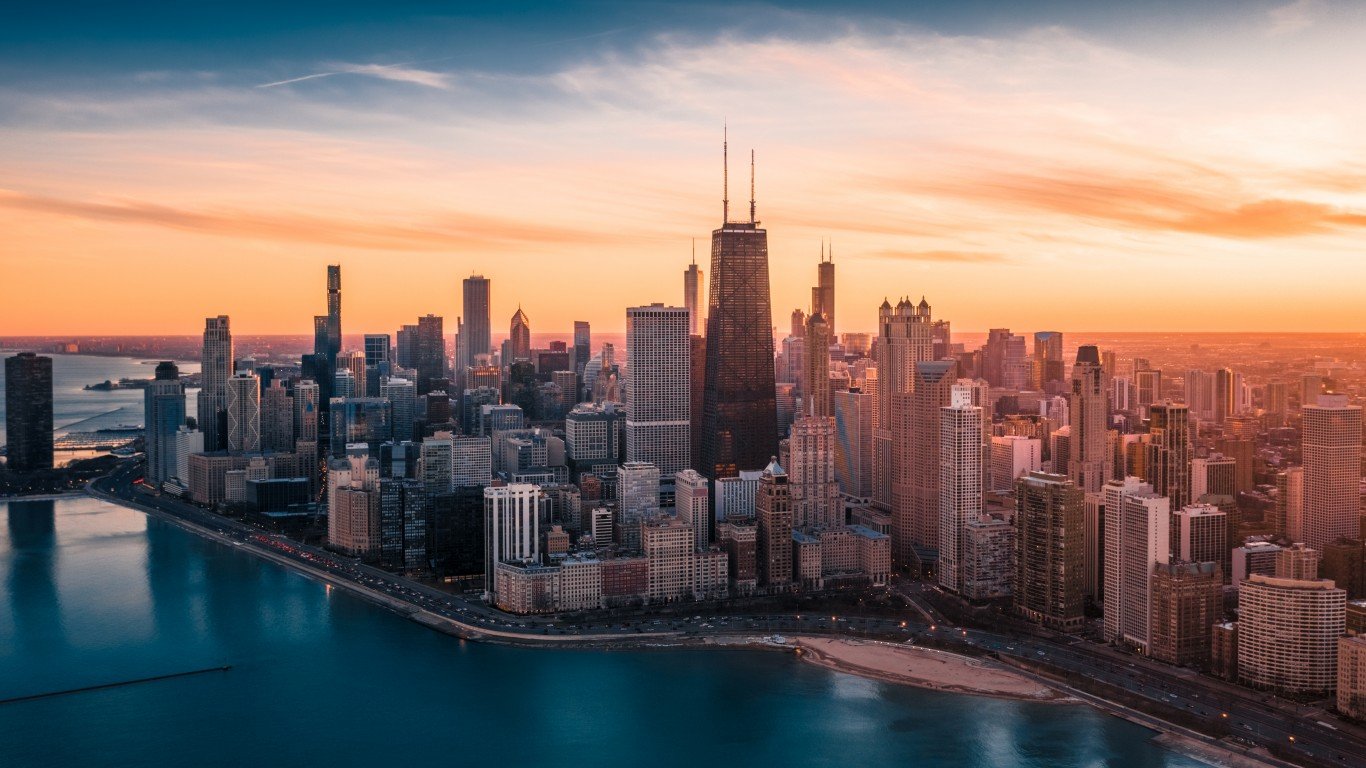
10. Illinois’ 1st Congressional District
> Current representative: Rep. Bobby L. Rush (D)
> Major city covered by district: Chicago
> Poverty rate: 24.9% Black; 7.9% white
> Unemployment rate: 16.4% Black; 5.0% white
> Homeownership rate: 43.7% Black; 81.5% white
Black unemployment in Illinois’ 1st Congressional District stands at 16.4% – well above the 9.5% national Black jobless rate and more than three times the local white unemployment rate of 5.0%. Disparities in the labor market carry over to disparities in other economic measures. For example, the typical Black household in the area earns just $38,494 a year, compared to the median income of $79,652 among white households in the area.
The majority Black district covers much of the South Side of Chicago and has been represented in Congress by Democrat Bobby Rush for nearly three decades. A former member of the Black Panthers, Rush’s political career has been largely defined by his focus on civil rights and racial justice, both in his district and nationwide. Earlier this year, the 75-year-old Rush announced that he will not seek a 16th term in Congress.
[in-text-ad]
9. Ohio’s 9th Congressional District
> Current representative: Rep. Marcy Kaptur (D)
> Major city covered by district: Cleveland
> Poverty rate: 37.4% Black; 14.6% white
> Unemployment rate: 14.5% Black; 6.0% white
> Homeownership rate: 29.5% Black; 65.8% white
The 9th Congressional District in Ohio has one of the highest Black poverty rates in the United States. An estimated 37.4% of the local Black population live below the poverty line. Meanwhile, the local white poverty rate is below 15%. The typical Black area household earns $27,000 a year, about $24,000 less than the median income among white households, and the Black unemployment rate of 14.5% is more than double the 6.0% white jobless rate.
The district covers parts of Cleveland and extends west along the shore of Lake Erie to Toledo and is represented on Capitol Hill by Democrat Marcy Kaptur. Kaptur’s political priorities include revitalizing the American middle class and campaign finance reform. Kaptur is the longest serving woman in the history of the U.S. House of Representatives.
[recirclink id=966311]
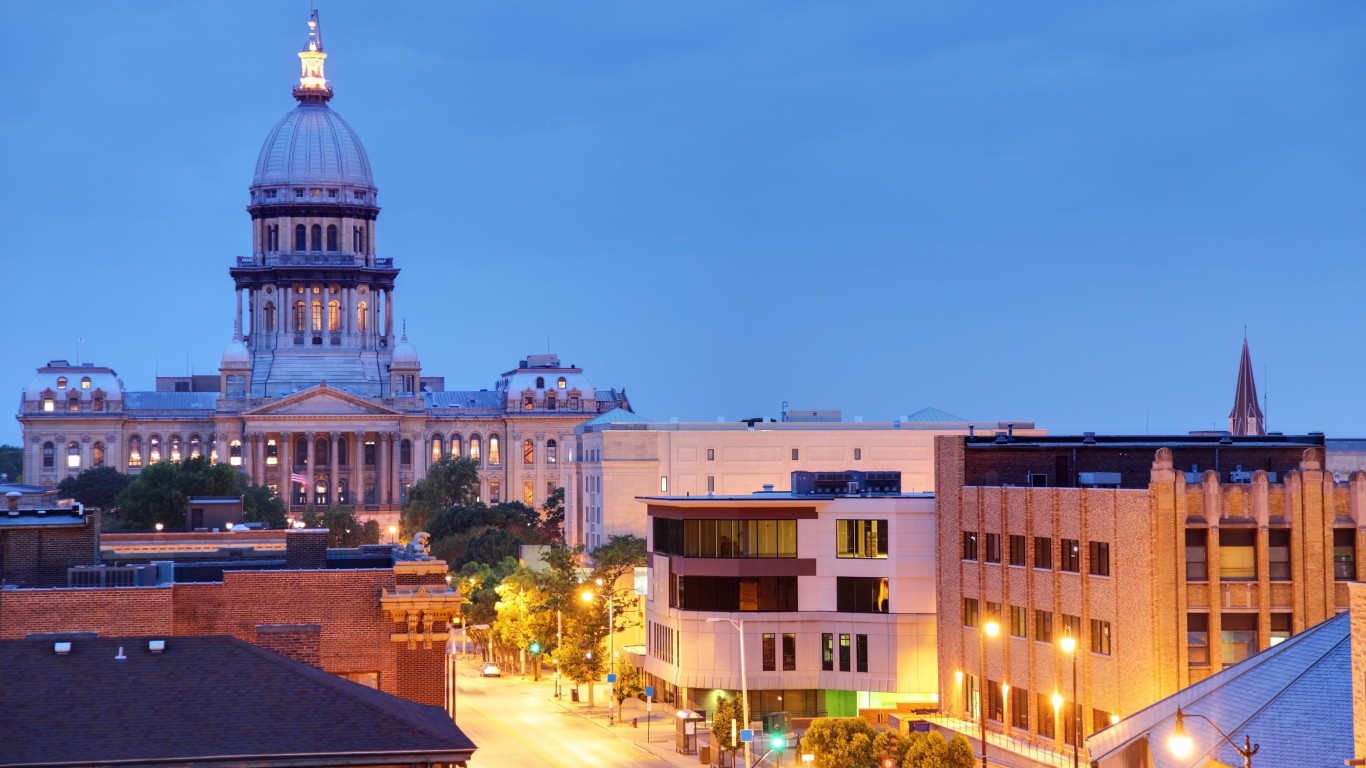
8. Illinois’ 13th Congressional District
> Current representative: Rep. Rodney Davis (R)
> Major city covered by district: Springfield
> Poverty rate: 35.5% Black; 14.5% white
> Unemployment rate: 12.6% Black; 4.6% white
> Homeownership rate: 27.8% Black; 70.3% white
Of the 10 worst congressional districts for Black Americans nationwide, four are in Illinois – and the state’s 13th Congressional District is among them. More than one in every three Black residents live below the poverty line, and the area’s Black unemployment rate stands at 12.6%. Meanwhile, the white poverty rate is below 15%, and white unemployment is below 5%.
The district, which covers parts of Springfield and Champaign, has sent Republican Rodney Davis to Capitol Hill as its representative since 2013. Hill’s political priorities include veteran support, infrastructure investment, support for law enforcement, and job creation.
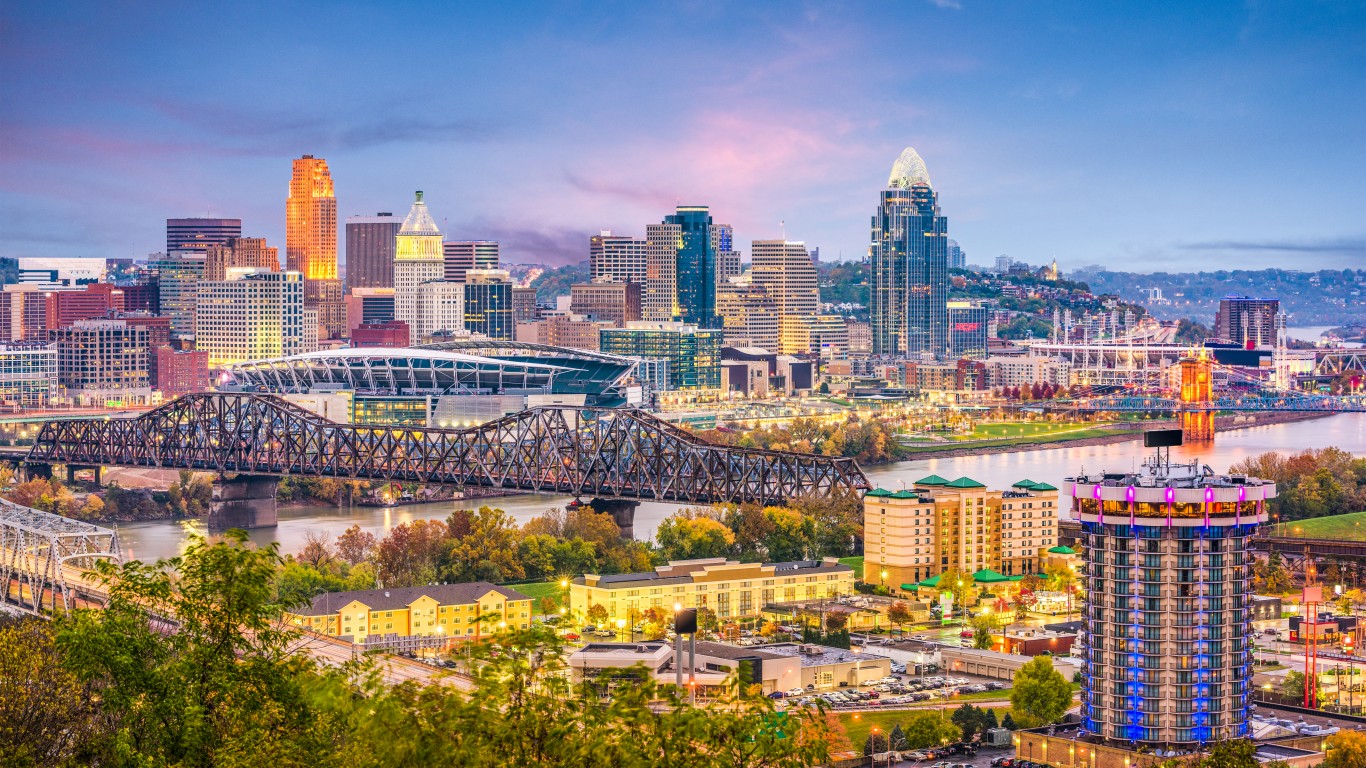
7. Ohio’s 1st Congressional District
> Current representative: Rep. Steve Chabot (R)
> Major city covered by district: Cincinnati
> Poverty rate: 31.2% Black; 9.0% white
> Unemployment rate: 11.2% Black; 3.8% white
> Homeownership rate: 30.5% Black; 72.3% white
Ohio’s 1st Congressional District, which includes parts of Cincinnati, has the worst racial socioeconomic disparity in the state and some of the worst nationwide. At 11.2%, Black unemployment in the area exceeds the 9.5% national Black unemployment rate. Meanwhile, the local white unemployment rate of 3.8% is below the 4.5% national white unemployment rate. These disparities in the labor market carry over to disparities in other economic measures. For example, the typical Black household in the area earns just $33,355 a year, compared to the median income of $72,200 among white households in the area.
The district has been represented by Republican Steve Chabot, a Cincinnati native, for 24 years.
[in-text-ad-2]
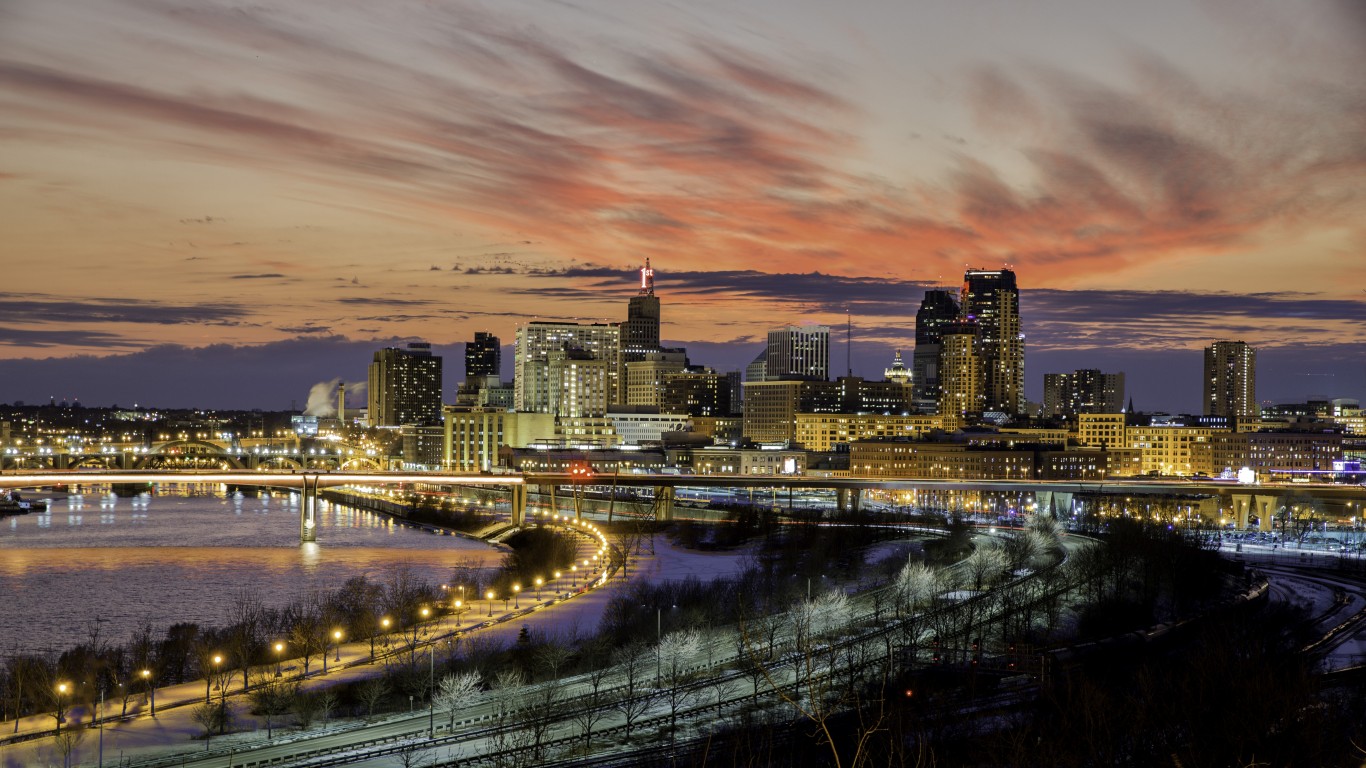
6. Minnesota’s 4th Congressional District
> Current representative: Rep. Betty McCollum (D)
> Major city covered by district: St. Paul
> Poverty rate: 29.1% Black; 6.9% white
> Unemployment rate: 8.2% Black; 3.1% white
> Homeownership rate: 23.8% Black; 71.6% white
Minnesota’s 4th Congressional District is one of two districts in the state to rank among the worst in the country for Black Americans. Though the local Black unemployment rate of 8.2% is below the 9.5% jobless rate among the Black labor force, it is more than double the local white unemployment rate of 3.1%. As is the case in much of the Midwest, contemporary disparities – particularly in housing – are attributable in part to historical policies, such as redlining and racist housing covenants that excluded Black residents. In the district, the Black homeownership rate stands at 23.8%, a fraction of the 71.6% homeownership rate among white residents.
Democrat Betty McCollum represents the district on Capitol Hill. McCollum’s policy priorities include social justice initiatives that fight civil rights abuses.
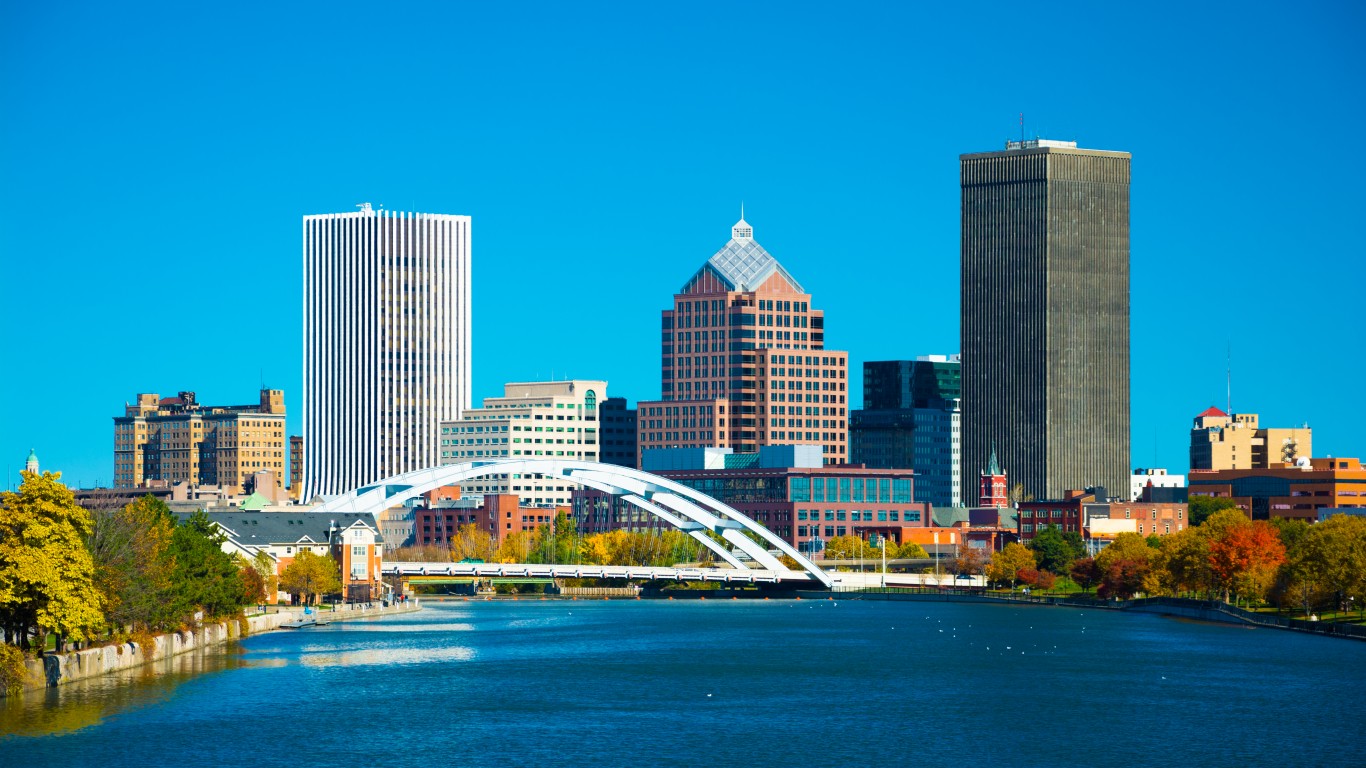
5. New York’s 25th Congressional District
> Current representative: Rep. Joseph Morelle (D)
> Major city covered by district: Rochester
> Poverty rate: 32.6% Black; 9.9% white
> Unemployment rate: 12.6% Black; 4.2% white
> Homeownership rate: 31.7% Black; 70.3% white
The 25th Congressional District in New York, which includes the city of Rochester, has the worst racial disparities in the state and some of the worst nationwide. Only 78.3% of Black area adults have a high school diploma, compared to 93.2% of white adults in the district. Segregation leads to disparate outcomes, and Rochester city schools are highly segregated, as only 10% of students in the school district are white, a disproportionately low share.
Education is closely linked to income, and about one in every three Black district residents live below the poverty line, compared to about one in every 10 white residents. The district’s seat is currently held by Rep. Joseph Morelle, a Democrat.
[in-text-ad]
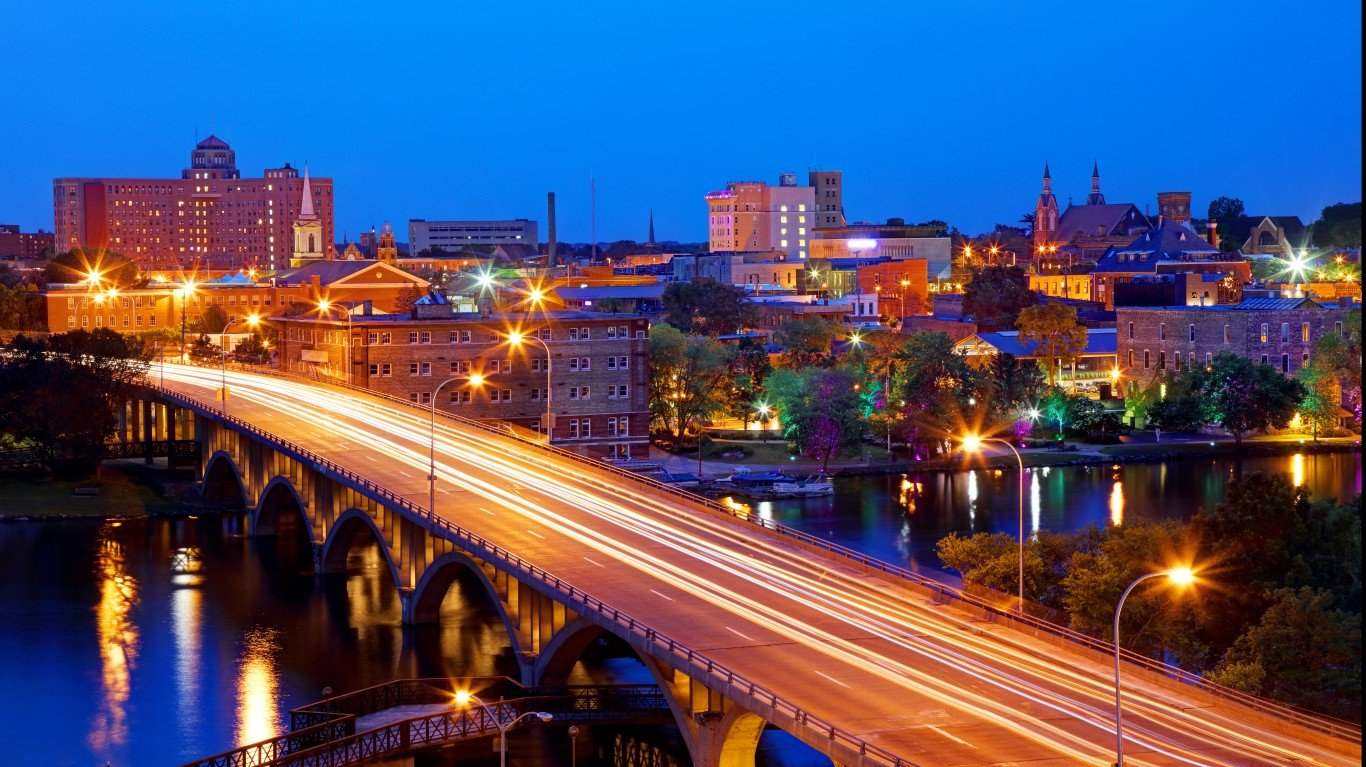
4. Illinois’ 17th Congressional District
> Current representative: Rep. Cheri Bustos (D)
> Major city covered by district: Rockford
> Poverty rate: 39.1% Black; 12.8% white
> Unemployment rate: 18.4% Black; 5.6% white
> Homeownership rate: 30.3% Black; 72.7% white
The 17th District in Illinois, which covers much of the northwestern portion of the state, has some of the worst socioeconomic conditions for Black Americans and some of the worst racial inequality in the United States. An estimated 39.1% of Black residents live below the poverty line, compared to 23.0% of Black Americans nationwide and 12.8% of white area residents. The area also has one of the highest Black unemployment rates in the country. An estimated 18.4% of Black labor force participants are out of work, nearly double the 9.5% national Black jobless rate and more than triple the local 5.6% white unemployment rate.
The district is heavily gerrymandered and has been represented by Democrat Cheri Bustos since 2013. It is notable as one of the voting districts that went twice to both Barack Obama and Donald Trump.
[recirclink id=996411]
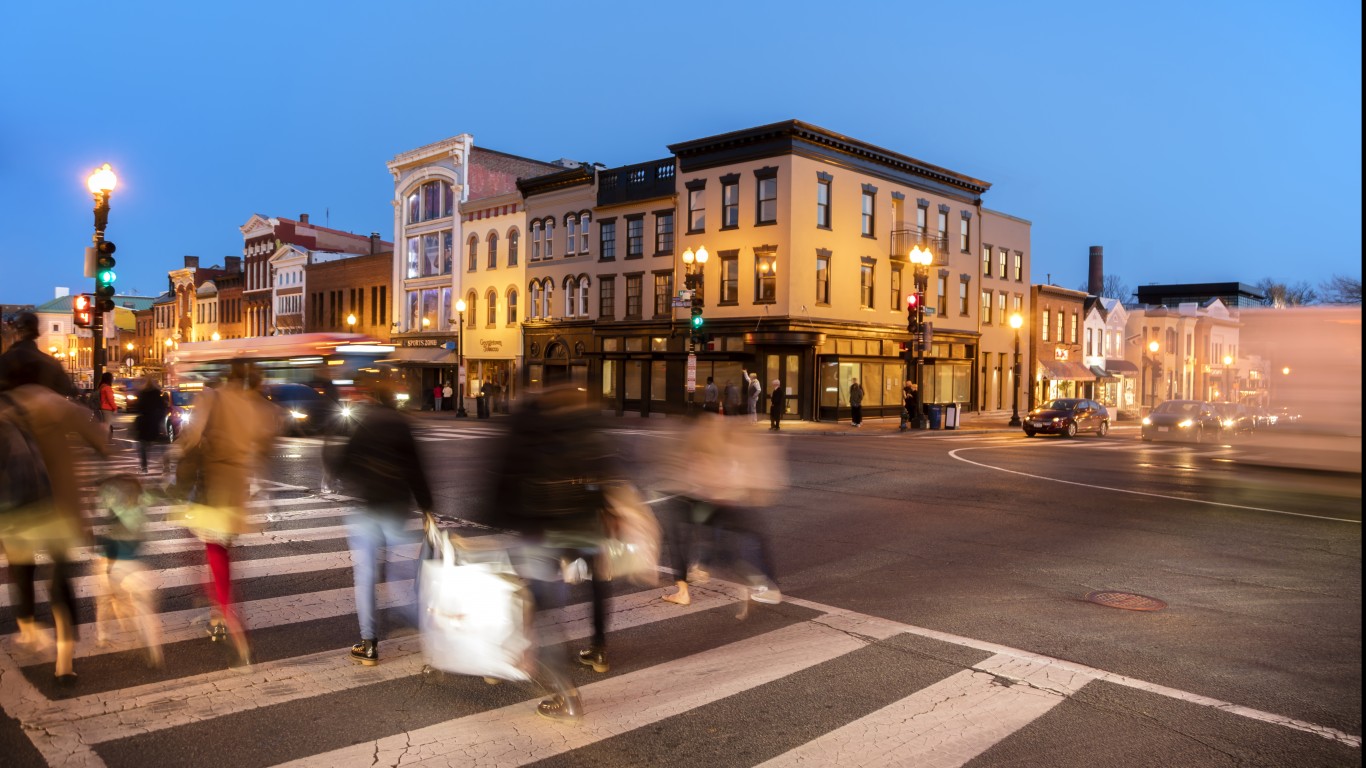
3. District of Columbia’s Congressional District
> Current representative: Delegate Eleanor Holmes Norton (D)
> Major city covered by district: District of Columbia
> Poverty rate: 25.6% Black; 6.3% white
> Unemployment rate: 13.2% Black; 2.7% white
> Homeownership rate: 35.2% Black; 49.5% white
Washington D.C. is an outlier on this list, as it does not have full representation in Congress. The district has no senators and only one congressional delegate with limited privileges. Washington D.C. has been represented by its delegate Eleanor Holmes Norton, a Democrat, since 1991. A civil rights and feminist leader, Norton has fought to bring jobs to the D.C. area and has created icentives for homeownership and education for district residents.
D.C. is one of the wealthiest parts of the country, but economic prosperity is not equal across racial lines. The typical white area household earns $138,231 a year, while the typical Black household in the district earns only about $45,000. Additionally, more than one in every four Black residents live below the poverty line, compared to 6.3% of the white population.
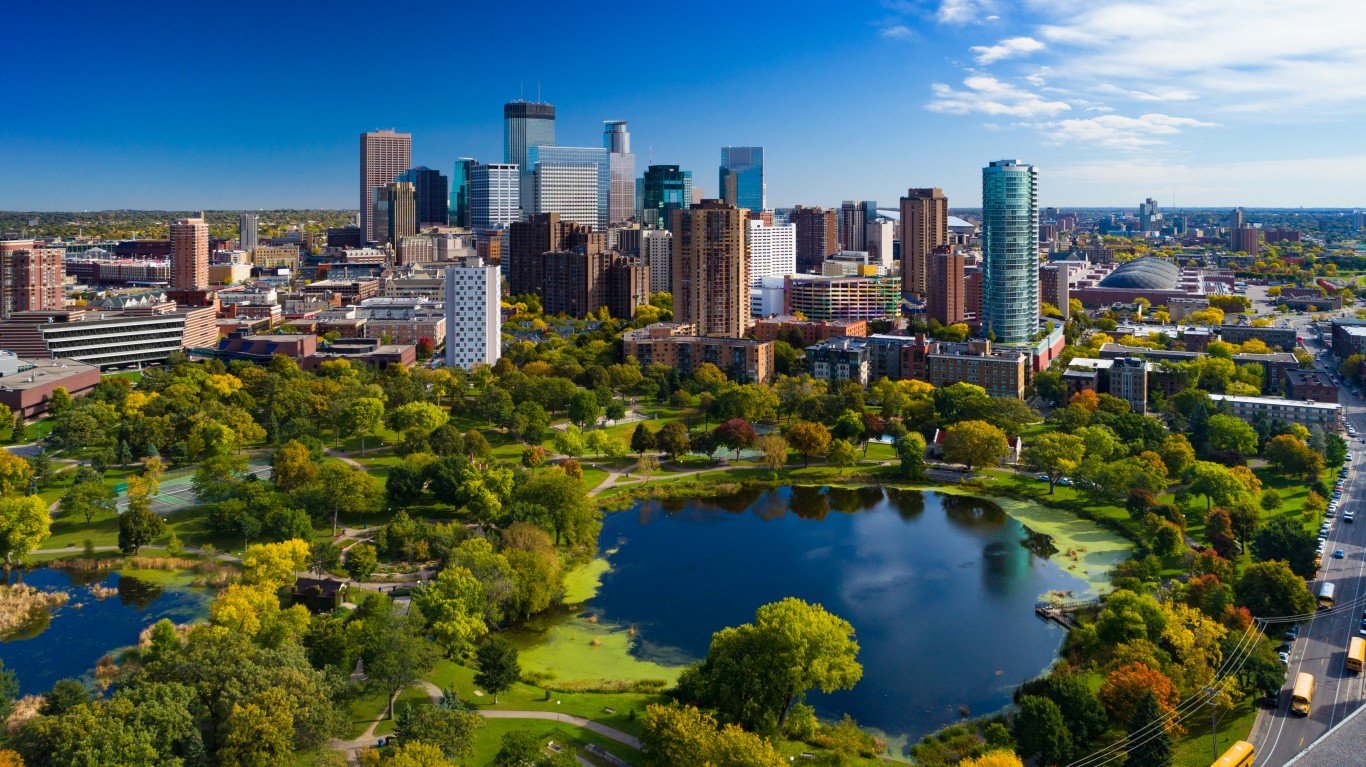
2. Minnesota’s 5th Congressional District
> Current representative: Rep. Ilhan Omar (D)
> Major city covered by district: Minneapolis
> Poverty rate: 33.9% Black; 9.0% white
> Unemployment rate: 9.8% Black; 3.2% white
> Homeownership rate: 19.3% Black; 62.0% white
The 5th Congressional District in Minnesota has the worst racial disparities in the state and some of the worst nationwide. The district covers the city of Minneapolis, where George Floyd was murdered by a police officer in May 2020, sparking nationwide protests. Rep. Ilhan Omar was elected to represent the district in 2018. Omar is the first refugee and Somali-American woman ever to serve in the U.S. Congress.
Black area residents are more than three times as likely to live below the poverty line as white residents and three times more likely to be unemployed. Disparate outcomes along racial lines in the district are largely the legacy of historic racism. Minneapolis is one of several Midwestern cities that enacted restrictive housing covenants and exclusionary zoning policies in the early 20th century. These policies impact residential patterns to this day.
[in-text-ad-2]
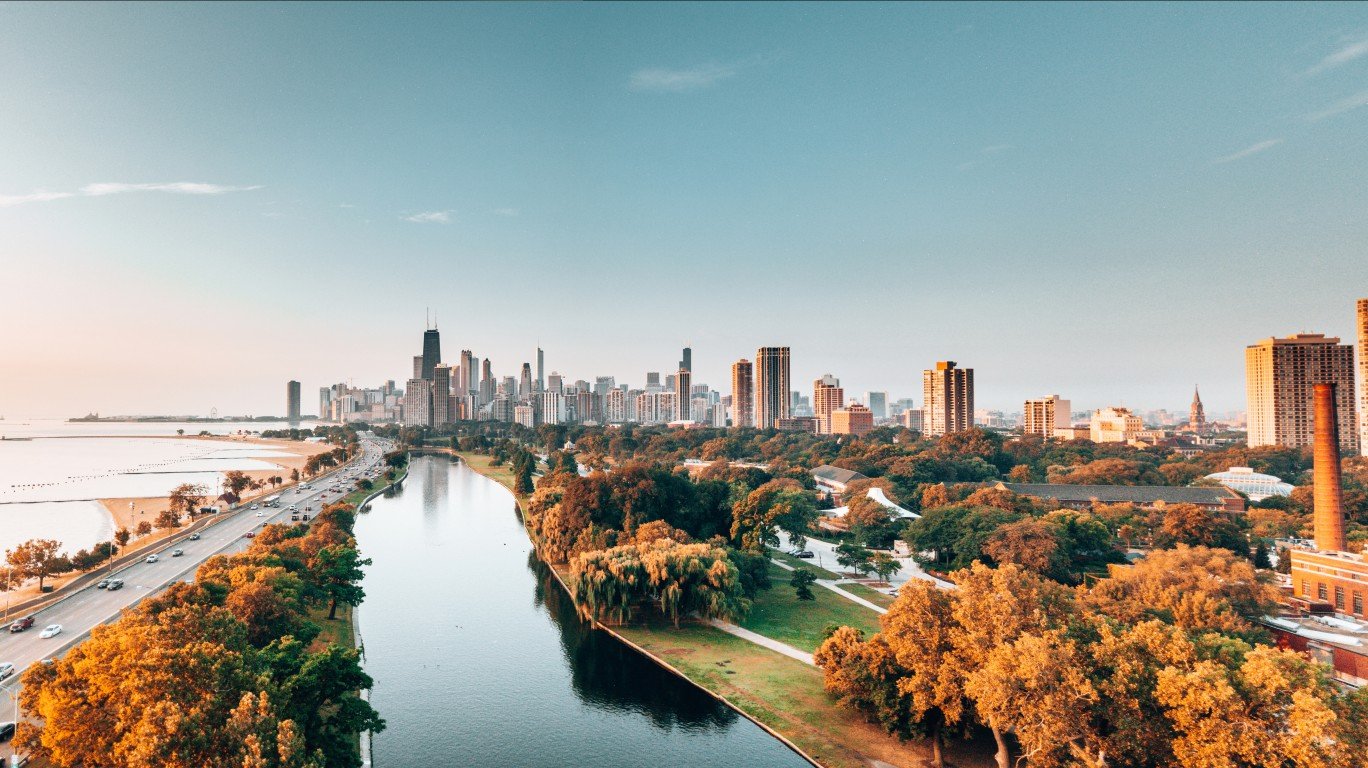
1. Illinois’ 7th Congressional District
> Current representative: Rep. Danny K. Davis (D)
> Major city covered by district: Chicago
> Poverty rate: 30.3% Black; 9.8% white
> Unemployment rate: 16.3% Black; 4.0% white
> Homeownership rate: 30.8% Black; 52.7% white
Illinois’ 7th Congressional District includes Chicago and stretches westward into the interior of the state. A history of exclusionary zoning, redlining, and discriminatory lending practices in Chicago throughout the 20th century has led to deeply entrenched segregation in and around the city — and contributed to some of the largest racial disparities in income and education of any congressional district. The district is currently represented by Democrat Danny K. Davis, who was first elected in 1996. Davis’ political priorities include preservation of civil rights.
The typical Black household in the district has an income of just $31,204 a year, less than a third of the median income of $101,621 among white area households. Income is closely tied to educational attainment, and just 17.6% of Black adults in the district have a bachelor’s degree compared to 67.6% of white adults.
Methodology
To determine the 30 worst congressional districts for Black Americans, 24/7 Wall St. created an index consisting of six measures to assess race-based gaps in socioeconomic indicators in each of the nation’s congressional districts. Because the index measures the gaps for each indicator between Black and white Americans, it ensures districts are ranked on the differences between Black and white residents and not on absolute levels of socioeconomic development in an area. For example, a relatively affluent area might have a wide gap in income between white and Black Americans, even though incomes are generally high. This area would still rank worse than an area with relatively low incomes but where the gap is small.
The six measures – median household income, poverty, adult high school and bachelor’s degree attainment, homeownership, and unemployment – are five-year estimates from the U.S. Census Bureau’s 2019 American Community Survey.
For each measure, we constructed an index from the gaps between Black and white Americans. The index was standardized using min-max normalization. We excluded districts where Black residents comprised less than 10% of the population or where data limitations made comparisons between racial groups impossible.
Contact [email protected] for any questions or corrections.