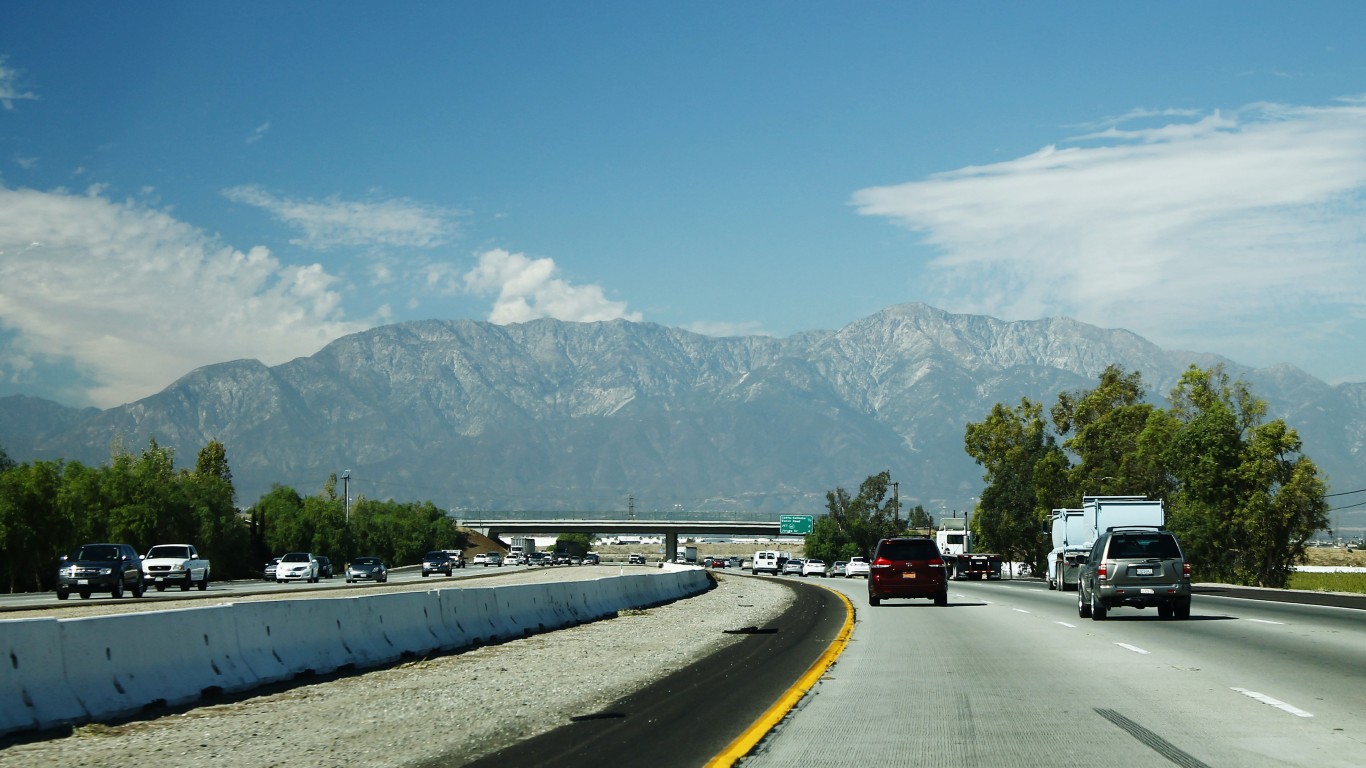
Rural America is emptying out. According to the Pew Research Center, about half of the country’s rural counties now have lower populations than they did in 2000.
Then, the exodus of locals leaving rural communities for urban and suburban destinations has grown in much of rural America, even as the U.S. countryside becomes demographically less white.
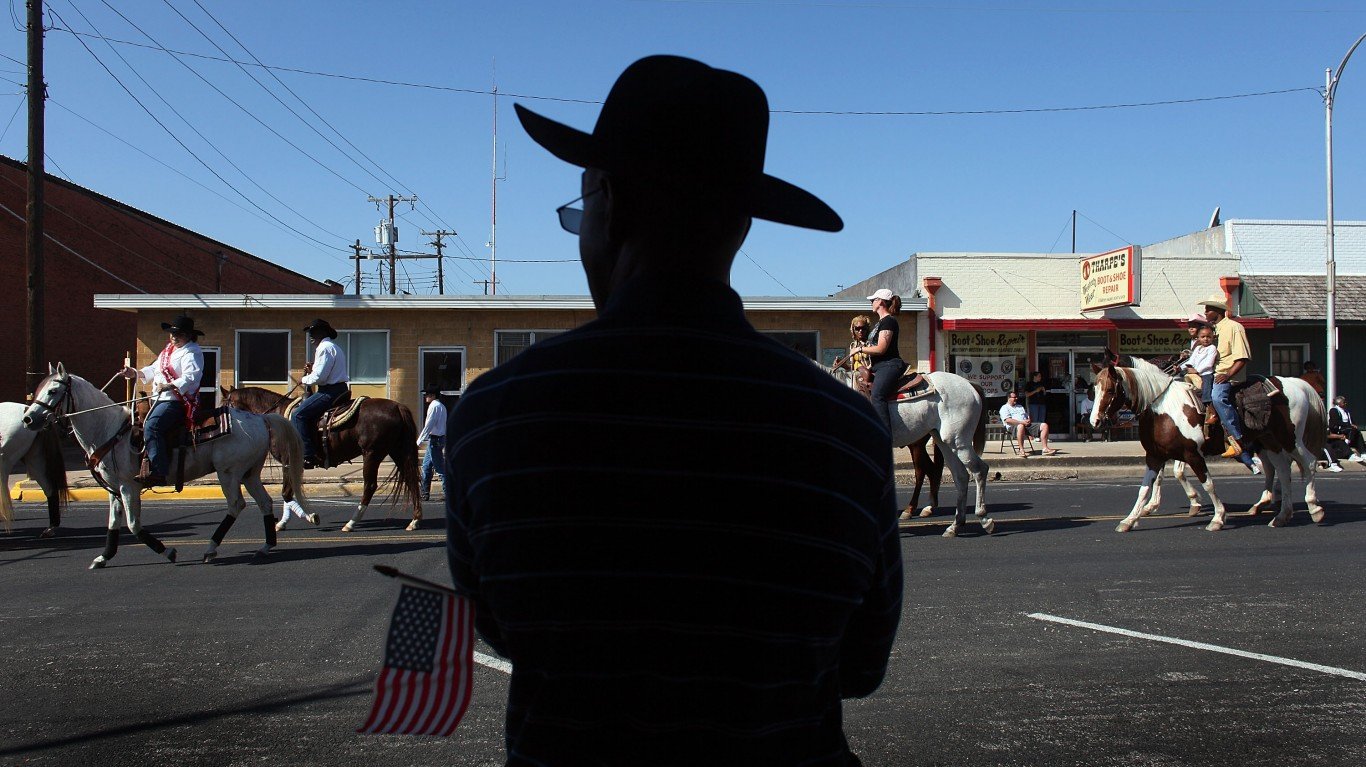
According to research group Brookings, the percentage of people of color who moved to rural counties from 2010 to 2020 grew by 3.5%, but people of color are still significantly underrepresented compared to the country as a whole. (These are the worst voting districts for Black Americans.)
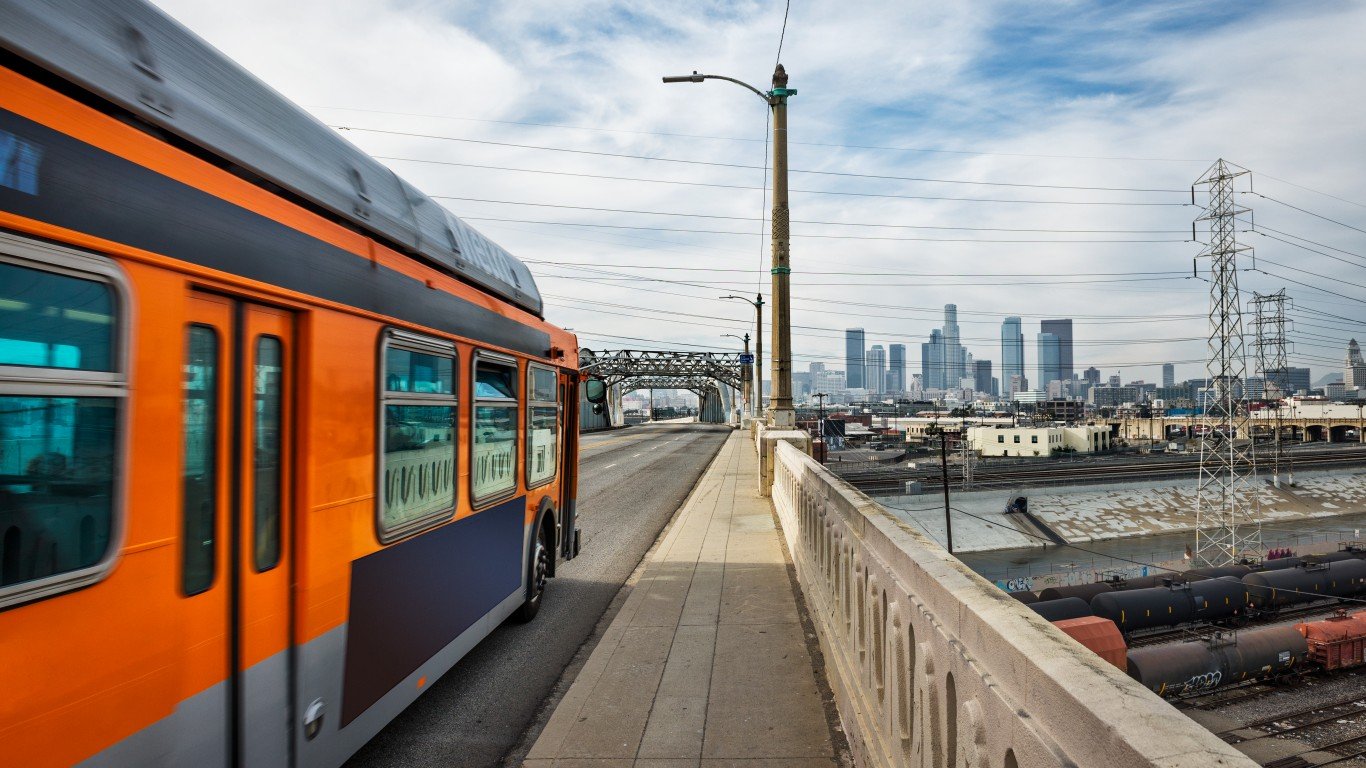
Immigrants and native-born Americans of all races and ethnicities seem to have confronted a goldilocks scenario in their moving decisions. While big cities can be expensive, the countryside may be soft on employment opportunities. The middle ground could be a small metro area with a reasonable cost of living, ample space, adequate job prospects, decent public school (hopefully), and sufficient dining and recreational activities.
And if diversity is what some movers are looking for in a small city, 24/7 Wall St. reviewed data on race and ethnicity from the U.S. Census Bureau to determine America’s most diverse small cities. Cities with between 50,000 and 150,000 residents were ranked based on the probability that two residents picked at random will be of different race or ethnicity. (These are the most segregated cities in America.)
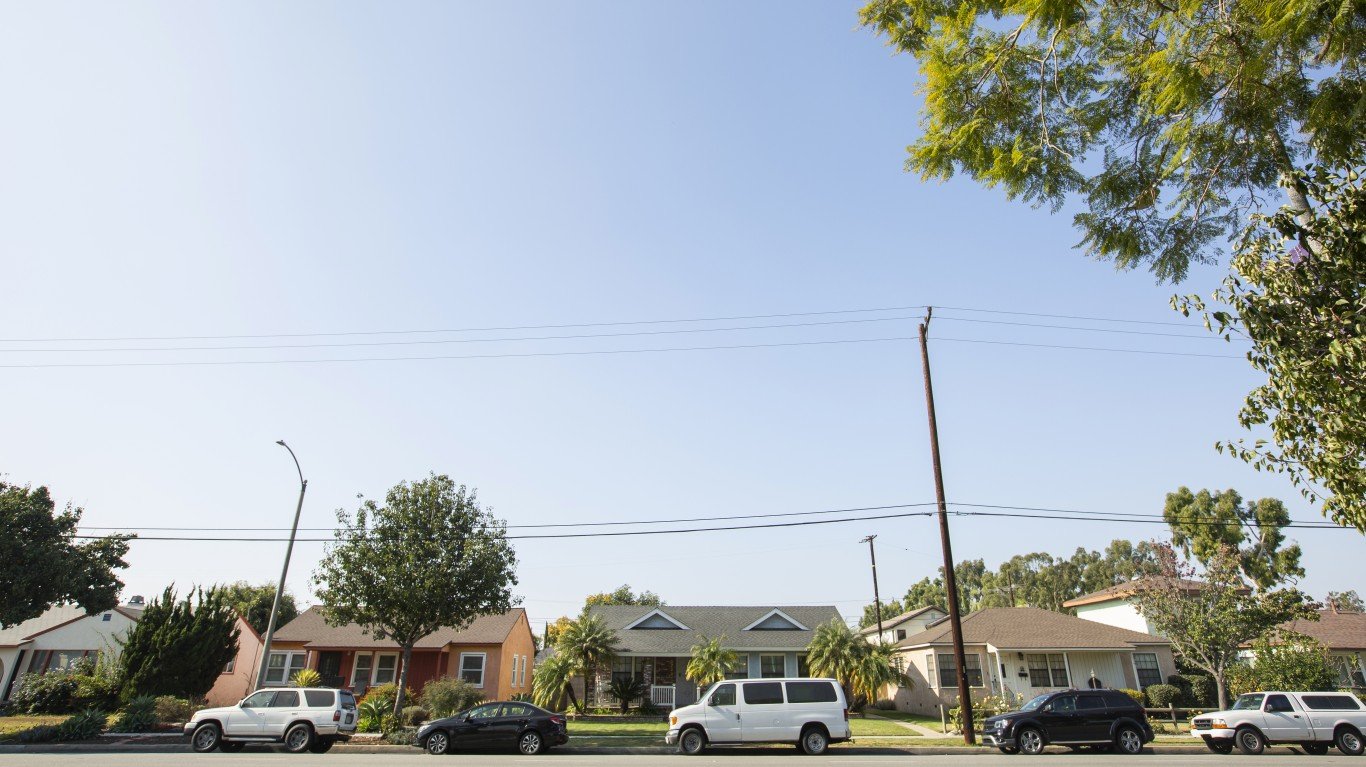
U.S. cities with small populations have generally become more diverse in recent decades. Small metro areas like Renton, Washington; Missouri City, Texas; and Dale City, Virginia, have enough diversity that the chances of any two randomly selected residents to be of different races or ethnicities, is over 70%. The immigrant population plays a role in this, but so does the ebb and flow of native-born Americans who relocate to other parts of the country in pursuit of better circumstances.
Click here to see the most diverse small cities
Click here to see our detailed methodology
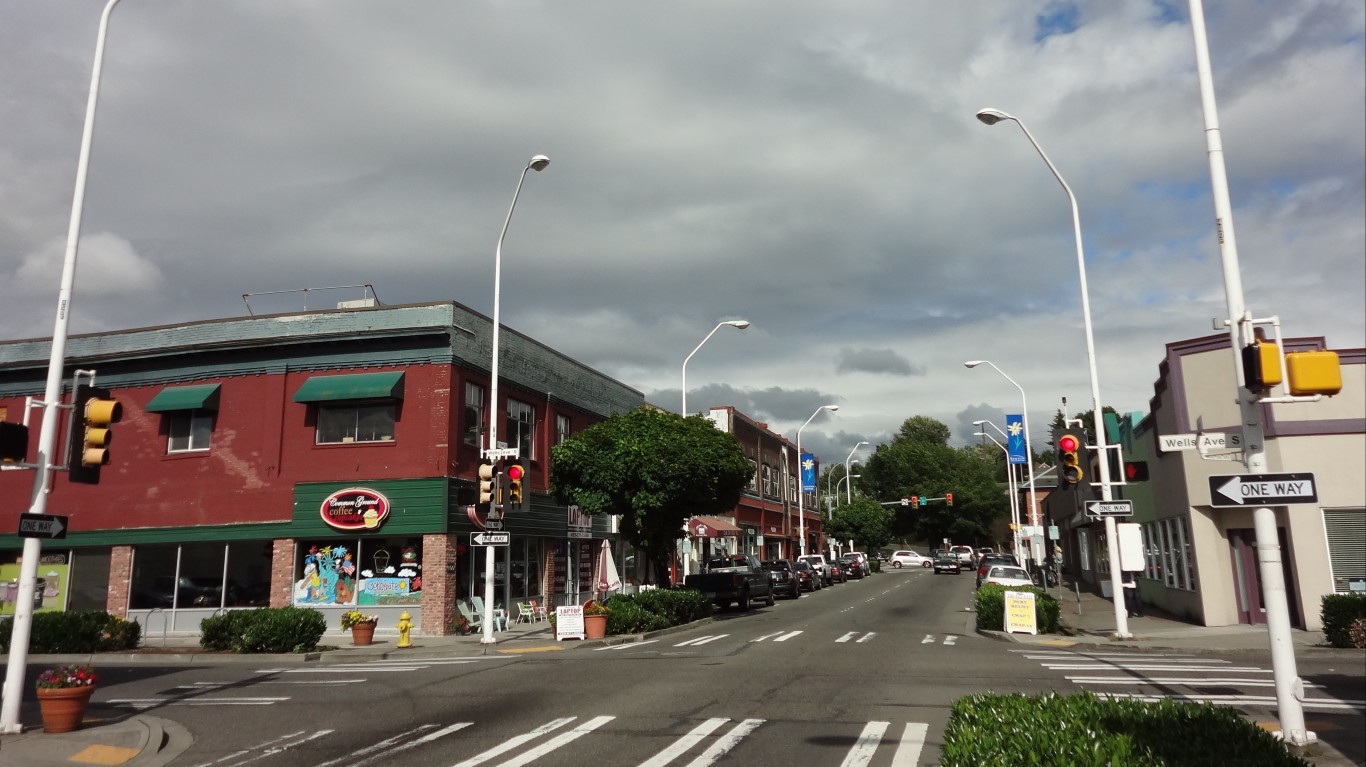
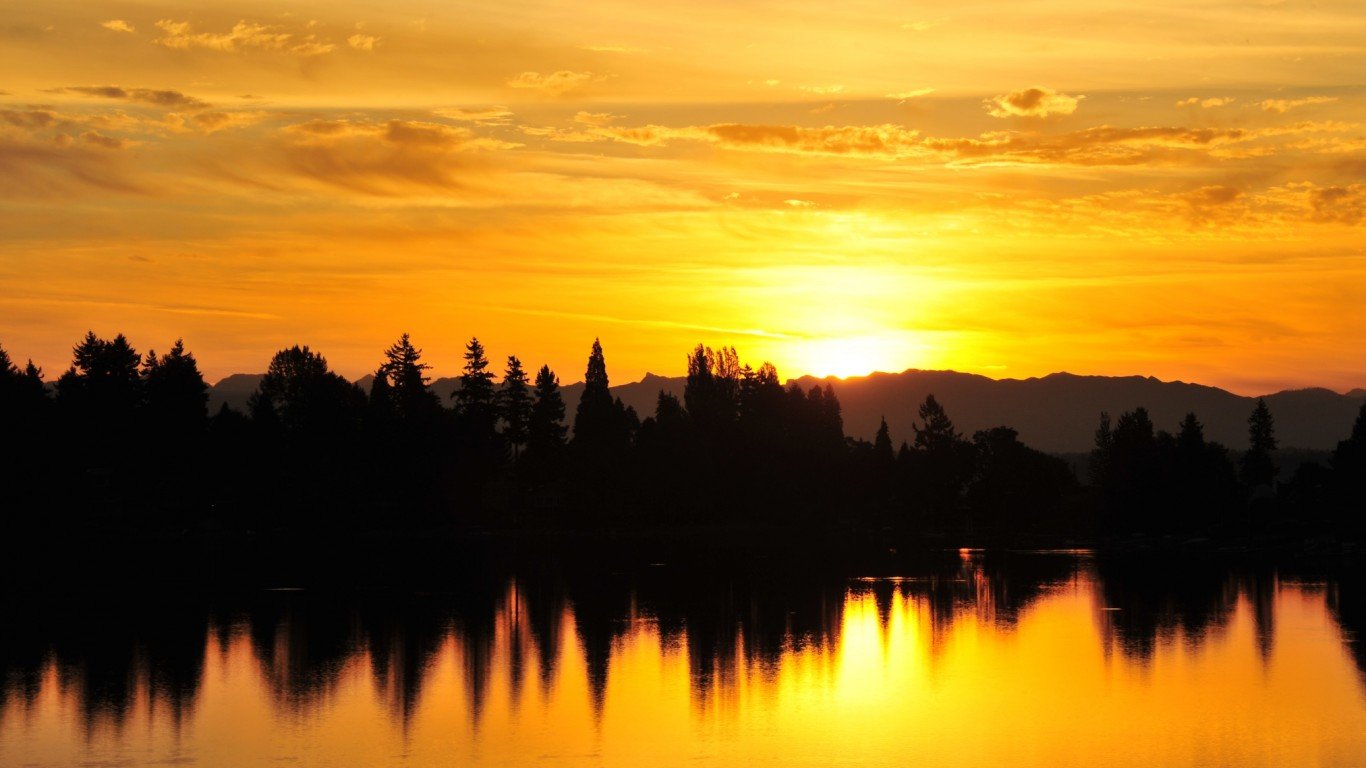
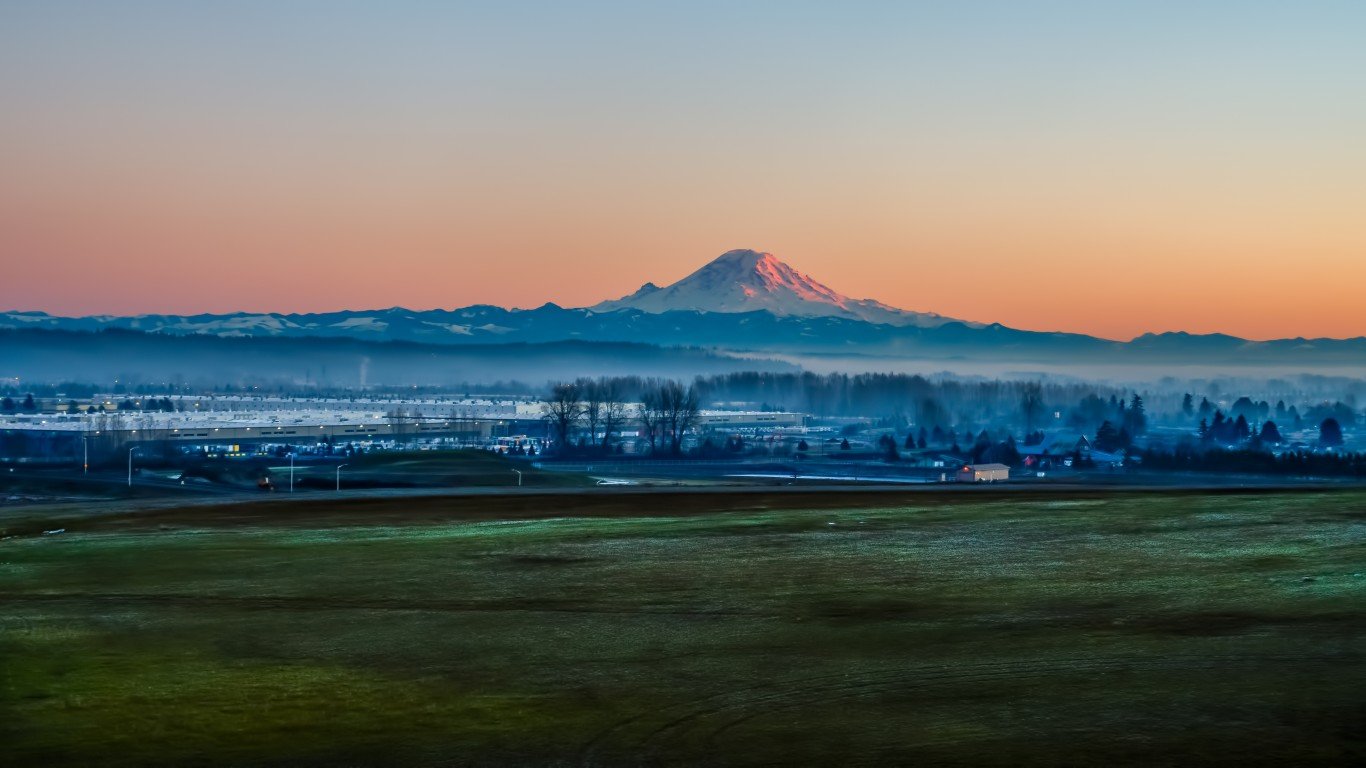
25. Renton, Washington
> Likelihood two random residents are different race or ethnicity: 71.1%
> Total population: 101,484
[in-text-ad]

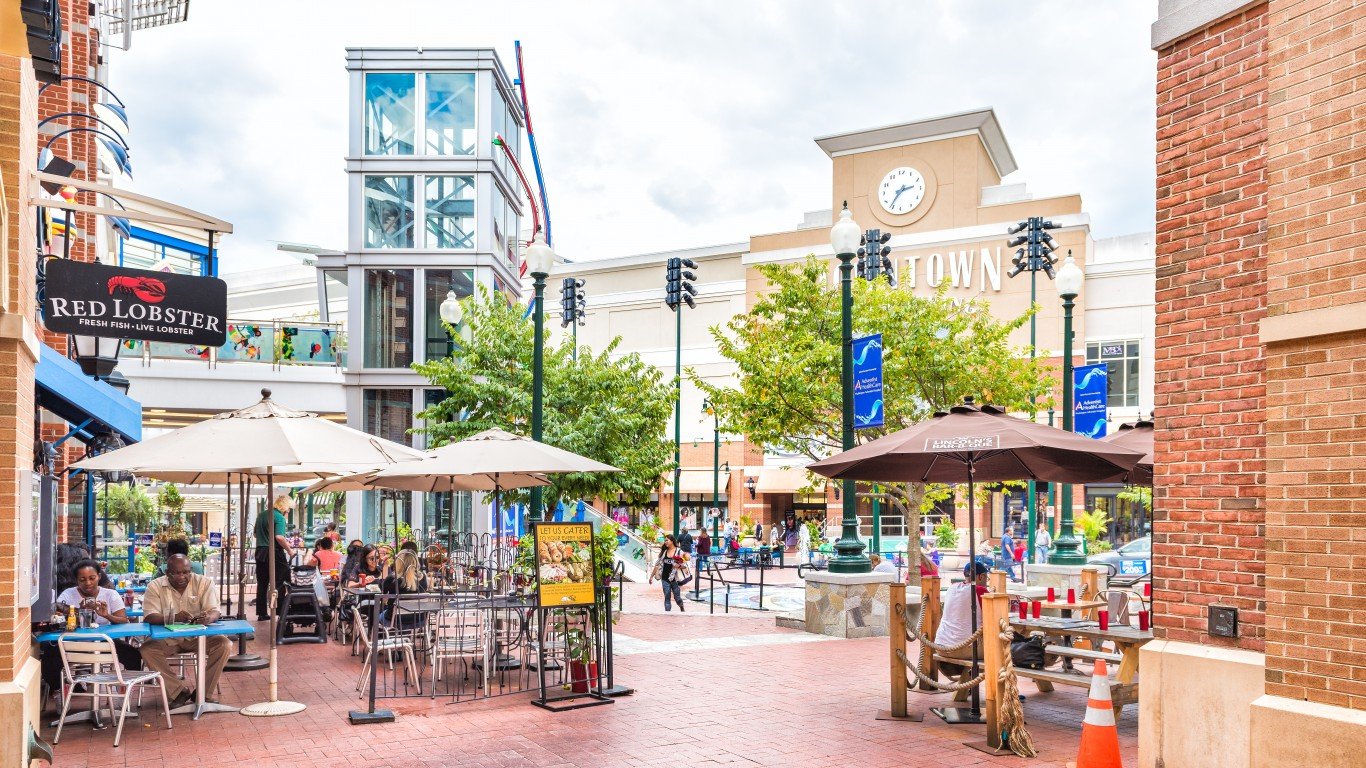
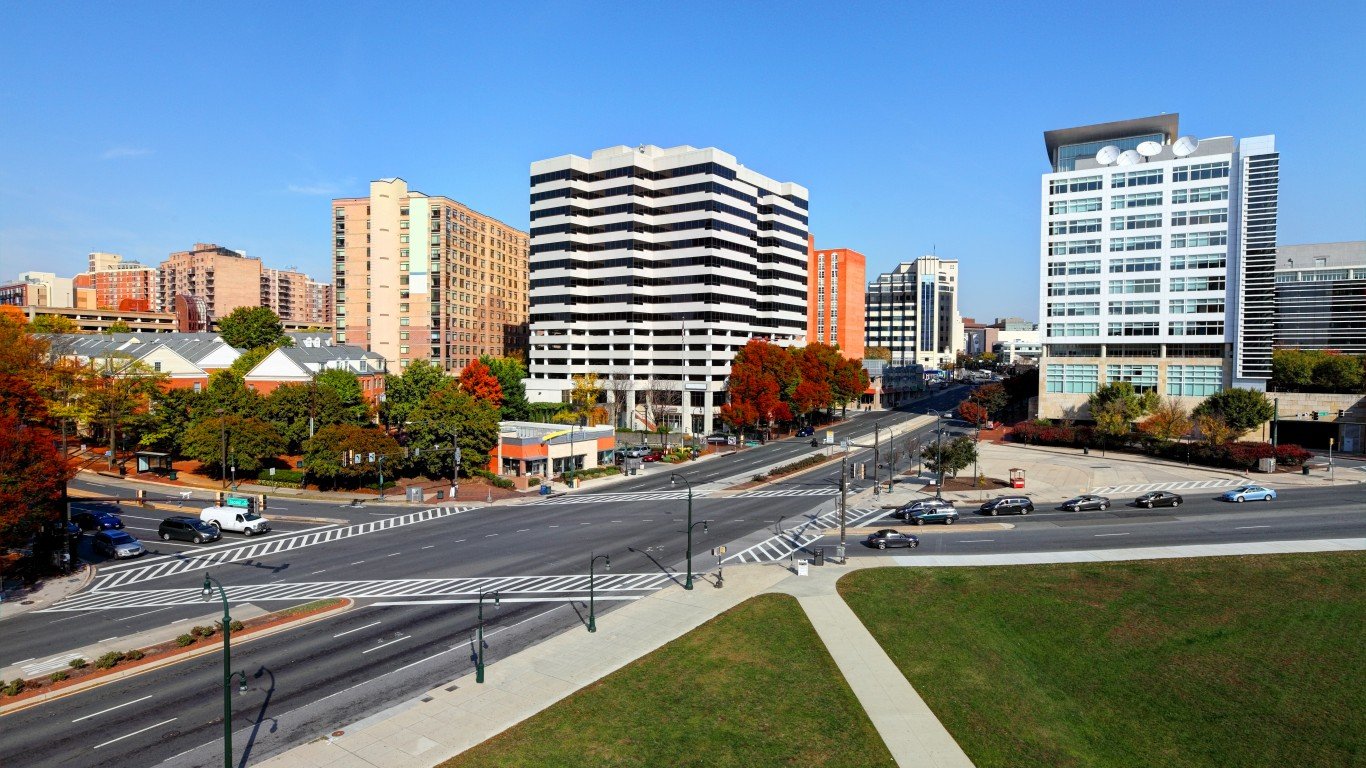
24. Wheaton, Maryland
> Likelihood two random residents are different race or ethnicity: 71.1%
> Total population: 50,229
[recirclink id=1041933]
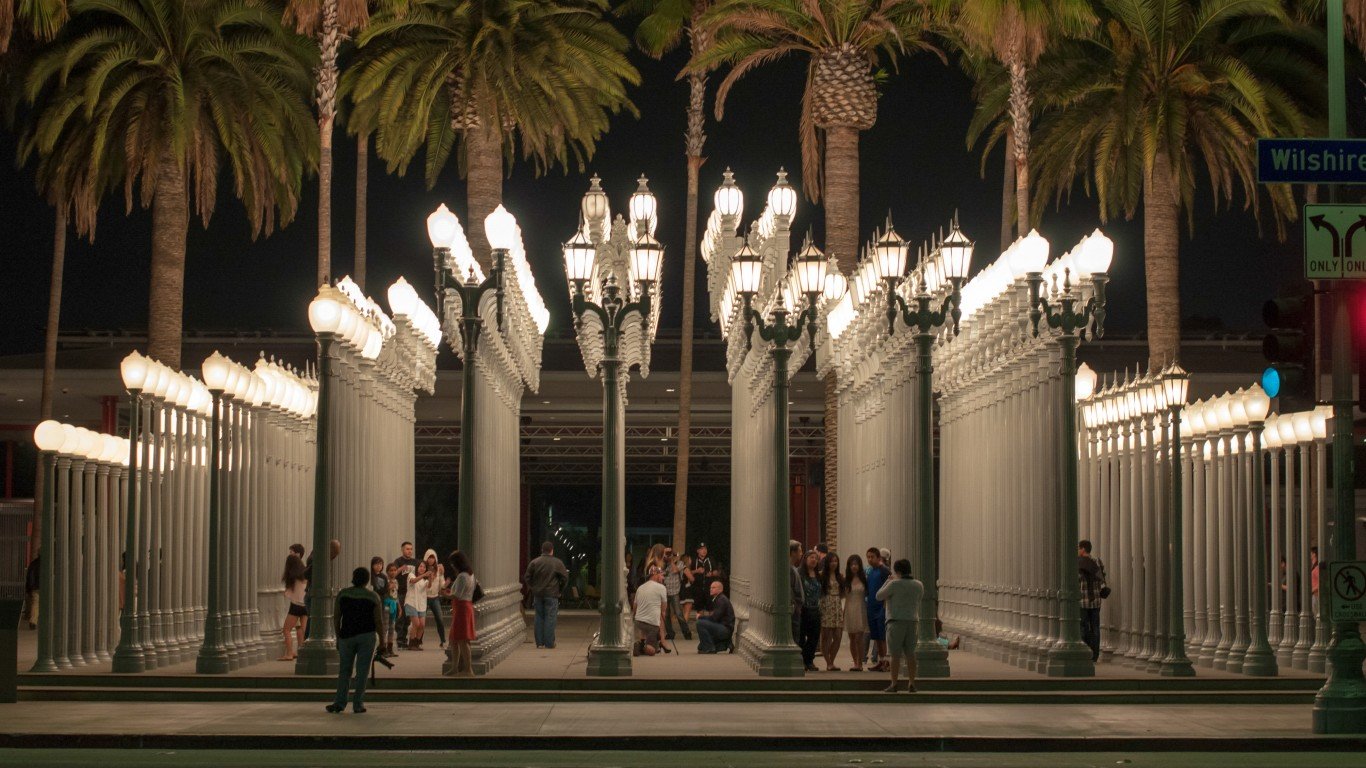
23. Pasadena, California
> Likelihood two random residents are different race or ethnicity: 71.3%
> Total population: 141,258
22. New Haven, Connecticut
> Likelihood two random residents are different race or ethnicity: 71.5%
> Total population: 130,331
[in-text-ad-2]
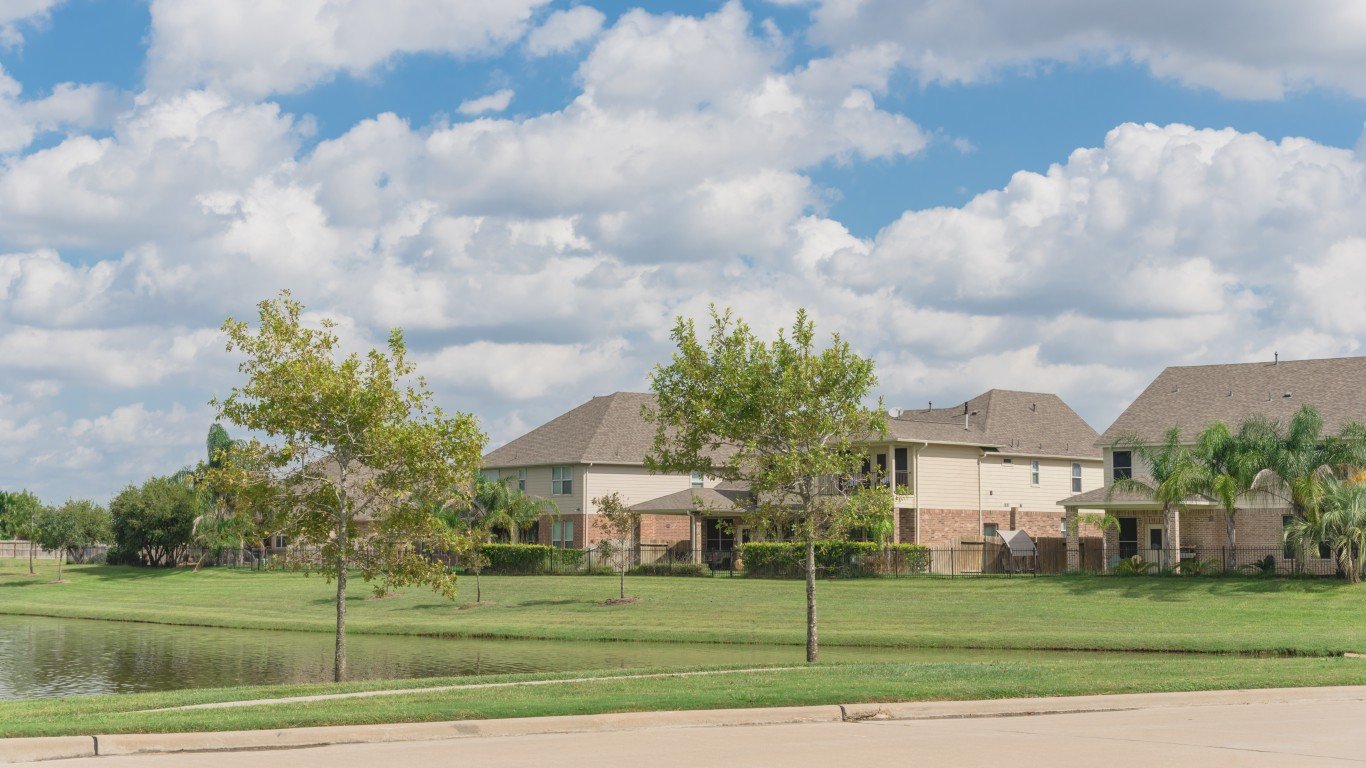
21. Pearland, Texas
> Likelihood two random residents are different race or ethnicity: 71.6%
> Total population: 122,078
20. Bolingbrook, Illinois
> Likelihood two random residents are different race or ethnicity: 71.8%
> Total population: 74,431
[in-text-ad]
19. Missouri City, Texas
> Likelihood two random residents are different race or ethnicity: 72.0%
> Total population: 74,557
[recirclink id=1039440]
18. Eastvale, California
> Likelihood two random residents are different race or ethnicity: 72.4%
> Total population: 62,046
17. Pittsburg, California
> Likelihood two random residents are different race or ethnicity: 72.4%
> Total population: 71,422
[in-text-ad-2]
16. Killeen, Texas
> Likelihood two random residents are different race or ethnicity: 72.4%
> Total population: 145,686
15. Lakewood, California
> Likelihood two random residents are different race or ethnicity: 72.5%
> Total population: 80,292
[in-text-ad]
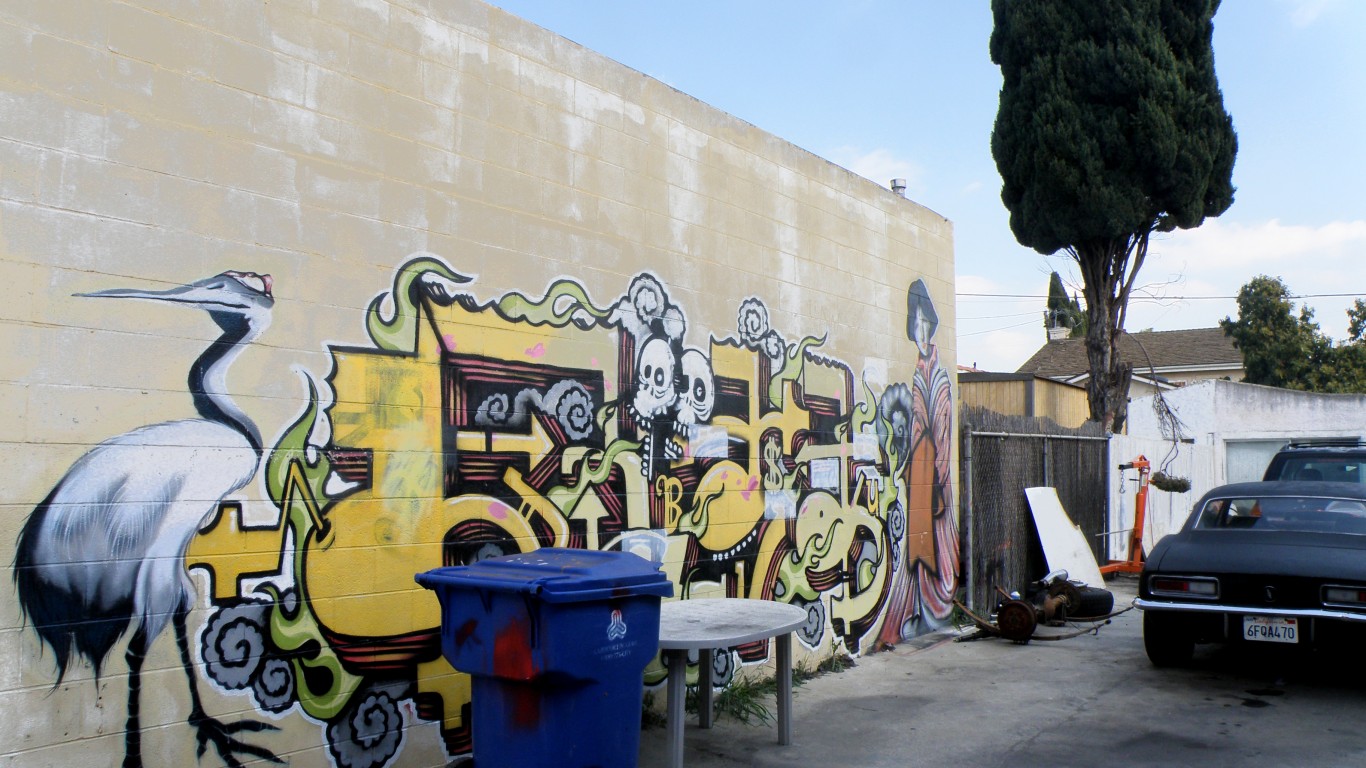
14. Richmond, California
> Likelihood two random residents are different race or ethnicity: 72.5%
> Total population: 109,884
[recirclink id=1018017]
13. Gardena, California
> Likelihood two random residents are different race or ethnicity: 72.6%
> Total population: 59,709
12. Silver Spring, Maryland
> Likelihood two random residents are different race or ethnicity: 72.7%
> Total population: 81,773
[in-text-ad-2]
11. Federal Way, Washington
> Likelihood two random residents are different race or ethnicity: 72.7%
> Total population: 96,526
10. Carson, California
> Likelihood two random residents are different race or ethnicity: 73.0%
> Total population: 92,079
[in-text-ad]
9. Kent, Washington
> Likelihood two random residents are different race or ethnicity: 73.2%
> Total population: 131,118
[recirclink id=1042926]
8. Aspen Hill, Maryland
> Likelihood two random residents are different race or ethnicity: 73.4%
> Total population: 53,049
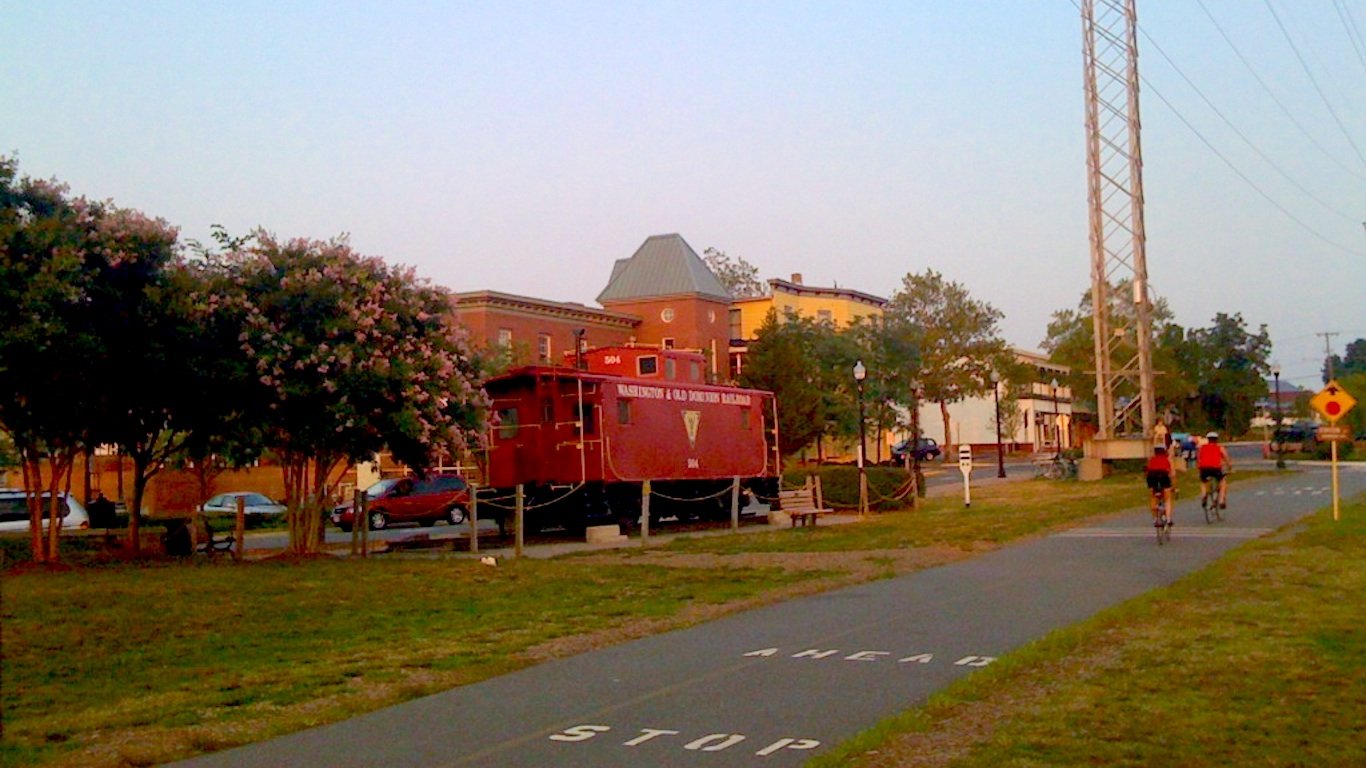
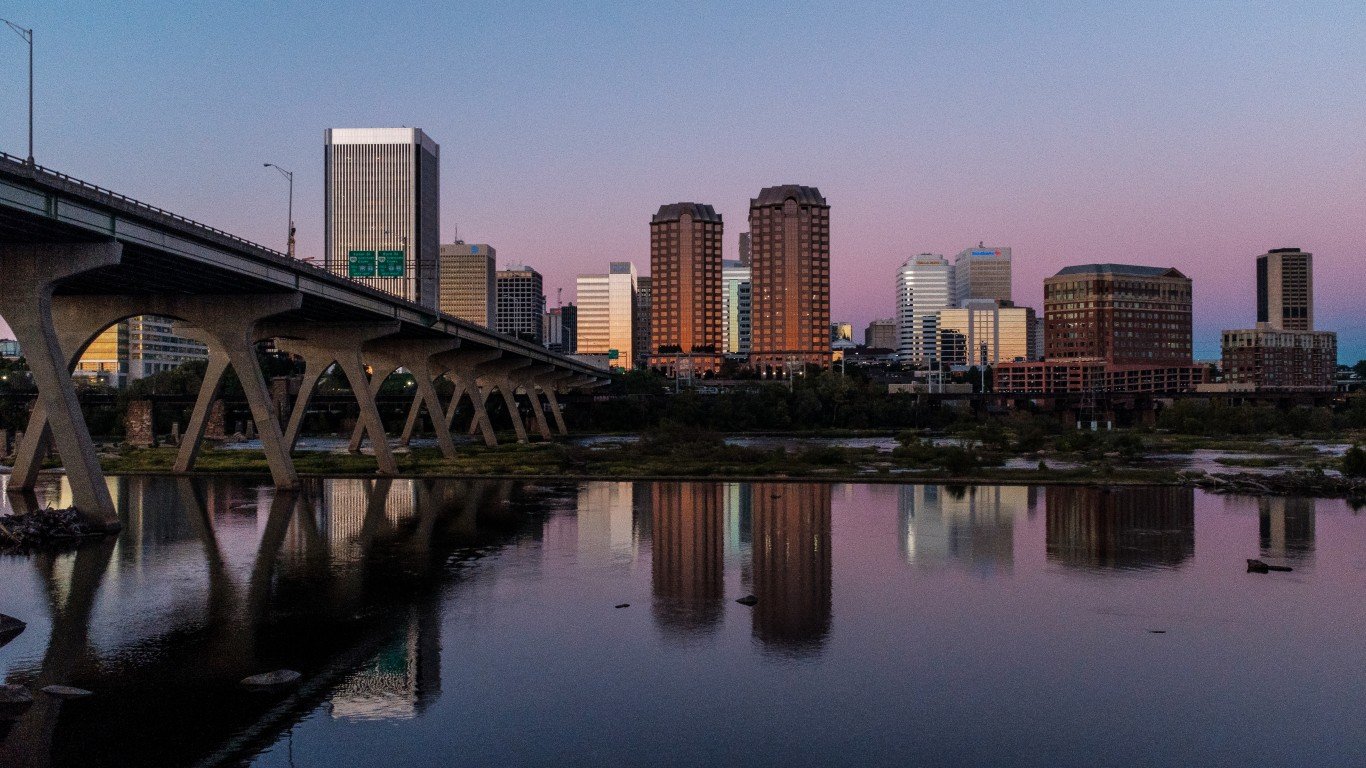
7. Dale City, Virginia
> Likelihood two random residents are different race or ethnicity: 73.9%
> Total population: 72,627
[in-text-ad-2]
6. San Leandro, California
> Likelihood two random residents are different race or ethnicity: 74.3%
> Total population: 90,025
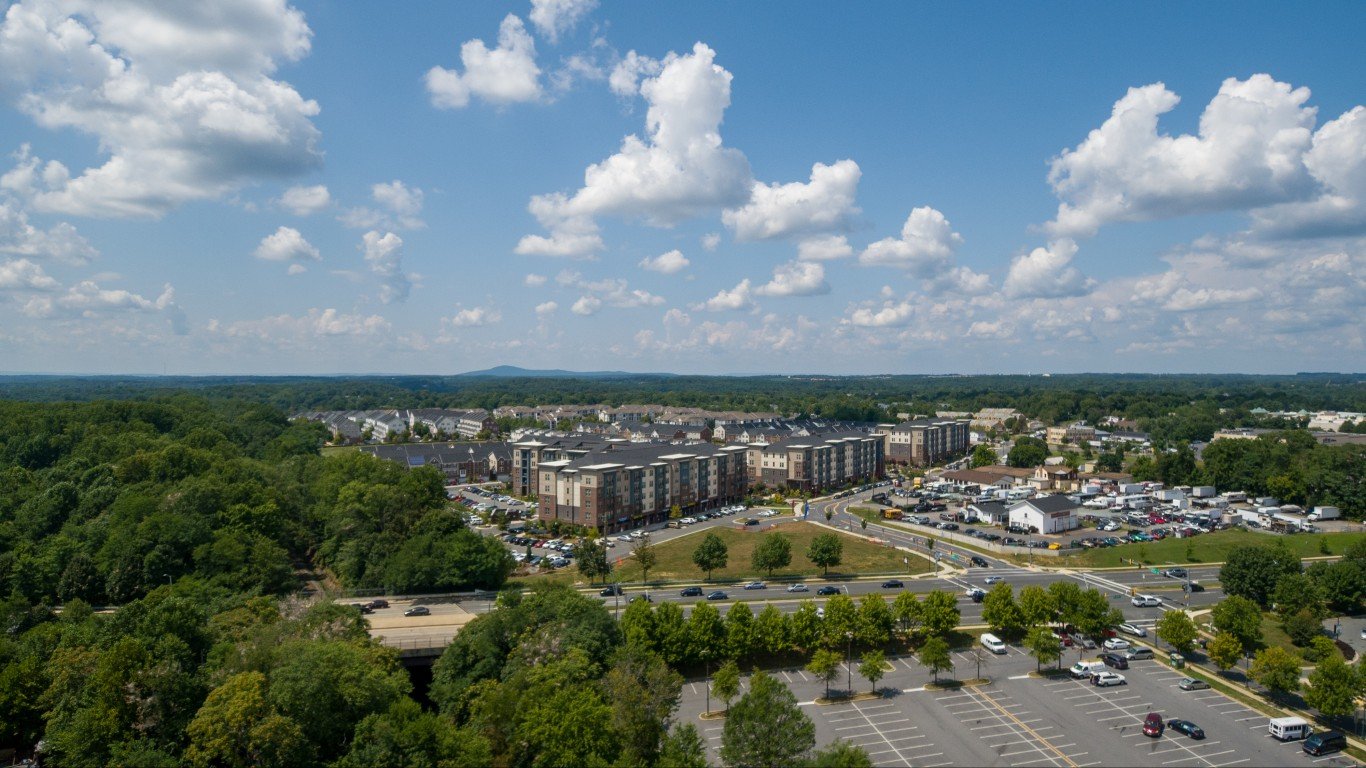
5. Gaithersburg, Maryland
> Likelihood two random residents are different race or ethnicity: 75.2%
> Total population: 67,742
[in-text-ad]
4. Antioch, California
> Likelihood two random residents are different race or ethnicity: 75.2%
> Total population: 111,200
[recirclink id=996411]
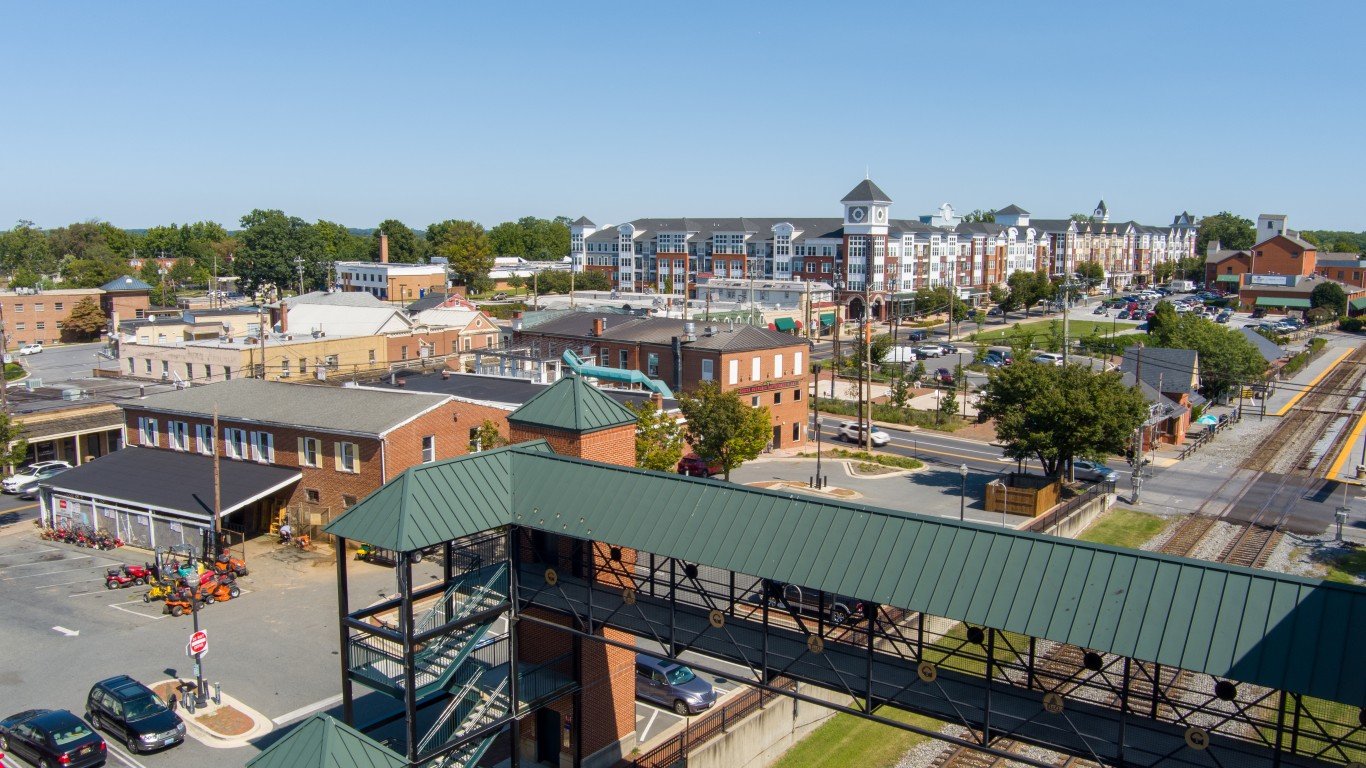
3. Germantown, Maryland
> Likelihood two random residents are different race or ethnicity: 76.0%
> Total population: 90,582
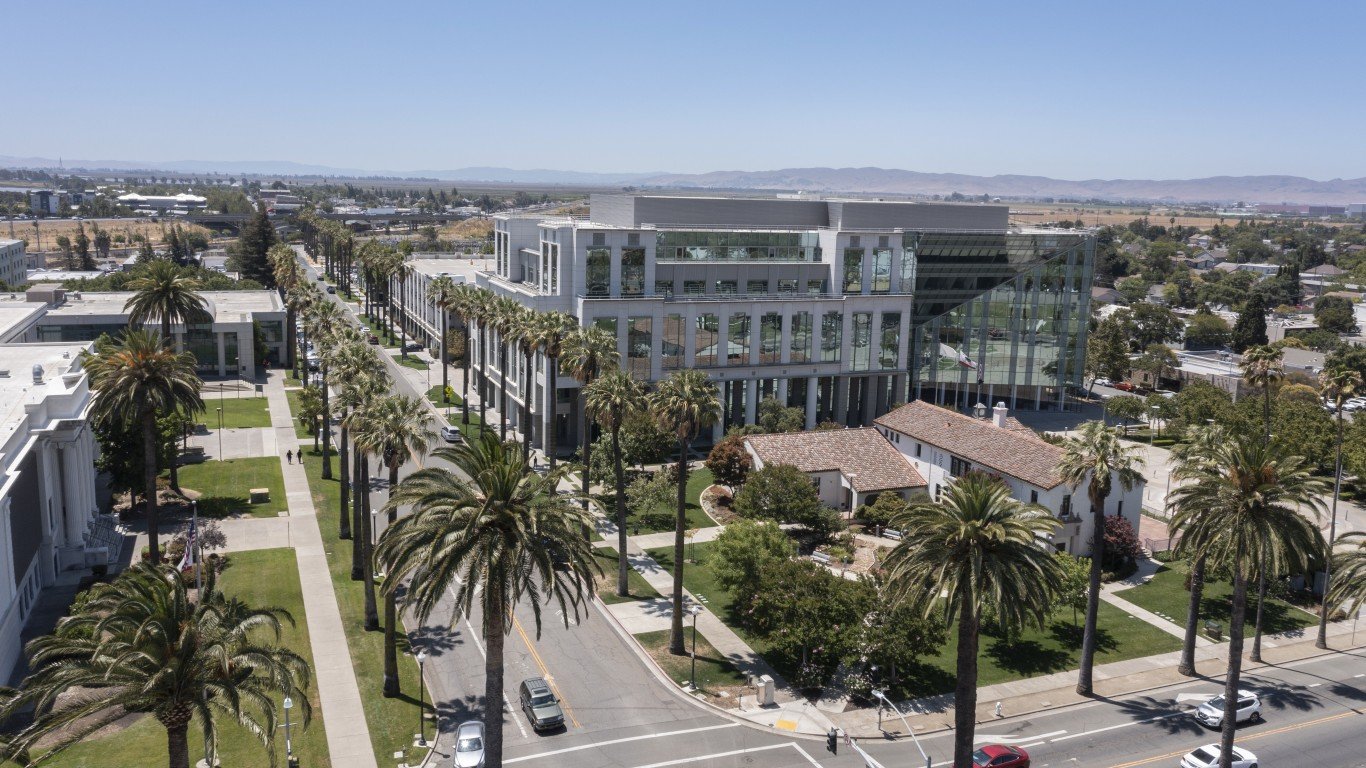
2. Fairfield, California
> Likelihood two random residents are different race or ethnicity: 76.2%
> Total population: 115,282
[in-text-ad-2]
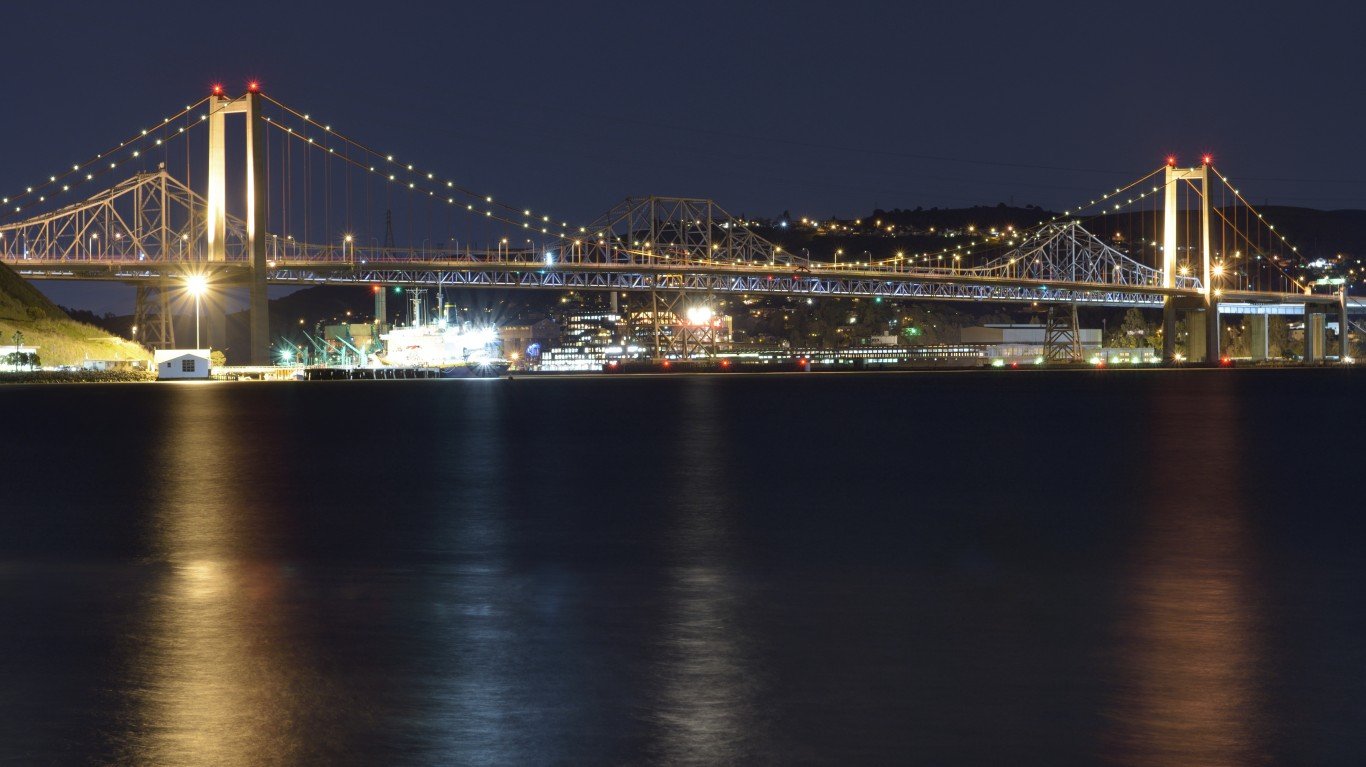
1. Vallejo, California
> Likelihood two random residents are different race or ethnicity: 77.7%
> Total population: 121,267
Methodology
To determine America’s most diverse small cities, 24/7 Wall St. reviewed data on race and ethnicity from the U.S. Census Bureau’s 2019 American Community Survey. Cities with between 50,000 and 150,000 residents were ranked based on the probability that two residents picked at random will be of different race or ethnicity. The racial and ethnic categories include white, Black or African American, American Indian and Alaska Native, Asian, Native Hawaiian and other Pacific Islander, Hispanic or Latino, some other race alone, and two or more races. The probability that any two residents picked at random will belong to a different racial or ethnic category is equivalent to the sum of the squares of each group’s share of the population, subtracted from 1. The same method is used in the USA Today Diversity Index.
Contact [email protected] for any questions or corrections.