The third most populous country, the United States is also one of the more ethnically and racially diverse countries in the world. Of course, not all parts are as equally diverse, and some states, some cities, even some neighborhoods are more diverse than others. To help represent diversity of an area, the Census Bureau has created a measure that calculates the chance that two people chosen at random from a certain place will be from different race and ethnicity groups.
To determine the most diverse neighborhoods on the West Coast, 24/7 Wall St. calculated this measure for different census tracts, using five-year data on race and ethnicity from the U.S. Census Bureau’s 2022 American Community Survey. Neighborhoods were ranked based on the probability that two residents picked at random will be of different race or ethnicity. Racial and ethnic groups include white, Black or African American, American Indian and Alaska Native, Asian, Native Hawaiian and other Pacific Islander, Hispanic or Latino, some other race alone, and two or more races.
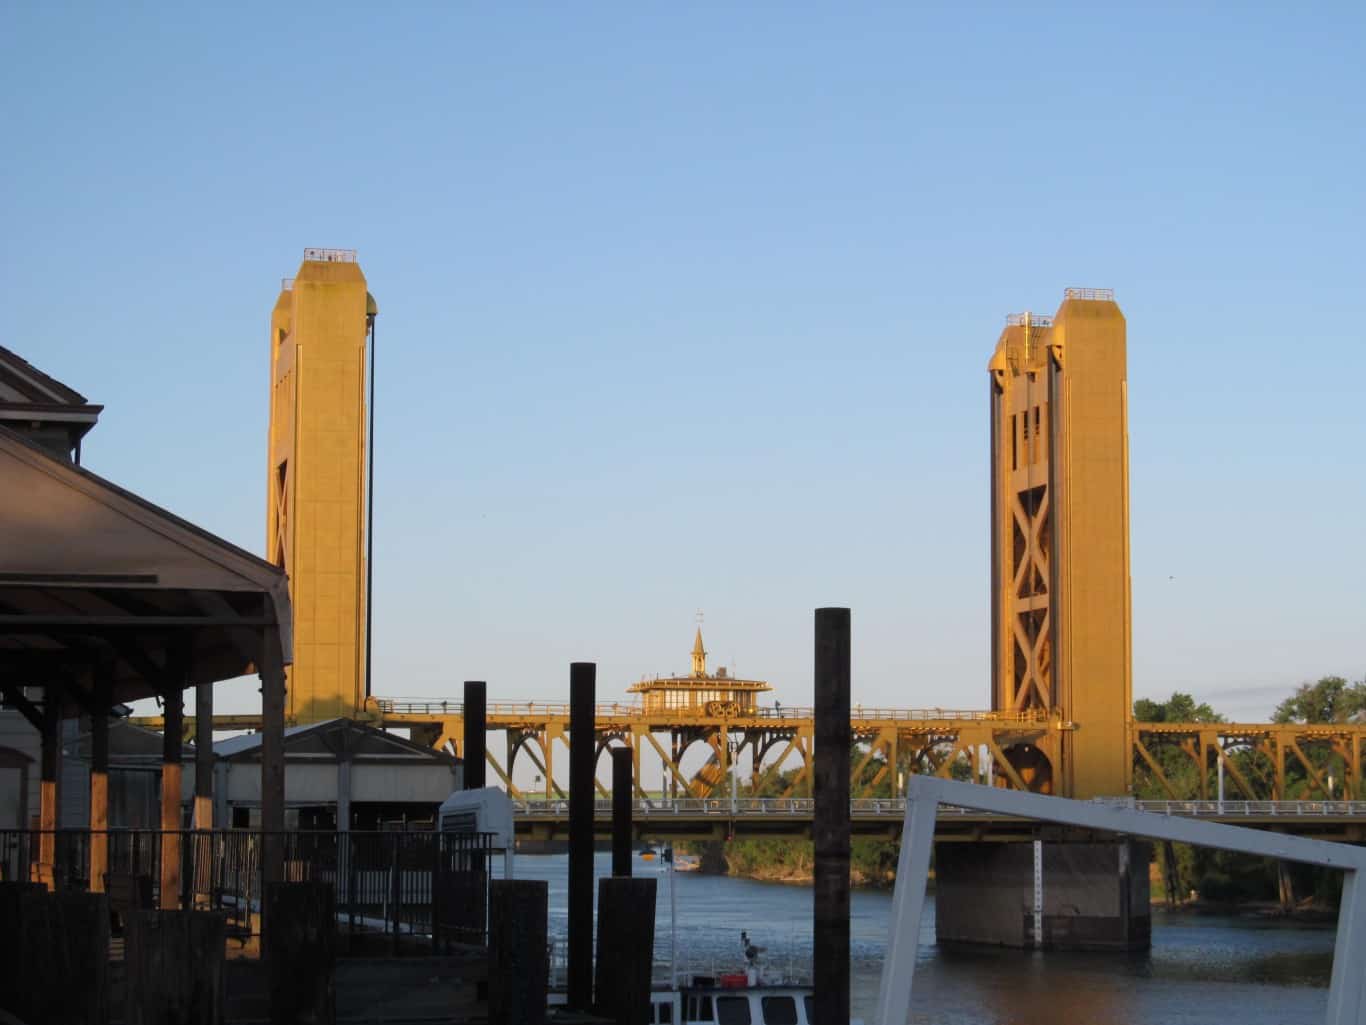
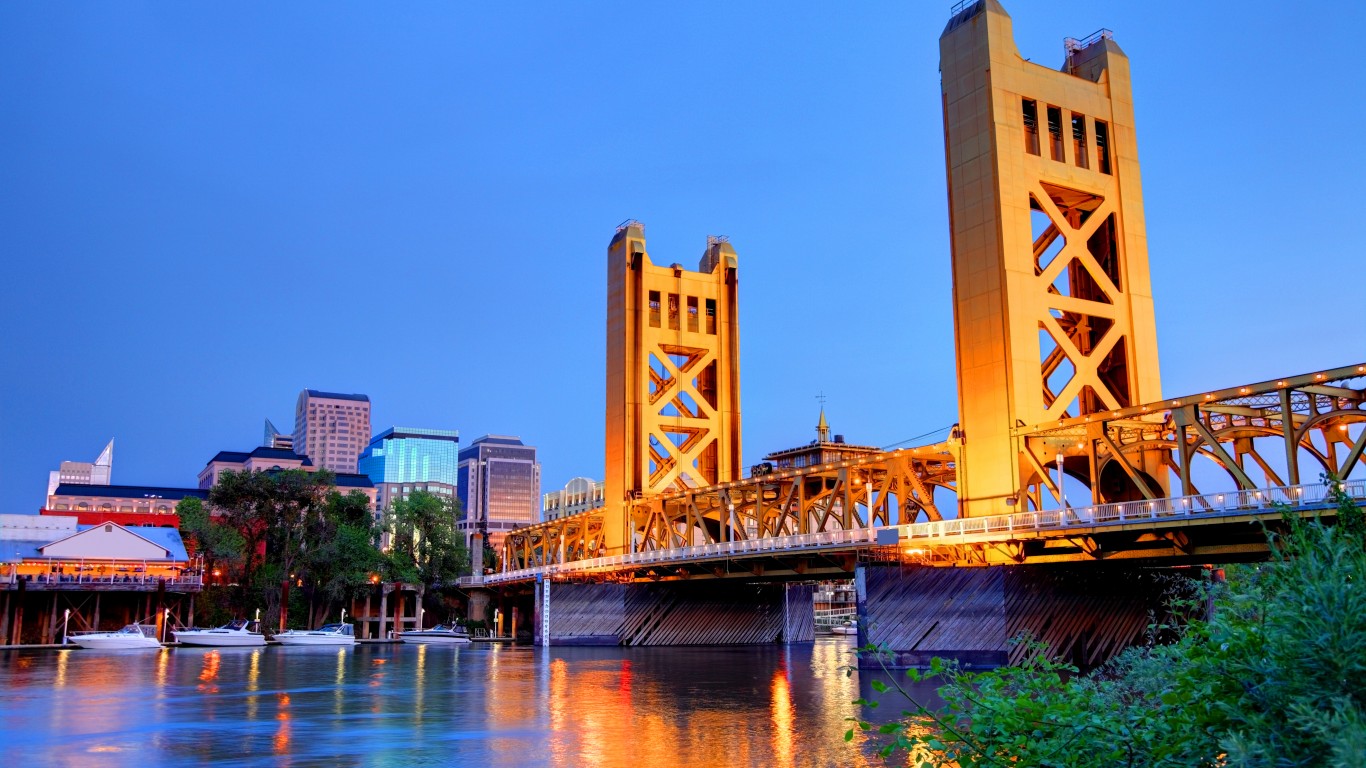
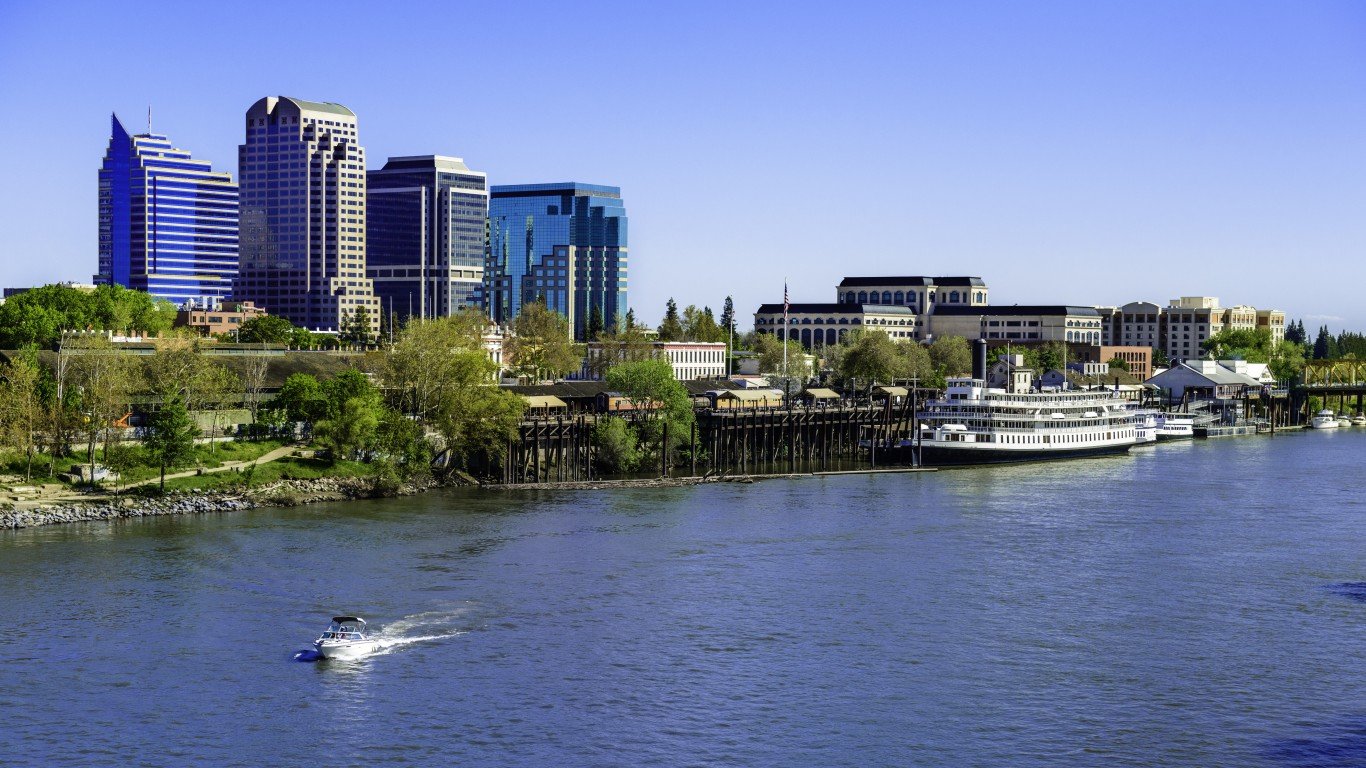
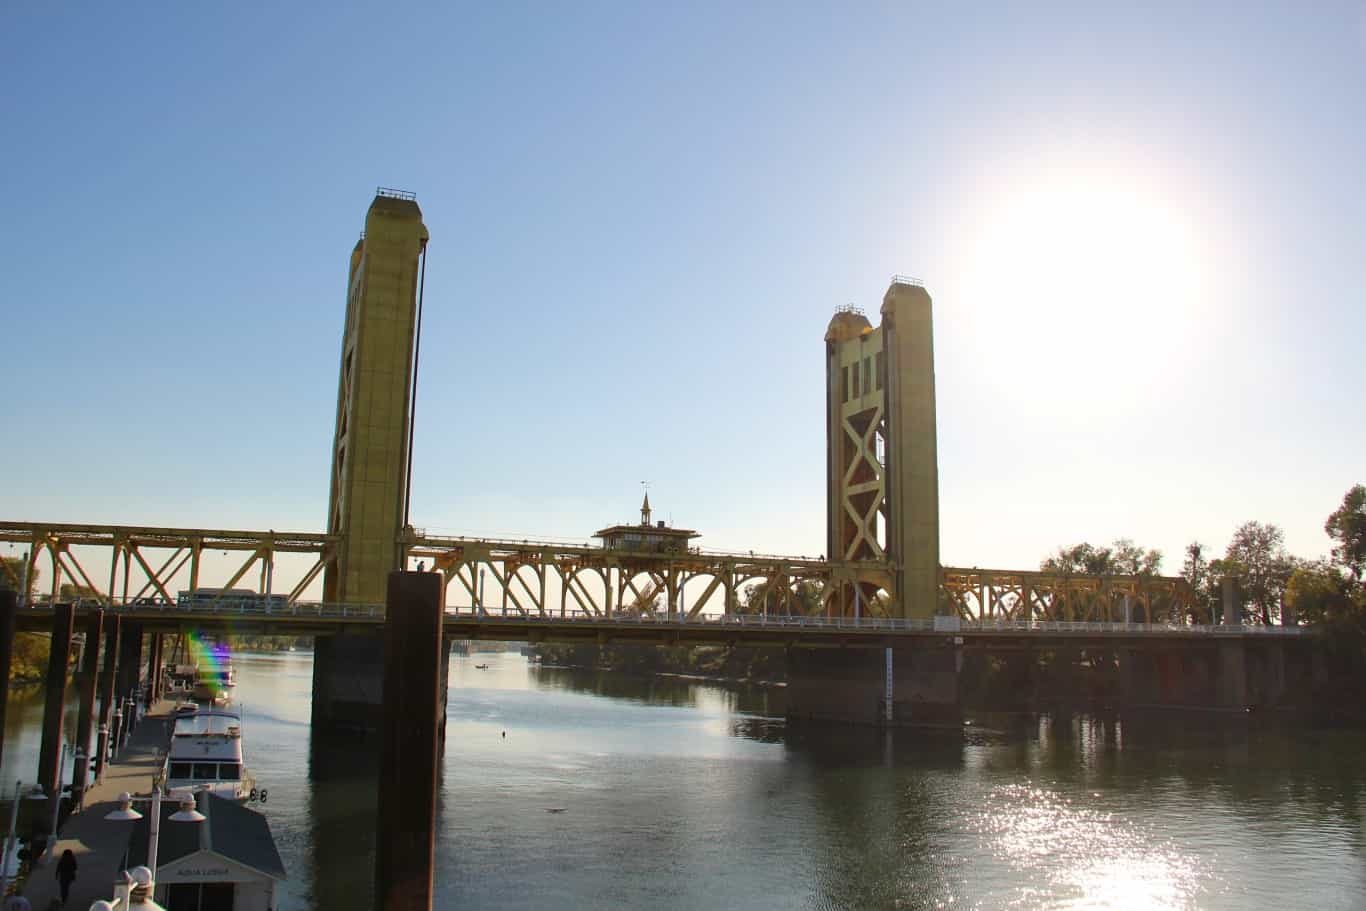
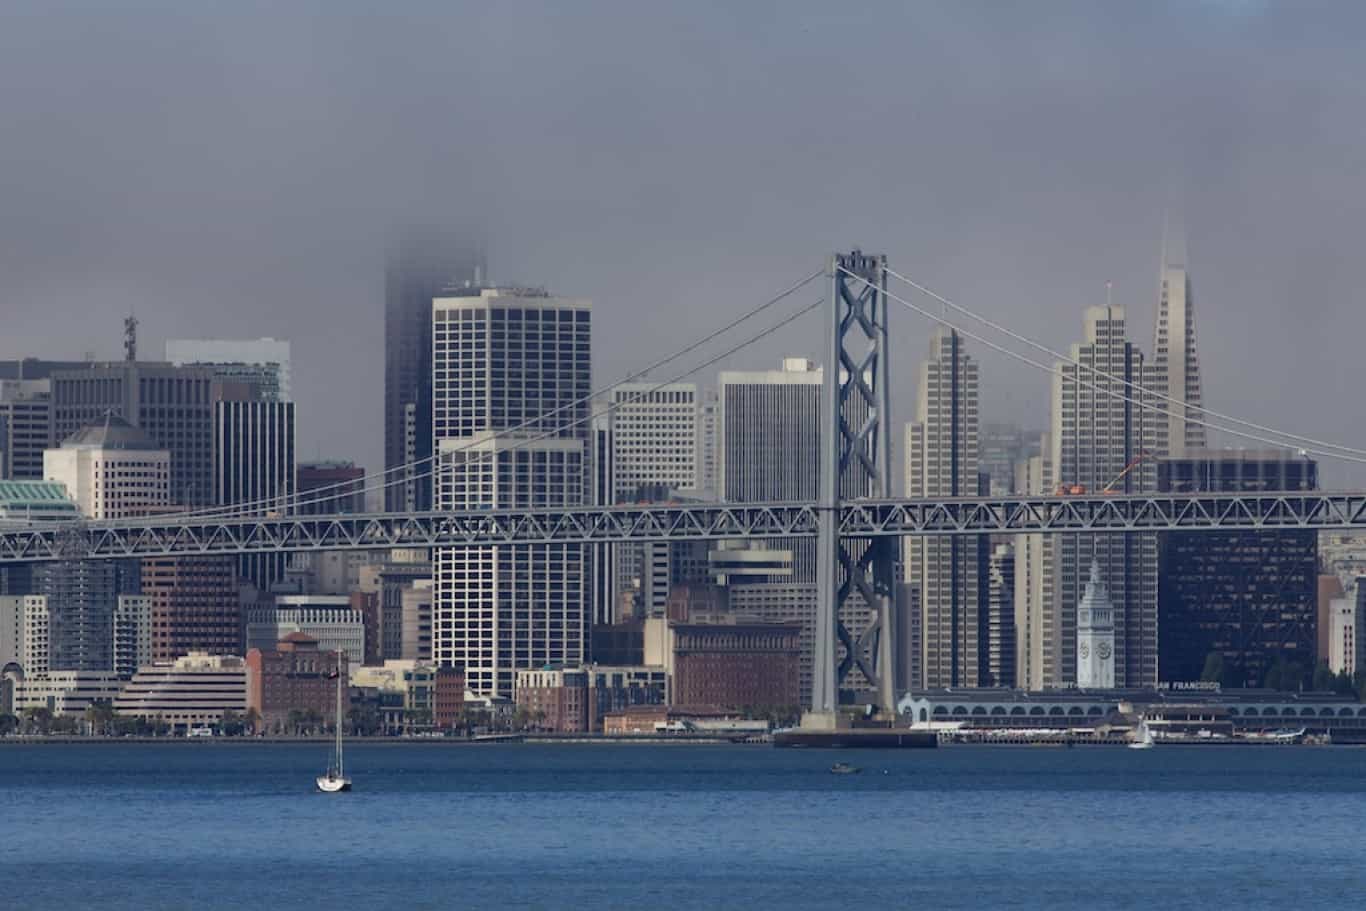
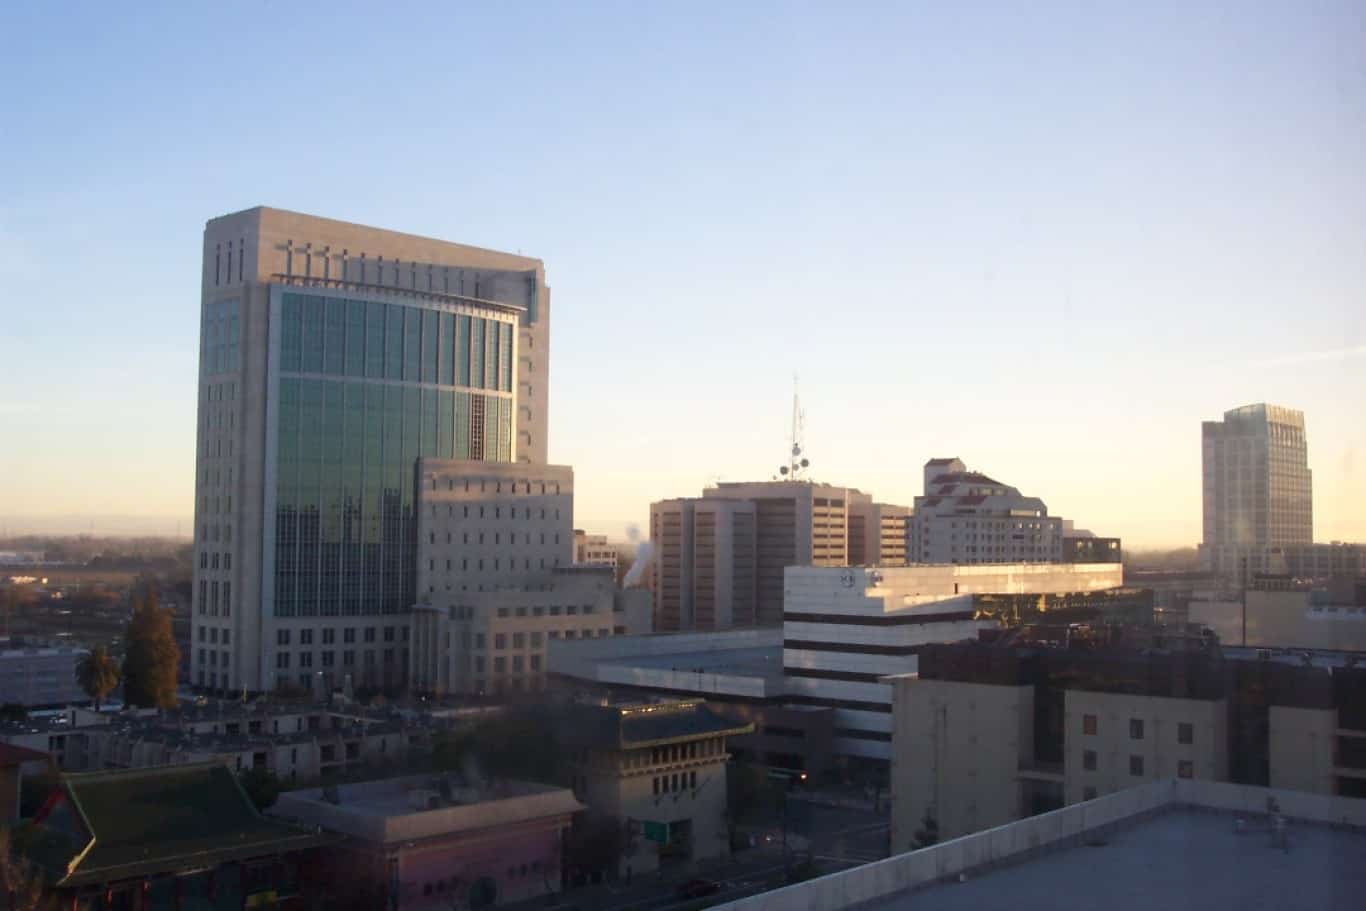
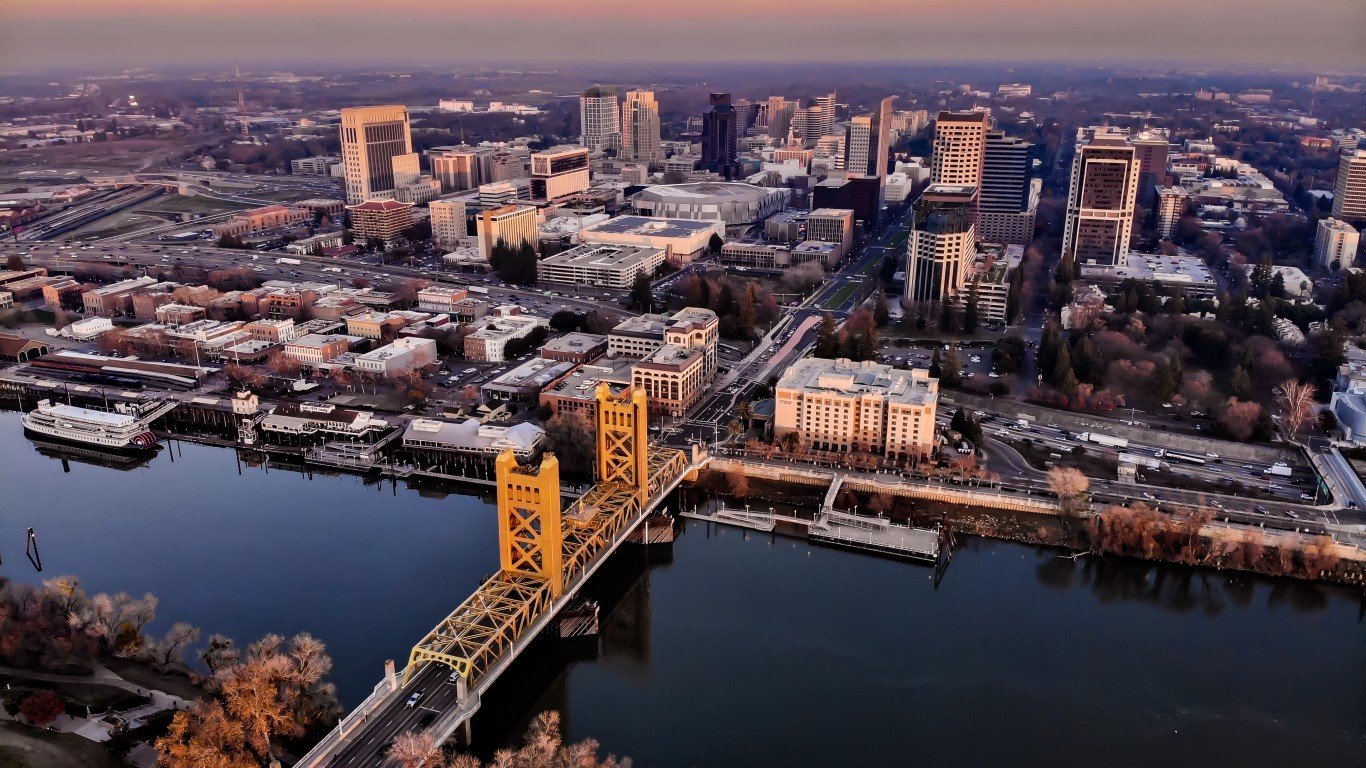
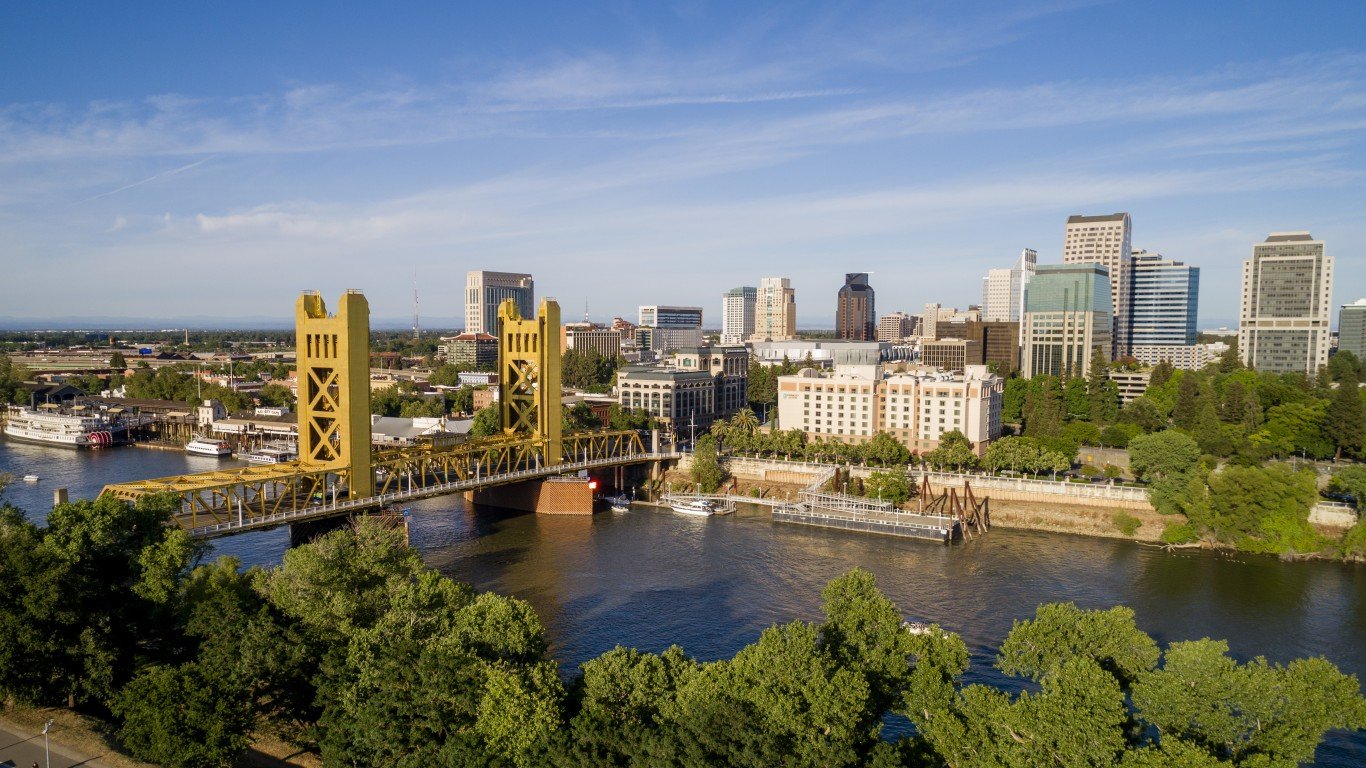
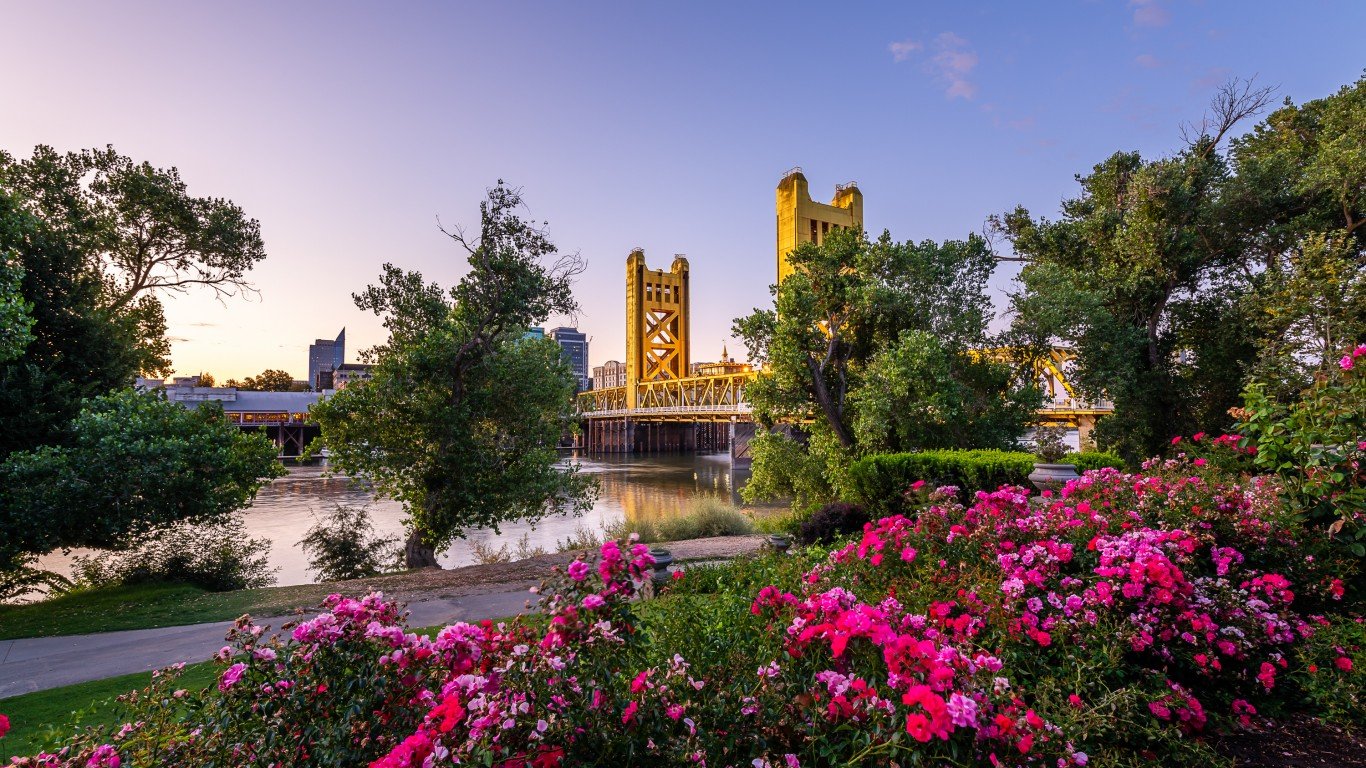
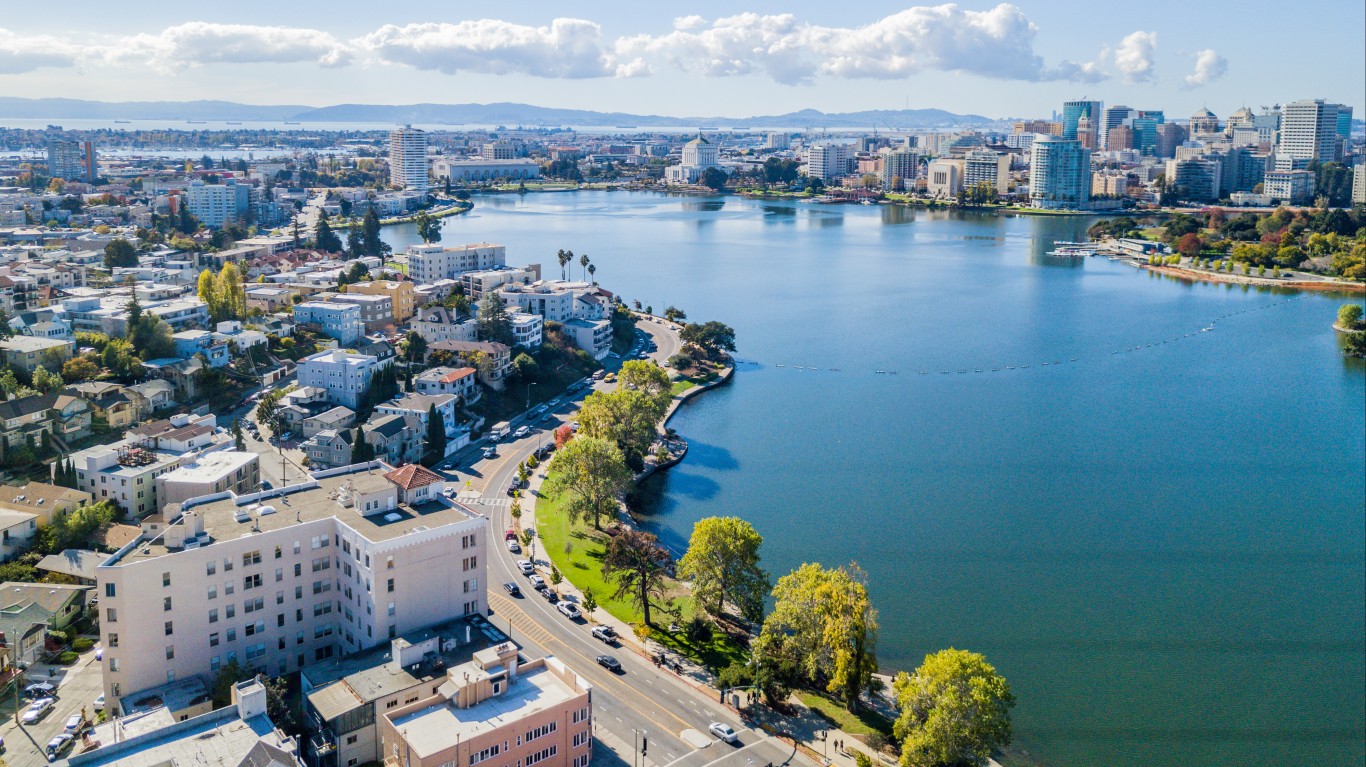
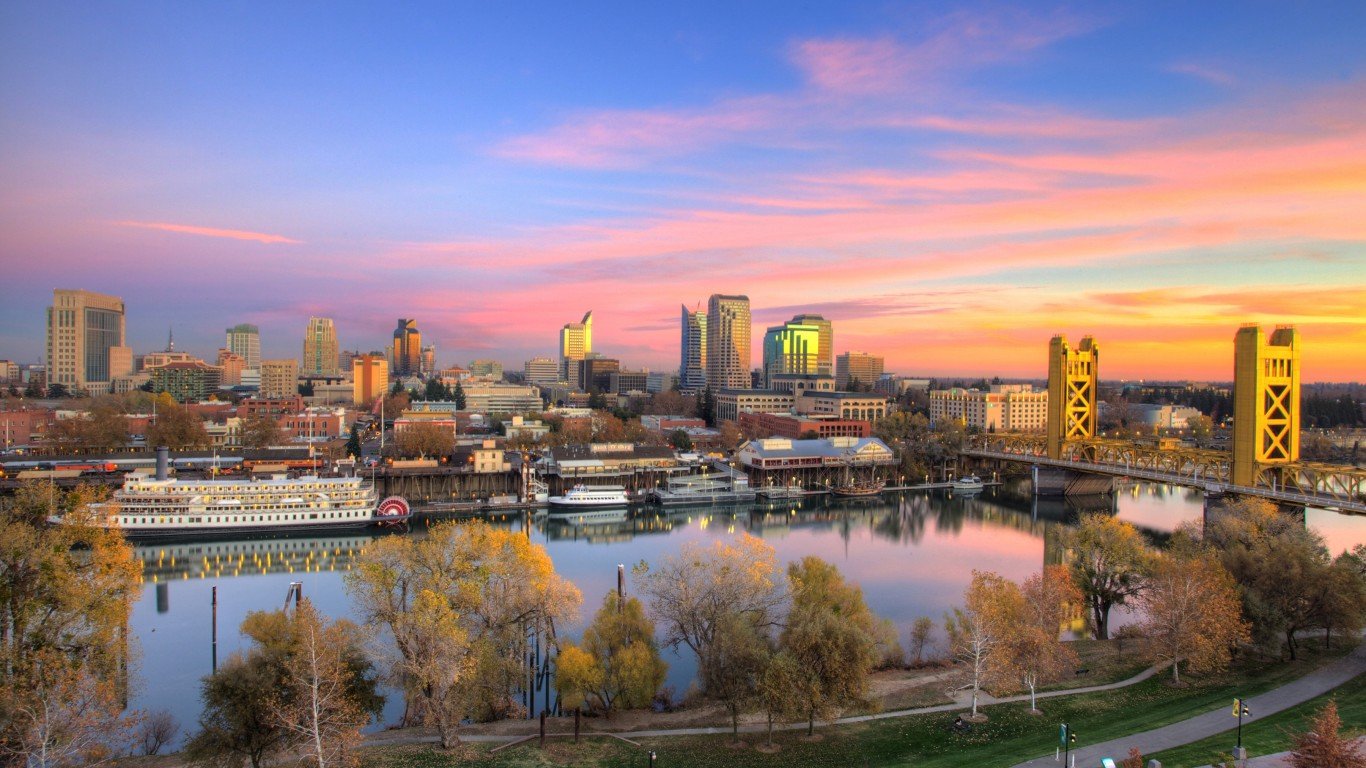
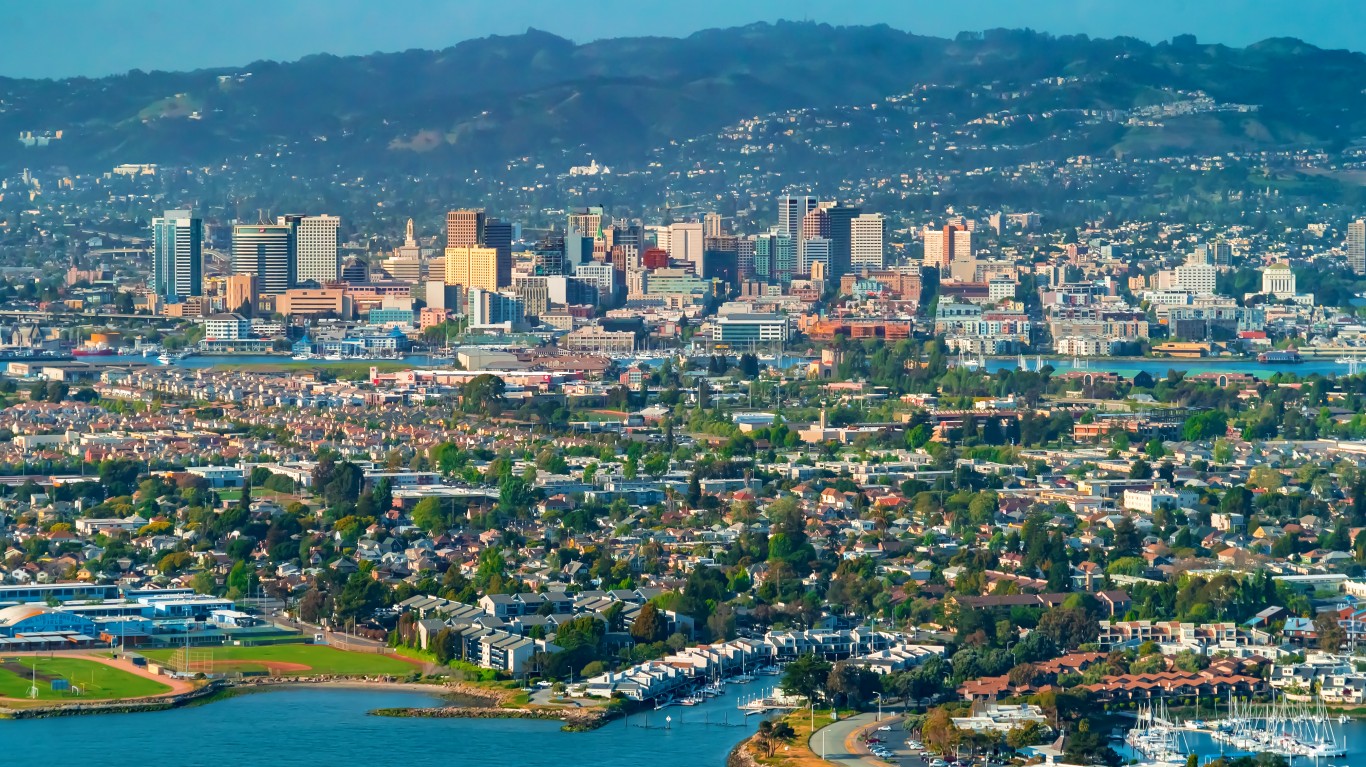
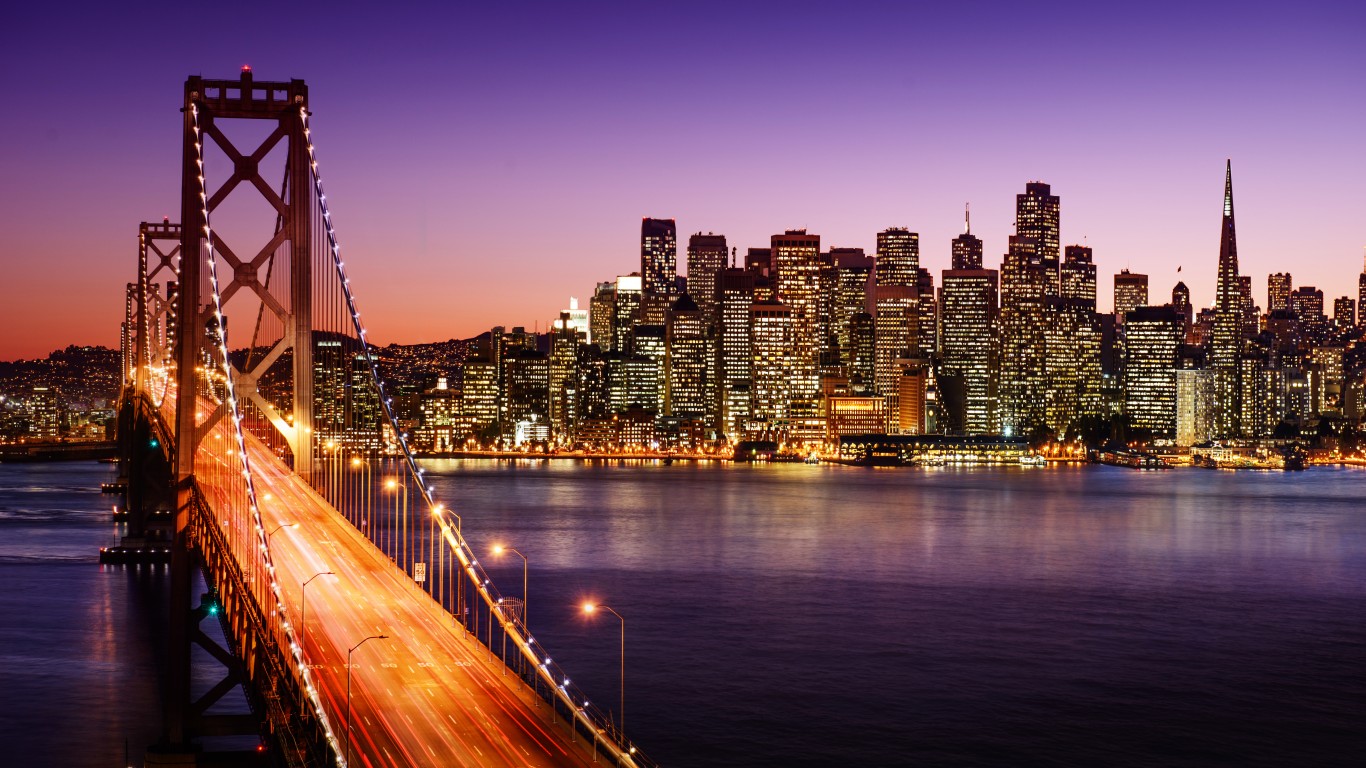
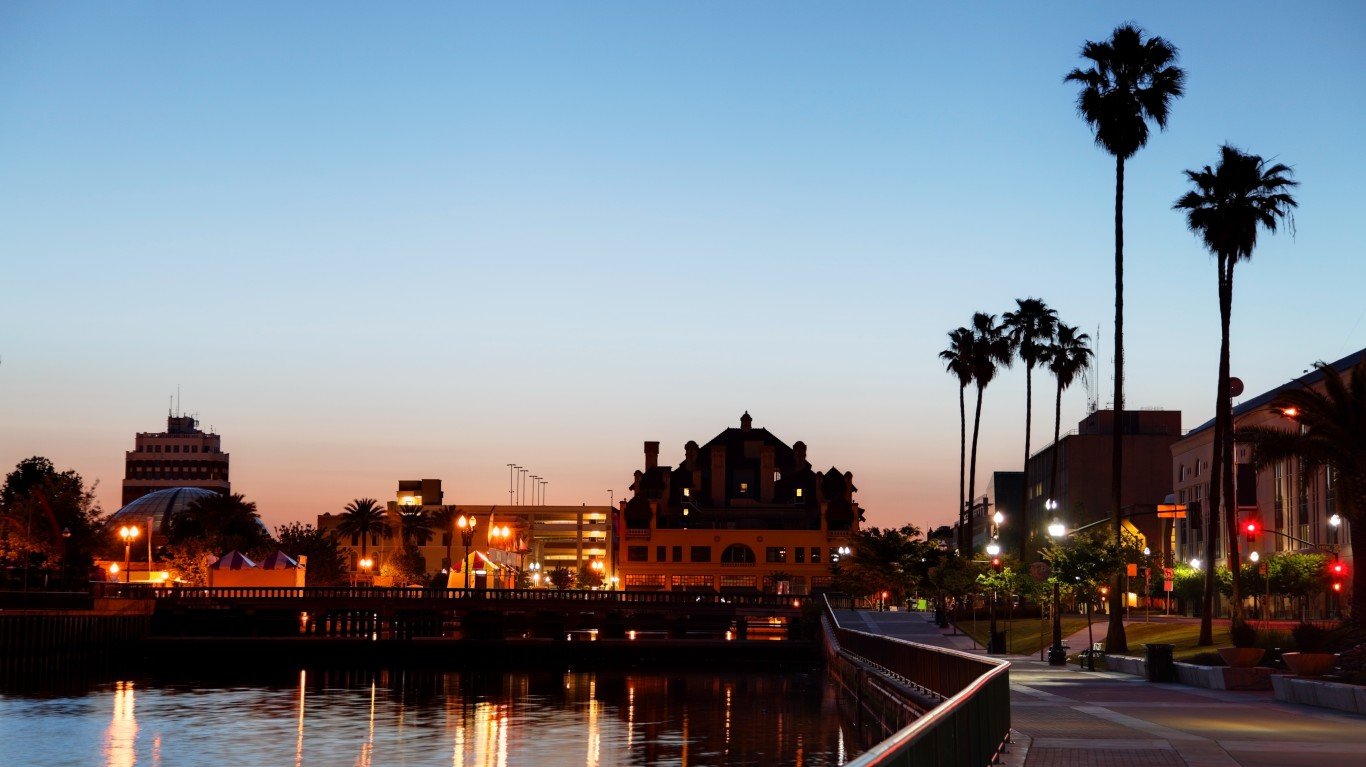
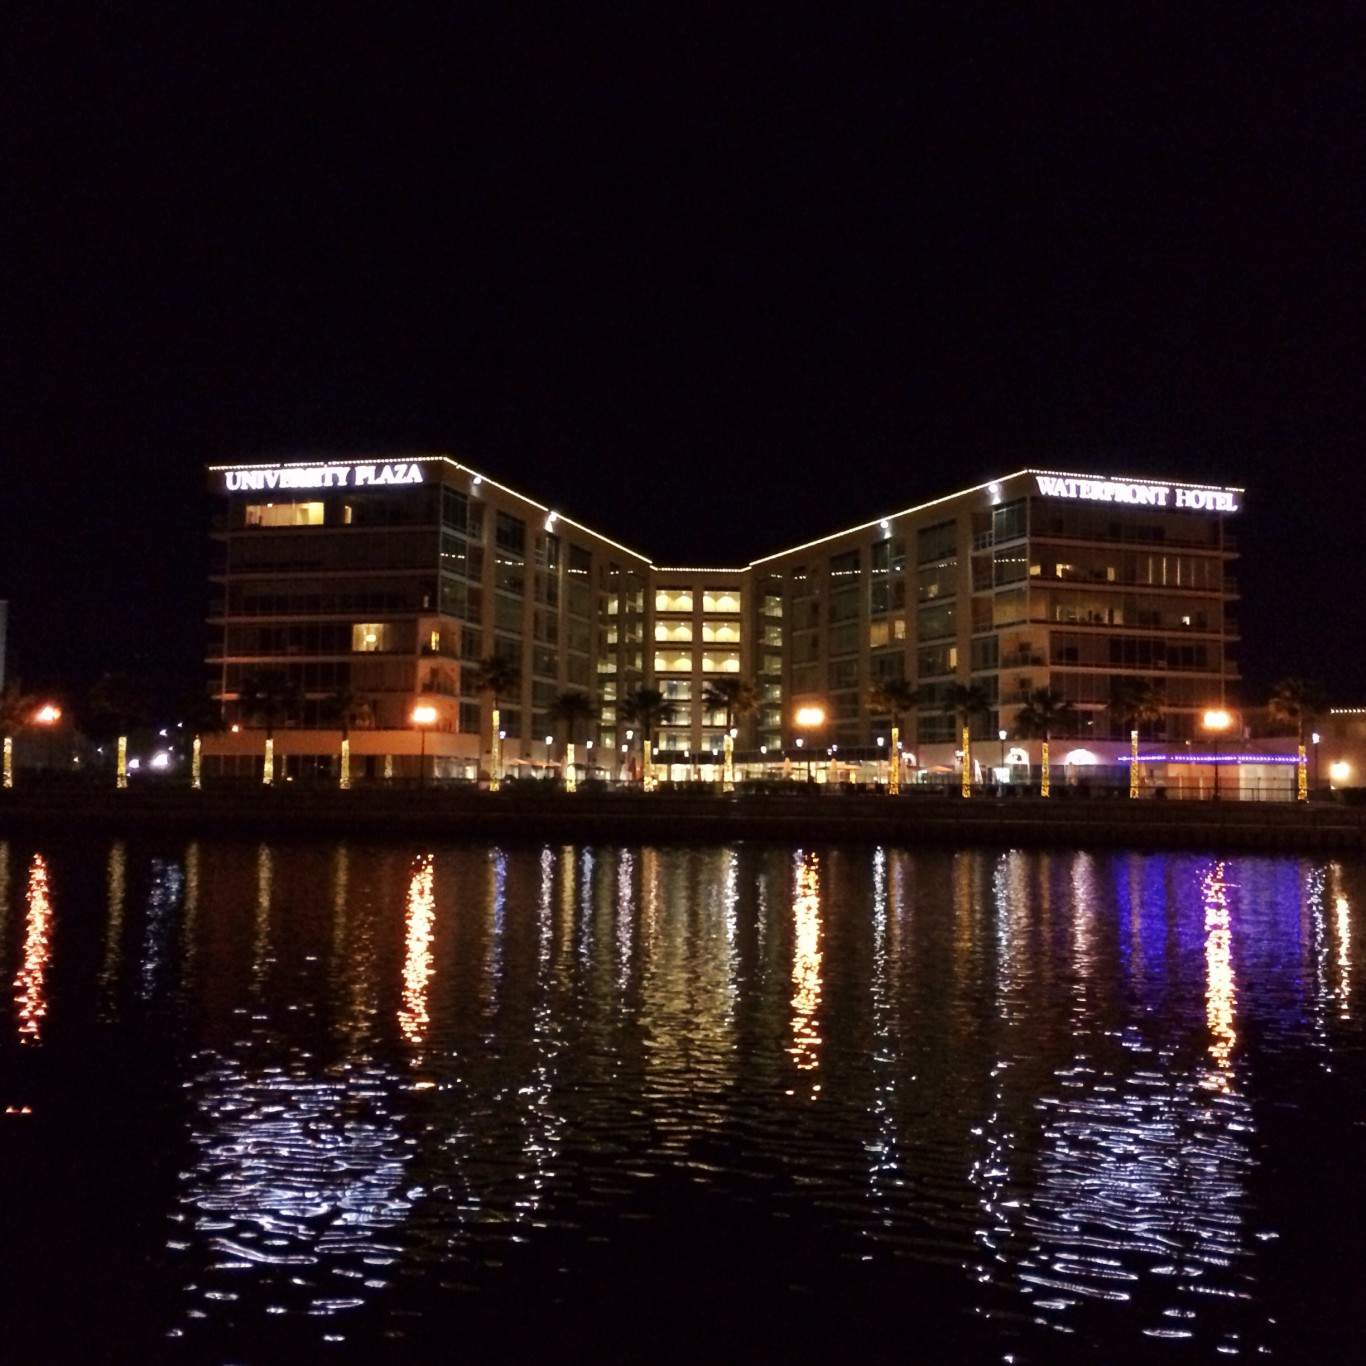
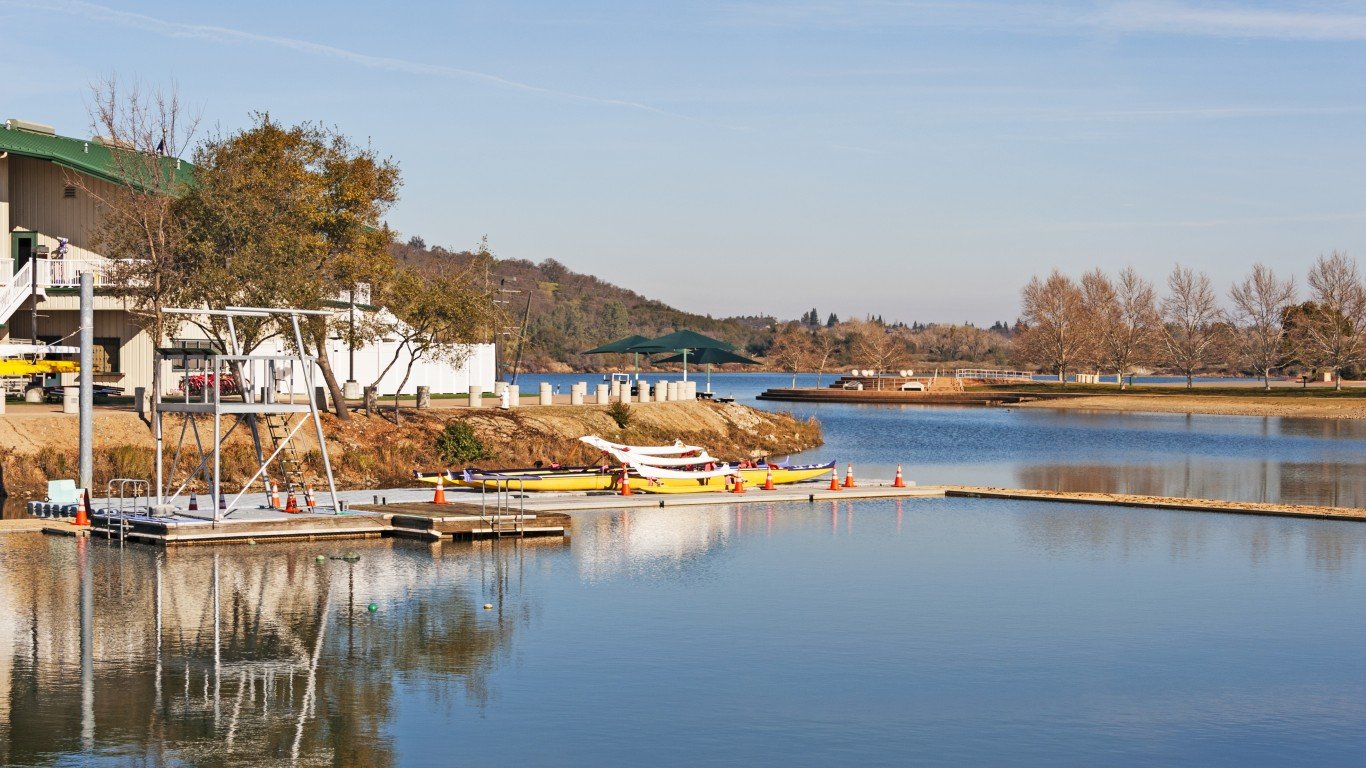
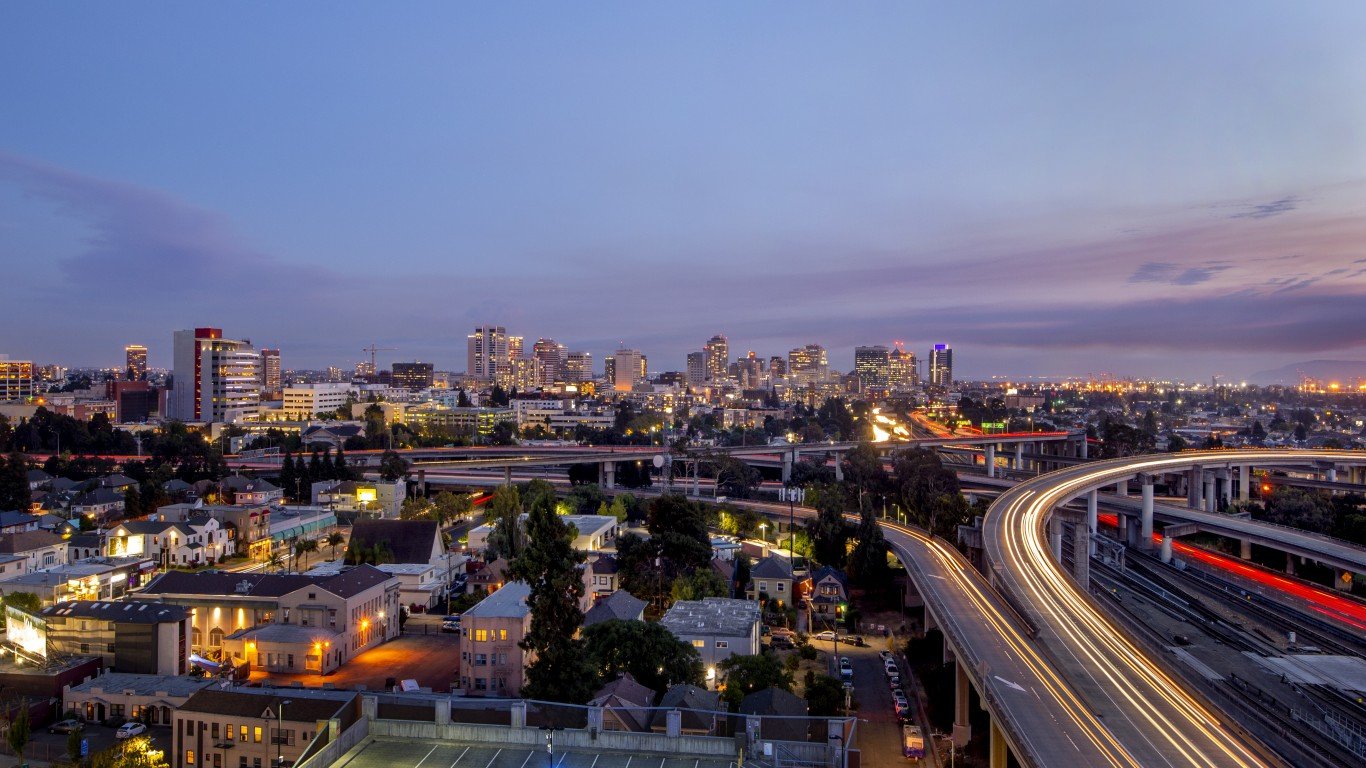
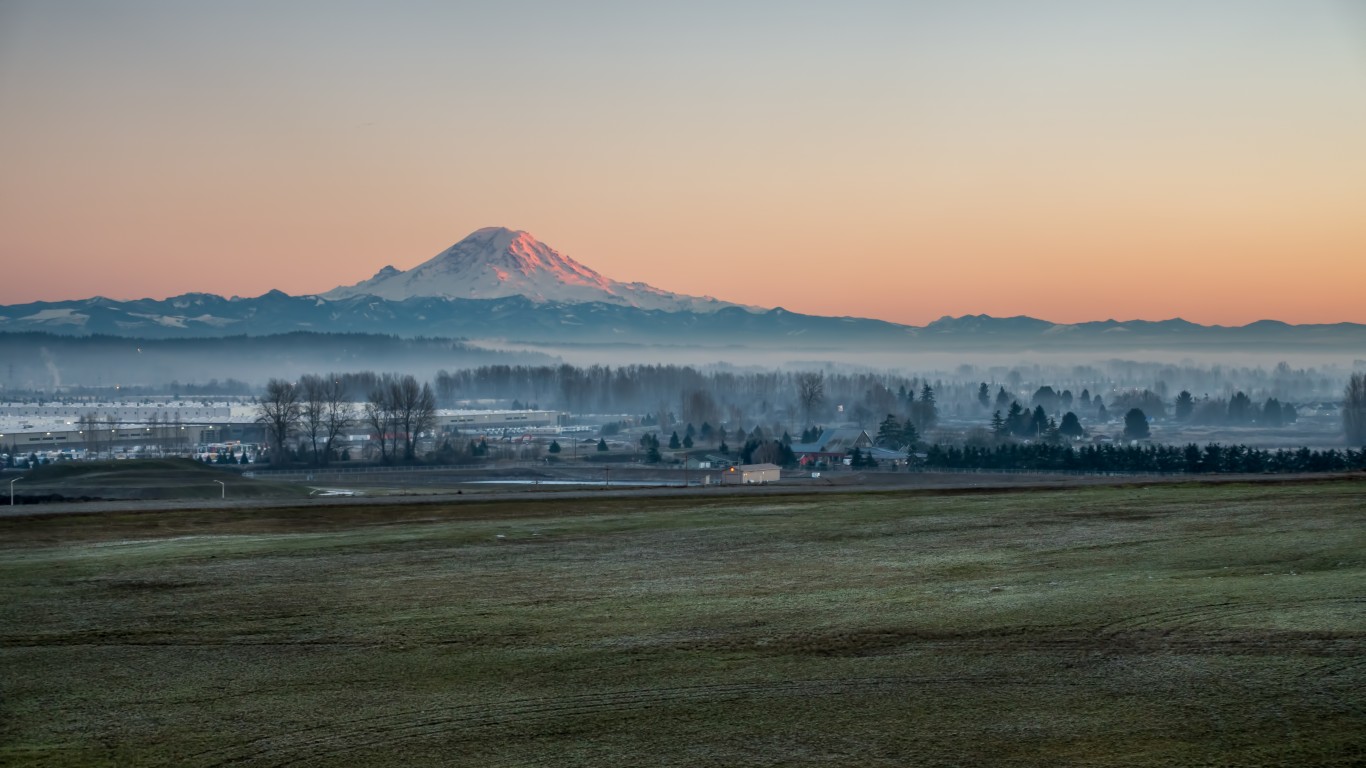
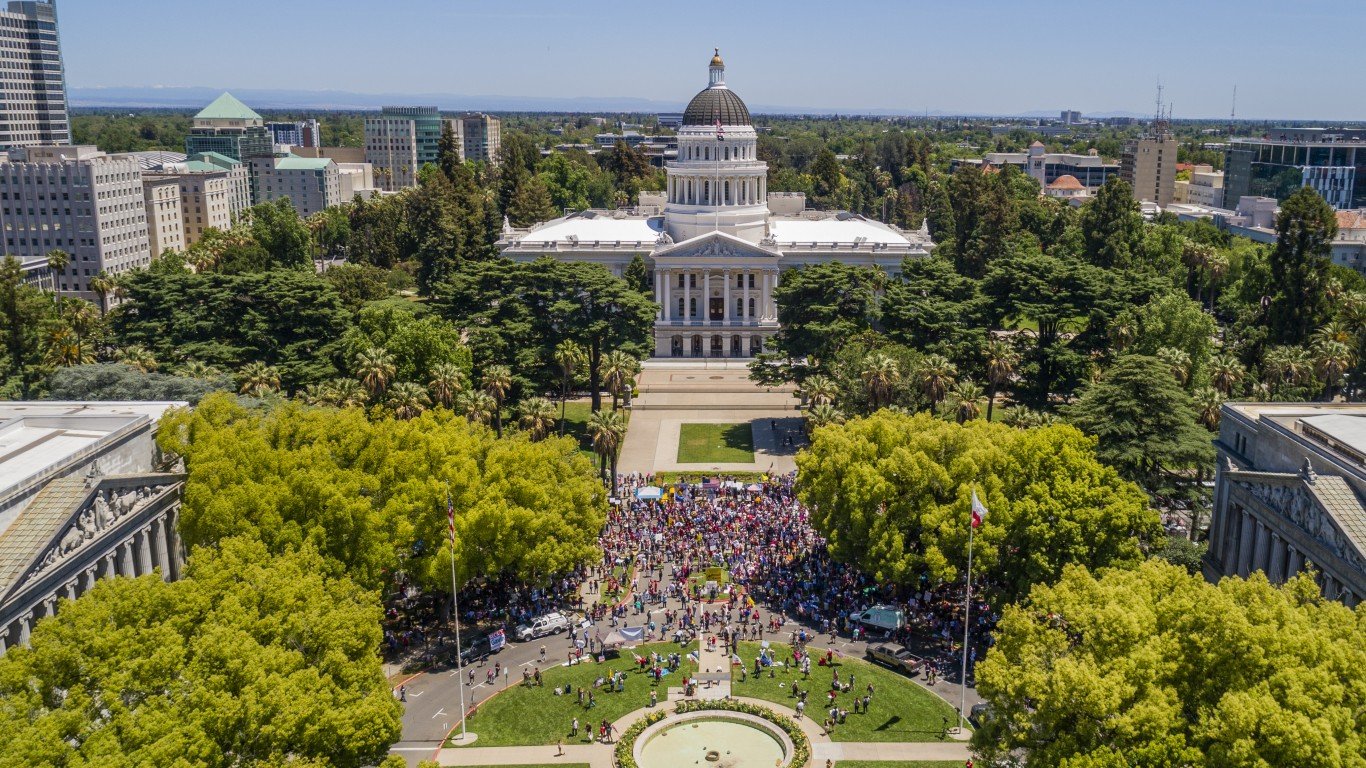
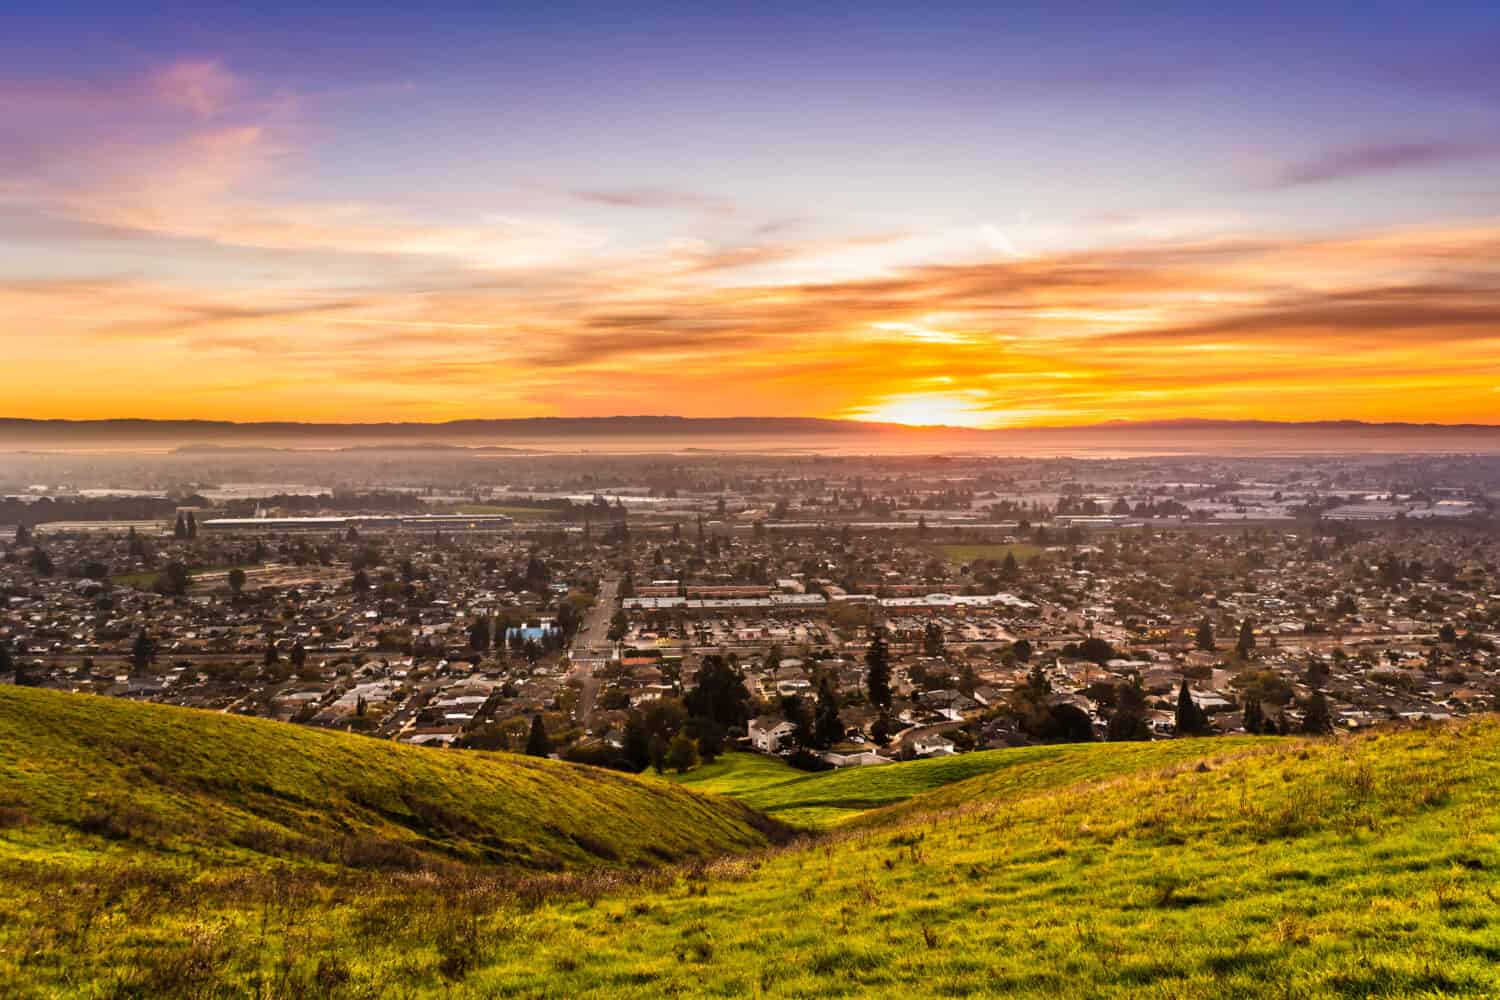
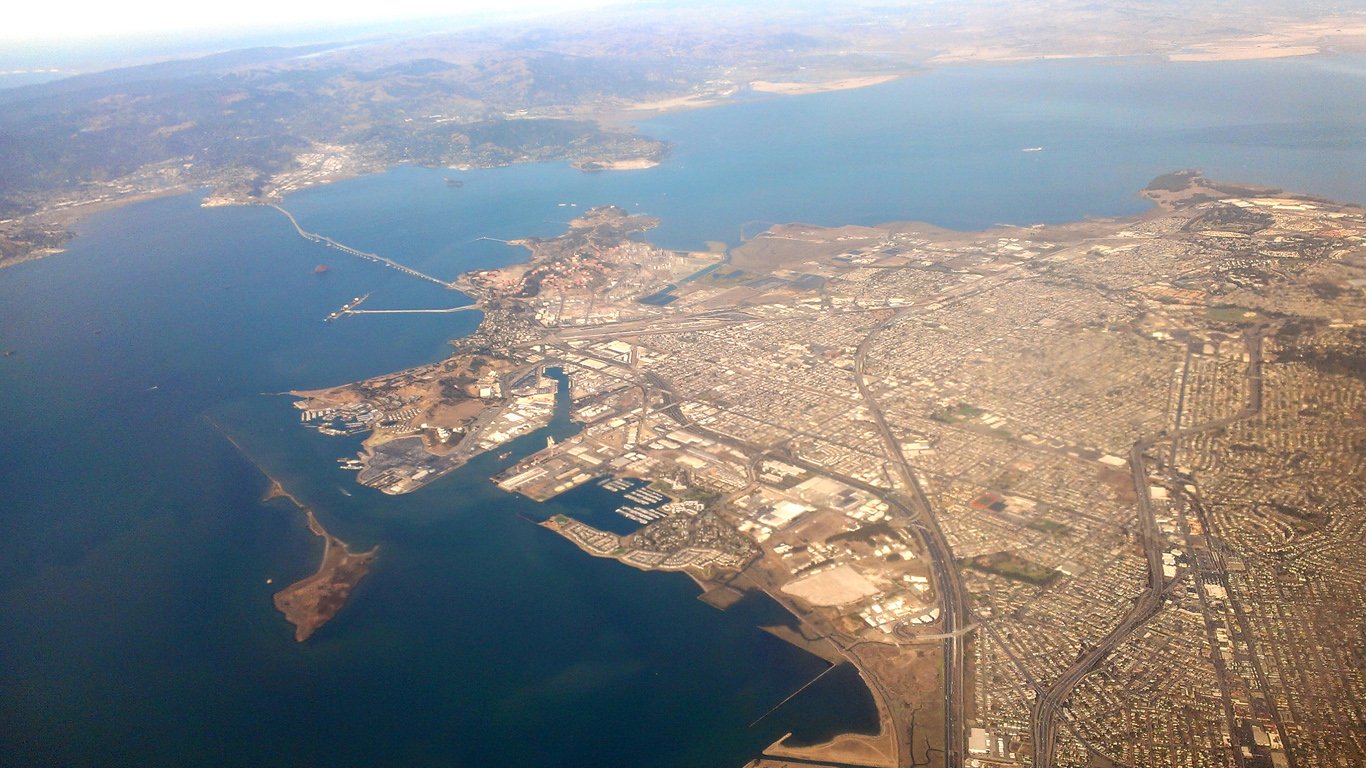
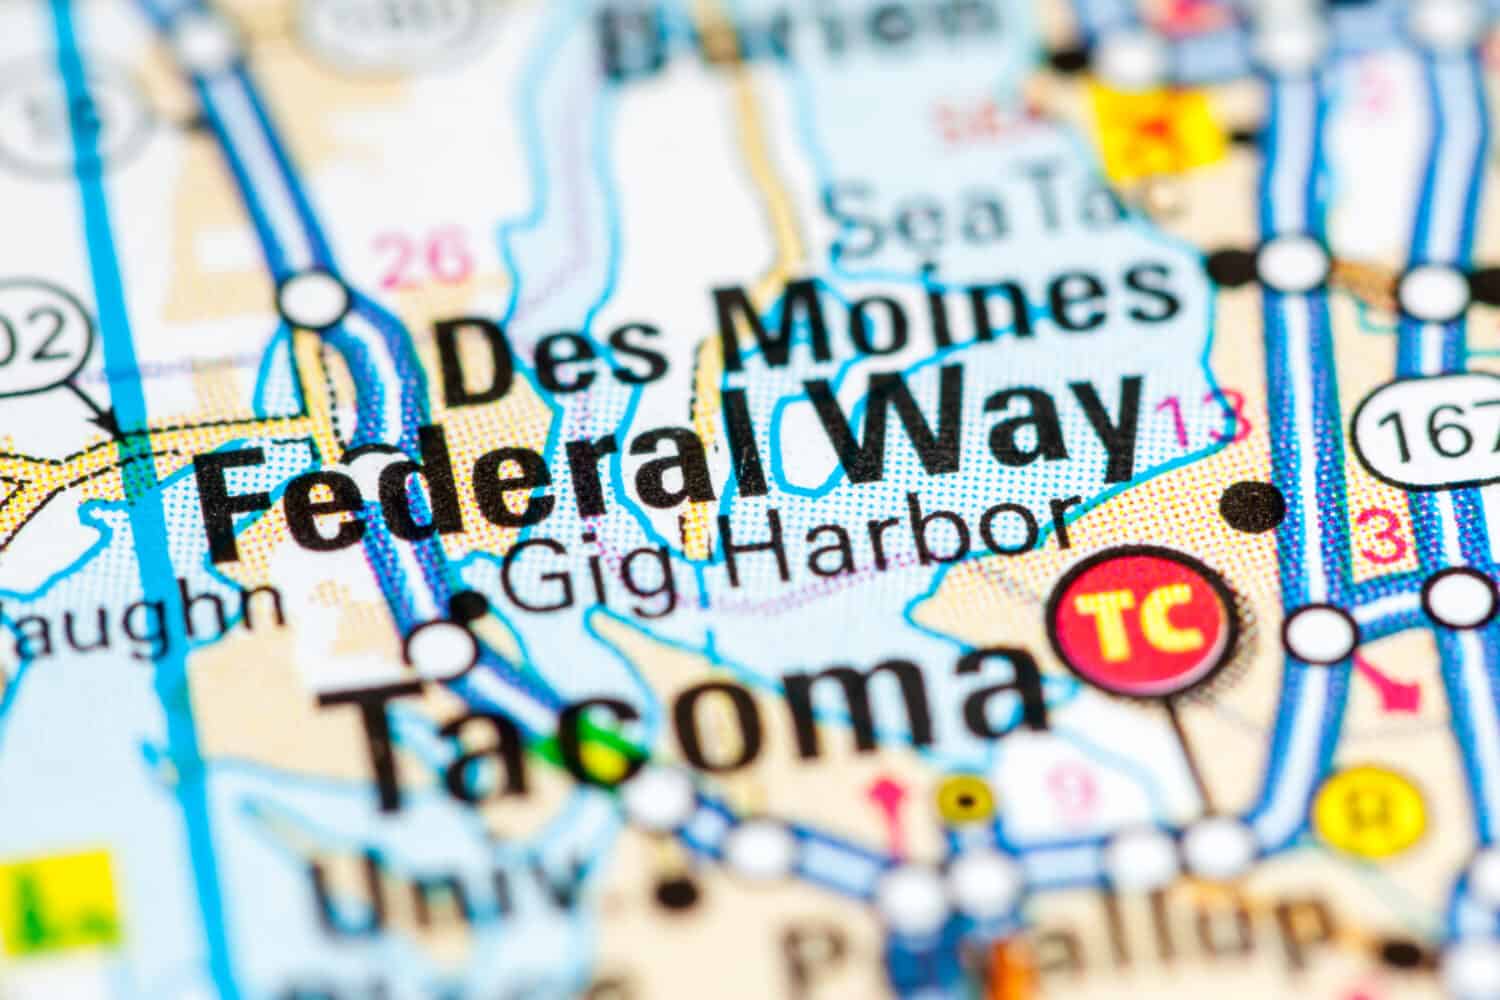
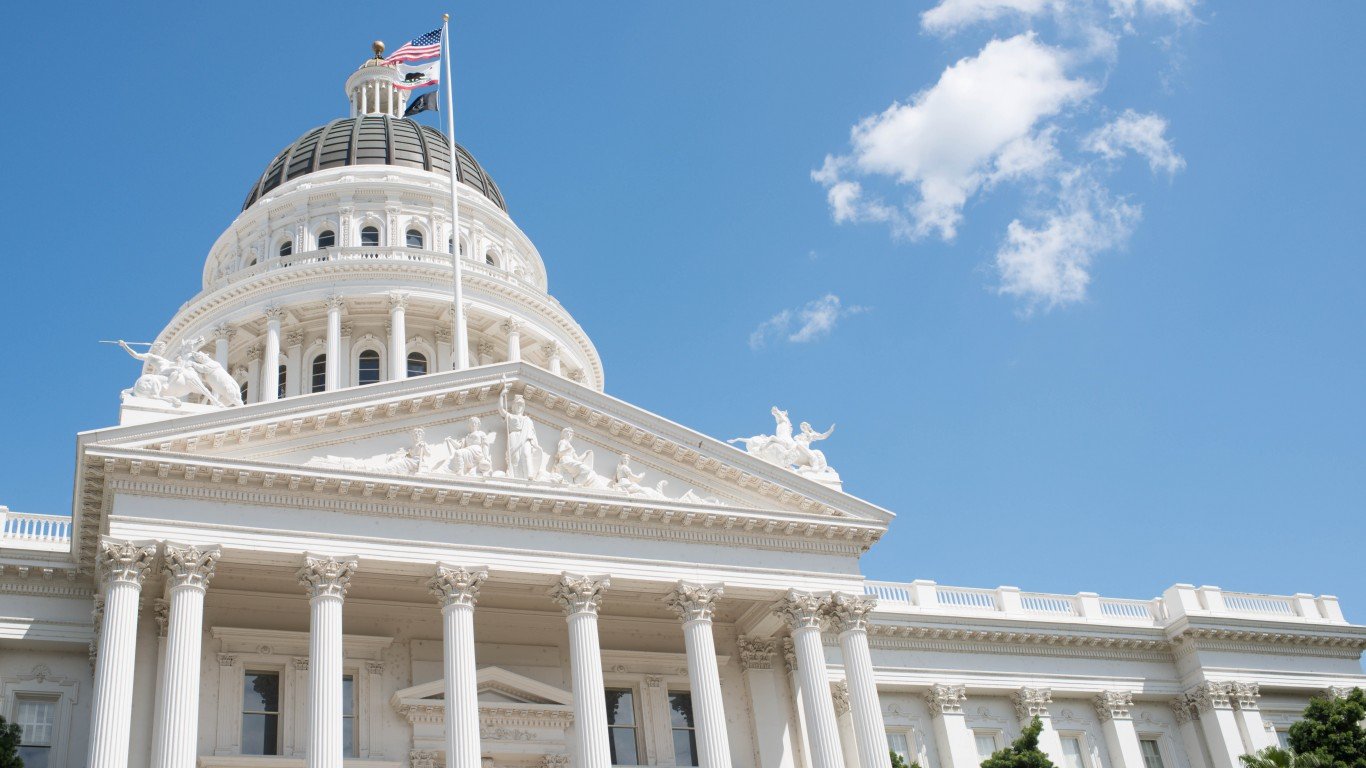
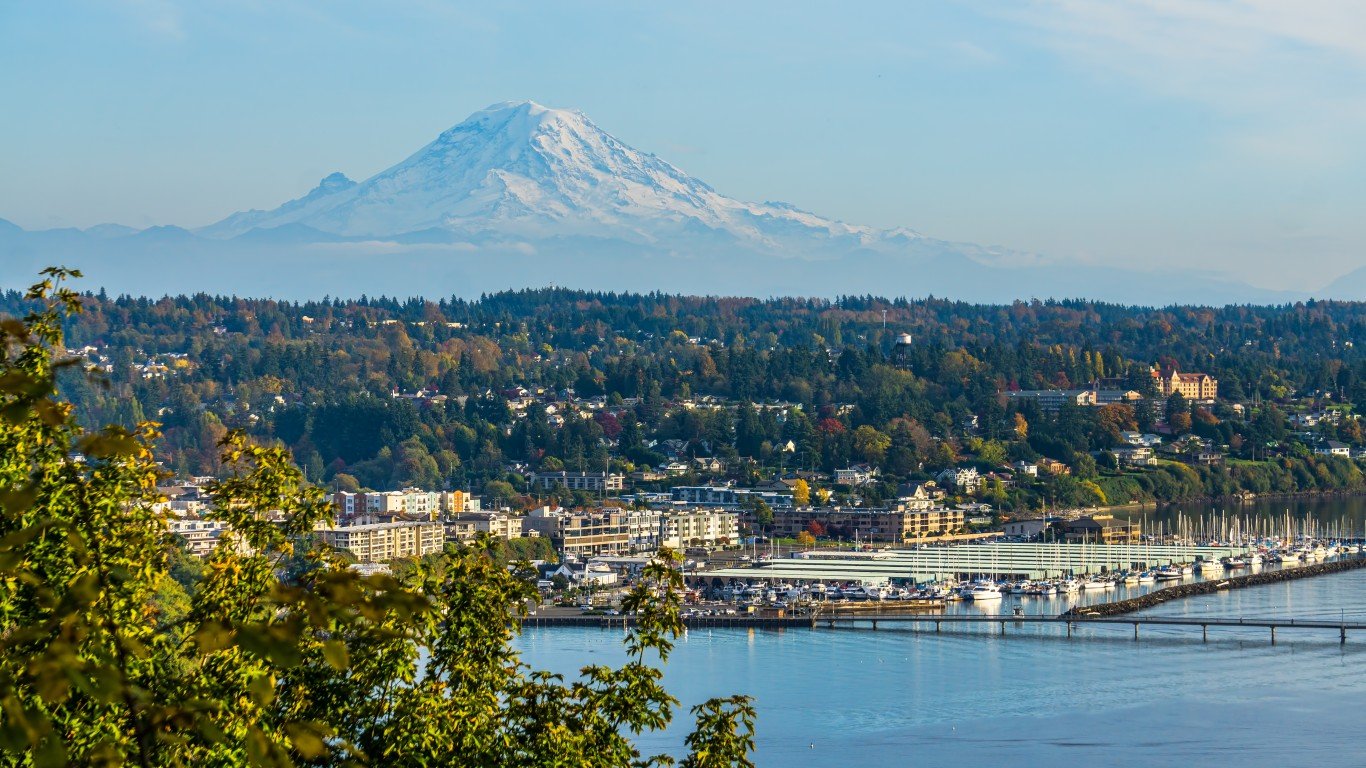
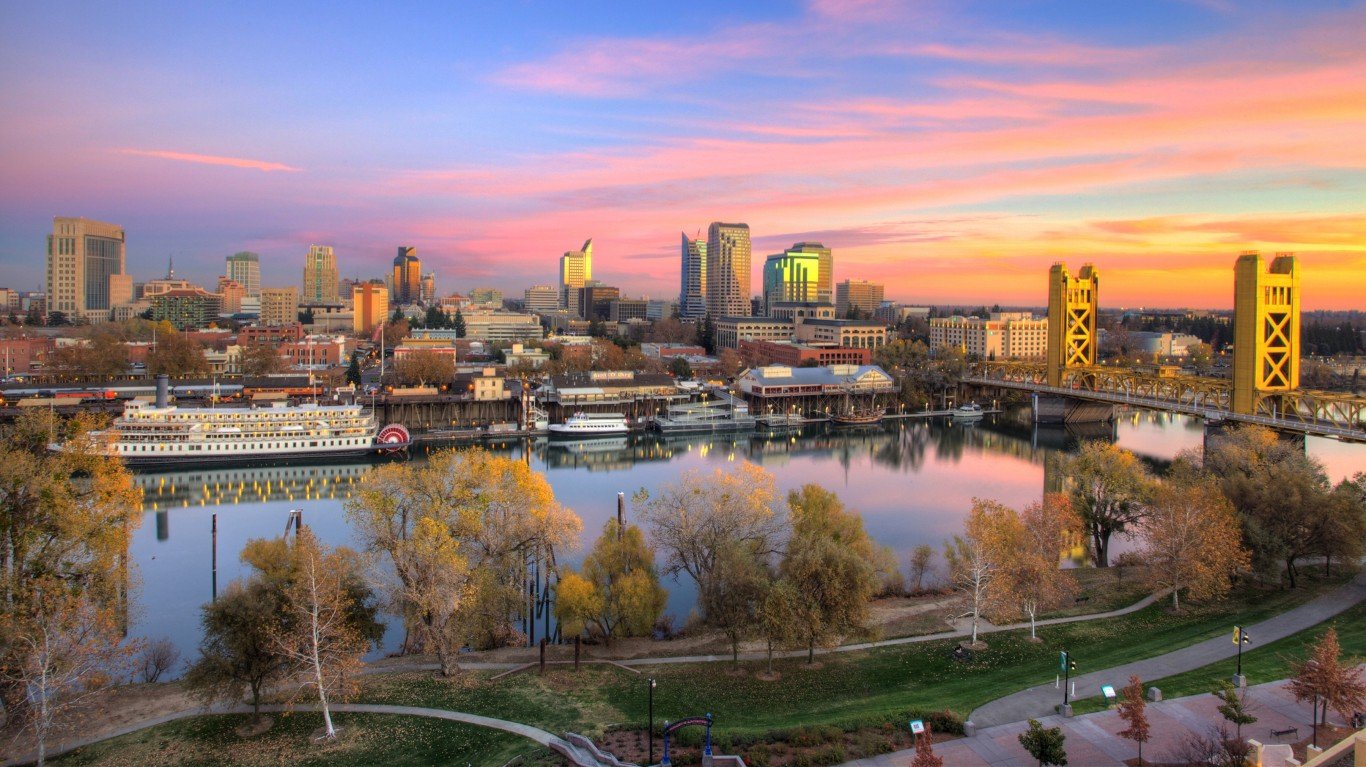
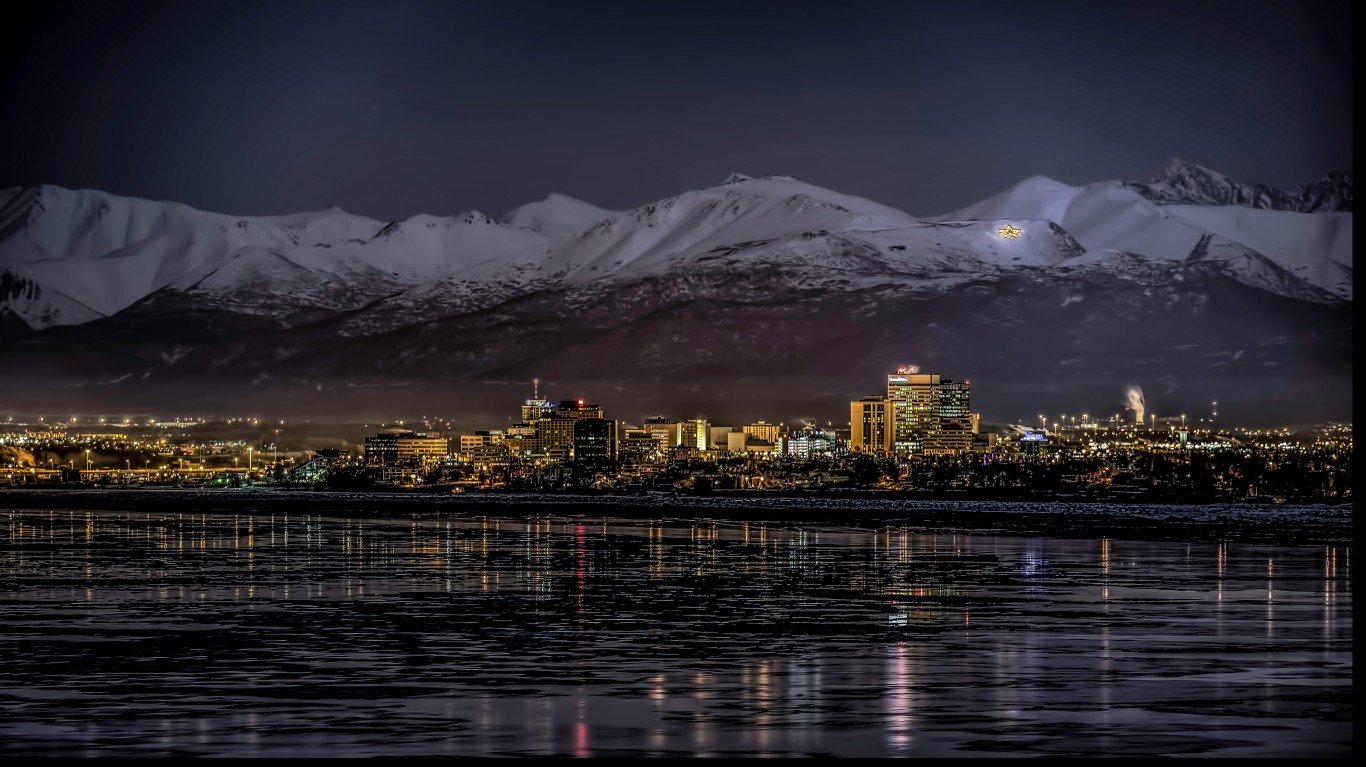
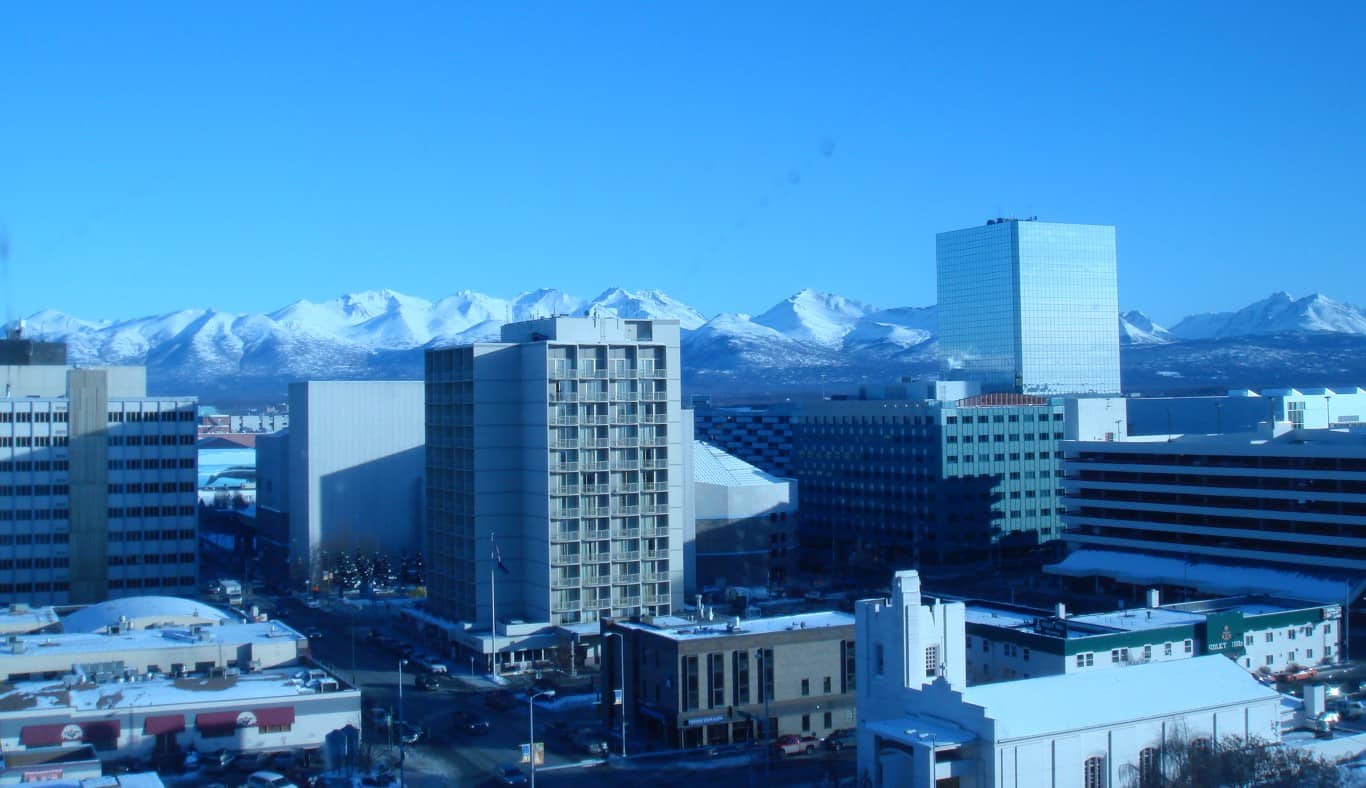
It may be surprising considering that it is the second most populous metropolitan area nationwide, but only one neighborhood in Los Angeles is on the list — Downtown LA. However, neighborhoods in cities in the Bay Area constitute a large portion of the list. This includes 14 neighborhoods in Sacramento, eight in Oakland, and a few more in nearby cities. In all, 39 neighborhoods are in California, eight in Washington state, and three in Alaska, including the two most diverse on the list. (Also see: The Most Diverse Neighborhoods On the East Coast.)
Among the most diverse neighborhoods, housing tends to be expensive, with home values generally above the U.S. typical home value in November 2023 of $342,099. Of the 47 neighborhoods with housing value data, only five have lower home values. Meanwhile, two neighborhoods, one in Hayward, California, and one in San Francisco, have home values of over a million.
Full Methodology
To determine the most diverse neighborhoods on the West Coast, 24/7 Wall St. reviewed five-year data on race and ethnicity from the U.S. Census Bureau’s 2022 American Community Survey. The probability that any two residents picked at random will belong to a different racial or ethnic category is equivalent to the sum of the squares of each group’s share of the population, subtracted from 1. The same method is used in the USA Today Diversity Index as well as the racial and ethnic diversity index of the Disseminating Diversity Working Group of the Census Bureau.
Data on population by race and ethnicity were aggregated from the census tract level to the neighborhood level using 2022 census tract boundary definitions from the U.S. Census Bureau and 2017 neighborhood boundary definitions from Zillow. Census tracts with at least 50% spatial overlap within the neighborhood boundary were included in population aggregation. Data on estimated median home value is the November 2023 Zillow Home Value Index, a measure of typical home values for homes in the 35th to 65th percentile range.
50. Prospect Park (Rancho Cordova, CA)
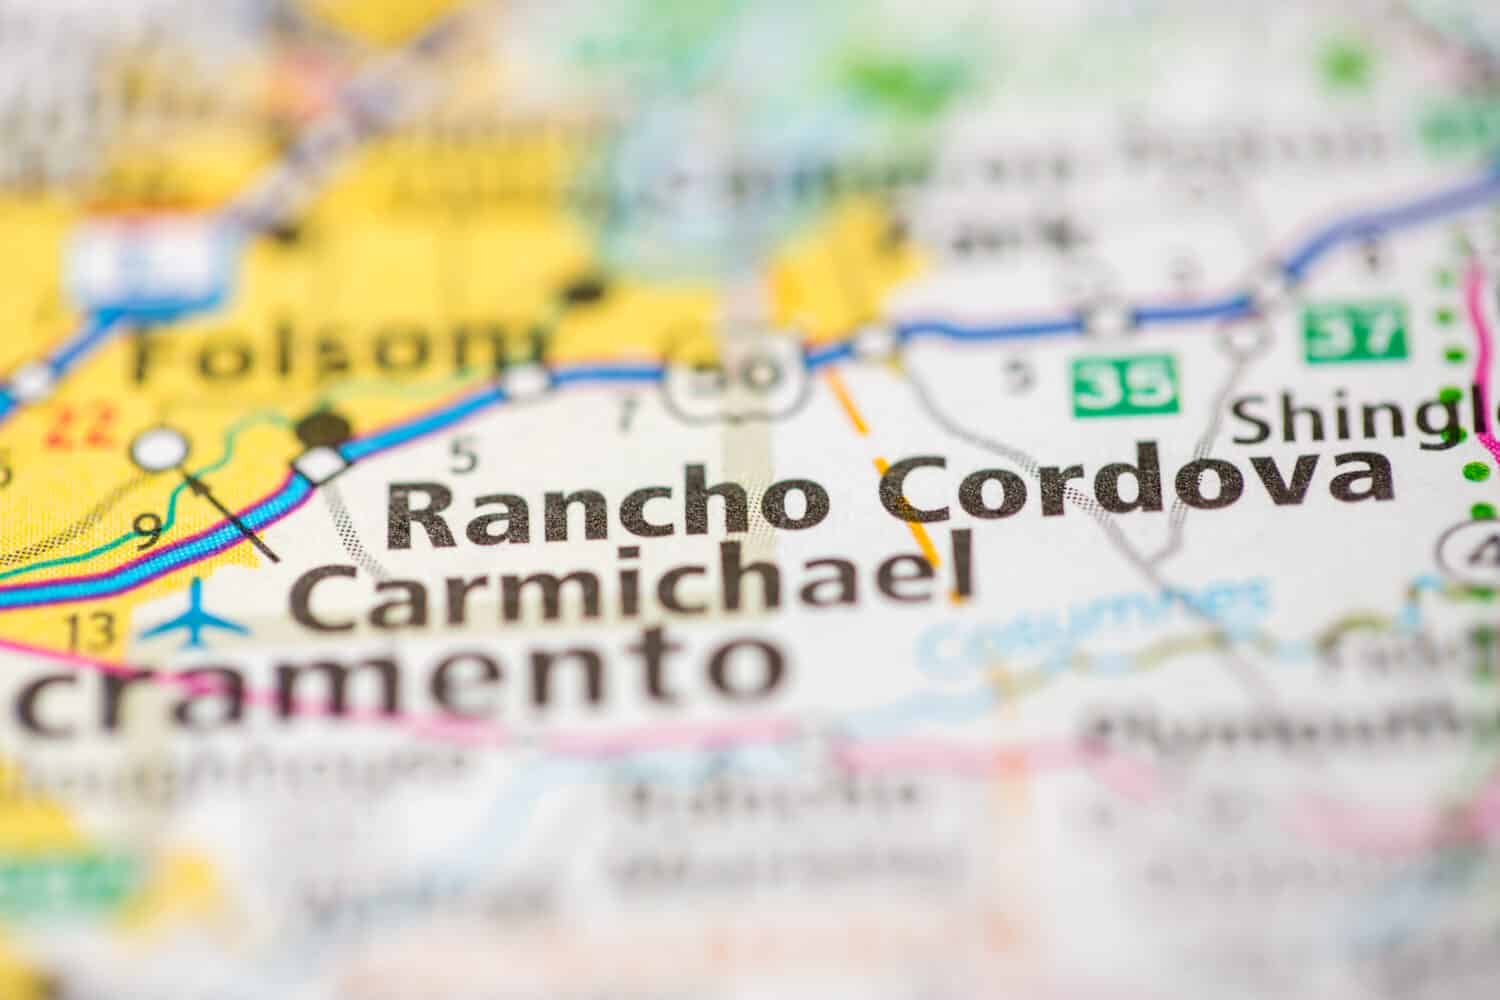
- Likelihood two random residents are different race or ethnicity: 75.7%
- Most prevalent race or ethnicity group: White (36.9%)
- Est. typical home value, Nov 2023: N/A
- Est. population in 2022: 3,611
49. Weberstown (Stockton, CA)
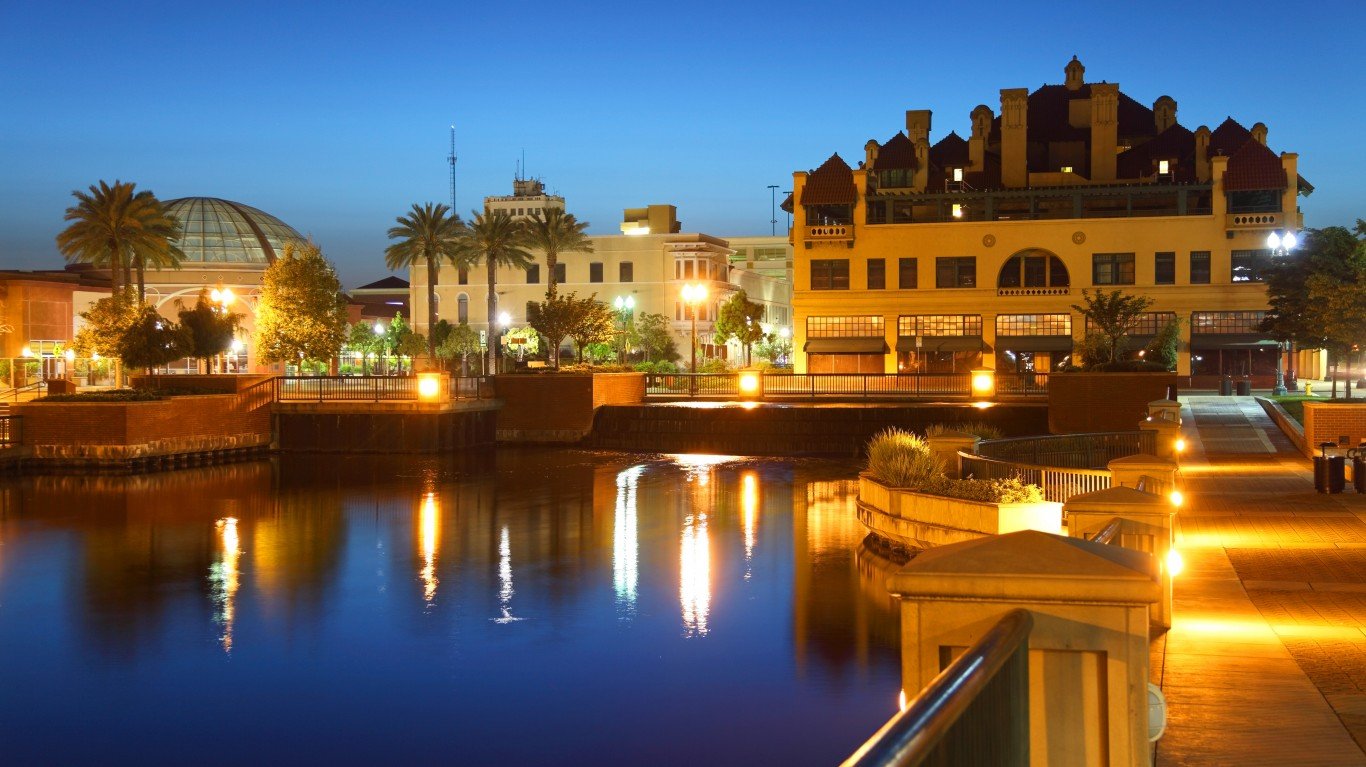
- Likelihood two random residents are different race or ethnicity: 75.7%
- Most prevalent race or ethnicity group: Hispanic or Latino (38.8%)
- Est. typical home value, Nov 2023: $308,032
- Est. population in 2022: 4,676
48. McClymonds (Oakland, CA)
- Likelihood two random residents are different race or ethnicity: 75.7%
- Most prevalent race or ethnicity group: Black or African American (32.8%)
- Est. typical home value, Nov 2023: $695,104
- Est. population in 2022: 2,382
47. Canyon Springs (Riverside, CA)
- Likelihood two random residents are different race or ethnicity: 75.8%
- Most prevalent race or ethnicity group: White (29.1%)
- Est. typical home value, Nov 2023: N/A
- Est. population in 2022: 1,390
46. Lakeview (Lakewood, WA)
- Likelihood two random residents are different race or ethnicity: 75.8%
- Most prevalent race or ethnicity group: White (35.8%)
- Est. typical home value, Nov 2023: $363,494
- Est. population in 2022: 4,300
45. Pocket (Sacramento, CA)
- Likelihood two random residents are different race or ethnicity: 75.8%
- Most prevalent race or ethnicity group: White (33.1%)
- Est. typical home value, Nov 2023: $603,487
- Est. population in 2022: 27,258
44. Pocket (Sacramento, CA)
- Likelihood two random residents are different race or ethnicity: 75.8%
- Most prevalent race or ethnicity group: White (33.1%)
- Est. typical home value, Nov 2023: $603,487
- Est. population in 2022: 27,258
43. Airport (Sacramento, CA)
- Likelihood two random residents are different race or ethnicity: 76.0%
- Most prevalent race or ethnicity group: Hispanic or Latino (36.4%)
- Est. typical home value, Nov 2023: $415,715
- Est. population in 2022: 3,661
42. RP Sports Complex (Sacramento, CA)
- Likelihood two random residents are different race or ethnicity: 76.0%
- Most prevalent race or ethnicity group: Asian (36.4%)
- Est. typical home value, Nov 2023: N/A
- Est. population in 2022: 5,010
41. Clinton (Oakland, CA)
- Likelihood two random residents are different race or ethnicity: 76.0%
- Most prevalent race or ethnicity group: Asian (34.7%)
- Est. typical home value, Nov 2023: $661,852
- Est. population in 2022: 7,794
40. School (Oakland, CA)

- Likelihood two random residents are different race or ethnicity: 76.1%
- Most prevalent race or ethnicity group: Hispanic or Latino (34.1%)
- Est. typical home value, Nov 2023: $712,763
- Est. population in 2022: 1,605
39. Village 11 (Sacramento, CA)
- Likelihood two random residents are different race or ethnicity: 76.1%
- Most prevalent race or ethnicity group: White (32.3%)
- Est. typical home value, Nov 2023: $529,180
- Est. population in 2022: 4,900
38. Dower (Lakewood, WA)
- Likelihood two random residents are different race or ethnicity: 76.1%
- Most prevalent race or ethnicity group: Black or African American (31.5%)
- Est. typical home value, Nov 2023: $470,947
- Est. population in 2022: 3,239
37. Meadowview (Sacramento, CA)
- Likelihood two random residents are different race or ethnicity: 76.2%
- Most prevalent race or ethnicity group: Hispanic or Latino (35.3%)
- Est. typical home value, Nov 2023: $390,273
- Est. population in 2022: 34,794
36. Village 2 (Sacramento, CA)
- Likelihood two random residents are different race or ethnicity: 76.2%
- Most prevalent race or ethnicity group: White (30.9%)
- Est. typical home value, Nov 2023: $570,640
- Est. population in 2022: 5,401
35. Robla (Sacramento, CA)
- Likelihood two random residents are different race or ethnicity: 76.3%
- Most prevalent race or ethnicity group: Hispanic or Latino (31.5%)
- Est. typical home value, Nov 2023: $424,355
- Est. population in 2022: 7,961
34. Allendale (Oakland, CA)
- Likelihood two random residents are different race or ethnicity: 76.3%
- Most prevalent race or ethnicity group: Hispanic or Latino (36.4%)
- Est. typical home value, Nov 2023: $632,262
- Est. population in 2022: 4,675
33. Southside Park (Sacramento, CA)
- Likelihood two random residents are different race or ethnicity: 76.3%
- Most prevalent race or ethnicity group: White (34.8%)
- Est. typical home value, Nov 2023: $575,309
- Est. population in 2022: 1,436
32. Hoover-Foster (Oakland, CA)
- Likelihood two random residents are different race or ethnicity: 76.3%
- Most prevalent race or ethnicity group: Black or African American (31.8%)
- Est. typical home value, Nov 2023: $696,100
- Est. population in 2022: 5,326
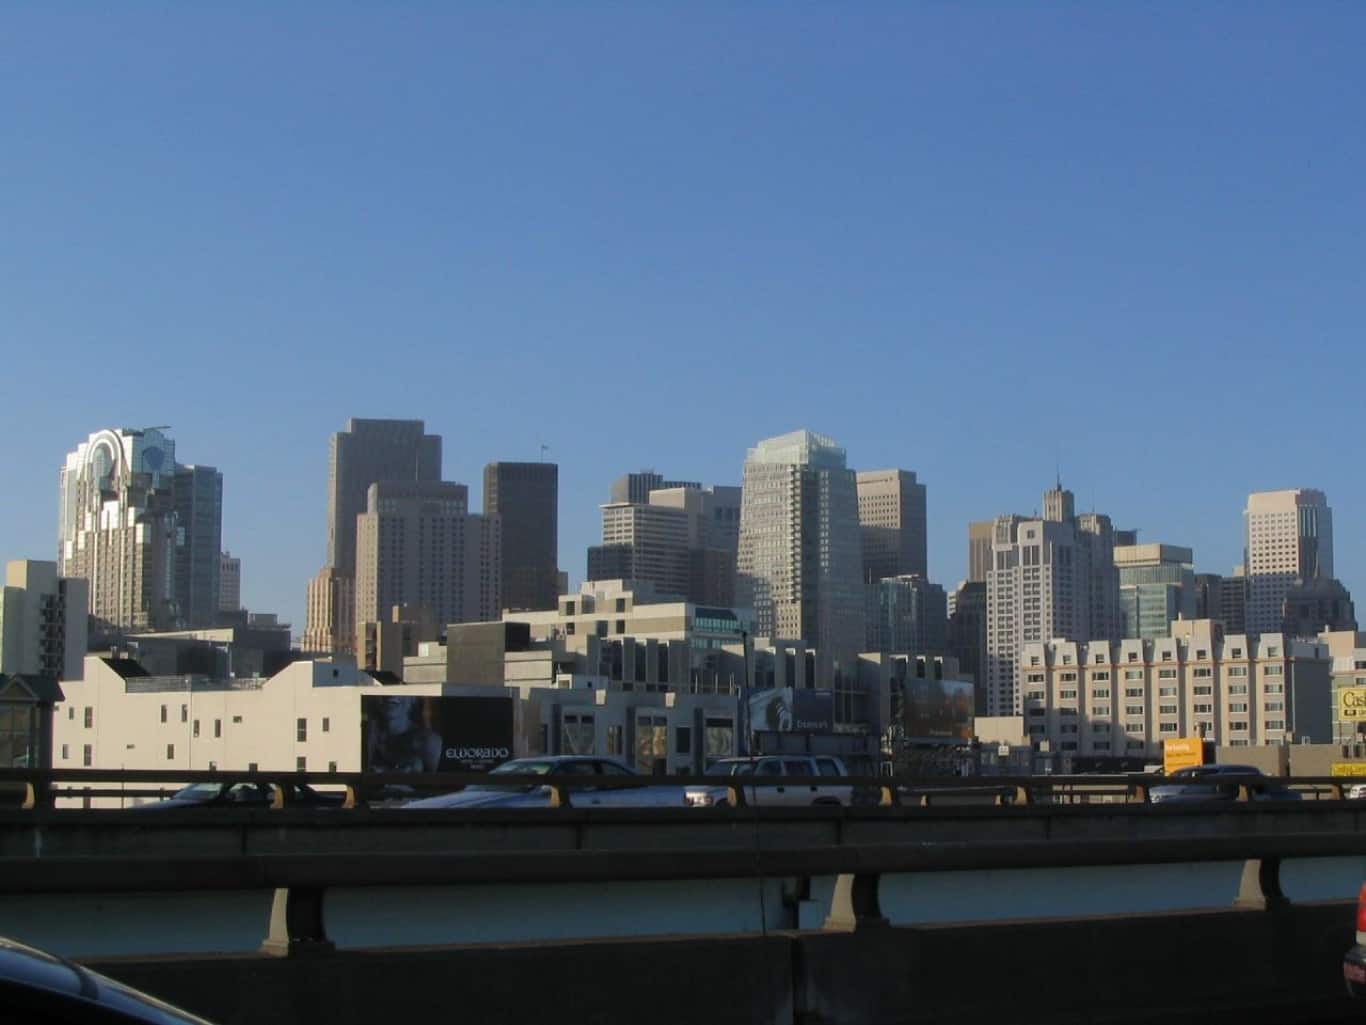
31. Western Addition (San Francisco, CA)
- Likelihood two random residents are different race or ethnicity: 76.3%
- Most prevalent race or ethnicity group: White (30.0%)
- Est. typical home value, Nov 2023: $1,030,217
- Est. population in 2022: 11,432
30. Spanos Park West (Stockton, CA)
- Likelihood two random residents are different race or ethnicity: 76.3%
- Most prevalent race or ethnicity group: Hispanic or Latino (30.2%)
- Est. typical home value, Nov 2023: $581,391
- Est. population in 2022: 4,960
29. Creekside – Wagner (Stockton, CA)
- Likelihood two random residents are different race or ethnicity: 76.4%
- Most prevalent race or ethnicity group: Hispanic or Latino (35.3%)
- Est. typical home value, Nov 2023: $463,312
- Est. population in 2022: 11,776
28. South White Rock (Rancho Cordova, CA)
- Likelihood two random residents are different race or ethnicity: 76.4%
- Most prevalent race or ethnicity group: Hispanic or Latino (33.1%)
- Est. typical home value, Nov 2023: $431,276
- Est. population in 2022: 1,467
27. Eastside-ENACT (Tacoma, WA)
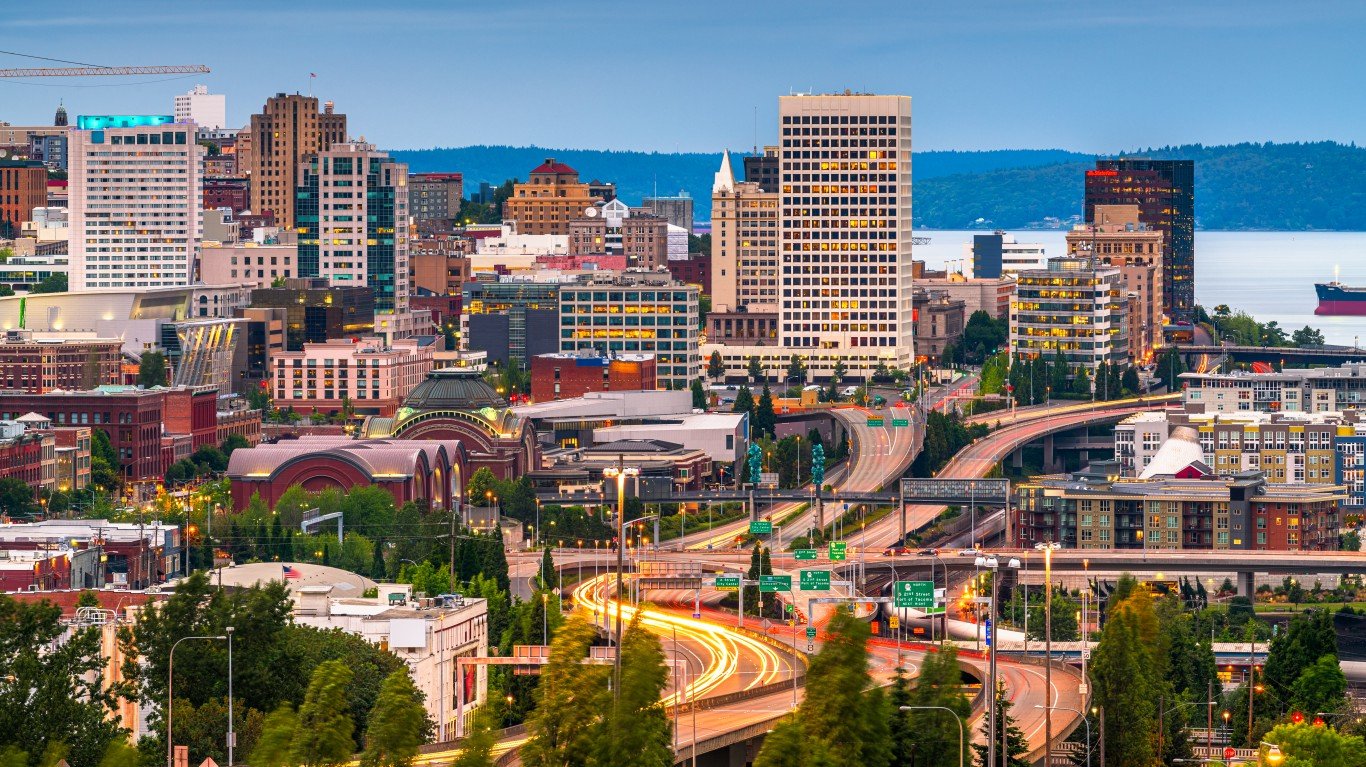
- Likelihood two random residents are different race or ethnicity: 76.4%
- Most prevalent race or ethnicity group: White (38.8%)
- Est. typical home value, Nov 2023: $403,414
- Est. population in 2022: 29,343
26. Tuxedo (Oakland, CA)
- Likelihood two random residents are different race or ethnicity: 76.4%
- Most prevalent race or ethnicity group: Black or African American (28.0%)
- Est. typical home value, Nov 2023: $670,727
- Est. population in 2022: 1,927
25. Longfellow (Oakland, CA)
- Likelihood two random residents are different race or ethnicity: 76.5%
- Most prevalent race or ethnicity group: White (33.4%)
- Est. typical home value, Nov 2023: $819,367
- Est. population in 2022: 6,257
24. North Central (San Mateo, CA)
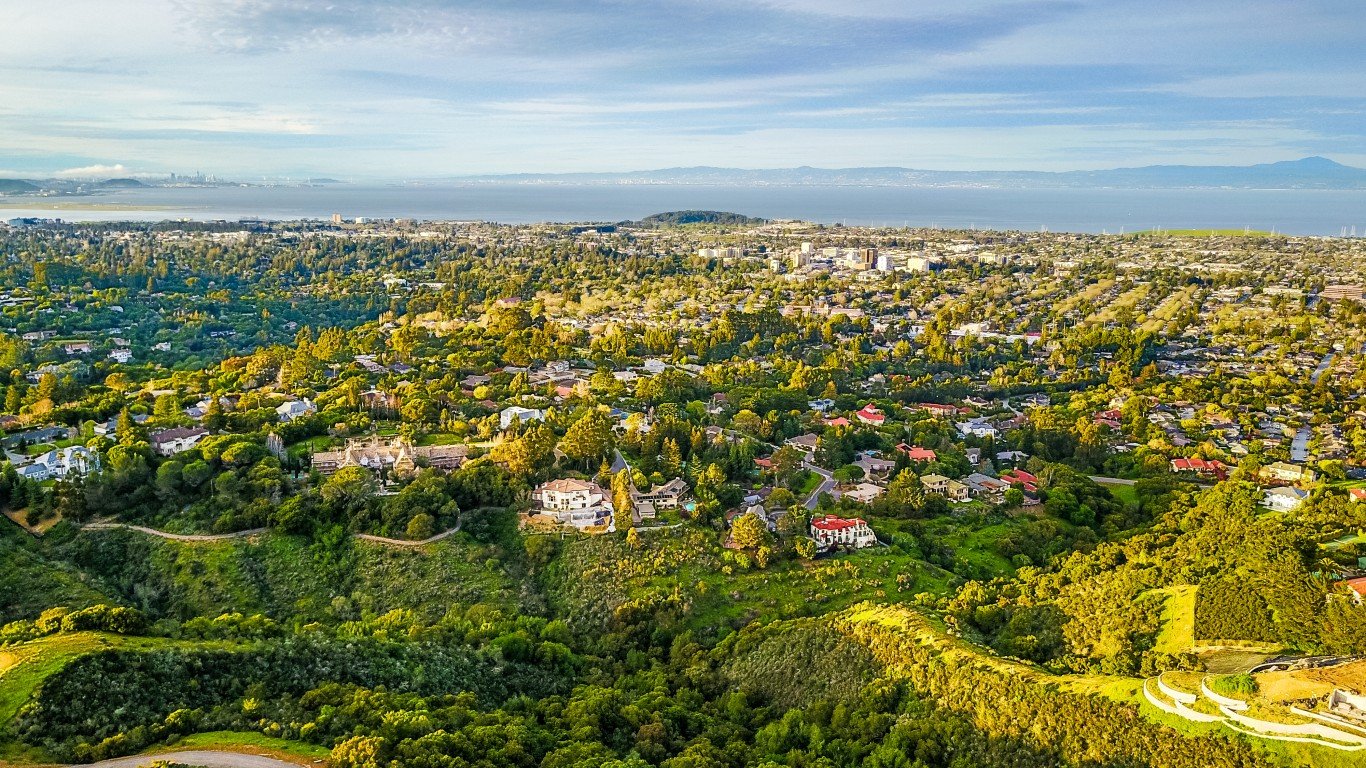
- Likelihood two random residents are different race or ethnicity: 76.6%
- Most prevalent race or ethnicity group: White (31.0%)
- Est. typical home value, Nov 2023: $690,752
- Est. population in 2022: 5,452
23. Northeast (Anchorage, AK)
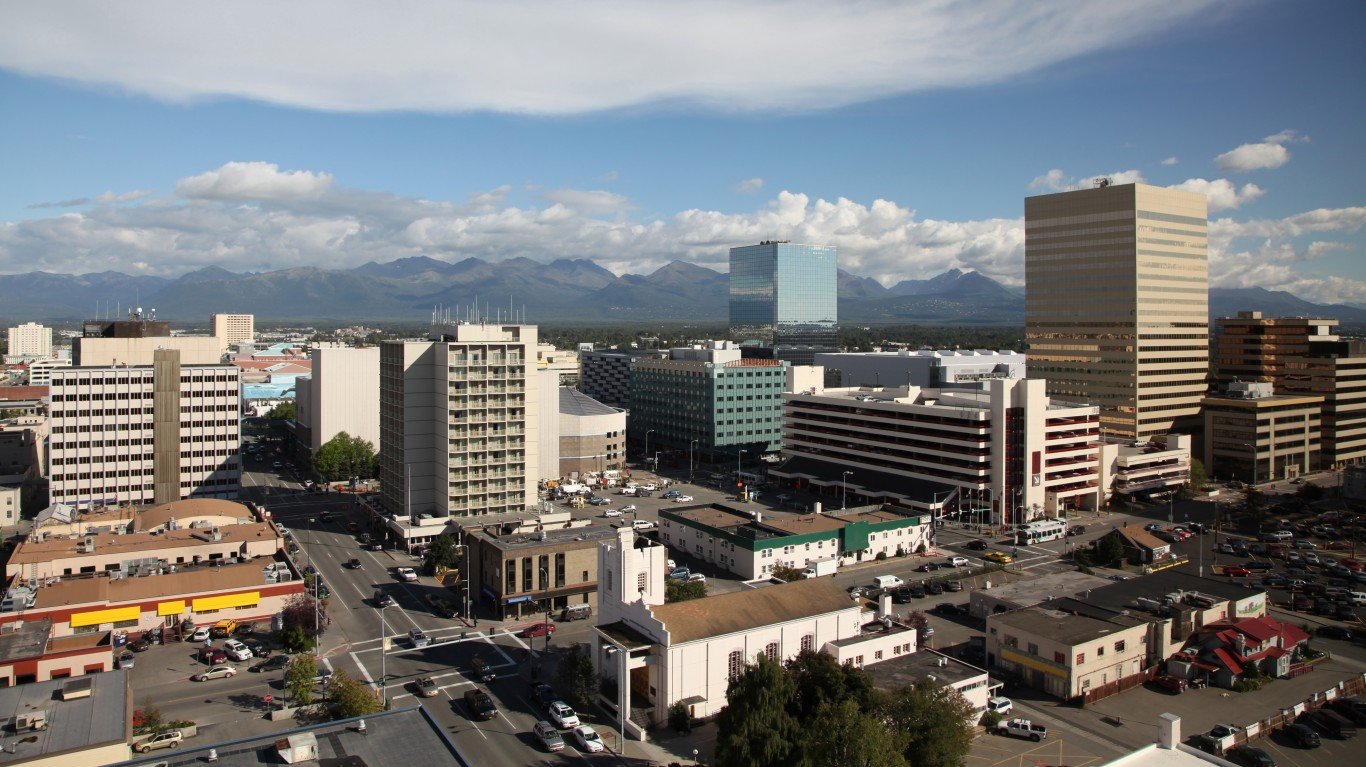
- Likelihood two random residents are different race or ethnicity: 76.6%
- Most prevalent race or ethnicity group: White (41.4%)
- Est. typical home value, Nov 2023: $308,726
- Est. population in 2022: 28,515
22. Broadmoor (San Leandro, CA)
- Likelihood two random residents are different race or ethnicity: 76.6%
- Most prevalent race or ethnicity group: Hispanic or Latino (30.8%)
- Est. typical home value, Nov 2023: $886,315
- Est. population in 2022: 4,260
21. El Cerrito (San Diego, CA)
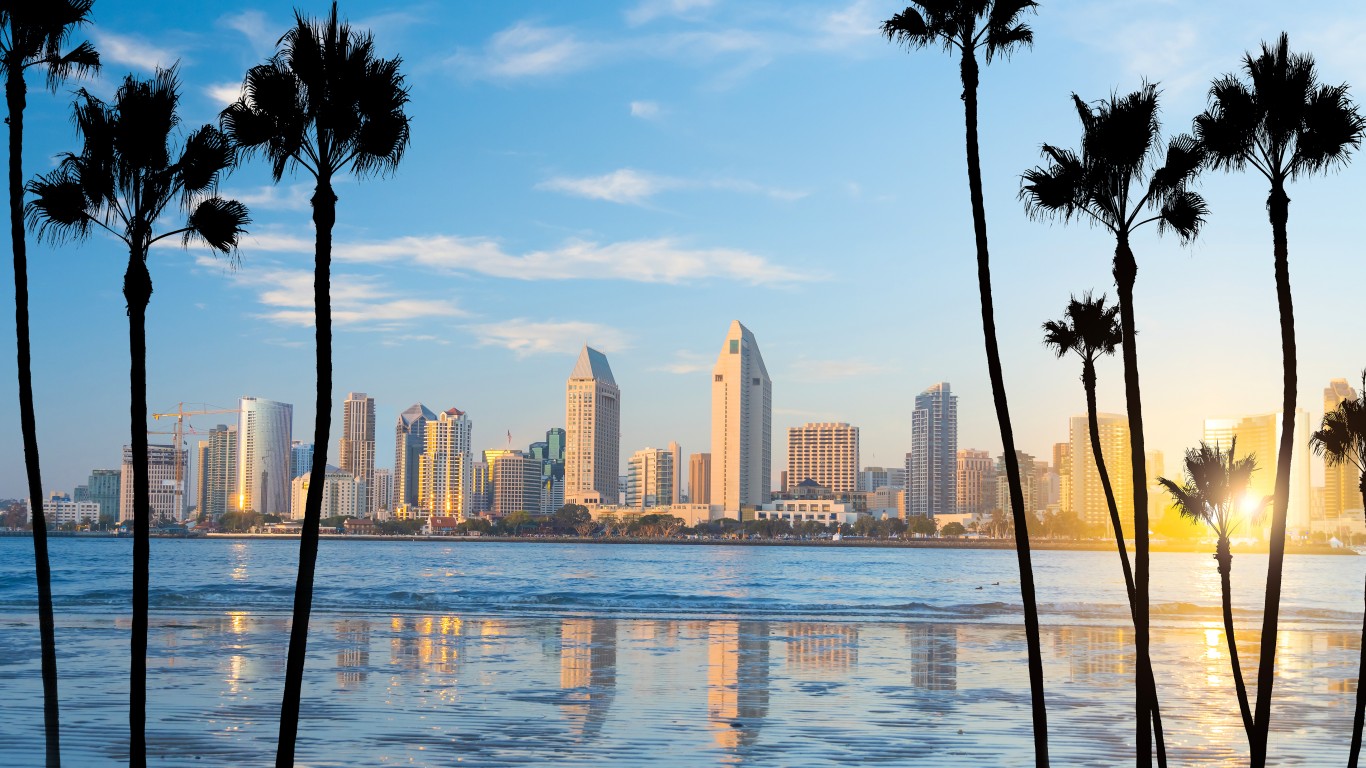
- Likelihood two random residents are different race or ethnicity: 76.8%
- Most prevalent race or ethnicity group: White (30.2%)
- Est. typical home value, Nov 2023: $733,484
- Est. population in 2022: 5,433
20. Glenwood Meadows (Sacramento, CA)
- Likelihood two random residents are different race or ethnicity: 76.9%
- Most prevalent race or ethnicity group: Hispanic or Latino (37.9%)
- Est. typical home value, Nov 2023: $404,937
- Est. population in 2022: 3,653
19. Reservoir Hill (Oakland, CA)
- Likelihood two random residents are different race or ethnicity: 77.0%
- Most prevalent race or ethnicity group: Hispanic or Latino (31.4%)
- Est. typical home value, Nov 2023: $655,731
- Est. population in 2022: 1,853
18. Upper B Street (Hayward, CA)
- Likelihood two random residents are different race or ethnicity: 77.2%
- Most prevalent race or ethnicity group: Hispanic or Latino (33.7%)
- Est. typical home value, Nov 2023: $749,623
- Est. population in 2022: 3,134
17. Z’berg Park (Sacramento, CA)
- Likelihood two random residents are different race or ethnicity: 77.2%
- Most prevalent race or ethnicity group: Hispanic or Latino (28.2%)
- Est. typical home value, Nov 2023: $552,693
- Est. population in 2022: 2,130
16. Downtown (Los Angeles, CA)
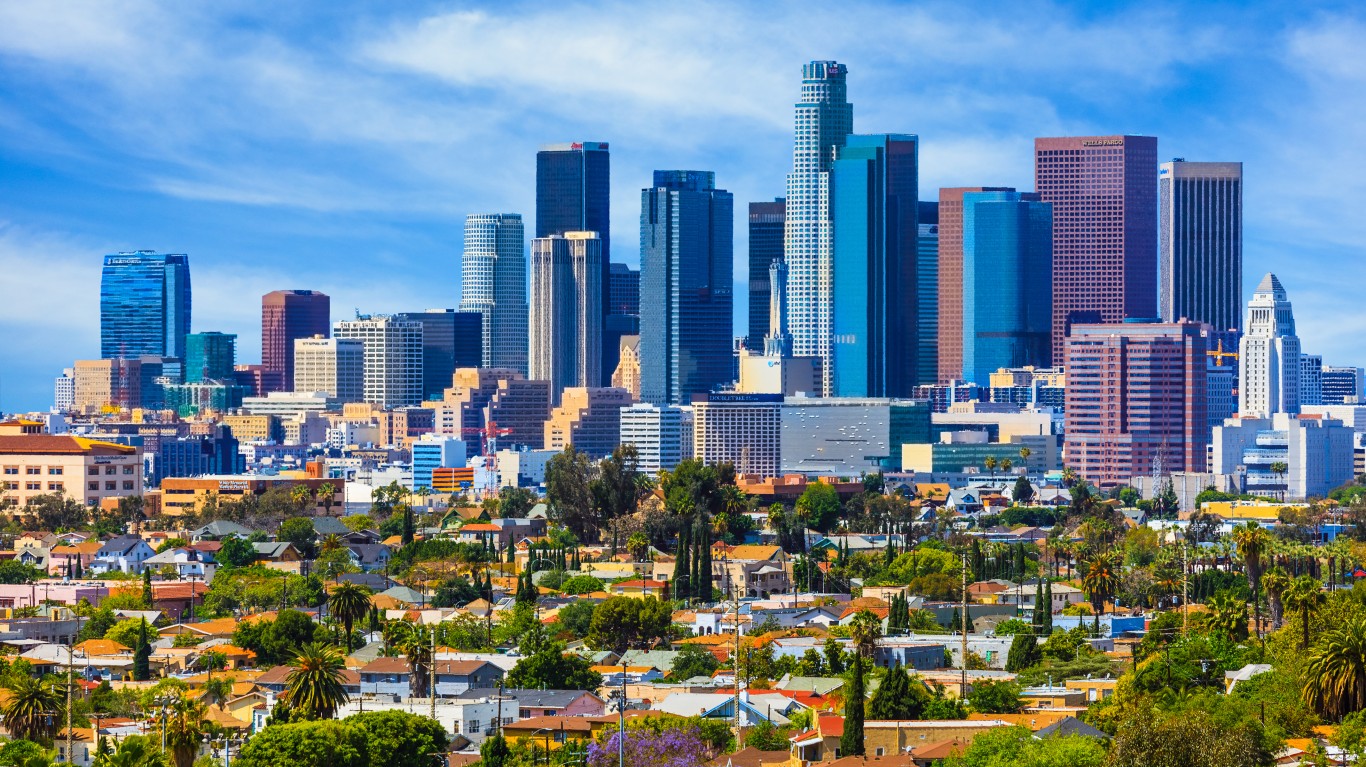
- Likelihood two random residents are different race or ethnicity: 77.3%
- Most prevalent race or ethnicity group: Asian (26.0%)
- Est. typical home value, Nov 2023: $611,825
- Est. population in 2022: 50,976
15. Ridgeview-Webster (San Diego, CA)
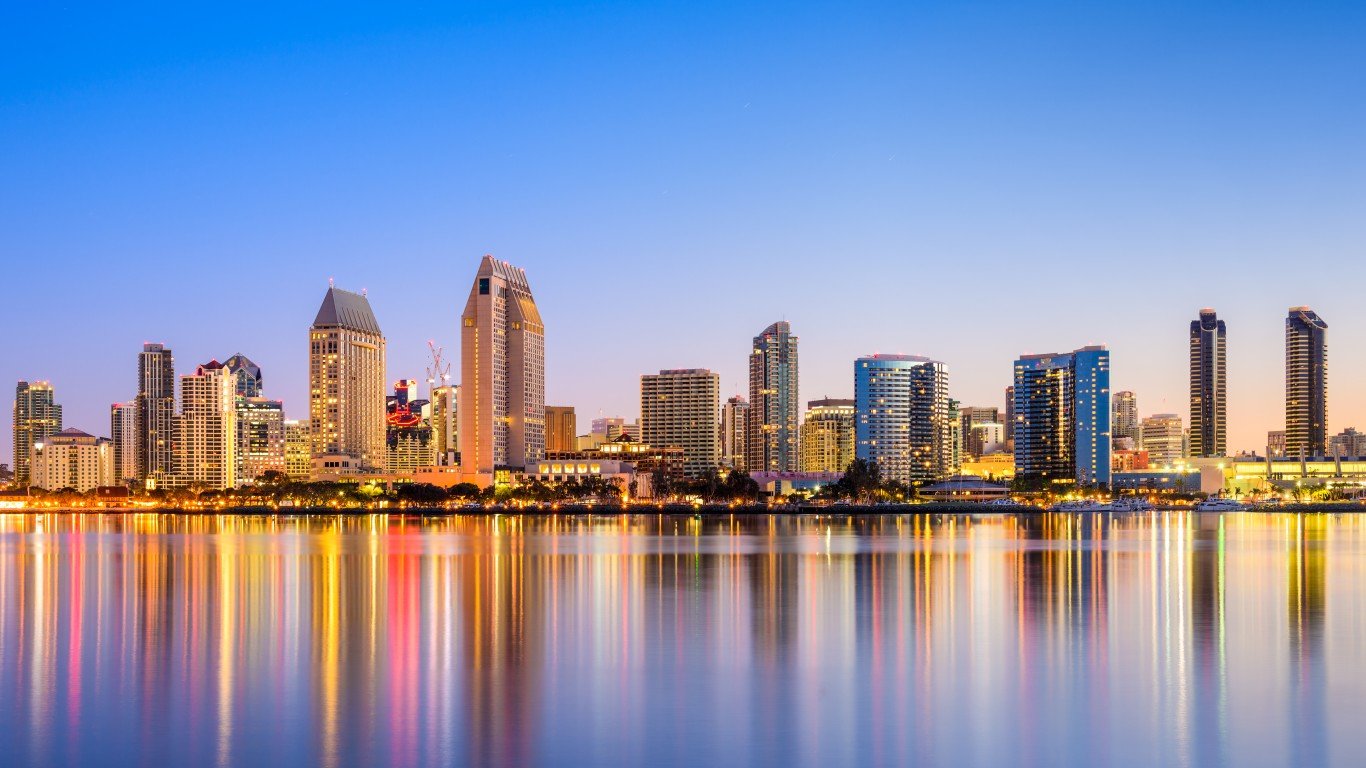
- Likelihood two random residents are different race or ethnicity: 77.4%
- Most prevalent race or ethnicity group: Hispanic or Latino (30.6%)
- Est. typical home value, Nov 2023: $683,314
- Est. population in 2022: 5,042
14. Downtown (San Leandro, CA)
- Likelihood two random residents are different race or ethnicity: 77.4%
- Most prevalent race or ethnicity group: Hispanic or Latino (31.1%)
- Est. typical home value, Nov 2023: $722,876
- Est. population in 2022: 8,433
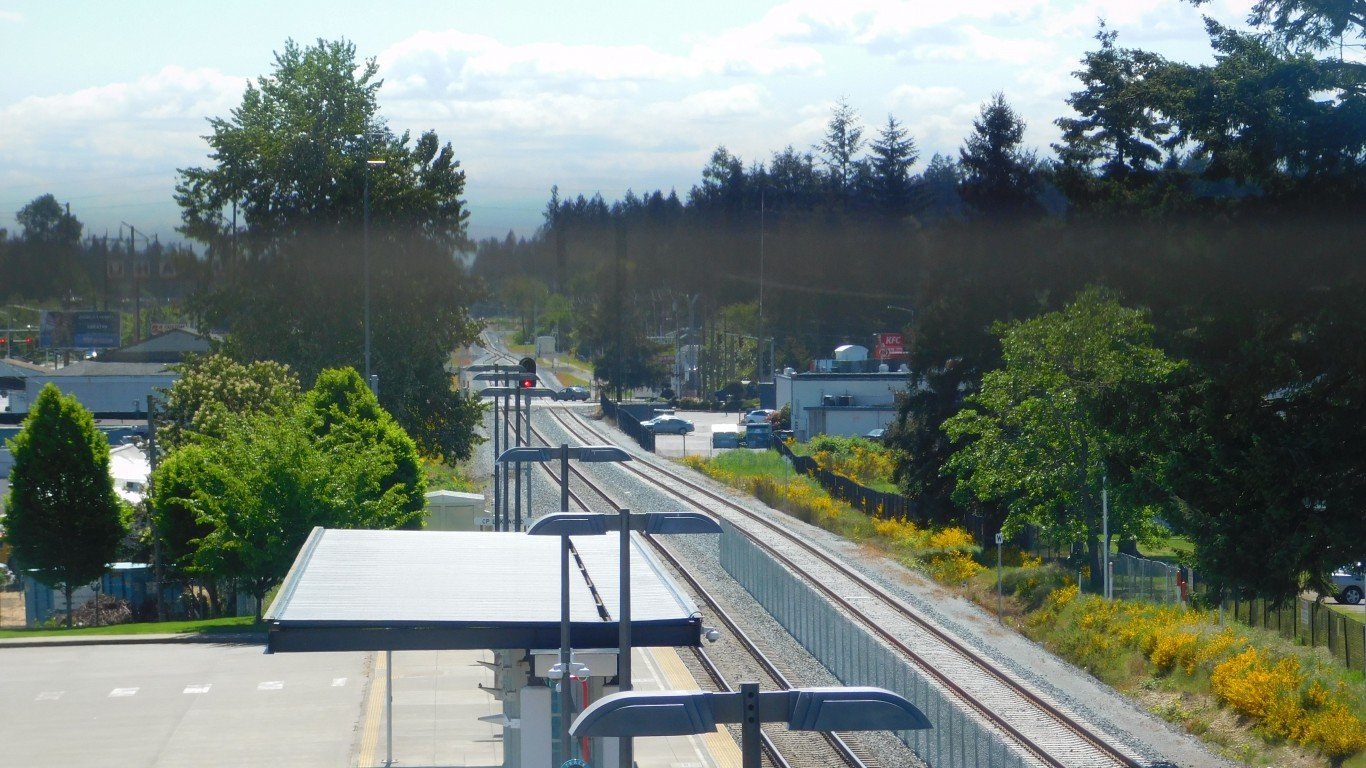
13. West Hill (Kent, WA)
- Likelihood two random residents are different race or ethnicity: 77.5%
- Most prevalent race or ethnicity group: White (33.1%)
- Est. typical home value, Nov 2023: $554,987
- Est. population in 2022: 4,224
12. The Lakes (Kent, WA)
- Likelihood two random residents are different race or ethnicity: 77.6%
- Most prevalent race or ethnicity group: White (32.6%)
- Est. typical home value, Nov 2023: $431,810
- Est. population in 2022: 2,803
11. Greenhaven (Sacramento, CA)
- Likelihood two random residents are different race or ethnicity: 77.7%
- Most prevalent race or ethnicity group: White (28.7%)
- Est. typical home value, Nov 2023: $603,142
- Est. population in 2022: 9,182
10. Dunlap (Seattle, WA)
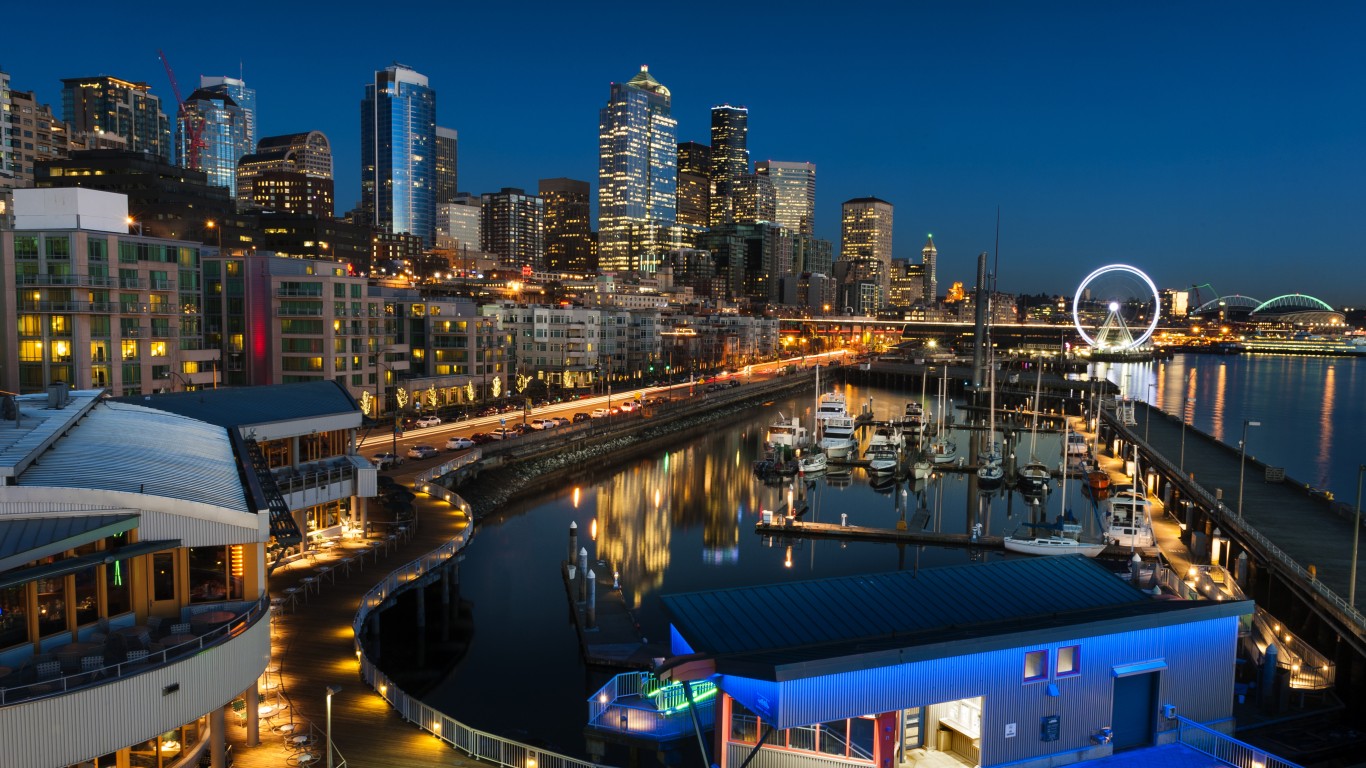
- Likelihood two random residents are different race or ethnicity: 77.8%
- Most prevalent race or ethnicity group: Asian (29.7%)
- Est. typical home value, Nov 2023: $562,982
- Est. population in 2022: 2,285
9. Vallejo Heights (Vallejo, CA)
- Likelihood two random residents are different race or ethnicity: 78.2%
- Most prevalent race or ethnicity group: Hispanic or Latino (25.4%)
- Est. typical home value, Nov 2023: $441,858
- Est. population in 2022: 4,532
8. Hayward Highland (Hayward, CA)
- Likelihood two random residents are different race or ethnicity: 78.4%
- Most prevalent race or ethnicity group: Hispanic or Latino (27.0%)
- Est. typical home value, Nov 2023: $1,175,604
- Est. population in 2022: 5,556
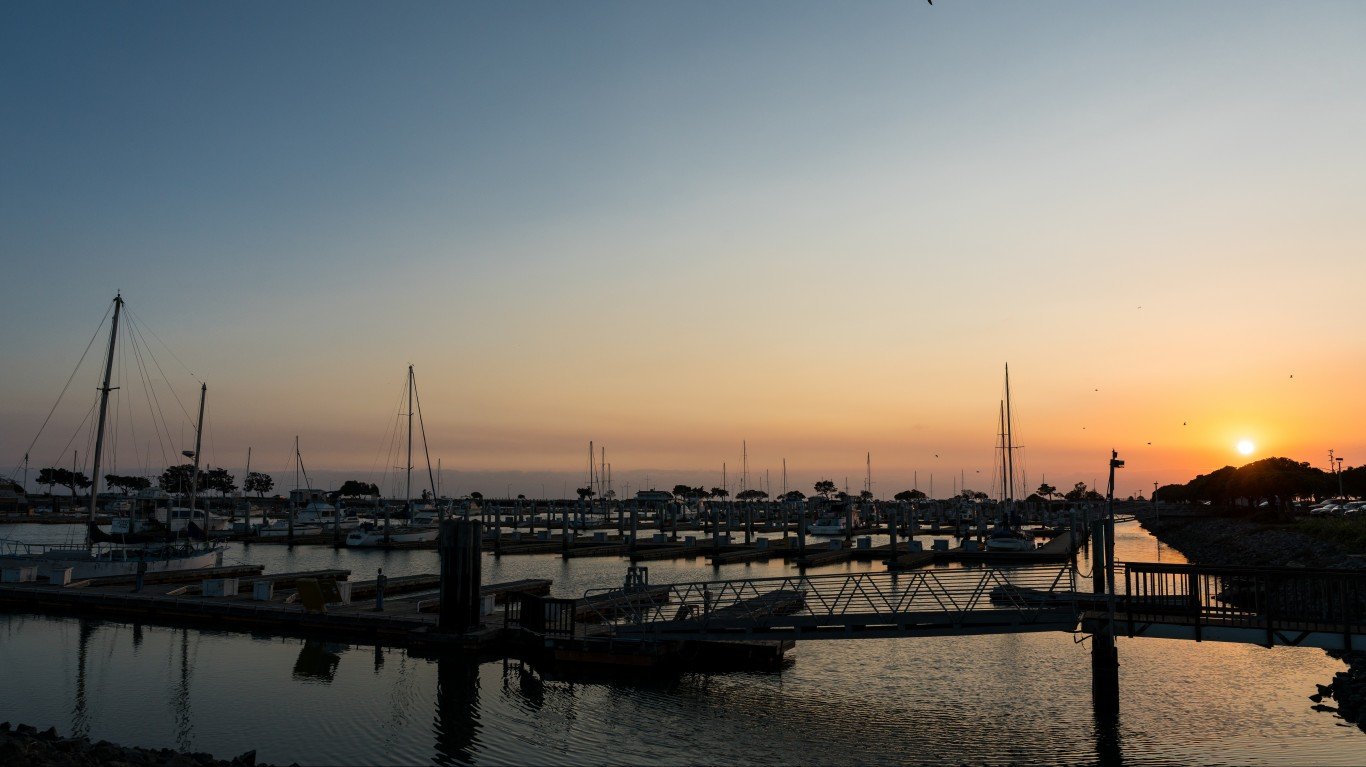
7. Marina Bay (Richmond, CA)
- Likelihood two random residents are different race or ethnicity: 78.4%
- Most prevalent race or ethnicity group: Hispanic or Latino (25.9%)
- Est. typical home value, Nov 2023: $593,266
- Est. population in 2022: 2,584
6. Alderbrook (Federal Way, WA)
- Likelihood two random residents are different race or ethnicity: 78.6%
- Most prevalent race or ethnicity group: White (30.1%)
- Est. typical home value, Nov 2023: $595,317
- Est. population in 2022: 4,535
5. Woodbine (Sacramento, CA)
- Likelihood two random residents are different race or ethnicity: 79.0%
- Most prevalent race or ethnicity group: Hispanic or Latino (26.9%)
- Est. typical home value, Nov 2023: $386,576
- Est. population in 2022: 3,720
4. Pacific Ridge (Des Moines, WA)
- Likelihood two random residents are different race or ethnicity: 79.3%
- Most prevalent race or ethnicity group: White (27.2%)
- Est. typical home value, Nov 2023: $302,773
- Est. population in 2022: 3,859
3. Valley High-North Laguna (Sacramento, CA)
- Likelihood two random residents are different race or ethnicity: 79.4%
- Most prevalent race or ethnicity group: Asian (28.2%)
- Est. typical home value, Nov 2023: $444,595
- Est. population in 2022: 42,943
2. Russian Jack Park (Anchorage, AK)
- Likelihood two random residents are different race or ethnicity: 81.9%
- Most prevalent race or ethnicity group: Asian (26.8%)
- Est. typical home value, Nov 2023: $220,145
- Est. population in 2022: 12,629
1. Mountain View (Anchorage, AK)
- Likelihood two random residents are different race or ethnicity: 82.0%
- Most prevalent race or ethnicity group: Native Hawaiian and Other Pacific Islander (22.4%)
- Est. typical home value, Nov 2023: $237,601
- Est. population in 2022: 6,009
Contact [email protected] for any questions or corrections.