Diversity in the Midwest, like in most of the country, has different root causes, including the Great Migration of 1910 to 1970. At the time, Black Americans moved in droves from the South to Northern, Midwestern, and Western states, pursuing economic and educational opportunities, and fleeing oppression of Jim Crow. It is considered one of the largest movements of people in United States history.
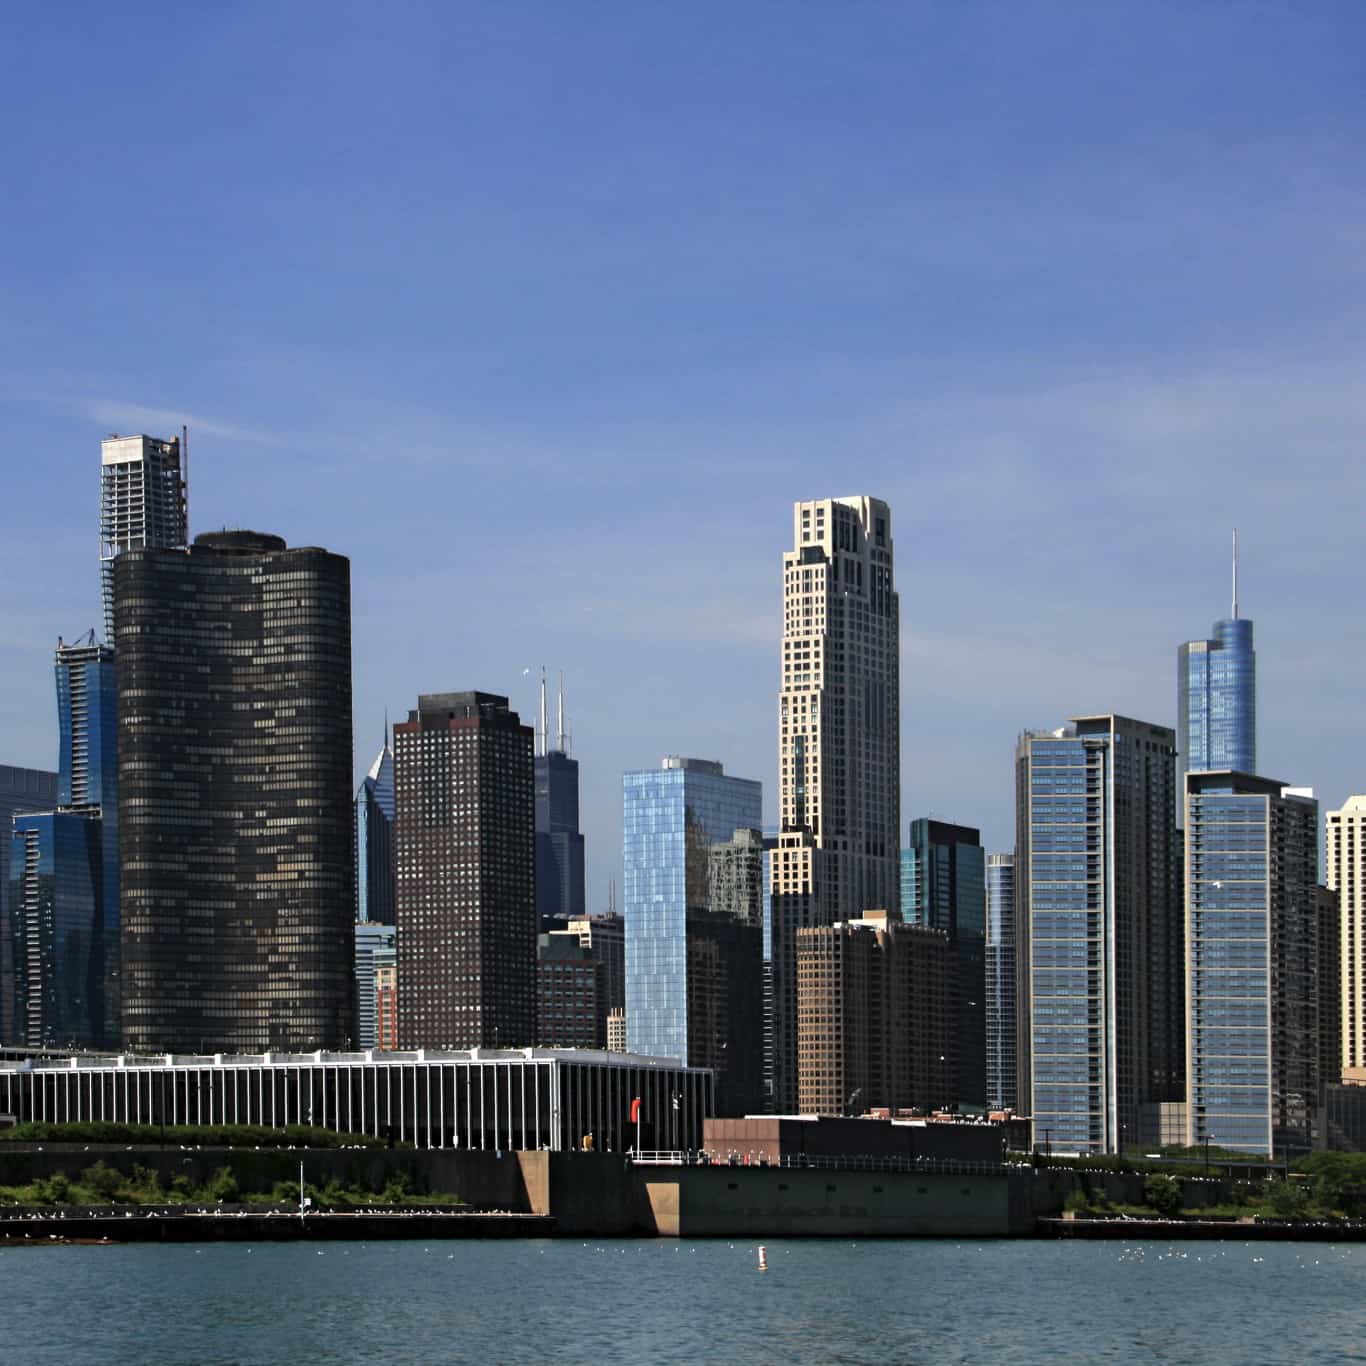
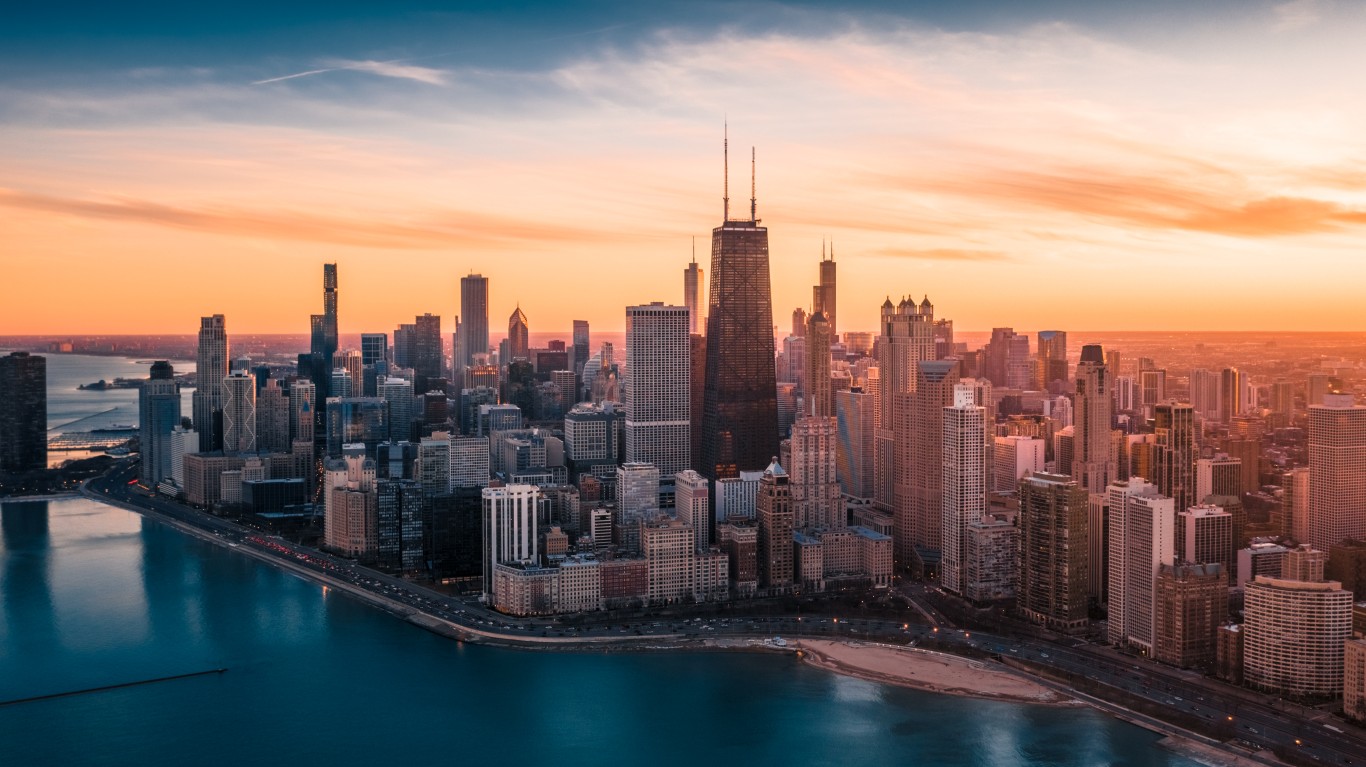
In the First Great Migration (1910-1940) particularly, Black Americans moved to Midwest cities, including Chicago and Detroit. While they may have been able to find jobs, many met with housing discrimination, such as redlining, which created segregated neighborhoods.
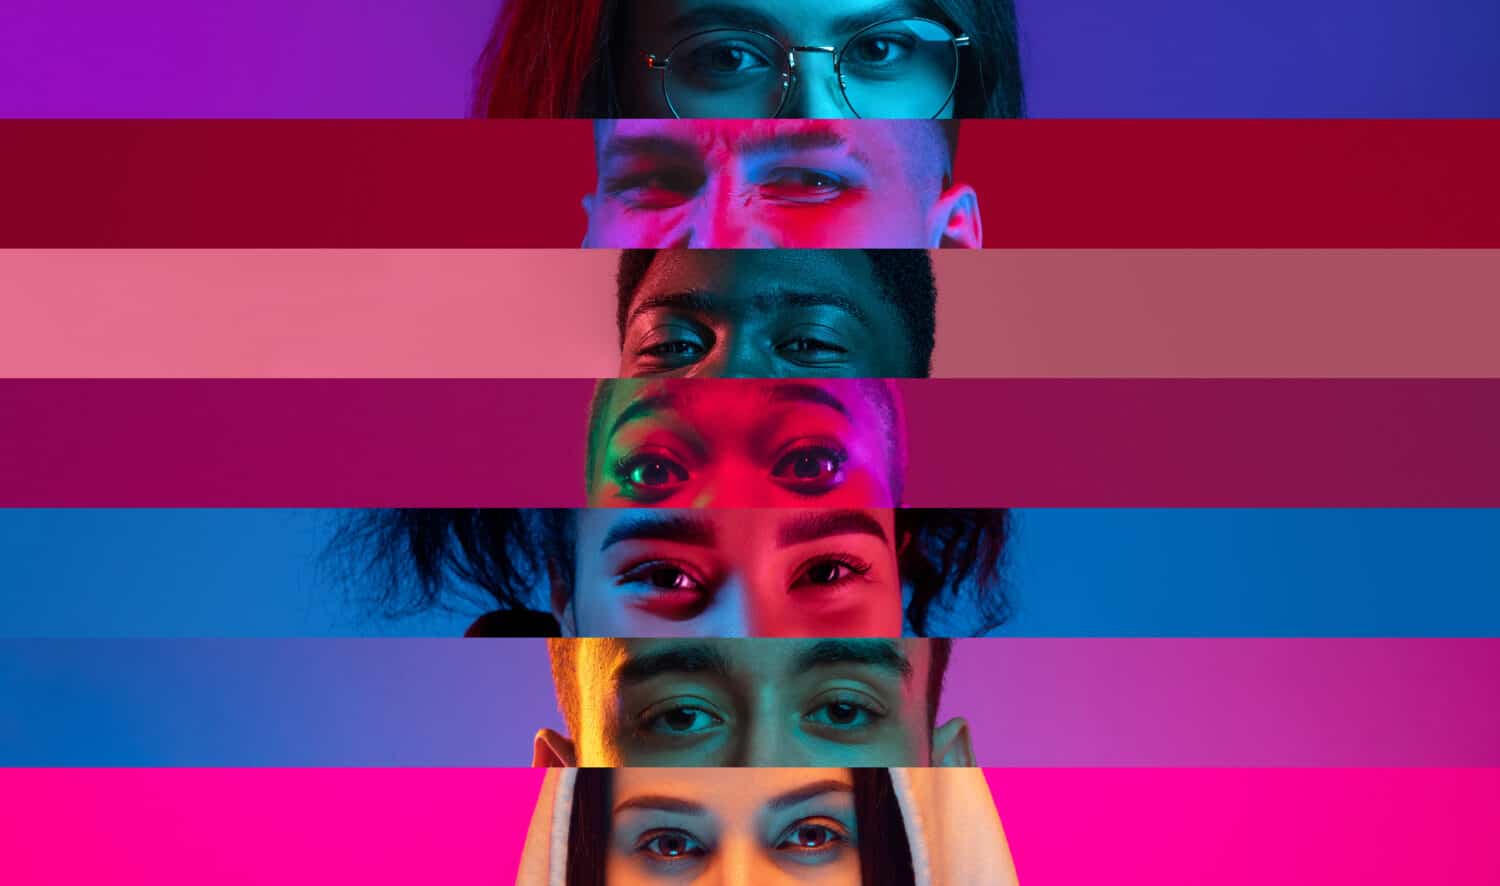
Today, diversity includes people of many racial and ethnic backgrounds. To help represent diversity of an area, the Census Bureau has created a measure that calculates the chance that two people chosen at random from a certain place will be from different race and ethnicity groups.
To determine the 50 most diverse neighborhoods in the Midwest, 24/7 Wall St. calculated this measure for different census tracts, using five-year data on race and ethnicity from the U.S. Census Bureau’s 2022 American Community Survey. Neighborhoods were ranked based on the probability that two residents picked at random will be of different race or ethnicity. Racial and ethnic groups include white, Black or African American, American Indian and Alaska Native, Asian, Native Hawaiian and other Pacific Islander, Hispanic or Latino, some other race alone, and two or more races.
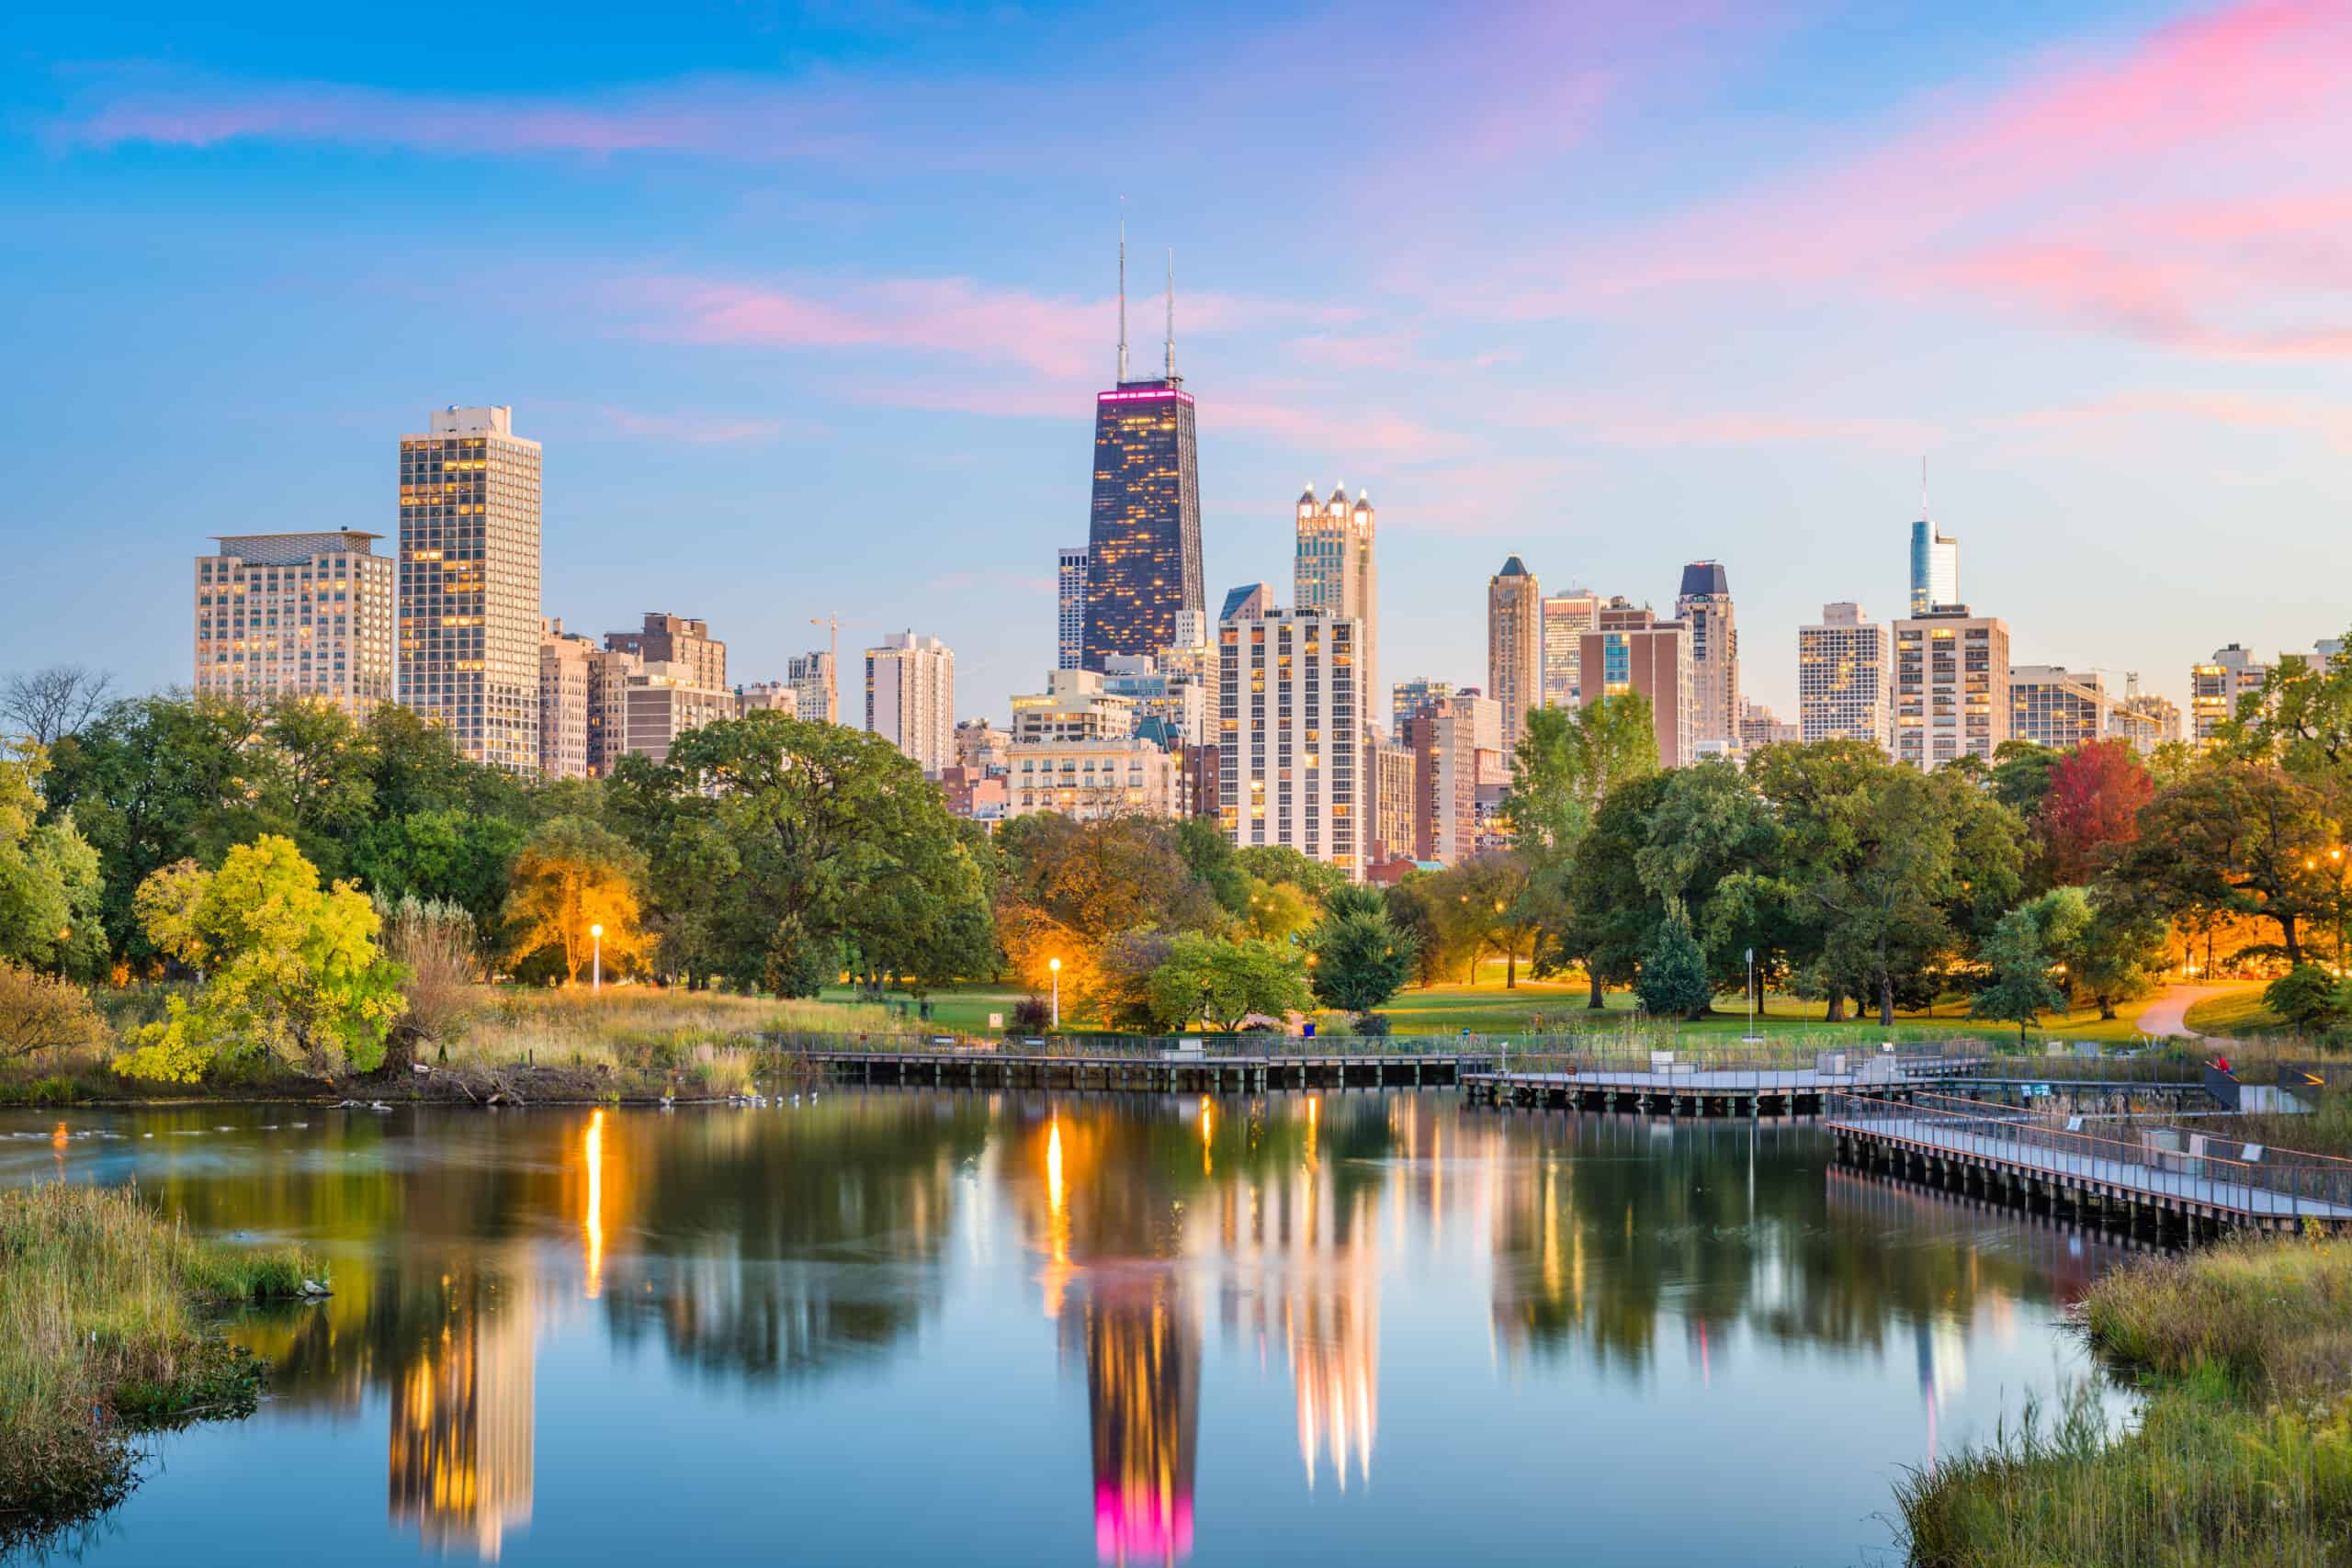
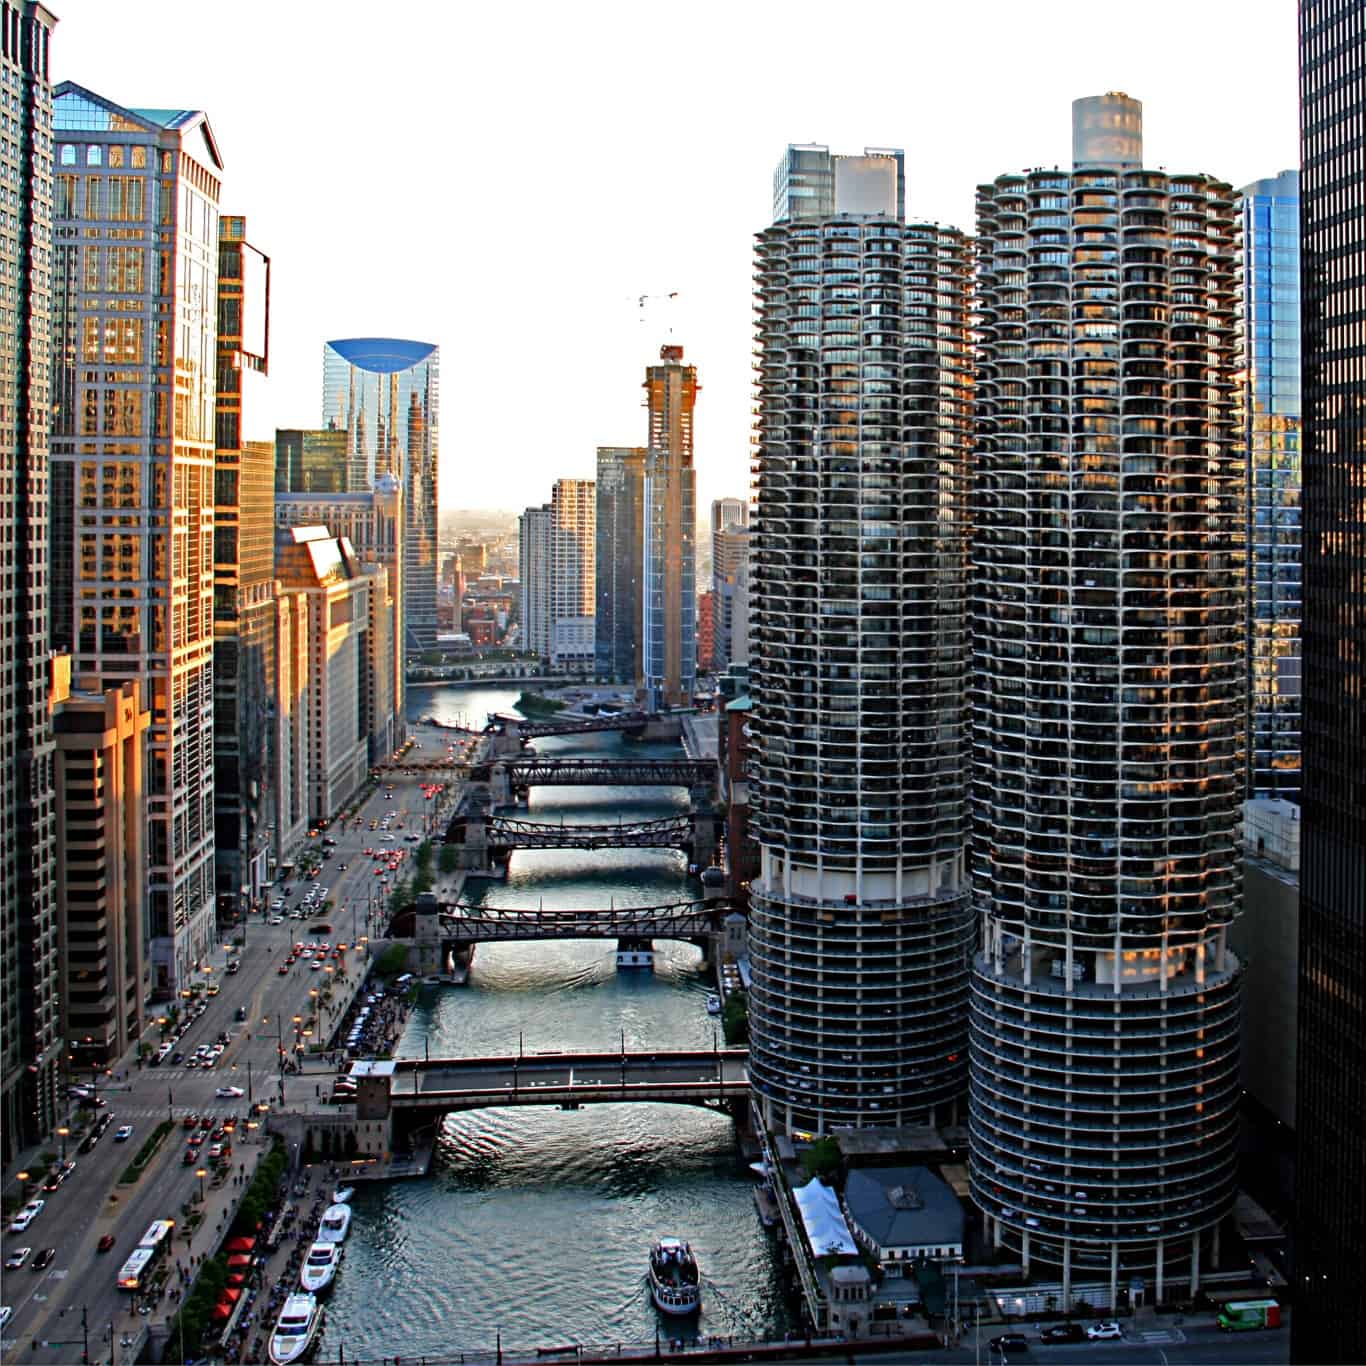
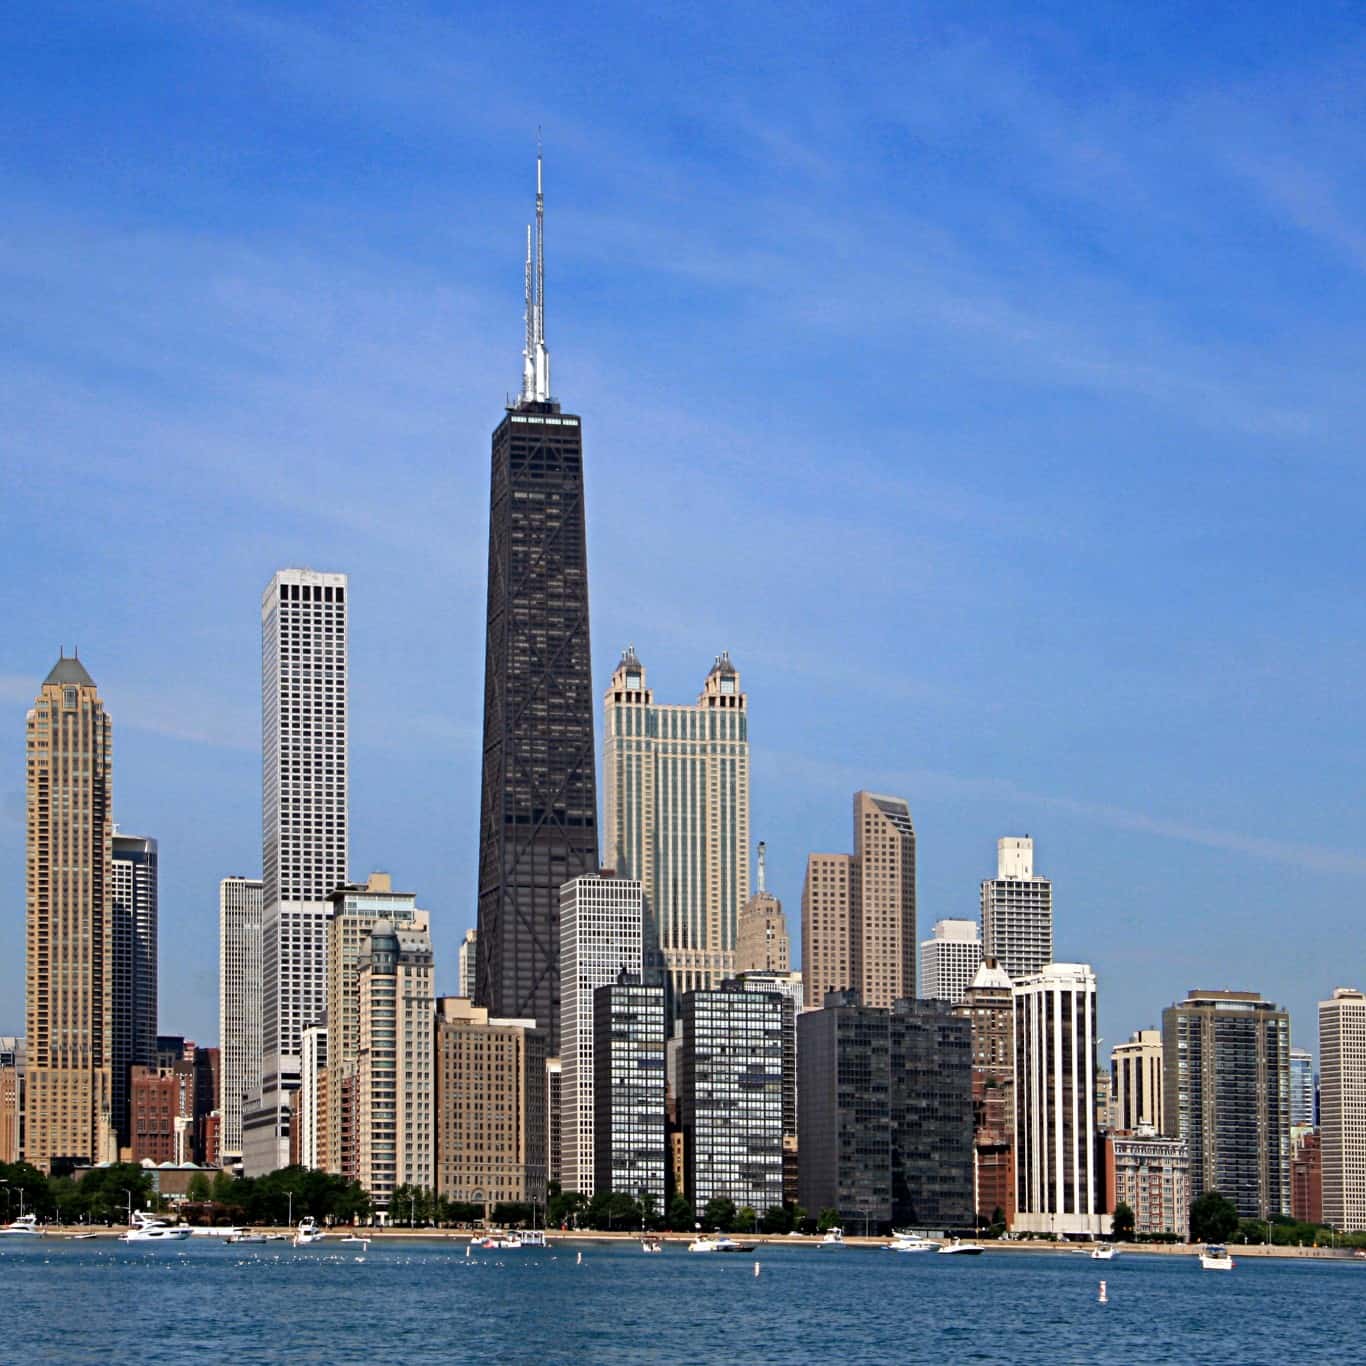
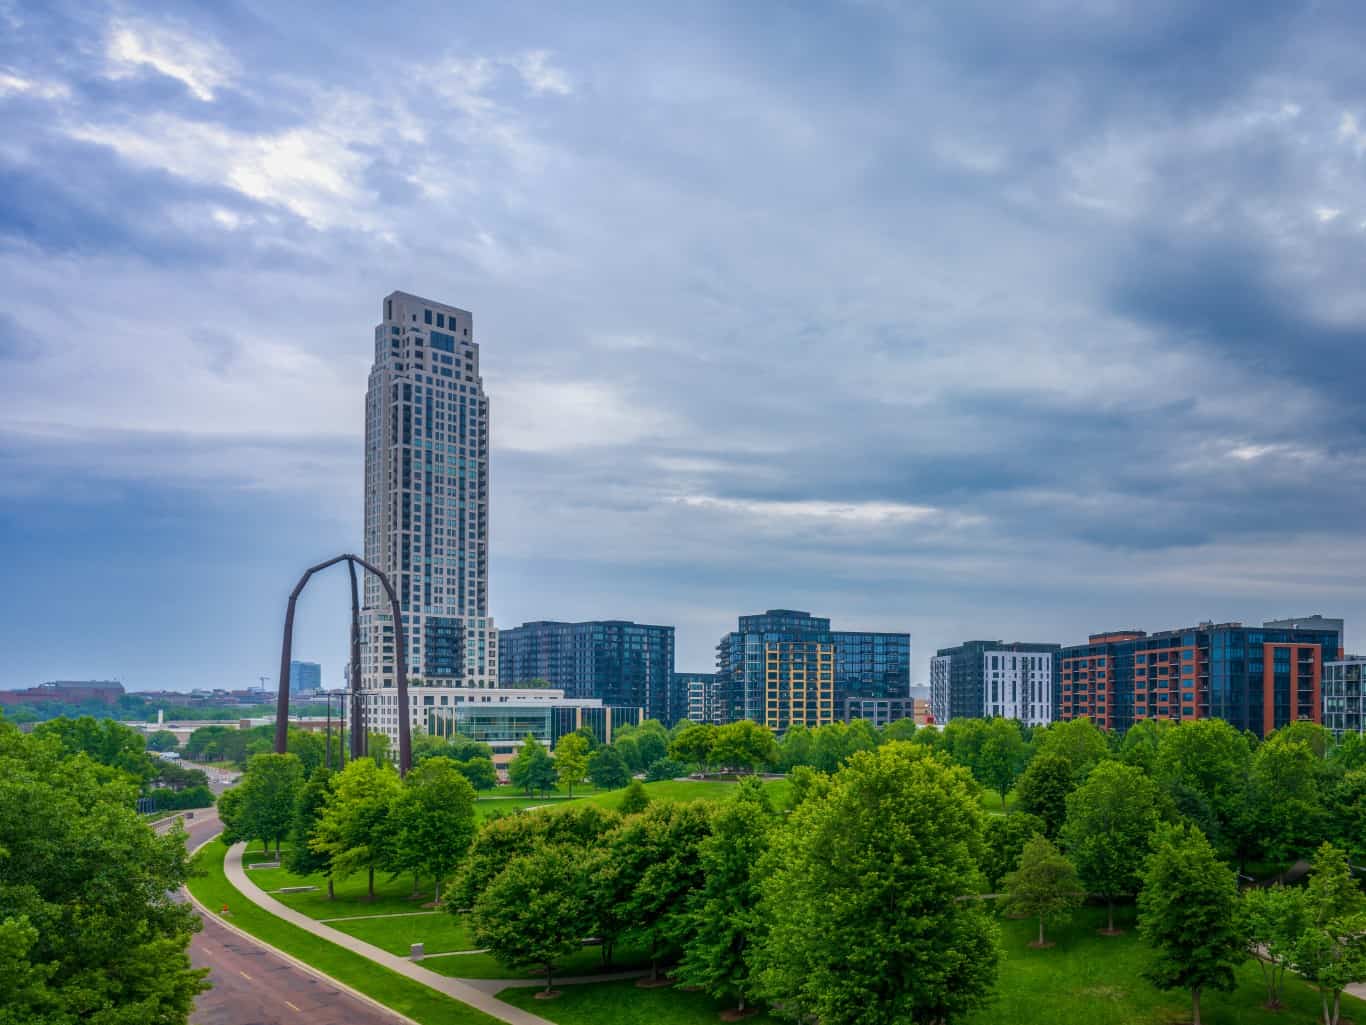
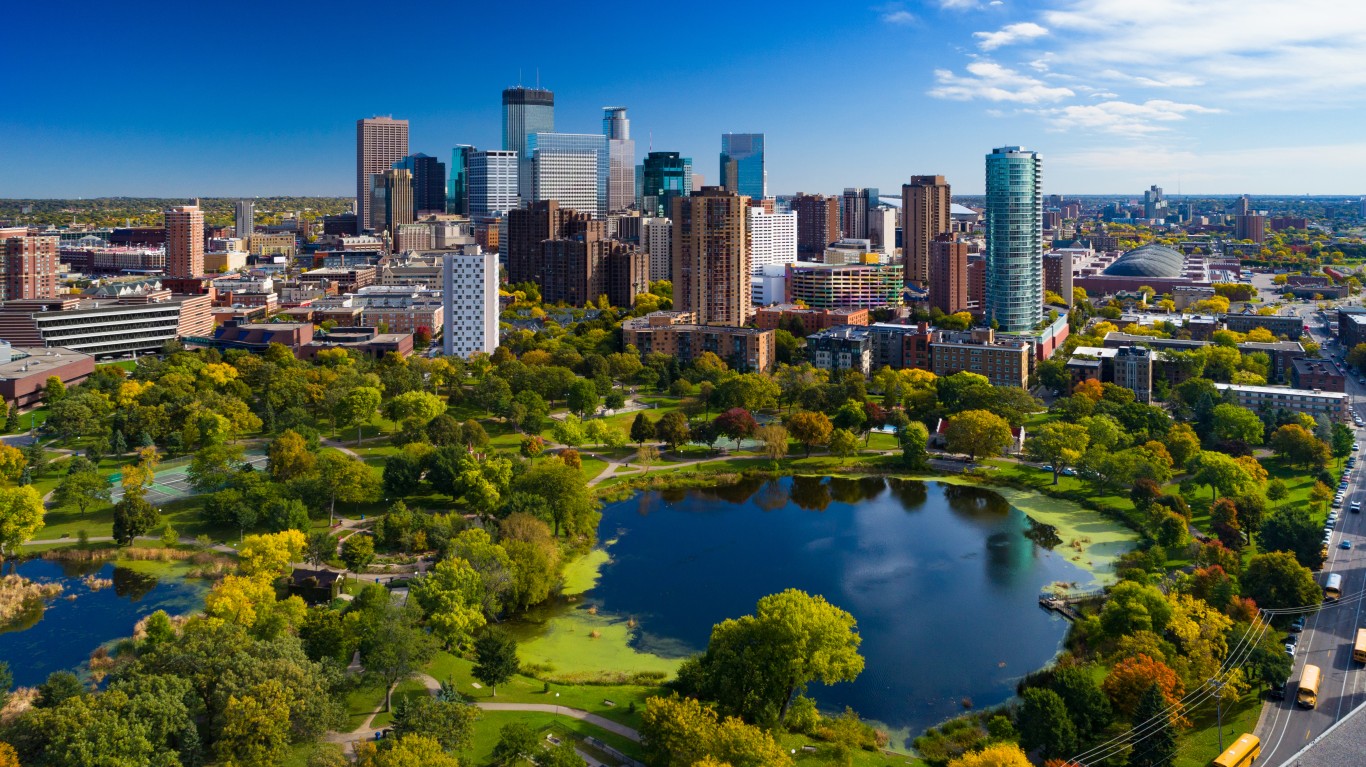
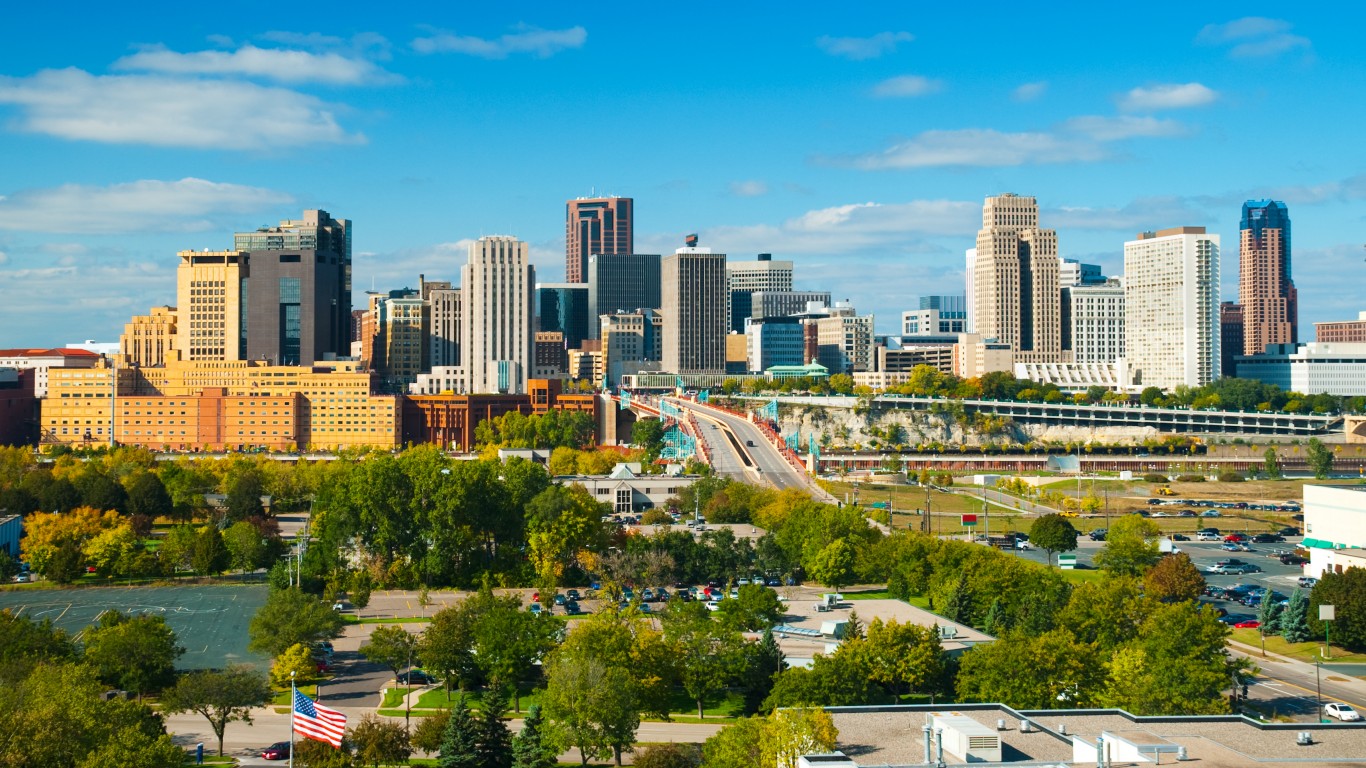
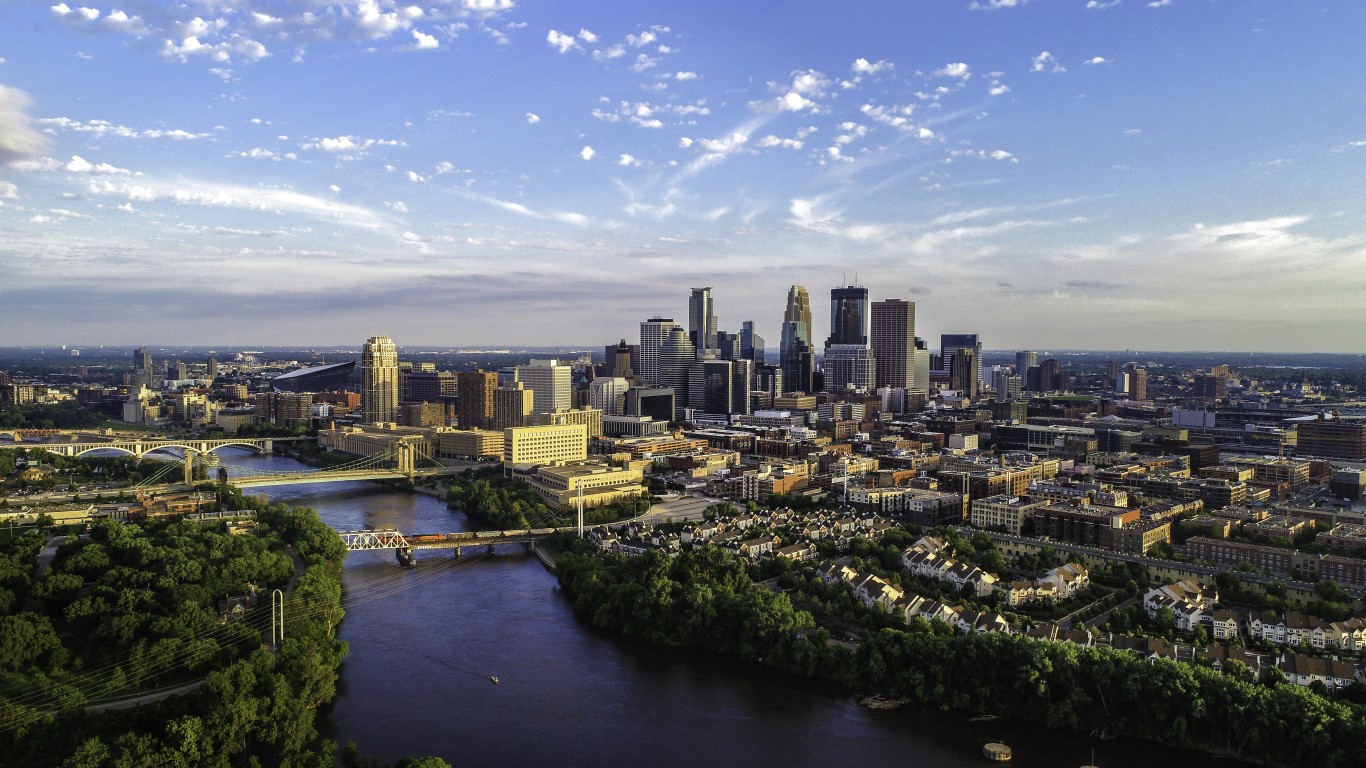
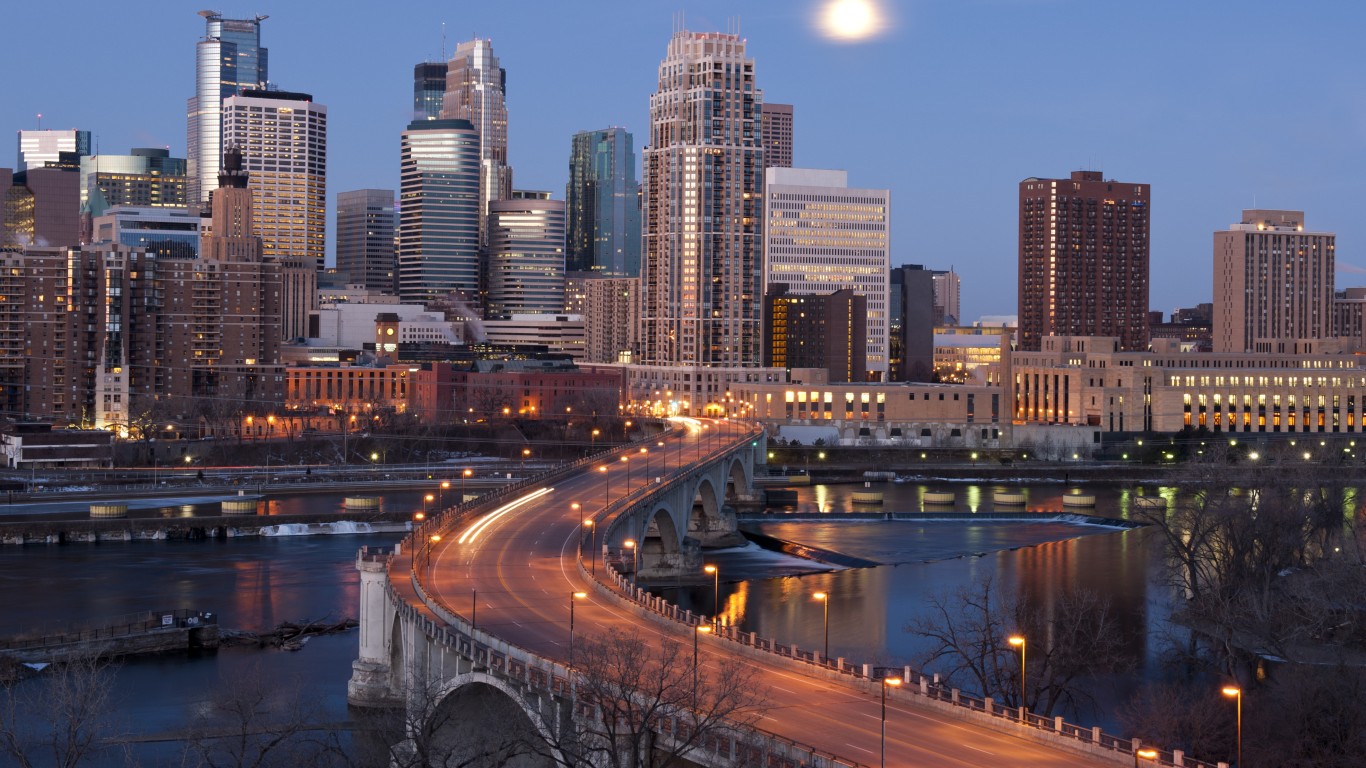
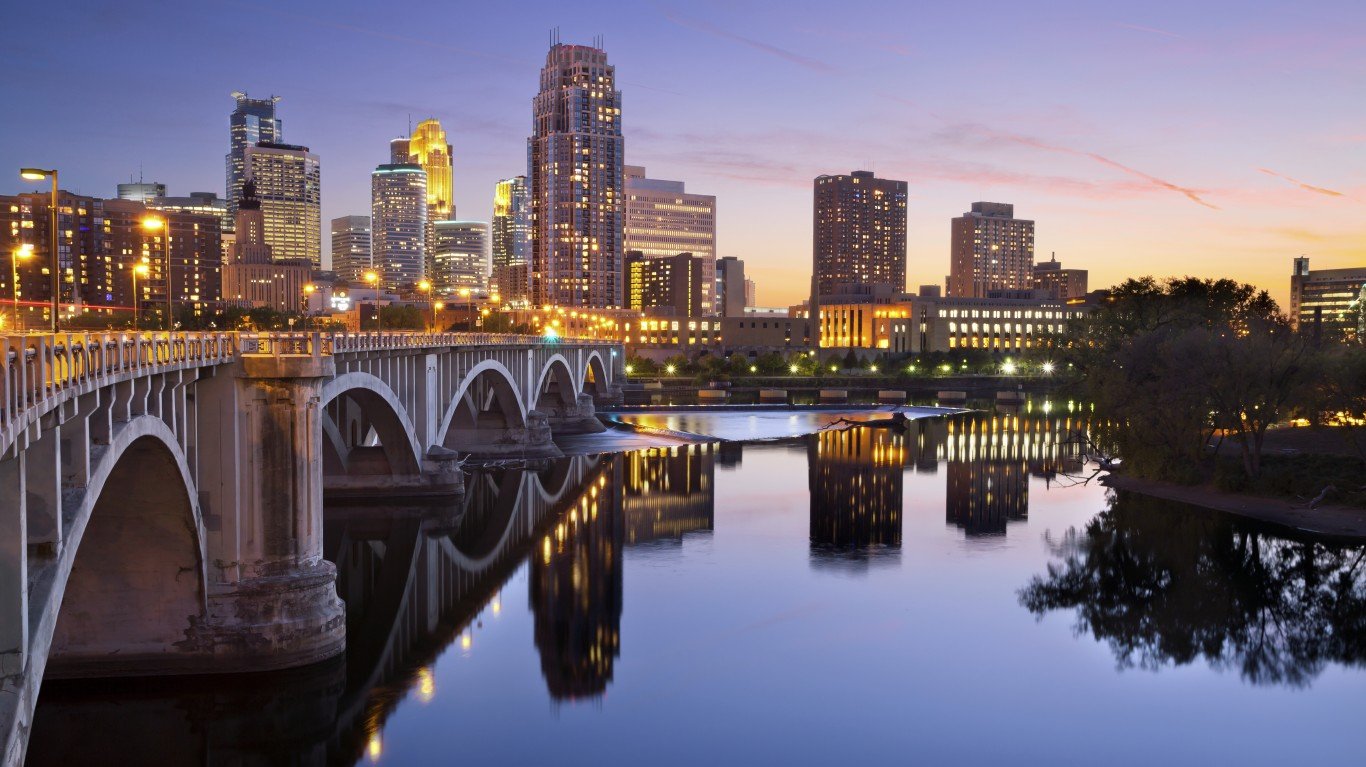
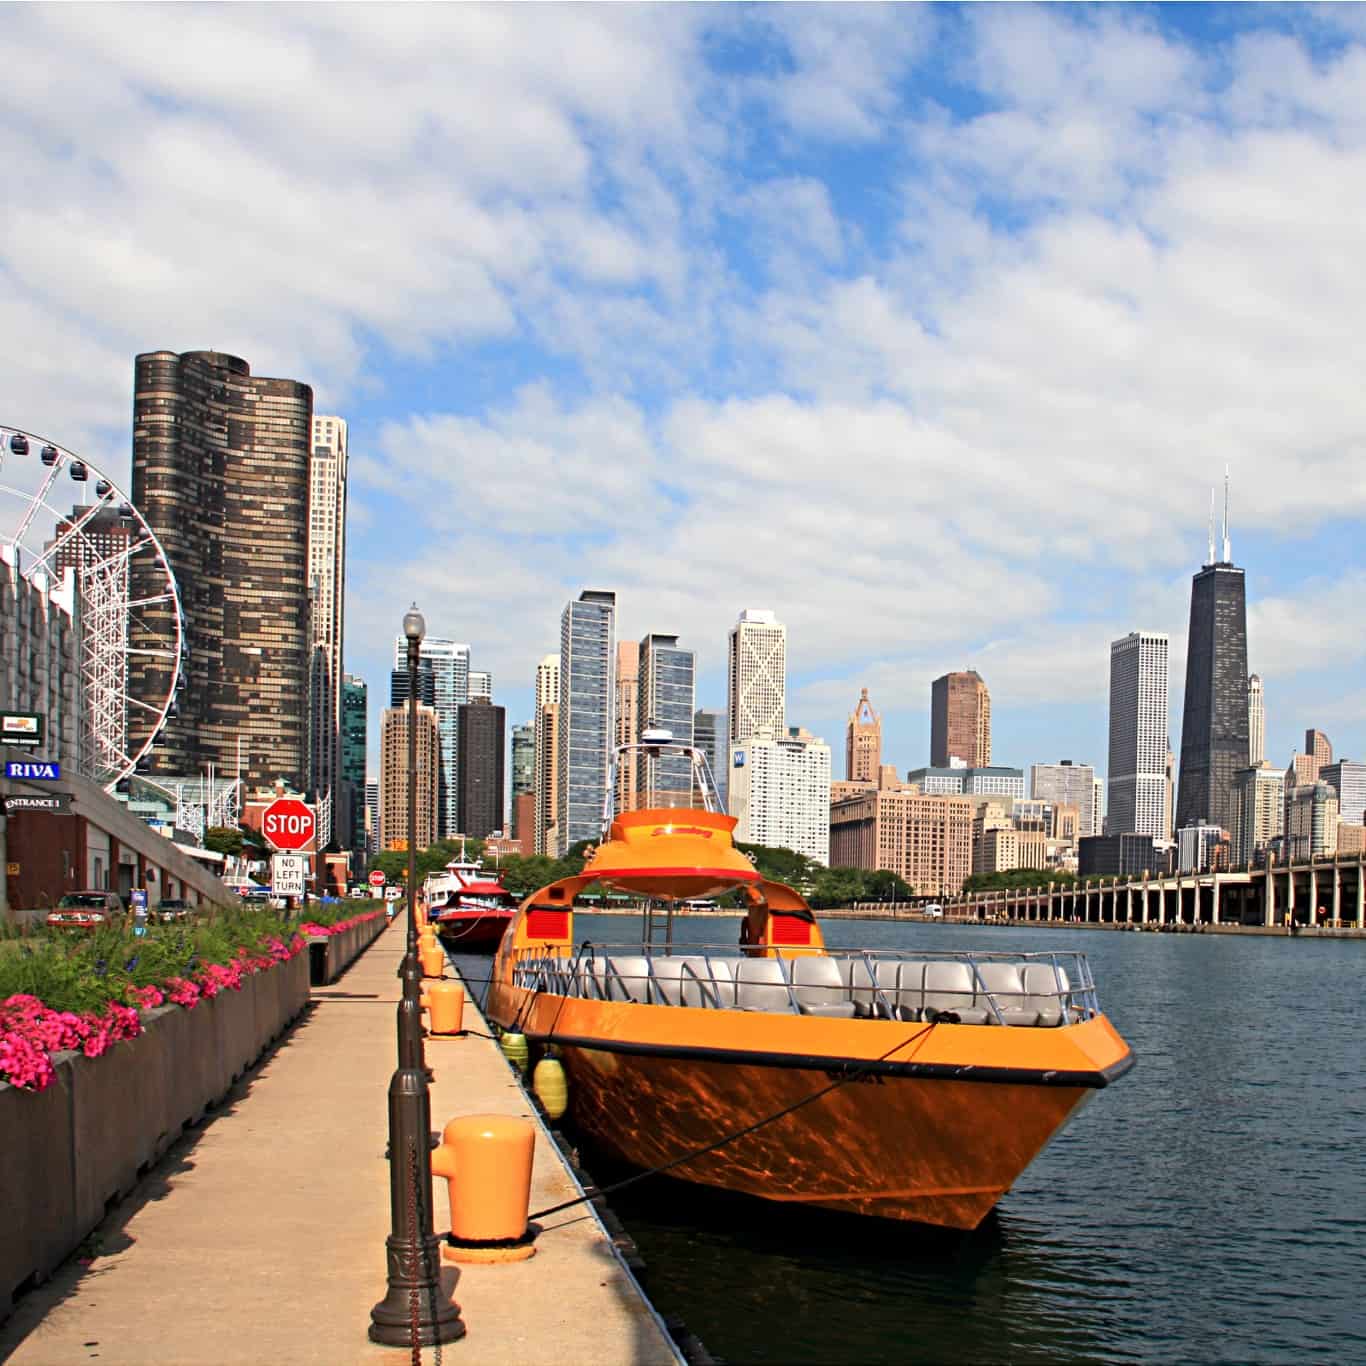
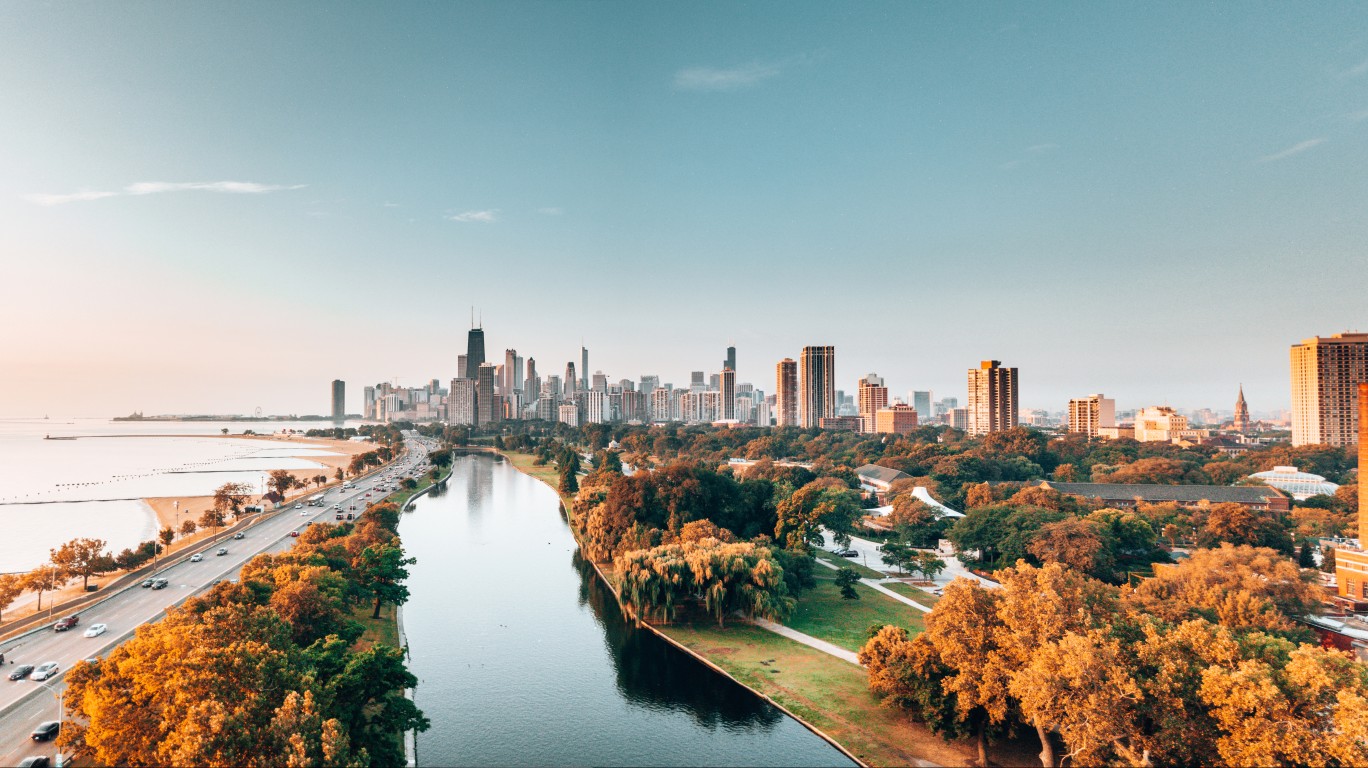
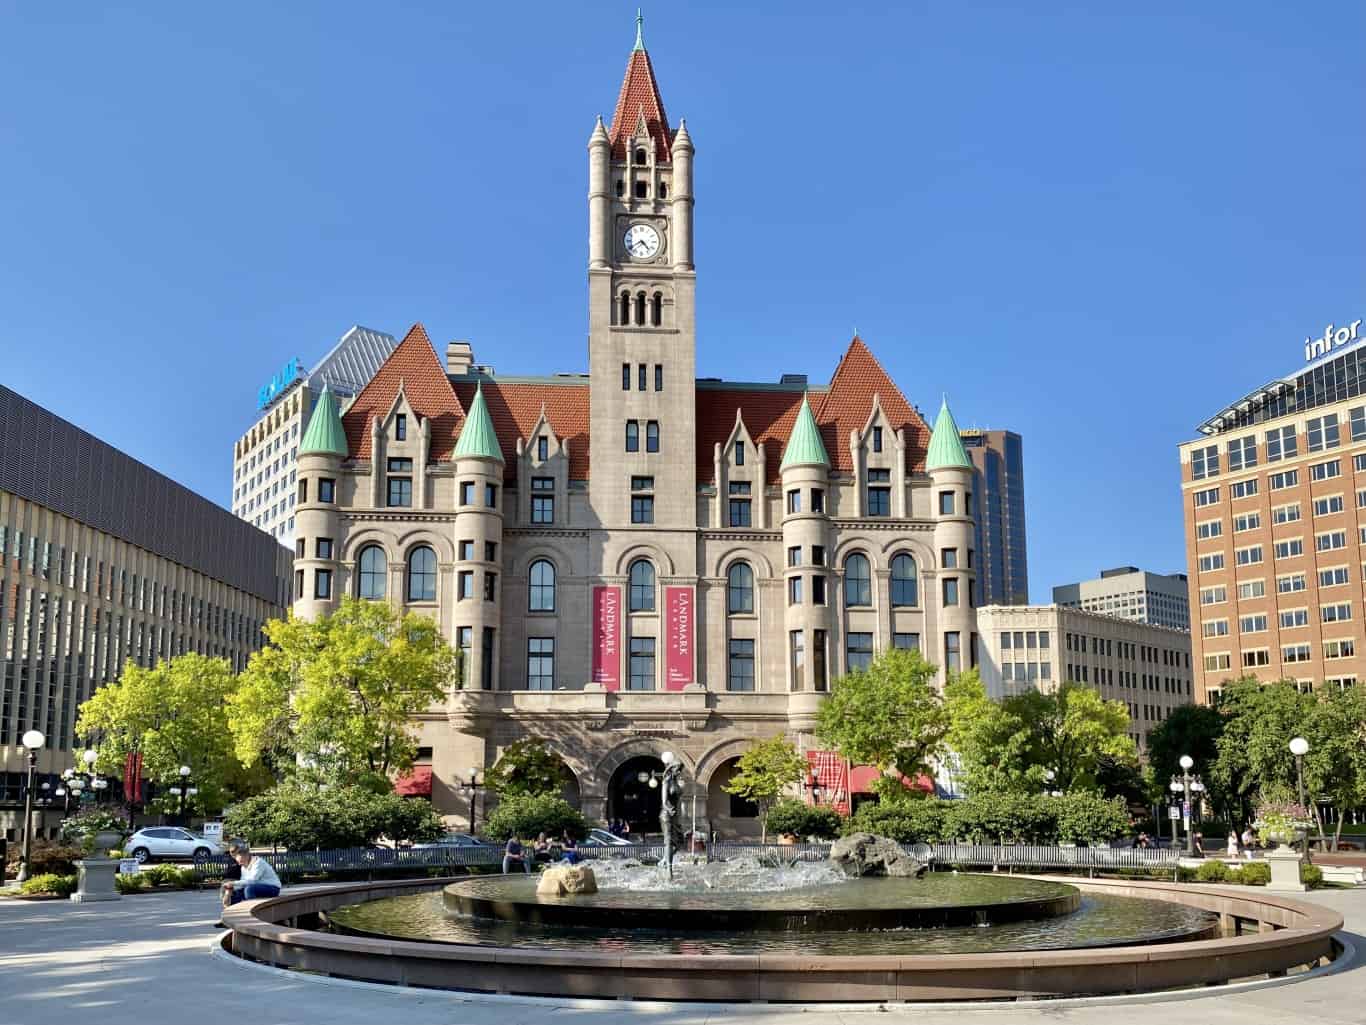
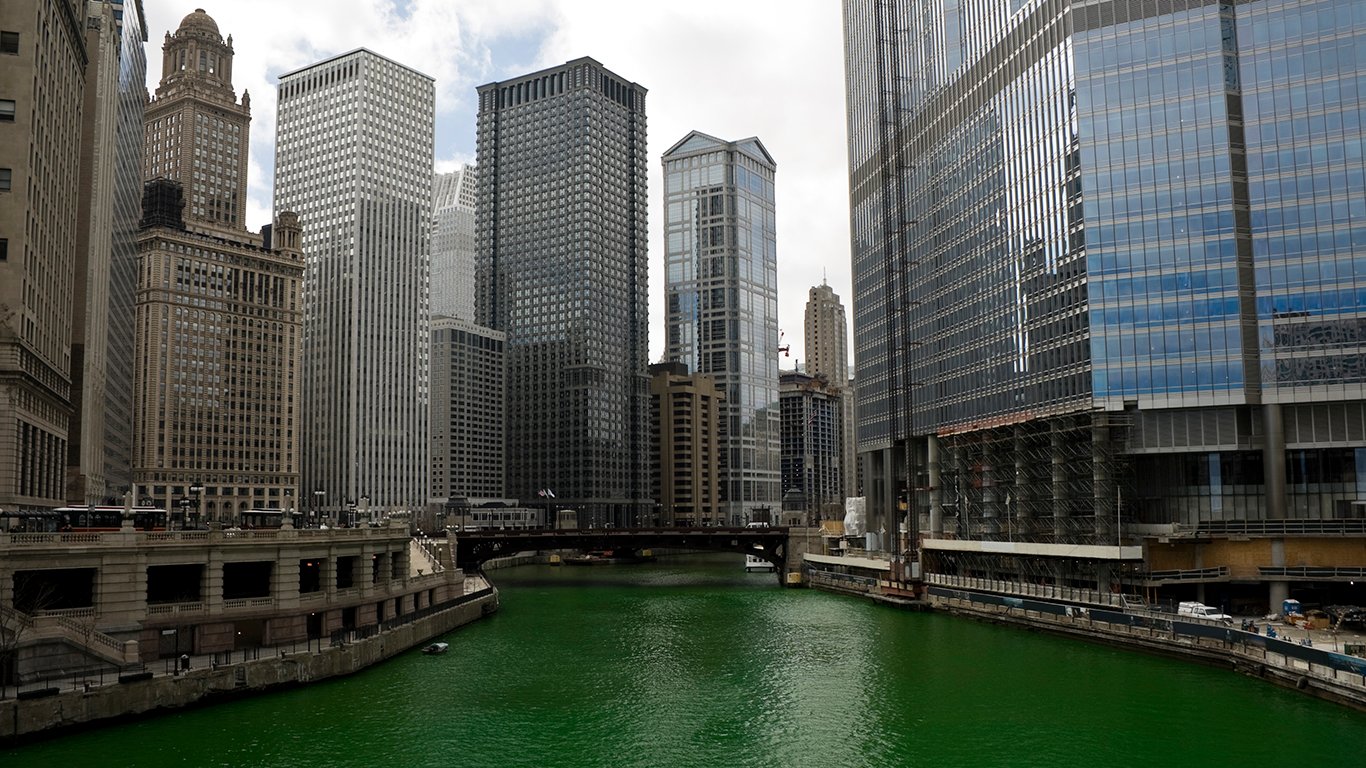
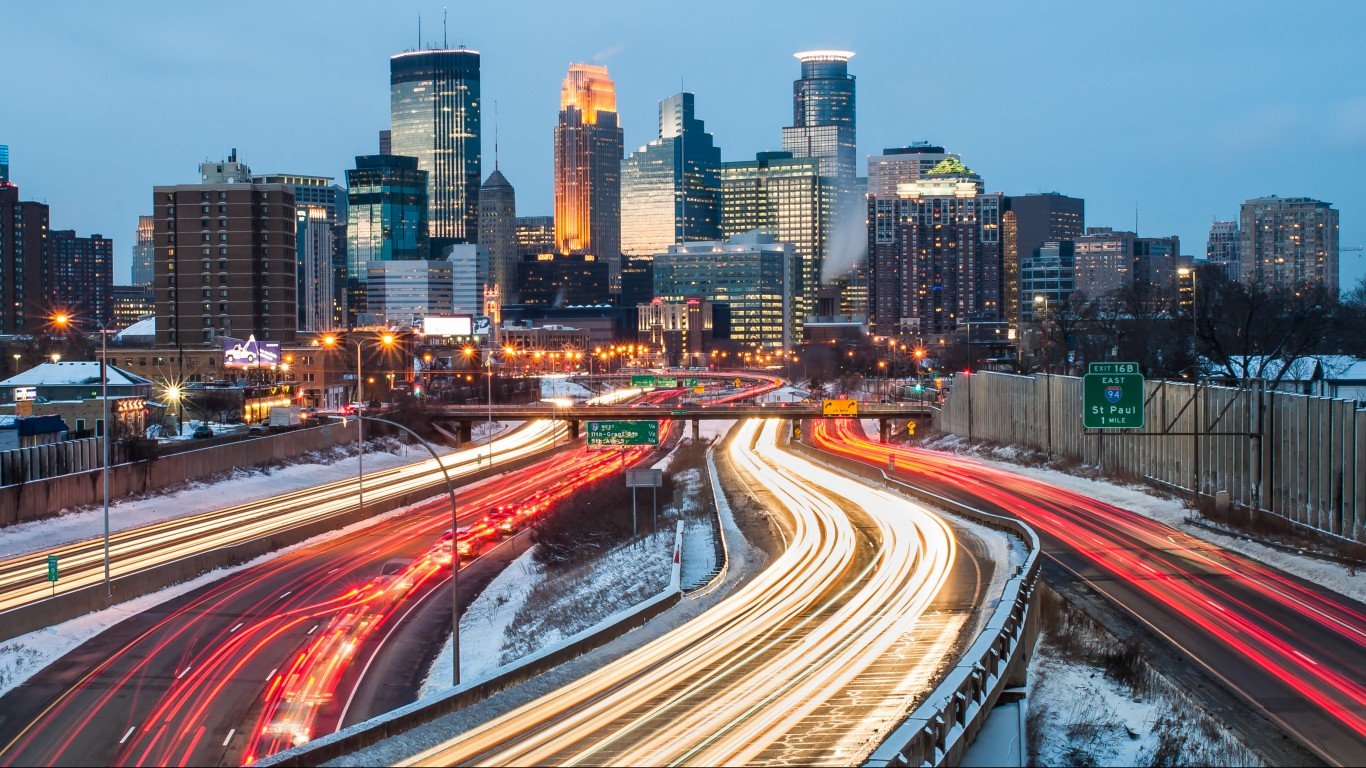
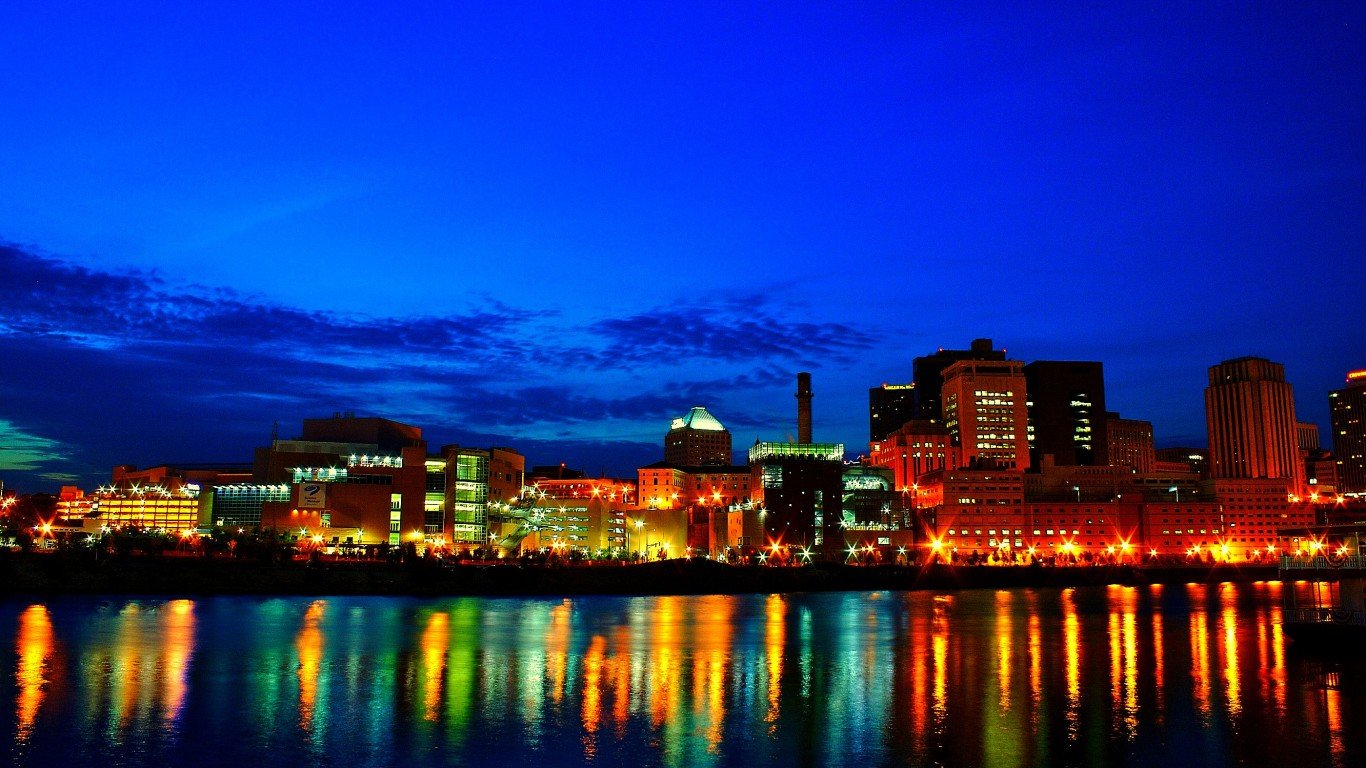
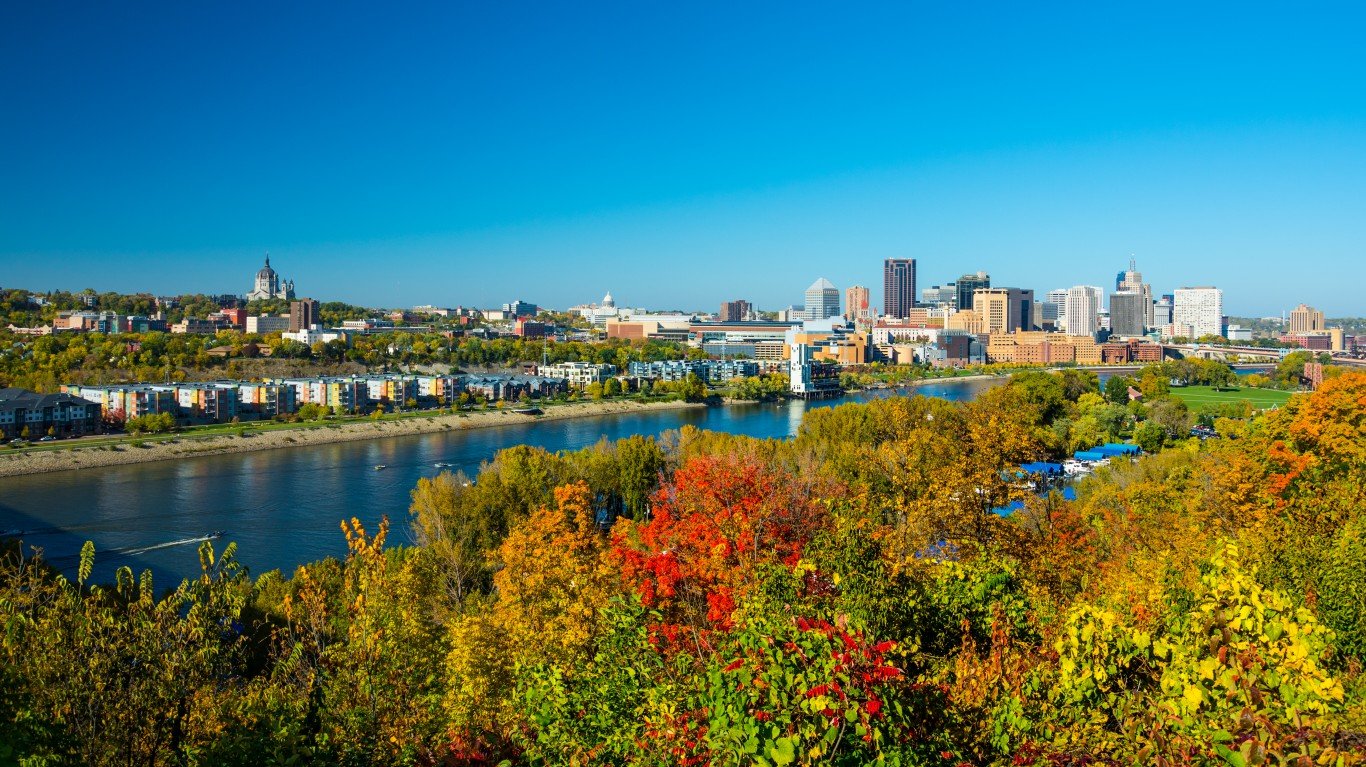
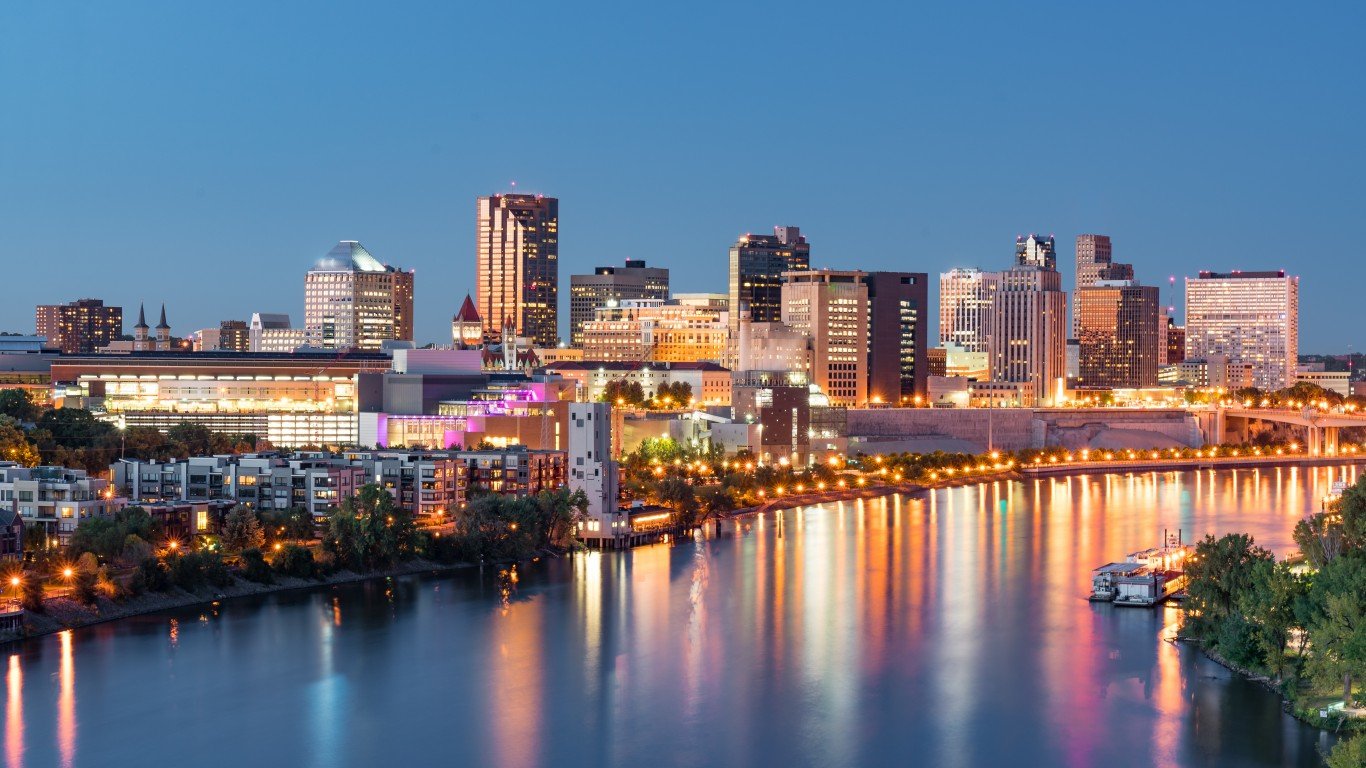
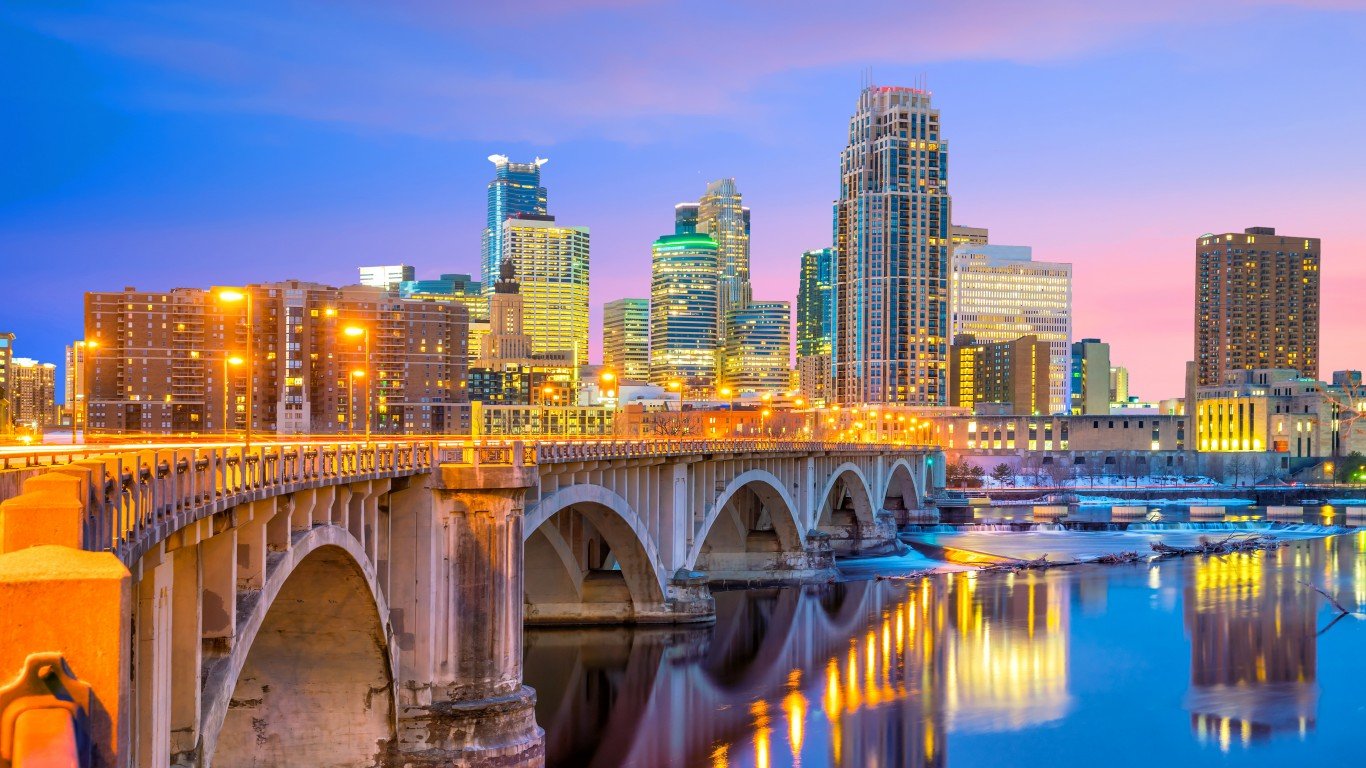
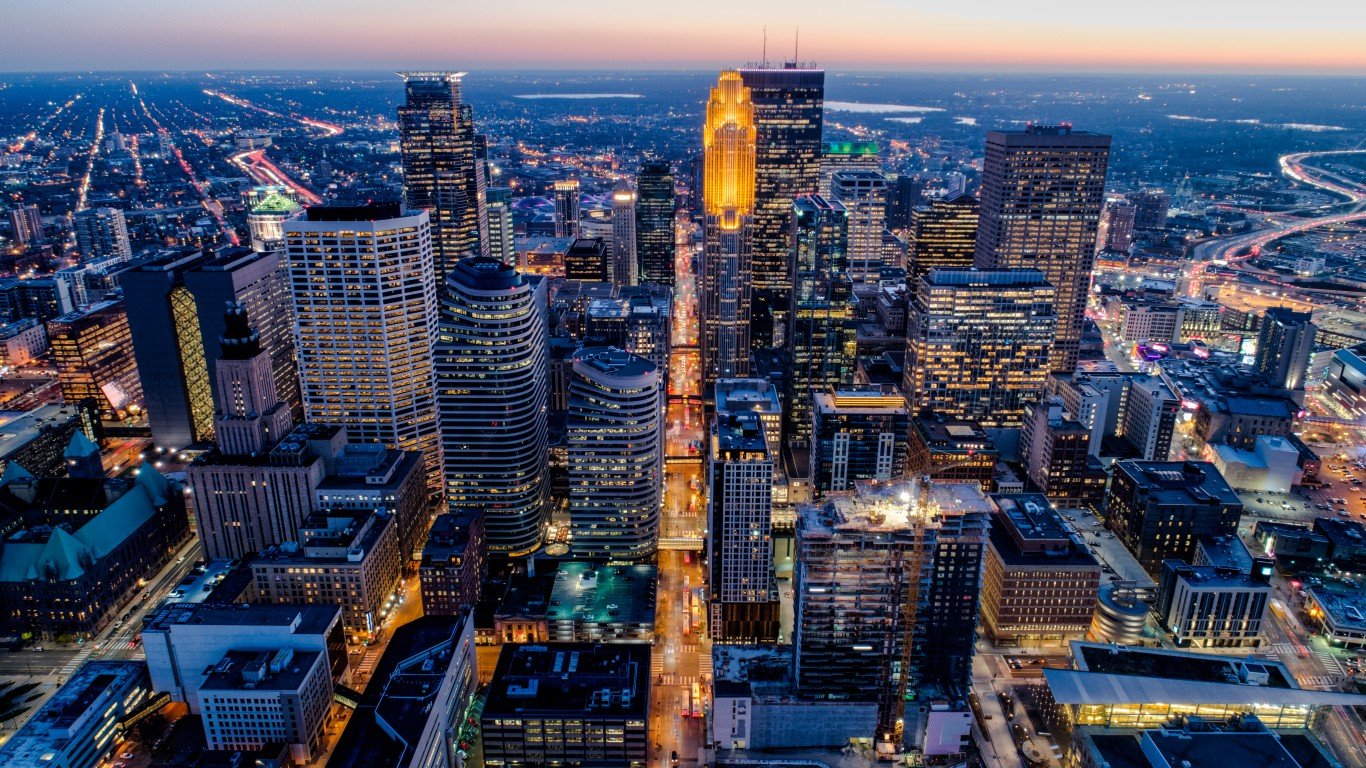
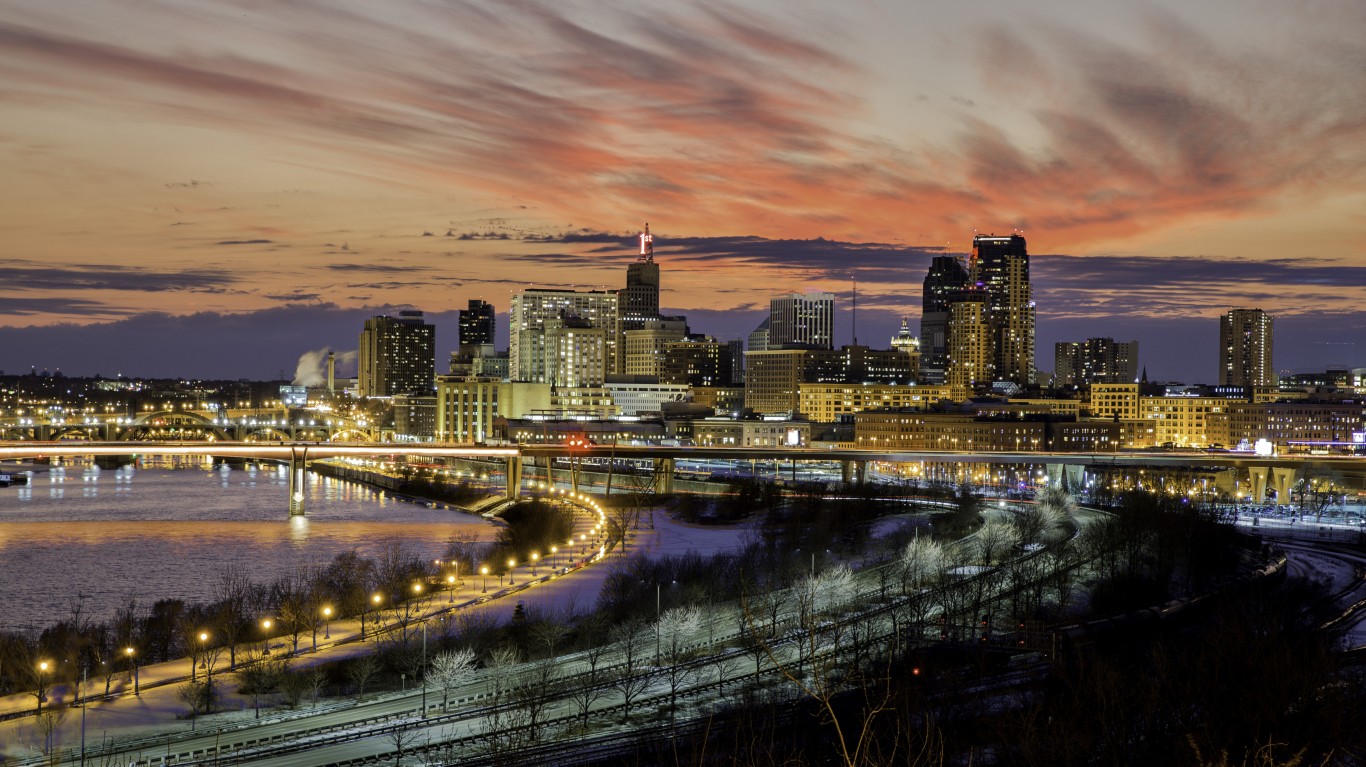
Of the 50 neighborhoods on the list, 12 are in Minneapolis, 10 in Chicago, and six in Saint Paul, Minnesota. (Also see: The Most Diverse Neighborhoods On the East Coast.)
Among the most diverse neighborhoods in the Midwest, housing tends to be cheaper than the national average, though that could be a function of overall cheaper housing in the region. The U.S. typical home value in November 2023 of $342,099, and 48 neighborhoods have lower home value.
Full Methodology
To determine the most diverse neighborhoods, 24/7 Tempo reviewed five-year data on race and ethnicity from the U.S. Census Bureau’s 2022 American Community Survey. Neighborhoods were ranked based on the probability that two residents picked at random will be of different race or ethnicity. Racial and ethnic groups include white, Black or African American, American Indian and Alaska Native, Asian, Native Hawaiian and other Pacific Islander, Hispanic or Latino, some other race alone, and two or more races. The probability that any two residents picked at random will belong to a different racial or ethnic category is equivalent to the sum of the squares of each group’s share of the population, subtracted from 1. The same method is used in the USA Today Diversity Index as well as the racial and ethnic diversity index of the Disseminating Diversity Working Group of the Census Bureau.
Data on population by race and ethnicity were aggregated from the census tract level to the neighborhood level using 2022 census tract boundary definitions from the U.S. Census Bureau and 2017 neighborhood boundary definitions from Zillow. Census tracts with at least 50% spatial overlap within the neighborhood boundary were included in population aggregation. Data on estimated median home value is the November 2023 Zillow Home Value Index, a measure of typical home values for homes in the 35th to 65th percentile range.
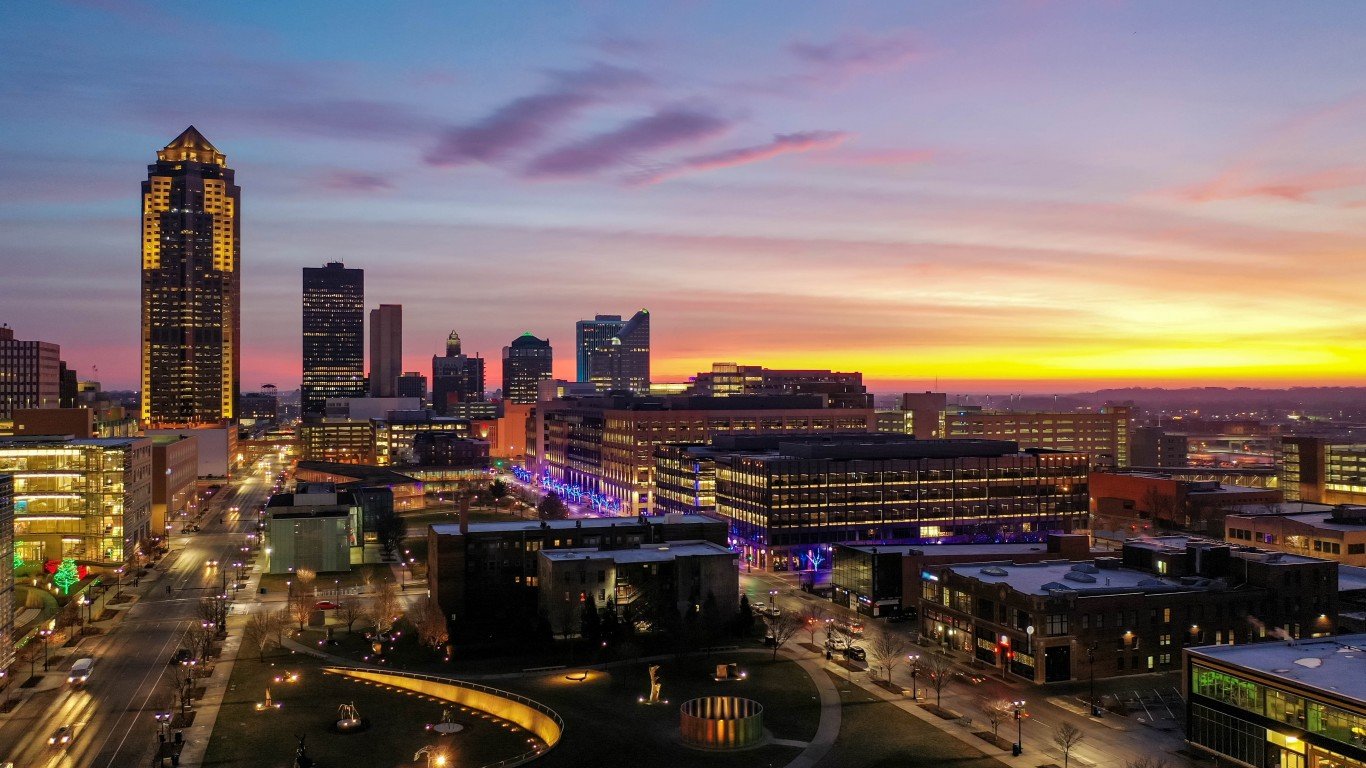
50. Prospect Park (Des Moines, IA)
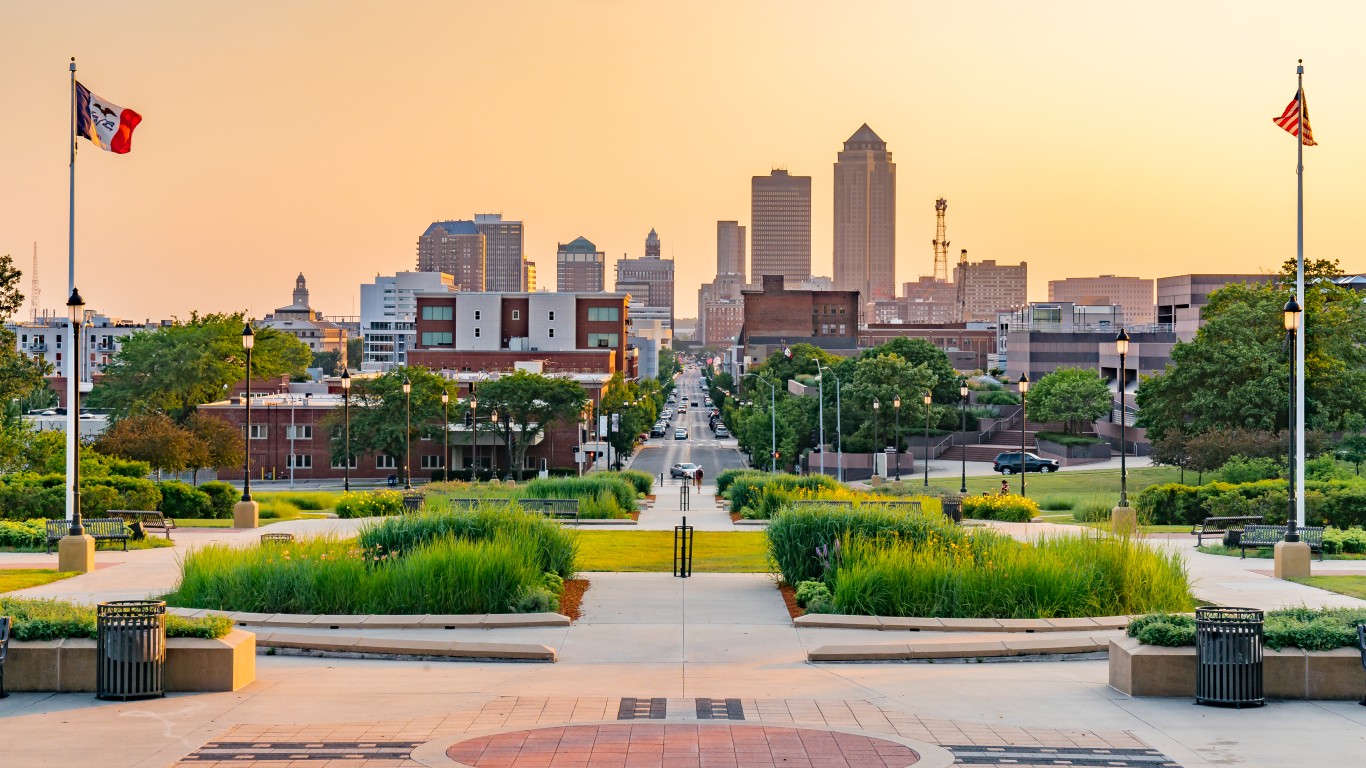
- Likelihood two random residents are different race or ethnicity: 69.9%
- Most prevalent race or ethnicity group: White (39.4%)
- Est. typical home value, Nov 2023: $176,672
- Est. population in 2022: 3,534
49. Capitol Park (Des Moines, IA)
- Likelihood two random residents are different race or ethnicity: 70.0%
- Most prevalent race or ethnicity group: Hispanic or Latino (38.4%)
- Est. typical home value, Nov 2023: $141,686
- Est. population in 2022: 2,712
48. Illinois Medical District (Chicago, IL)
- Likelihood two random residents are different race or ethnicity: 70.0%
- Most prevalent race or ethnicity group: Black or African American (47.0%)
- Est. typical home value, Nov 2023: N/A
- Est. population in 2022: 3,334
47. Near Westside (Indianapolis, IN)
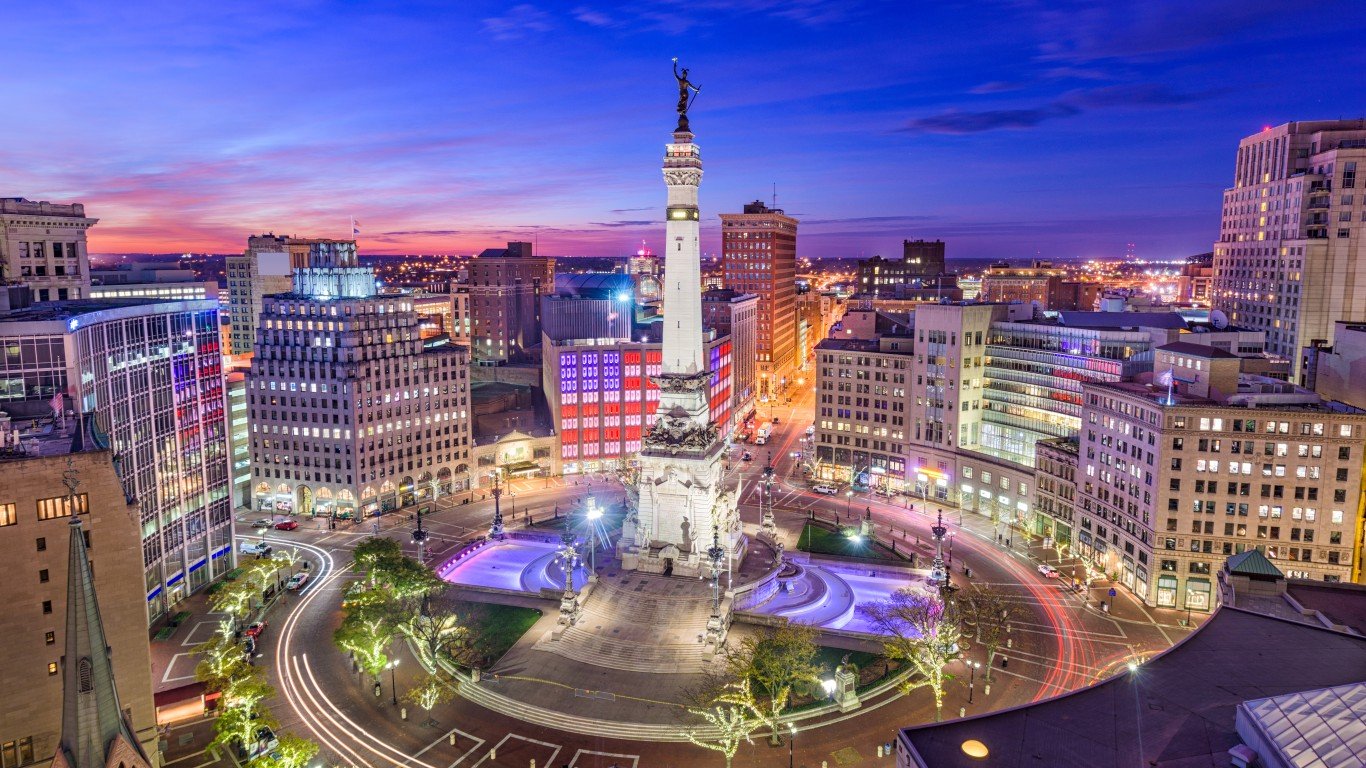
- Likelihood two random residents are different race or ethnicity: 70.0%
- Most prevalent race or ethnicity group: Hispanic or Latino (34.5%)
- Est. typical home value, Nov 2023: $101,319
- Est. population in 2022: 13,583
46. Hyde Park (Chicago, IL)
- Likelihood two random residents are different race or ethnicity: 70.4%
- Most prevalent race or ethnicity group: White (45.0%)
- Est. typical home value, Nov 2023: $228,254
- Est. population in 2022: 19,330
45. Uptown (Chicago, IL)
- Likelihood two random residents are different race or ethnicity: 70.5%
- Most prevalent race or ethnicity group: White (41.1%)
- Est. typical home value, Nov 2023: $273,785
- Est. population in 2022: 21,763
44. Brookdale Park (Brooklyn Park, MN)
- Likelihood two random residents are different race or ethnicity: 70.7%
- Most prevalent race or ethnicity group: Black or African American (36.5%)
- Est. typical home value, Nov 2023: $303,829
- Est. population in 2022: 3,076
43. Bryant (Minneapolis, MN)

- Likelihood two random residents are different race or ethnicity: 70.7%
- Most prevalent race or ethnicity group: White (37.2%)
- Est. typical home value, Nov 2023: $293,837
- Est. population in 2022: 1,554
42. West Boulevard (Cleveland, OH)
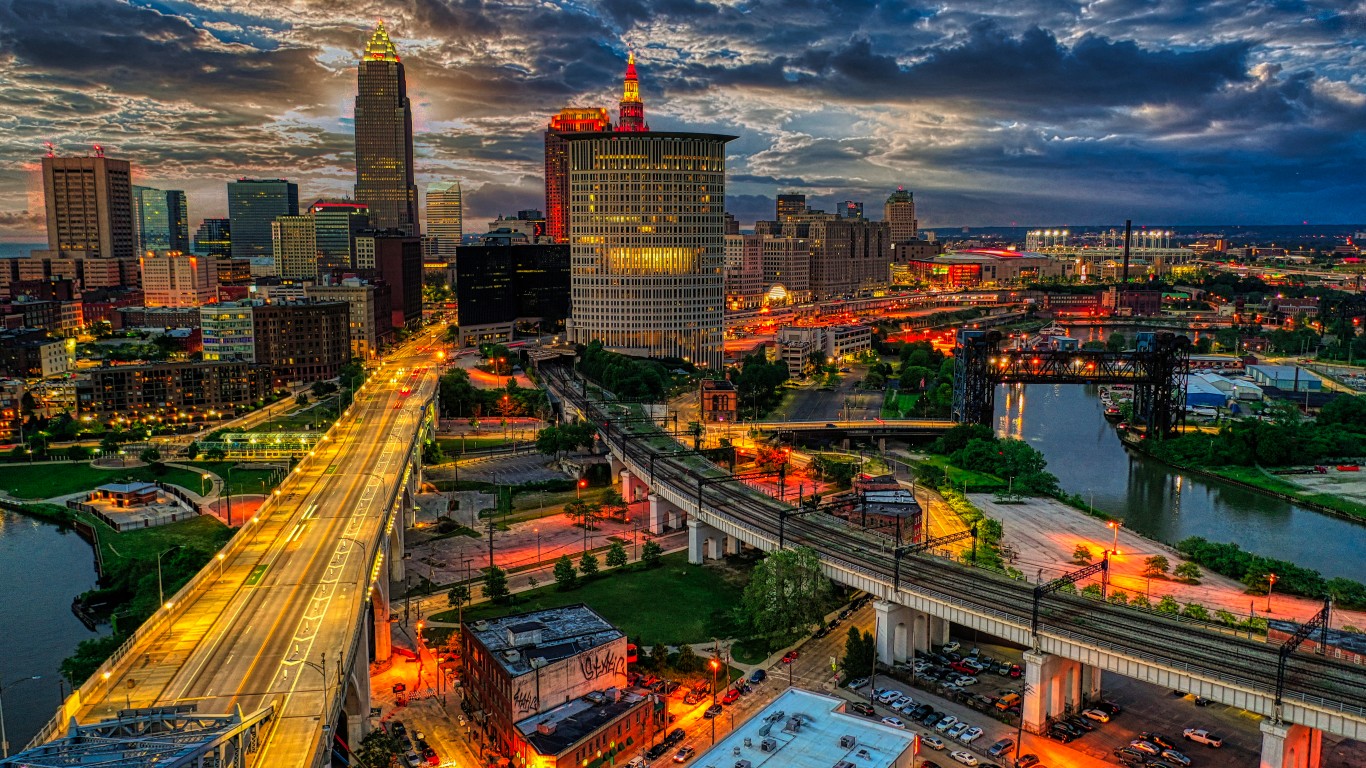
- Likelihood two random residents are different race or ethnicity: 70.8%
- Most prevalent race or ethnicity group: Hispanic or Latino (36.5%)
- Est. typical home value, Nov 2023: $104,422
- Est. population in 2022: 16,706
41. Rogers Park (Chicago, IL)
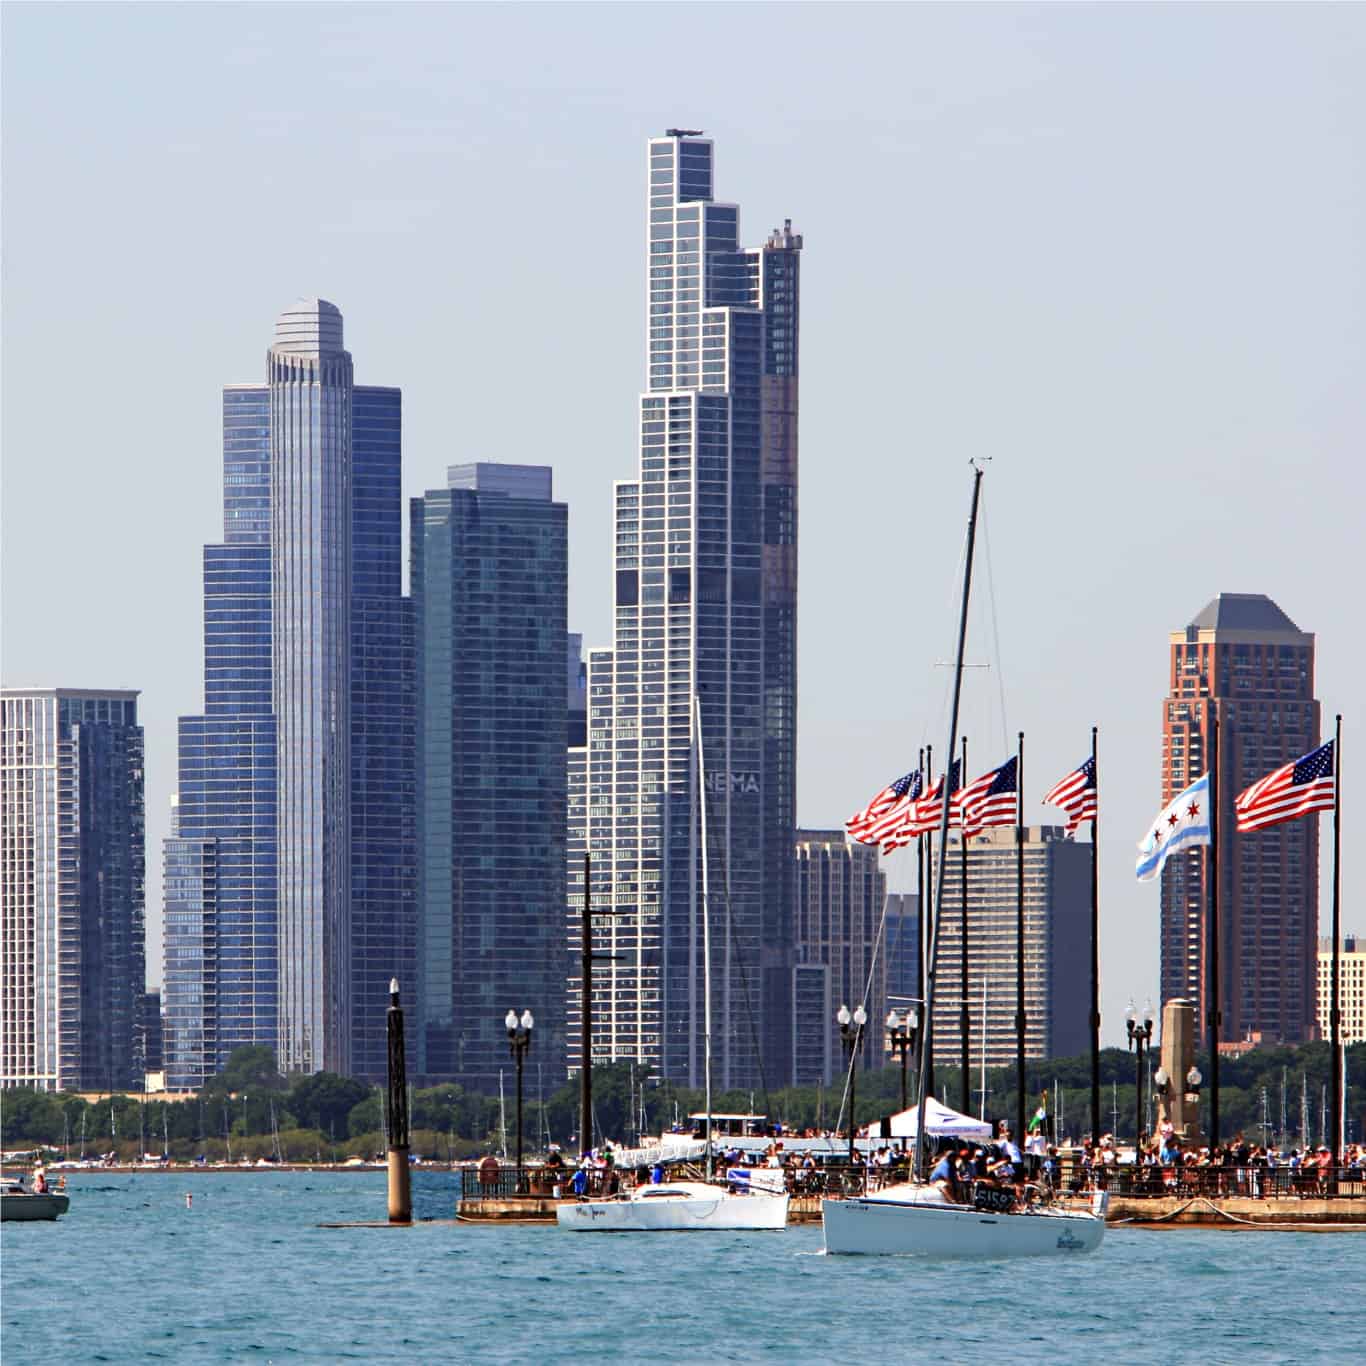
- Likelihood two random residents are different race or ethnicity: 70.8%
- Most prevalent race or ethnicity group: White (42.3%)
- Est. typical home value, Nov 2023: $211,856
- Est. population in 2022: 53,165
40. M.L. King Jr. Park (Des Moines, IA)
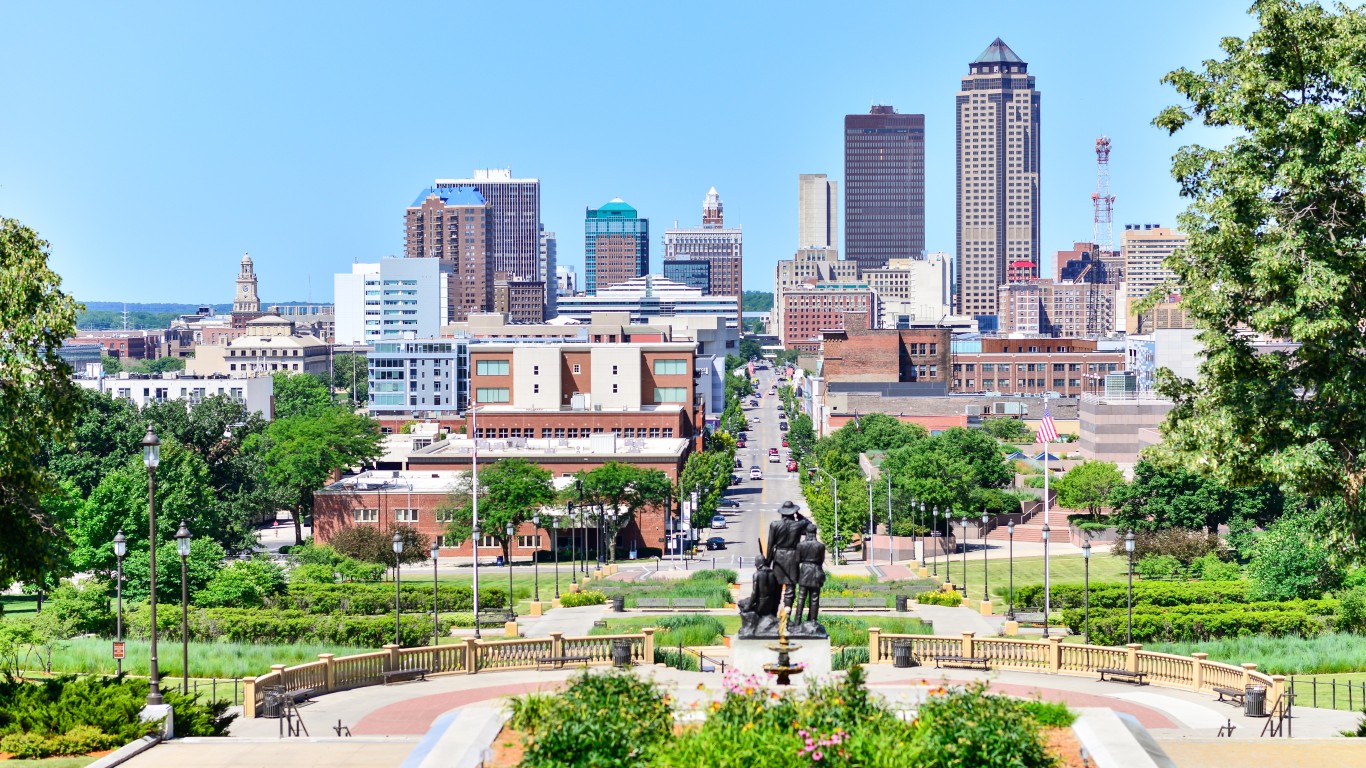
- Likelihood two random residents are different race or ethnicity: 70.9%
- Most prevalent race or ethnicity group: Hispanic or Latino (38.6%)
- Est. typical home value, Nov 2023: $138,768
- Est. population in 2022: 2,455
39. Ventura Village (Minneapolis, MN)
- Likelihood two random residents are different race or ethnicity: 70.9%
- Most prevalent race or ethnicity group: Black or African American (43.1%)
- Est. typical home value, Nov 2023: $227,044
- Est. population in 2022: 6,266
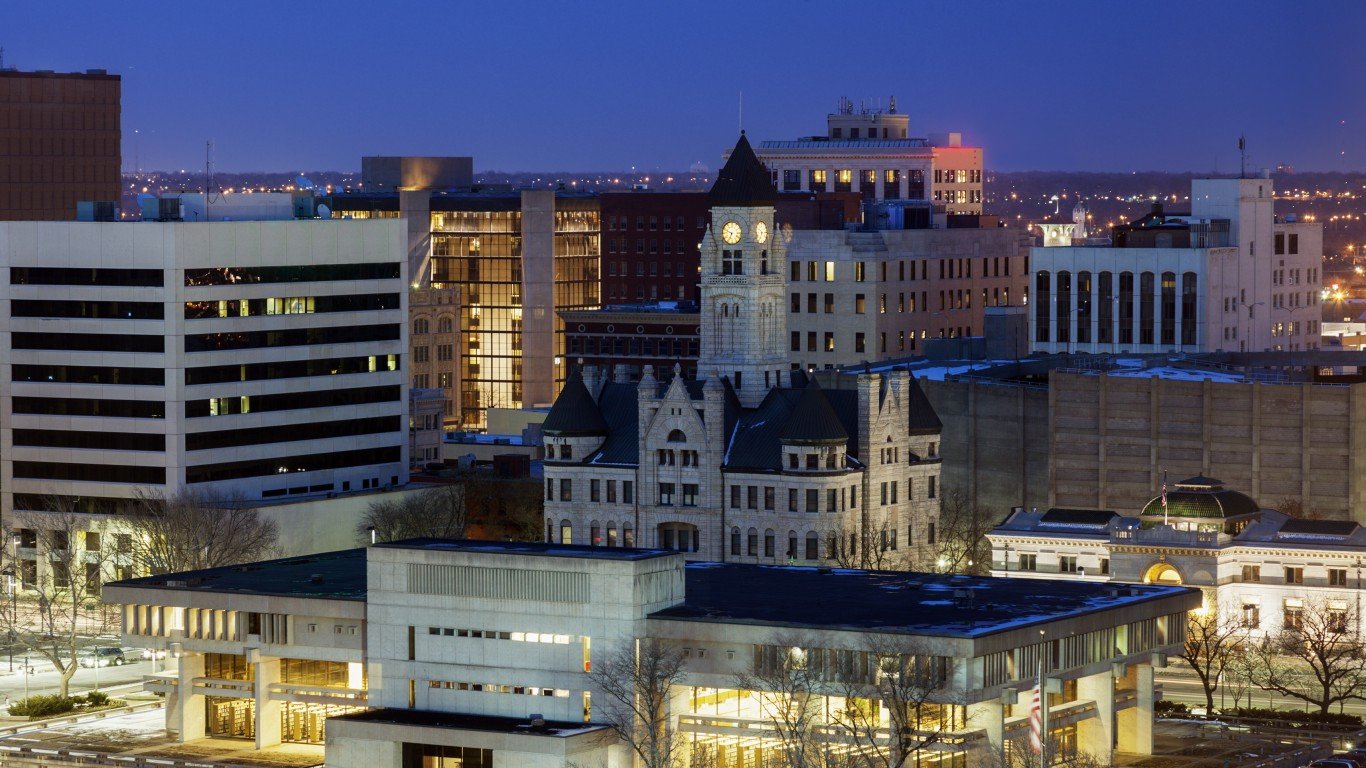
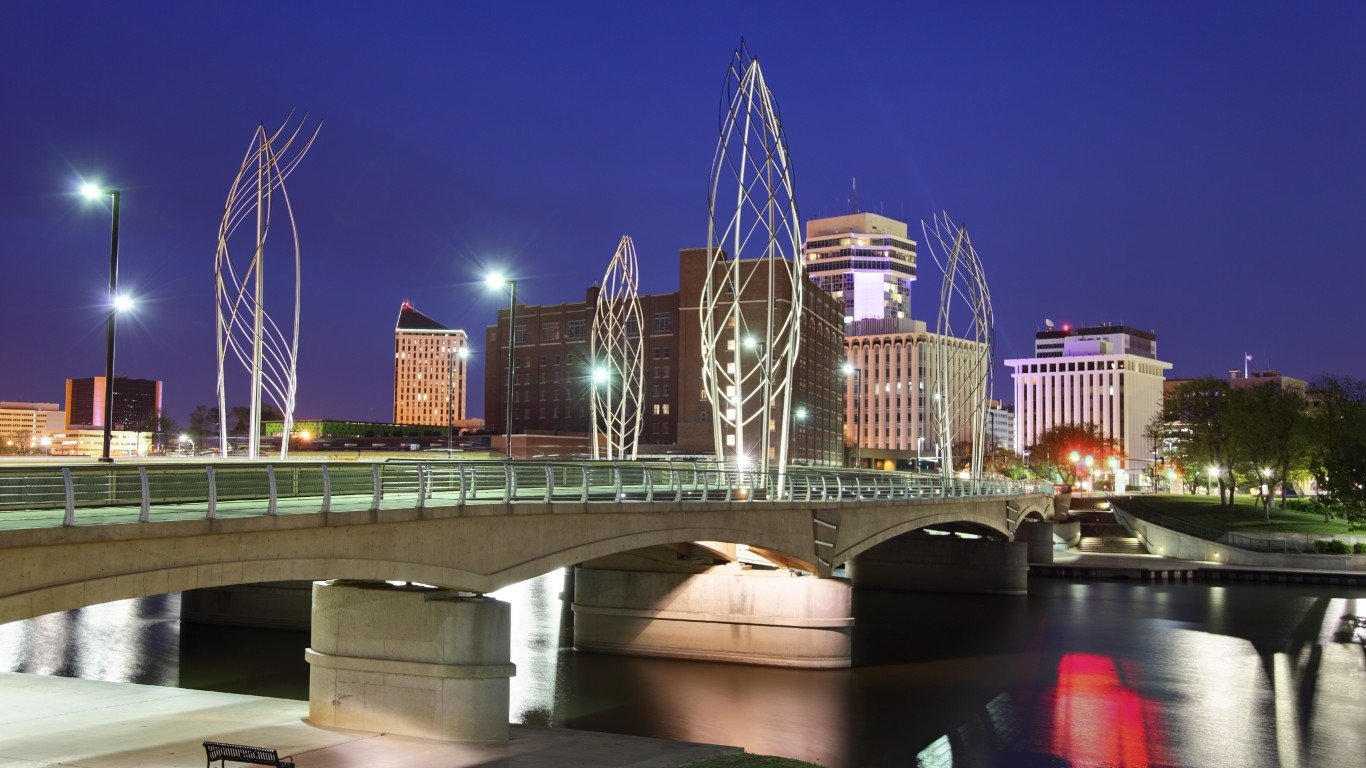
38. Planeview United (Wichita, KS)
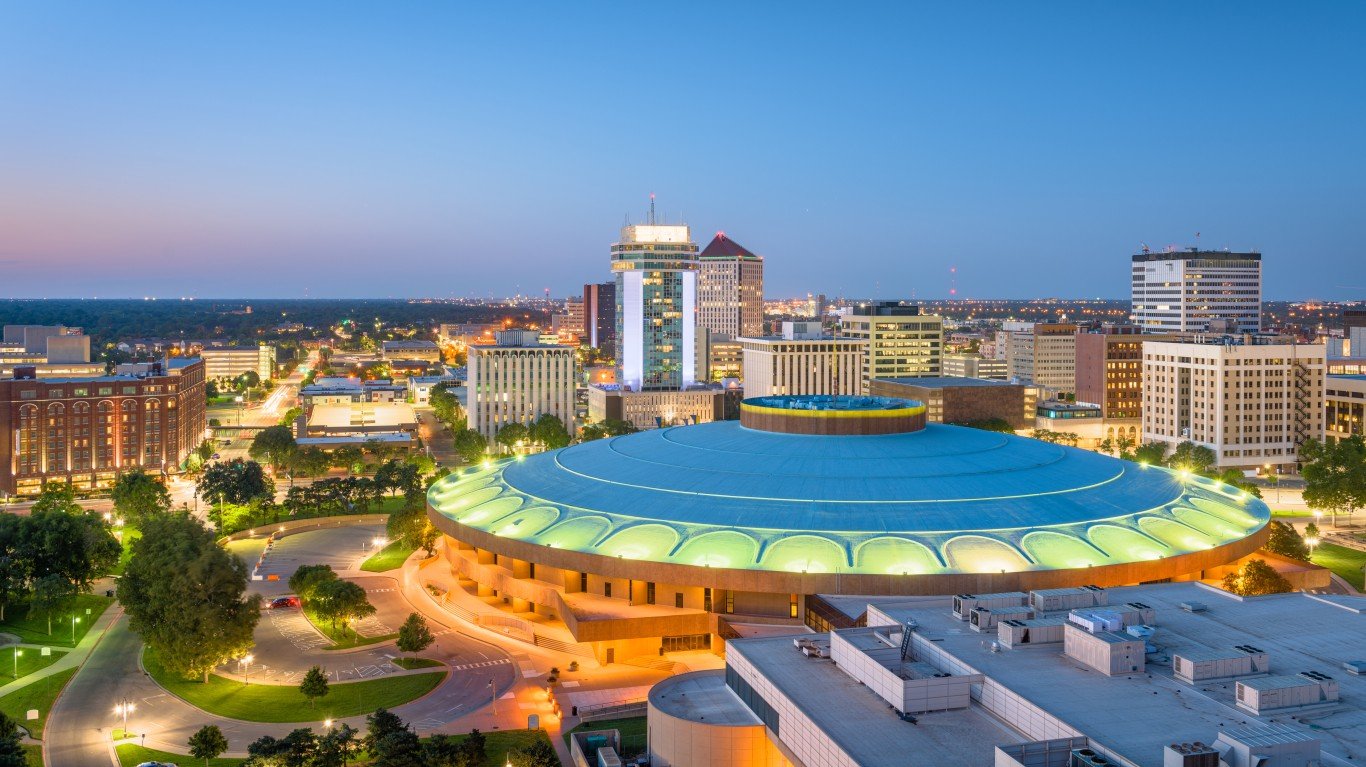
- Likelihood two random residents are different race or ethnicity: 70.9%
- Most prevalent race or ethnicity group: Hispanic or Latino (46.1%)
- Est. typical home value, Nov 2023: $65,395
- Est. population in 2022: 3,625
37. Hubbard-Richard (Detroit, MI)
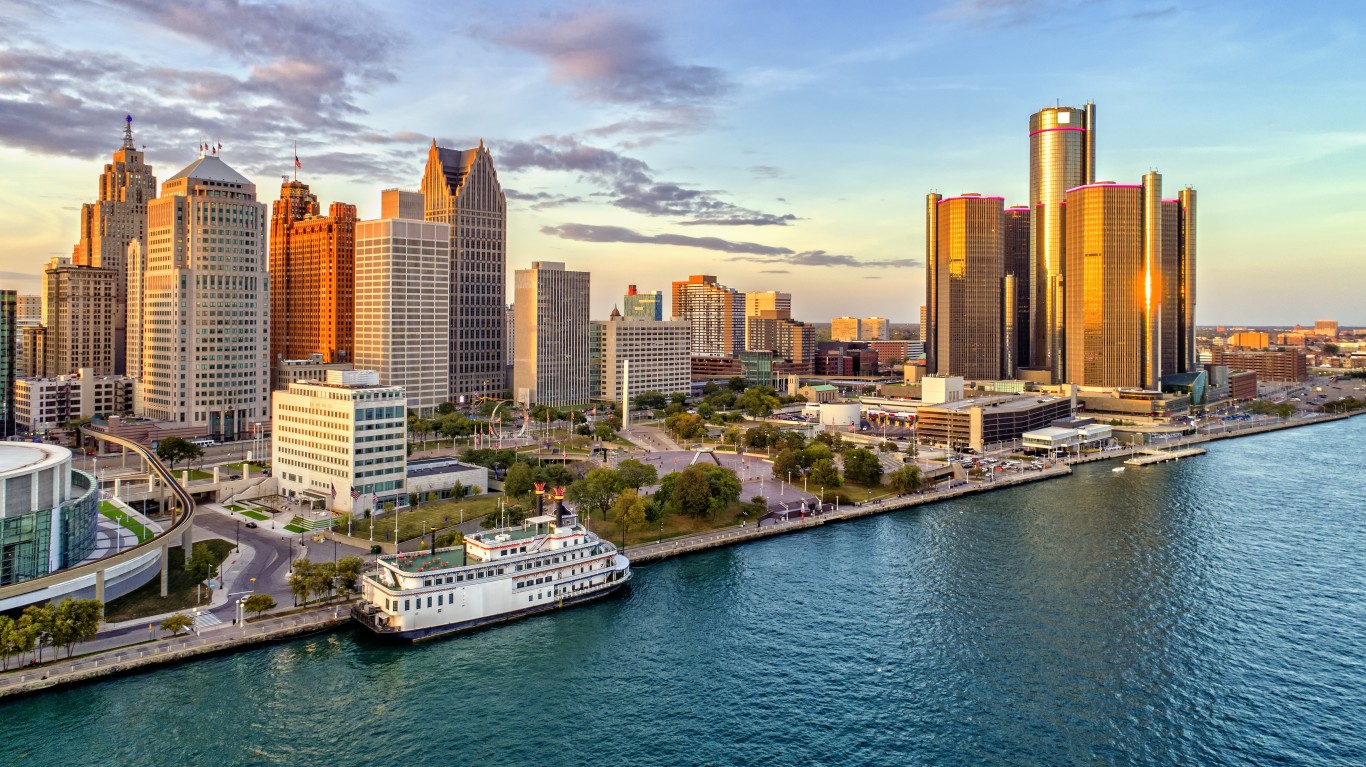
- Likelihood two random residents are different race or ethnicity: 71.0%
- Most prevalent race or ethnicity group: Hispanic or Latino (37.3%)
- Est. typical home value, Nov 2023: $213,838
- Est. population in 2022: 1,502
36. Churchill Downs (Lansing, MI)
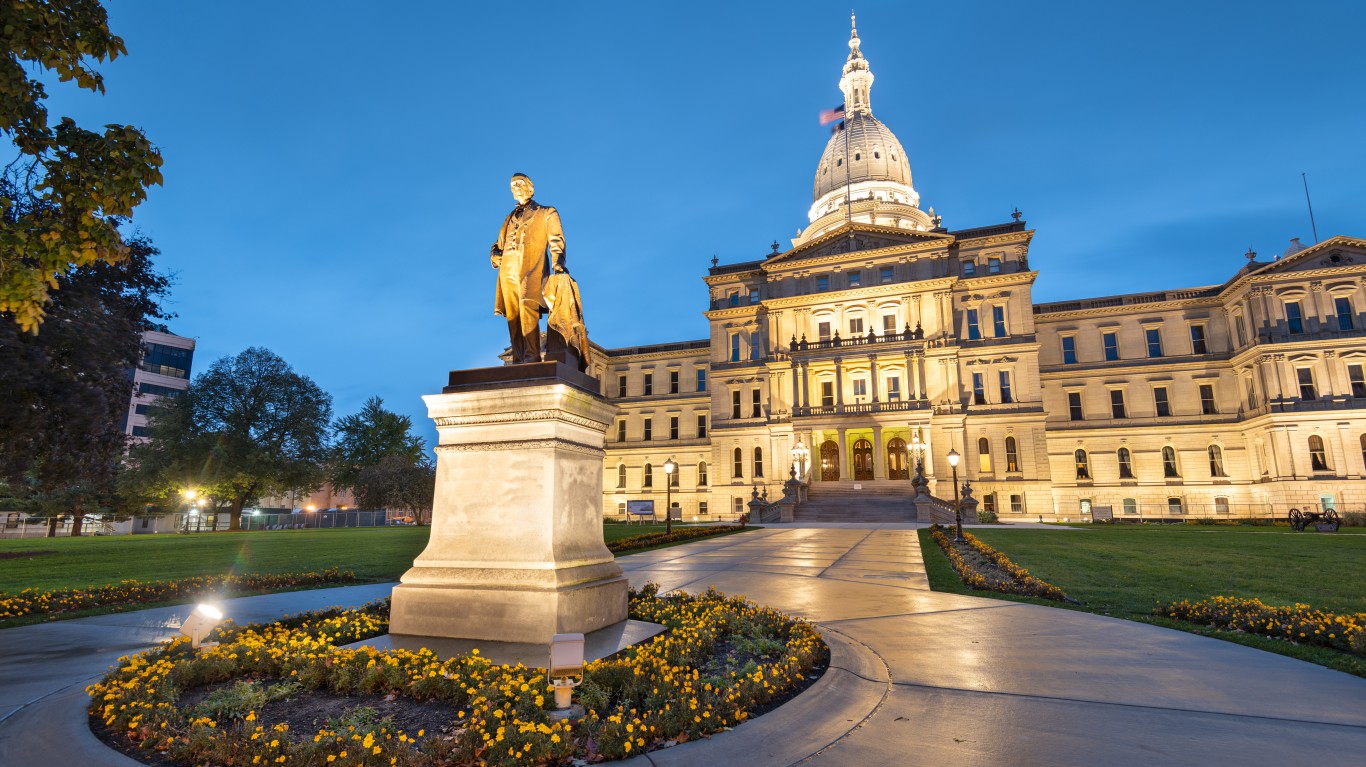
- Likelihood two random residents are different race or ethnicity: 71.1%
- Most prevalent race or ethnicity group: Black or African American (40.8%)
- Est. typical home value, Nov 2023: $132,305
- Est. population in 2022: 3,748
35. Millbrook (Grand Rapids, MI)
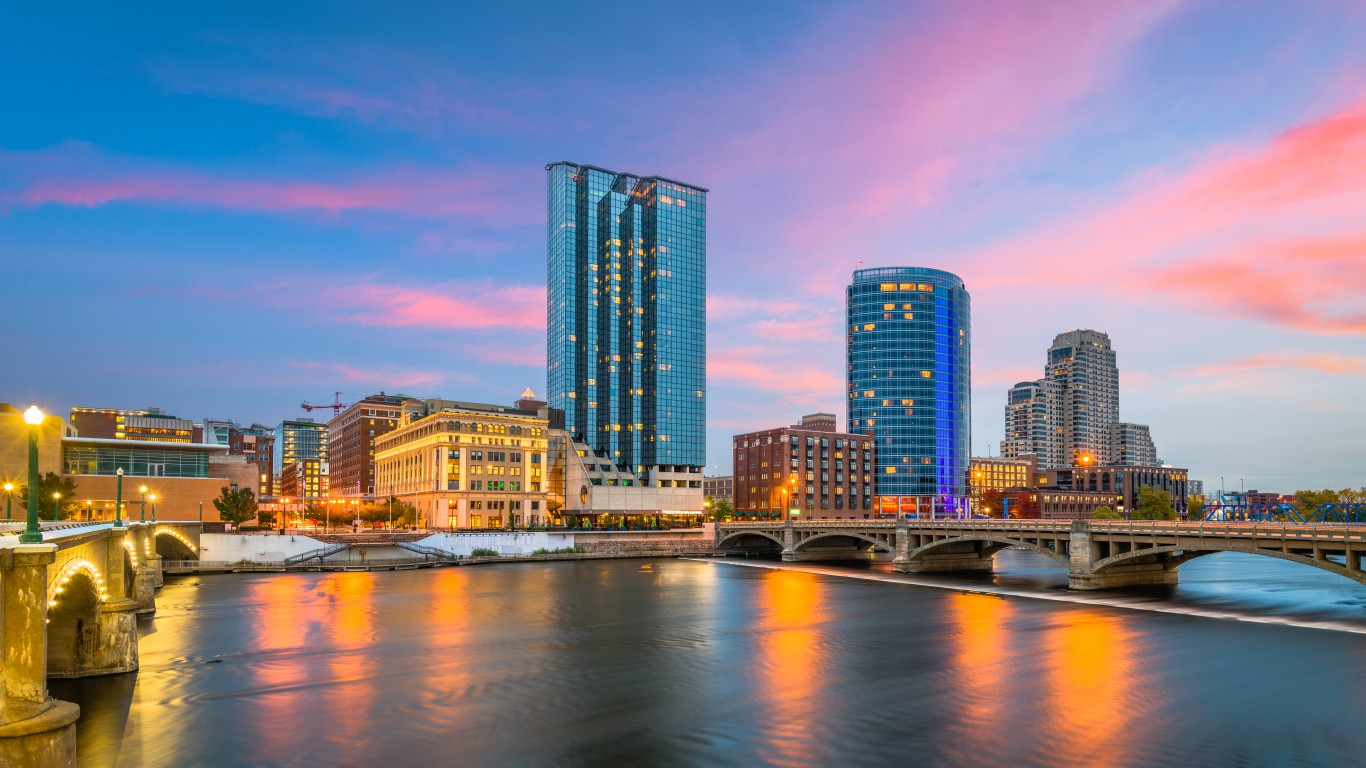
- Likelihood two random residents are different race or ethnicity: 71.1%
- Most prevalent race or ethnicity group: White (41.8%)
- Est. typical home value, Nov 2023: $308,242
- Est. population in 2022: 5,920
34. Central (Minneapolis, MN)

- Likelihood two random residents are different race or ethnicity: 71.2%
- Most prevalent race or ethnicity group: White (36.4%)
- Est. typical home value, Nov 2023: $283,566
- Est. population in 2022: 7,087
33. East Phillips (Minneapolis, MN)
- Likelihood two random residents are different race or ethnicity: 71.3%
- Most prevalent race or ethnicity group: Hispanic or Latino (43.8%)
- Est. typical home value, Nov 2023: $226,455
- Est. population in 2022: 4,936
32. Payne Phalen (Saint Paul, MN)
- Likelihood two random residents are different race or ethnicity: 71.3%
- Most prevalent race or ethnicity group: Asian (42.4%)
- Est. typical home value, Nov 2023: $238,784
- Est. population in 2022: 31,531
31. Jordan (Minneapolis, MN)
- Likelihood two random residents are different race or ethnicity: 71.4%
- Most prevalent race or ethnicity group: Black or African American (45.6%)
- Est. typical home value, Nov 2023: $208,888
- Est. population in 2022: 8,360
30. Madison Area (Grand Rapids, MI)
- Likelihood two random residents are different race or ethnicity: 71.5%
- Most prevalent race or ethnicity group: Black or African American (39.9%)
- Est. typical home value, Nov 2023: $170,501
- Est. population in 2022: 2,636
29. South Area (Wichita, KS)
- Likelihood two random residents are different race or ethnicity: 71.6%
- Most prevalent race or ethnicity group: White (41.7%)
- Est. typical home value, Nov 2023: $159,312
- Est. population in 2022: 3,506
28. Willard Hay (Minneapolis, MN)
- Likelihood two random residents are different race or ethnicity: 71.7%
- Most prevalent race or ethnicity group: Black or African American (40.8%)
- Est. typical home value, Nov 2023: $235,538
- Est. population in 2022: 9,027
27. Menomonee River Valley (Milwaukee, WI)
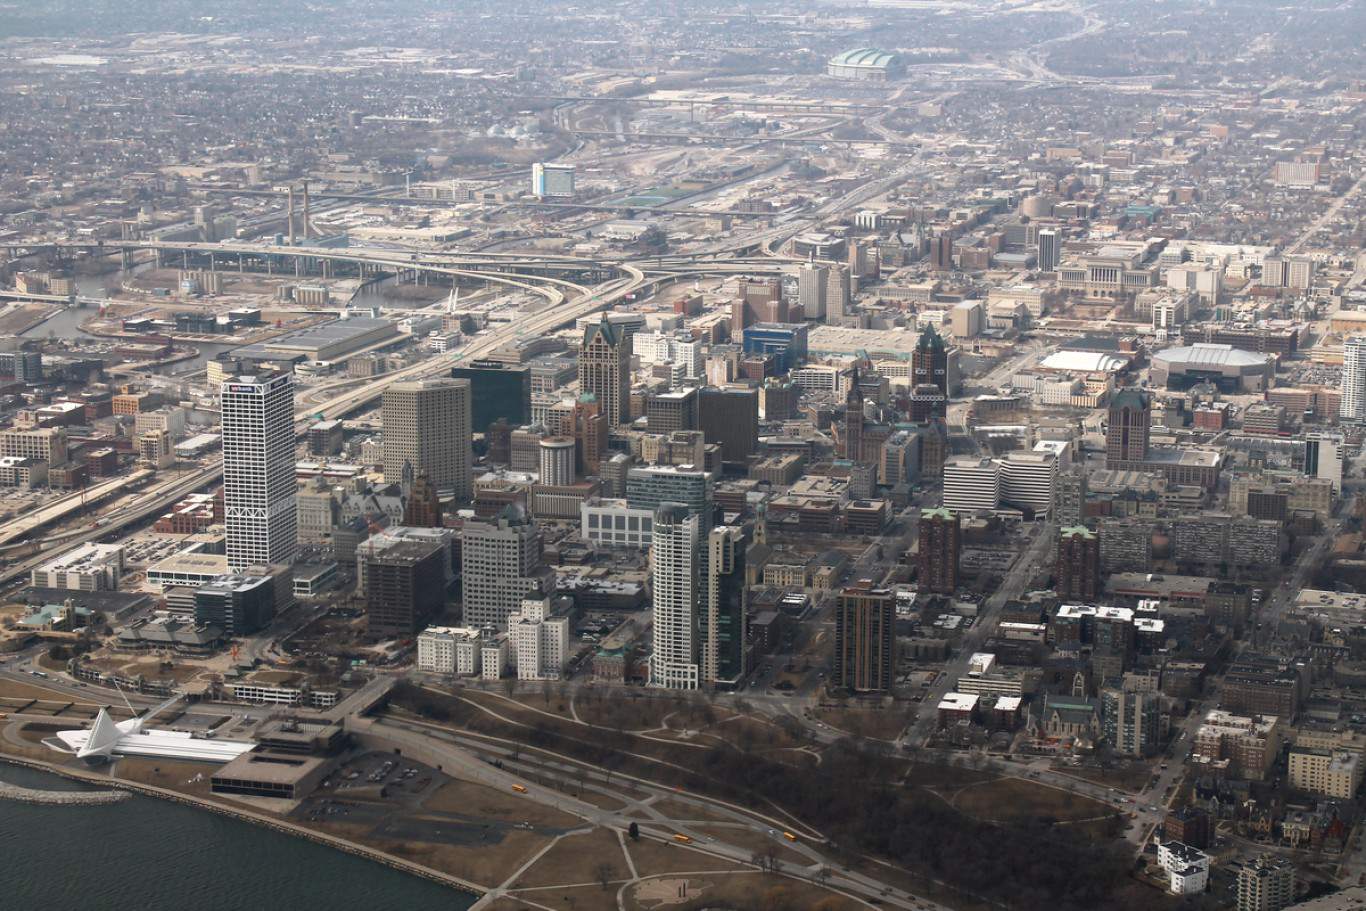
- Likelihood two random residents are different race or ethnicity: 71.7%
- Most prevalent race or ethnicity group: White (31.6%)
- Est. typical home value, Nov 2023: $416,898
- Est. population in 2022: 1,262
26. Hawthorne (Minneapolis, MN)
- Likelihood two random residents are different race or ethnicity: 71.7%
- Most prevalent race or ethnicity group: Black or African American (47.1%)
- Est. typical home value, Nov 2023: $220,934
- Est. population in 2022: 4,108
25. Edgewater (Chicago, IL)
- Likelihood two random residents are different race or ethnicity: 71.9%
- Most prevalent race or ethnicity group: White (41.3%)
- Est. typical home value, Nov 2023: $228,038
- Est. population in 2022: 9,069
24. Woodward Park (Columbus, OH)
- Likelihood two random residents are different race or ethnicity: 71.9%
- Most prevalent race or ethnicity group: White (36.7%)
- Est. typical home value, Nov 2023: $254,178
- Est. population in 2022: 3,867
23. Folwell (Minneapolis, MN)
- Likelihood two random residents are different race or ethnicity: 72.1%
- Most prevalent race or ethnicity group: Black or African American (38.6%)
- Est. typical home value, Nov 2023: $198,105
- Est. population in 2022: 4,231
22. Arcadia Terrace (Chicago, IL)
- Likelihood two random residents are different race or ethnicity: 72.7%
- Most prevalent race or ethnicity group: White (35.9%)
- Est. typical home value, Nov 2023: $336,726
- Est. population in 2022: 5,864
21. Forest Park West (Columbus, OH)
- Likelihood two random residents are different race or ethnicity: 72.9%
- Most prevalent race or ethnicity group: White (38.7%)
- Est. typical home value, Nov 2023: $260,958
- Est. population in 2022: 3,928
20. Budlong Woods (Chicago, IL)
- Likelihood two random residents are different race or ethnicity: 73.0%
- Most prevalent race or ethnicity group: White (33.7%)
- Est. typical home value, Nov 2023: $231,051
- Est. population in 2022: 9,608
19. North End (Saint Paul, MN)
- Likelihood two random residents are different race or ethnicity: 73.4%
- Most prevalent race or ethnicity group: Asian (33.0%)
- Est. typical home value, Nov 2023: $221,242
- Est. population in 2022: 26,713
18. West Rogers Park (Chicago, IL)
- Likelihood two random residents are different race or ethnicity: 73.5%
- Most prevalent race or ethnicity group: White (39.5%)
- Est. typical home value, Nov 2023: $235,752
- Est. population in 2022: 71,376
17. Tri-Taylor (Chicago, IL)
- Likelihood two random residents are different race or ethnicity: 73.5%
- Most prevalent race or ethnicity group: Hispanic or Latino (33.7%)
- Est. typical home value, Nov 2023: $286,606
- Est. population in 2022: 3,645
16. University Village – Little Italy (Chicago, IL)

- Likelihood two random residents are different race or ethnicity: 73.6%
- Most prevalent race or ethnicity group: White (32.2%)
- Est. typical home value, Nov 2023: $330,115
- Est. population in 2022: 12,543
15. Lind-Bohanon (Minneapolis, MN)
- Likelihood two random residents are different race or ethnicity: 73.7%
- Most prevalent race or ethnicity group: White (37.3%)
- Est. typical home value, Nov 2023: $220,823
- Est. population in 2022: 5,393
14. Cedar River (Waterloo, IA)
- Likelihood two random residents are different race or ethnicity: 74.2%
- Most prevalent race or ethnicity group: White (37.9%)
- Est. typical home value, Nov 2023: $68,949
- Est. population in 2022: 809
13. Dayton’s Bluff (Saint Paul, MN)
- Likelihood two random residents are different race or ethnicity: 74.2%
- Most prevalent race or ethnicity group: White (34.4%)
- Est. typical home value, Nov 2023: $227,030
- Est. population in 2022: 16,098
12. White Ash (Columbus, OH)
- Likelihood two random residents are different race or ethnicity: 74.3%
- Most prevalent race or ethnicity group: White (31.9%)
- Est. typical home value, Nov 2023: $276,129
- Est. population in 2022: 6,799
11. Webber-Camden (Minneapolis, MN)
- Likelihood two random residents are different race or ethnicity: 74.4%
- Most prevalent race or ethnicity group: Black or African American (36.2%)
- Est. typical home value, Nov 2023: $214,990
- Est. population in 2022: 5,633
10. Hartkopf (Brooklyn Park, MN)
- Likelihood two random residents are different race or ethnicity: 74.4%
- Most prevalent race or ethnicity group: Black or African American (35.9%)
- Est. typical home value, Nov 2023: $283,988
- Est. population in 2022: 7,043
9. River Park (Brooklyn Park, MN)

- Likelihood two random residents are different race or ethnicity: 74.5%
- Most prevalent race or ethnicity group: White (31.1%)
- Est. typical home value, Nov 2023: $324,170
- Est. population in 2022: 4,587
8. Battle Creek (Saint Paul, MN)
- Likelihood two random residents are different race or ethnicity: 74.7%
- Most prevalent race or ethnicity group: Black or African American (30.3%)
- Est. typical home value, Nov 2023: $294,902
- Est. population in 2022: 23,339
7. Greater Eastside (Saint Paul, MN)

- Likelihood two random residents are different race or ethnicity: 75.0%
- Most prevalent race or ethnicity group: Asian (32.8%)
- Est. typical home value, Nov 2023: $251,387
- Est. population in 2022: 31,823
6. Mead (Wichita, KS)
- Likelihood two random residents are different race or ethnicity: 75.1%
- Most prevalent race or ethnicity group: White (39.2%)
- Est. typical home value, Nov 2023: $119,727
- Est. population in 2022: 2,707
5. Shingle Creek (Minneapolis, MN)
- Likelihood two random residents are different race or ethnicity: 75.5%
- Most prevalent race or ethnicity group: White (31.3%)
- Est. typical home value, Nov 2023: $246,701
- Est. population in 2022: 2,055
4. Goodrich-Kirkland Park (Cleveland, OH)
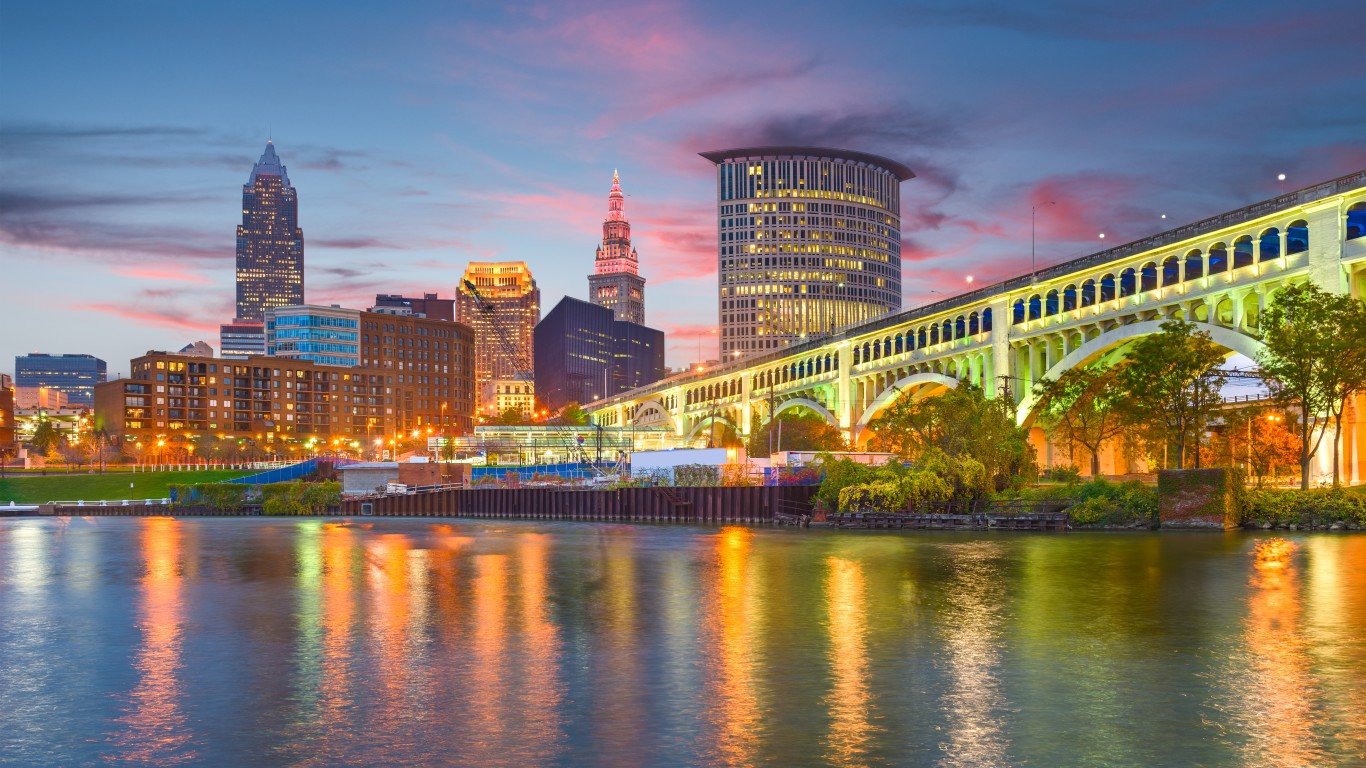
- Likelihood two random residents are different race or ethnicity: 75.7%
- Most prevalent race or ethnicity group: White (31.6%)
- Est. typical home value, Nov 2023: $63,576
- Est. population in 2022: 3,523
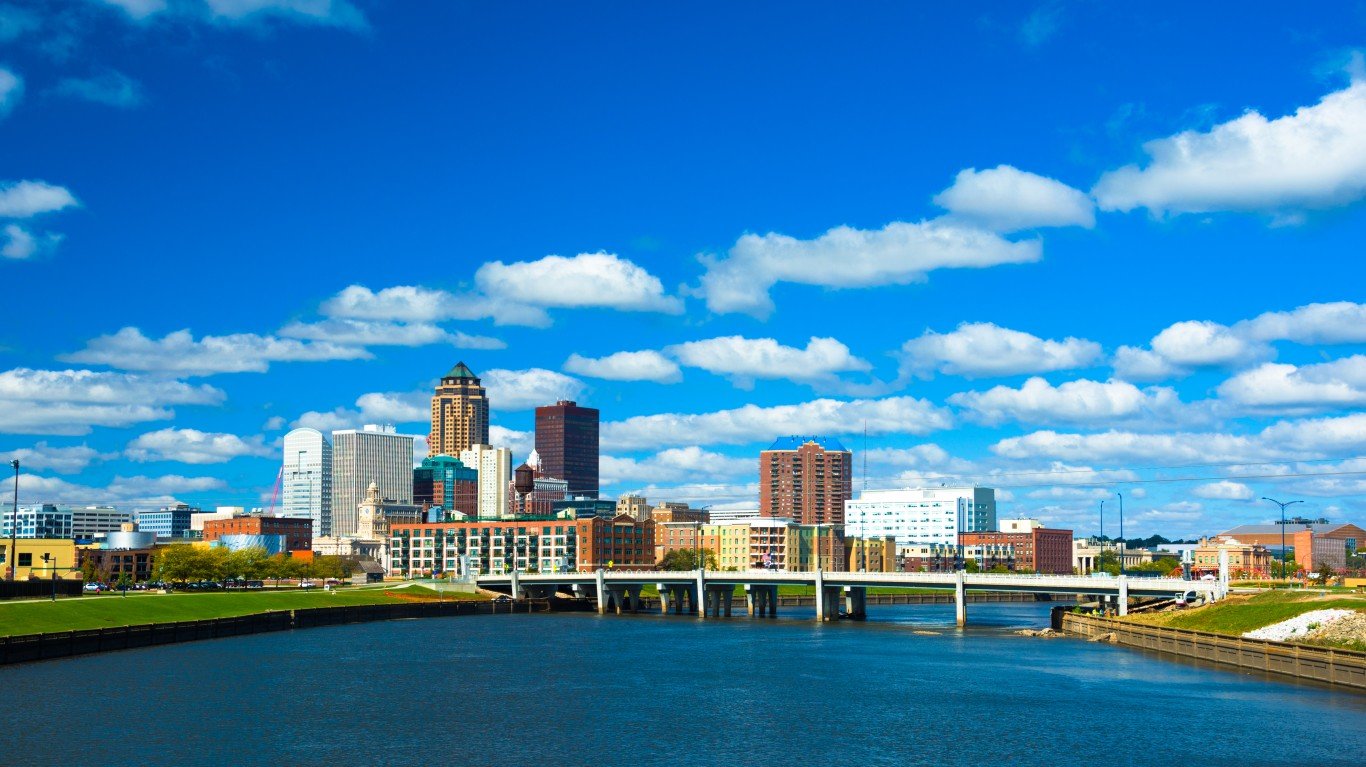
3. Pioneer Park (Des Moines, IA)
- Likelihood two random residents are different race or ethnicity: 75.8%
- Most prevalent race or ethnicity group: White (29.2%)
- Est. typical home value, Nov 2023: $194,406
- Est. population in 2022: 3,661
2. Mckinley (Minneapolis, MN)
- Likelihood two random residents are different race or ethnicity: 76.3%
- Most prevalent race or ethnicity group: Black or African American (34.9%)
- Est. typical home value, Nov 2023: $194,775
- Est. population in 2022: 4,480
1. Thomas Dale (Saint Paul, MN)
- Likelihood two random residents are different race or ethnicity: 77.0%
- Most prevalent race or ethnicity group: Asian (28.6%)
- Est. typical home value, Nov 2023: $214,349
- Est. population in 2022: 14,778
Contact [email protected] for any questions or corrections.