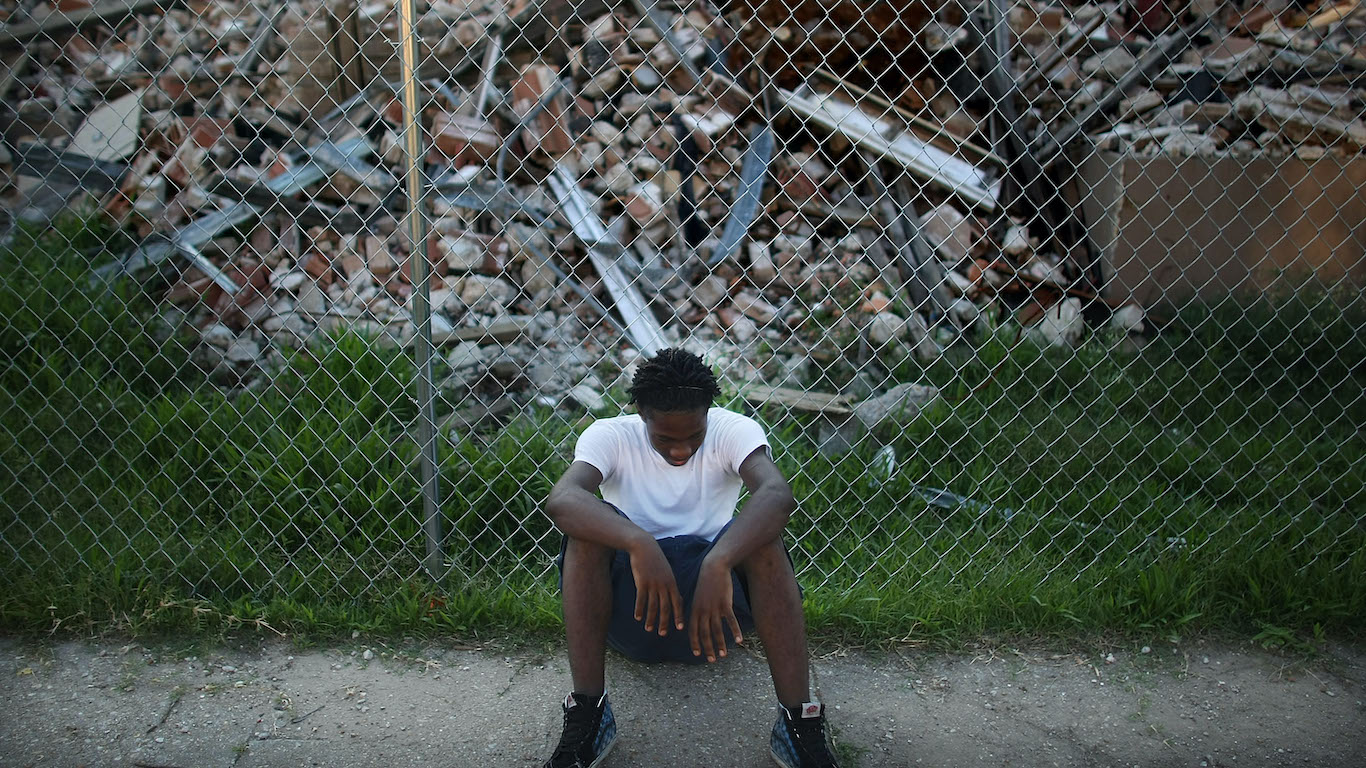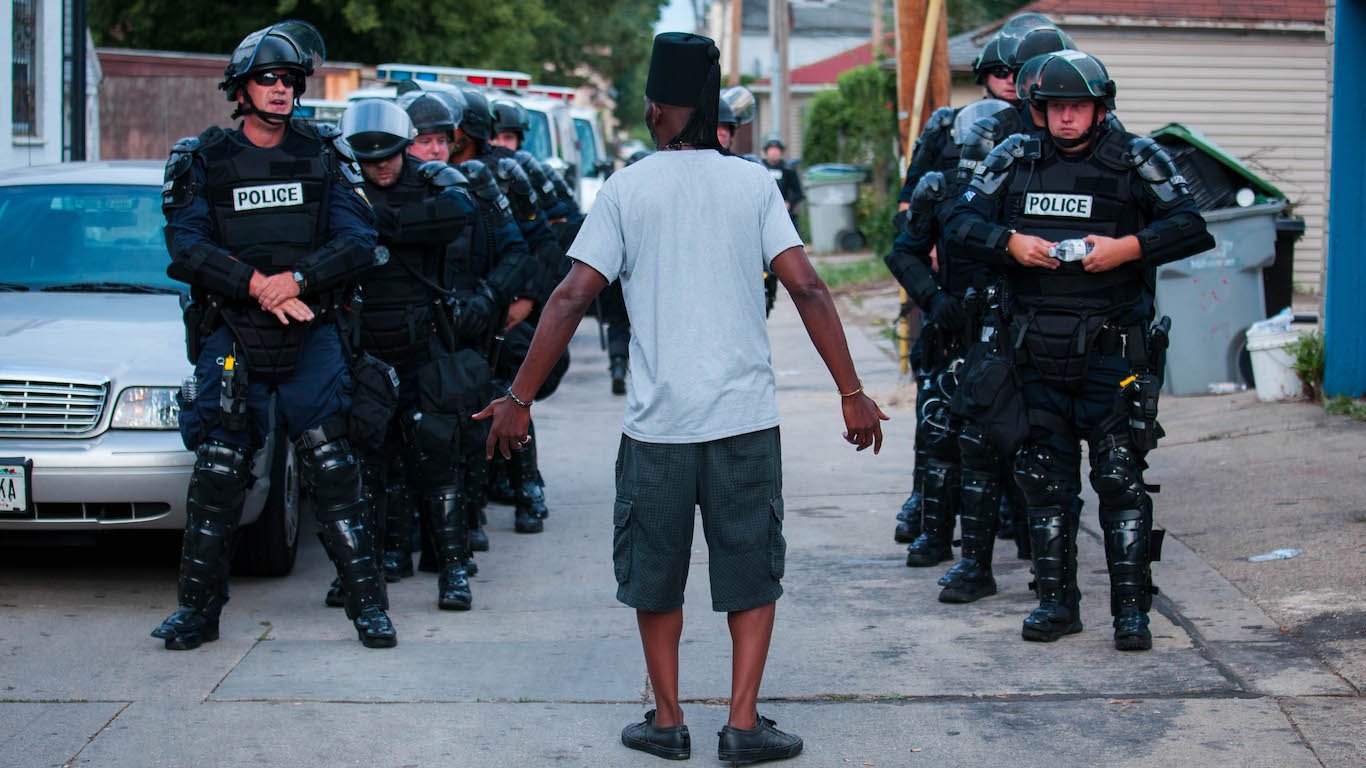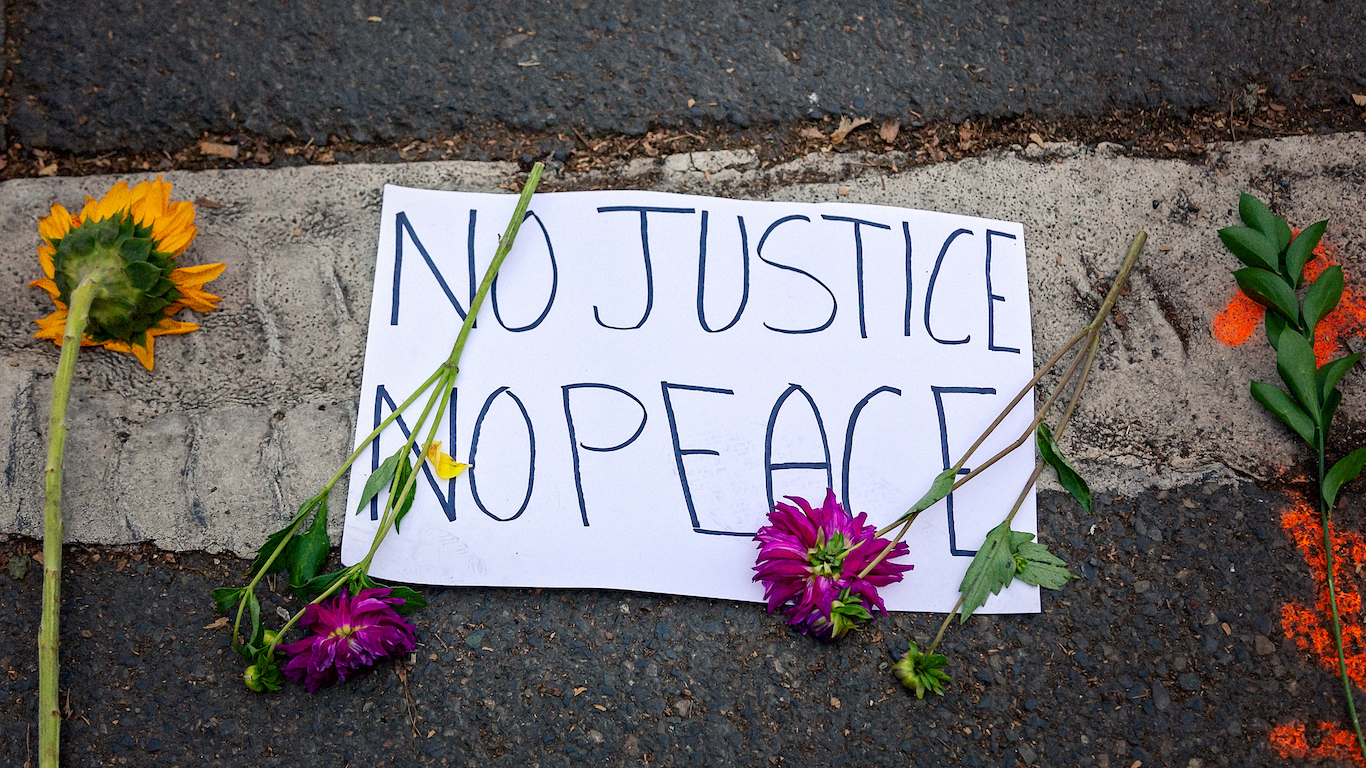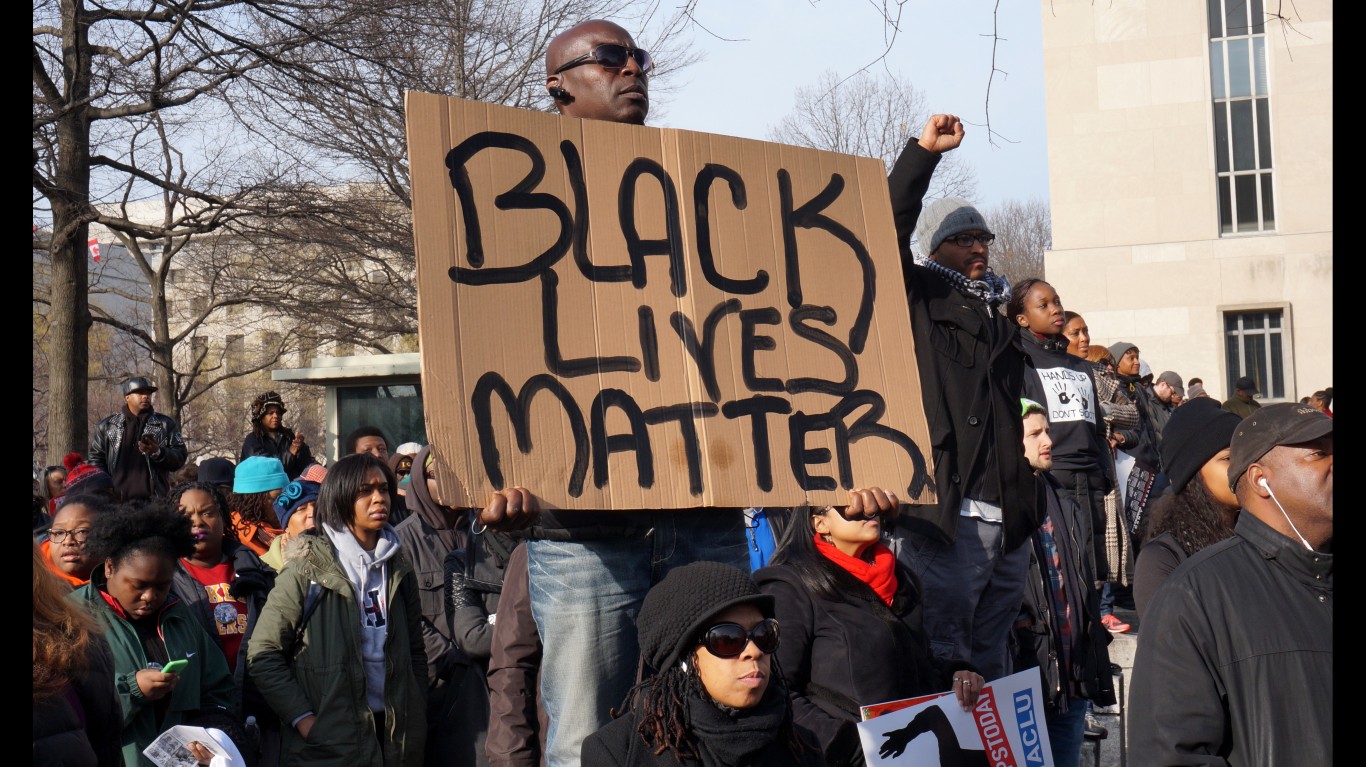
The May 2020 murder of George Floyd brought the U.S. into an era of racial reckoning. The tragedy, in which an unarmed Black man was killed in broad daylight by a white police officer, sparked global outrage and in the U.S., put racial inequity at the center of the national conversation.
From slavery to the Jim Crow era, the United States has a centuries-long history of government-sanctioned racism. While such laws have been long since repealed, their legacies loom large and have shaped much of the racial inequity evident in the United States to this day. Here is a look at the most important moments of the civil rights movement.
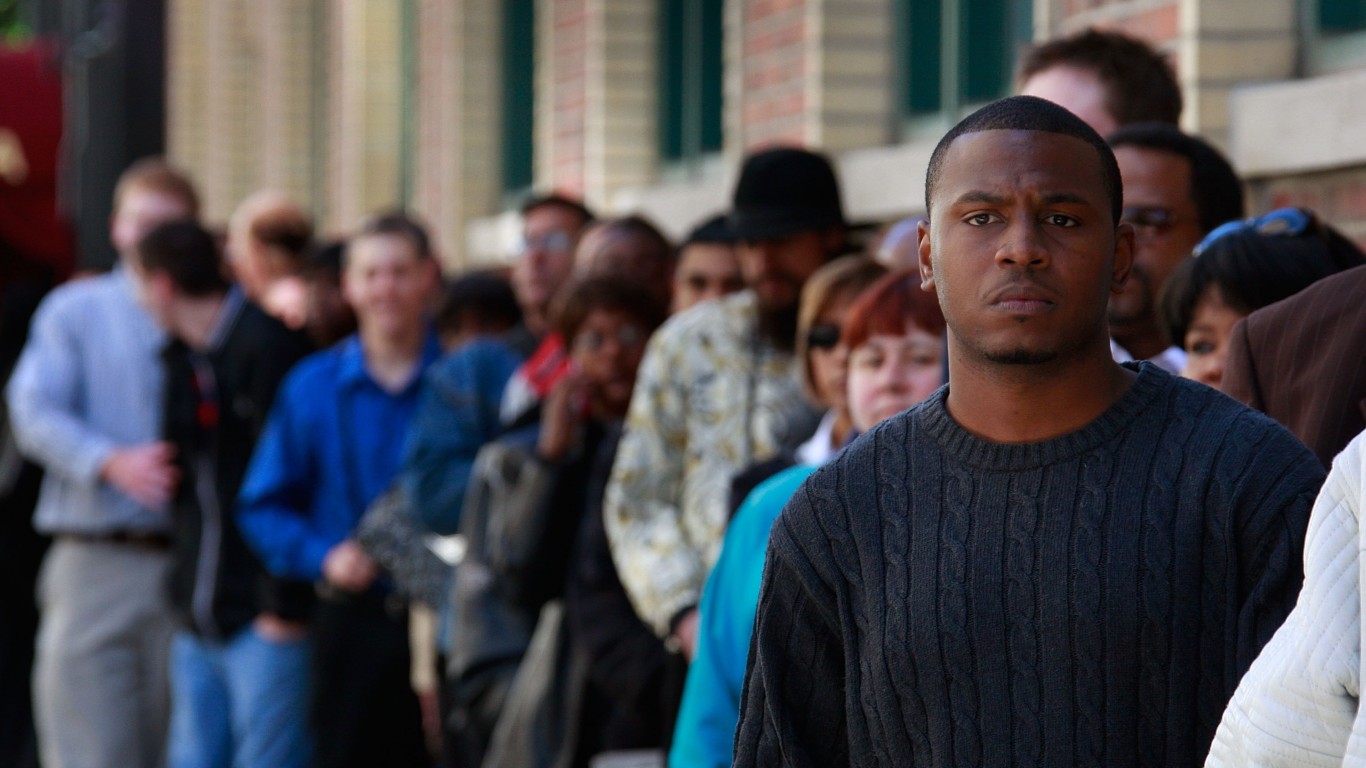
With far fewer opportunities than white Americans have generally had to build intergenerational wealth through education, homeownership, and employment, Black Americans today are more than twice as likely as their white counterparts to live below the poverty line. Additionally, the typical Black household earns just 63 cents for every dollar a typical white household earns, and African American workers are also more than twice as likely to be unemployed as white workers.
While disparities such as these span the country, they are far more pronounced in certain areas. Using data from the U.S. Census Bureau, 24/7 Wall St. created an index to measure socioeconomic disparities between Black and white Americans to identify the worst states for Black Americans. We built the index specifically to emphasize gaps between whites and Blacks rather than overall conditions.
States in the Deep South historically had the worst institutional racism in the United States – from slavery to disenfranchisement, segregation, and overt descrimination from the Reconstruction Era into the 20th century. Still, while many Southern states have large socioeconomic disparities along racial lines, the worst racial inequality in the U.S. can be found in the Midwest.
Millions of Black Americans migrated from the South to industrial Midwestern and Northeastern cities in the early to mid-20th century. While these places offered greater economic opportunities for Black Americans, they also came with their own sets of harmful racist policies. These included practices such as redlining, which excluded Black homeownership in certain neighborhoods and reinforced segregation. Today, seven of the 10 worst states for Black Americans are in the Midwest, and the remaining three are in the Northeast. Here is a look at the most segregated cities in America.
Click here to see the worst states for Black Americans
To determine the worst states for Black Americans, 24/7 Wall St. created an index consisting of eight measures to assess race-based gaps in socioeconomic outcomes. Six of the measures – median household income, poverty, adult high school and bachelor’s degree attainment, homeownership, and unemployment rates – are based on five-year estimates from the U.S. Census Bureau’s 2019 American Community. The seventh measure, prisoners under the jurisdiction of state or federal correctional authorities by race per 100,000 residents, is based on Bureau of Justice Statistics data that is current as of Jan. 31, 2020. The eighth measure, age-adjusted mortality rate by race, is based on data from 2018 to 2020 from the Centers for Disease Control and Prevention.
For each measure, we constructed an index from the gaps between Black and white Americans. The index was standardized using min-max normalization. We also included the population of Black, non-Hispanic-or-Latino Americans as a percentage of the total population in the index at full weight. Data on population by race came from the ACS.
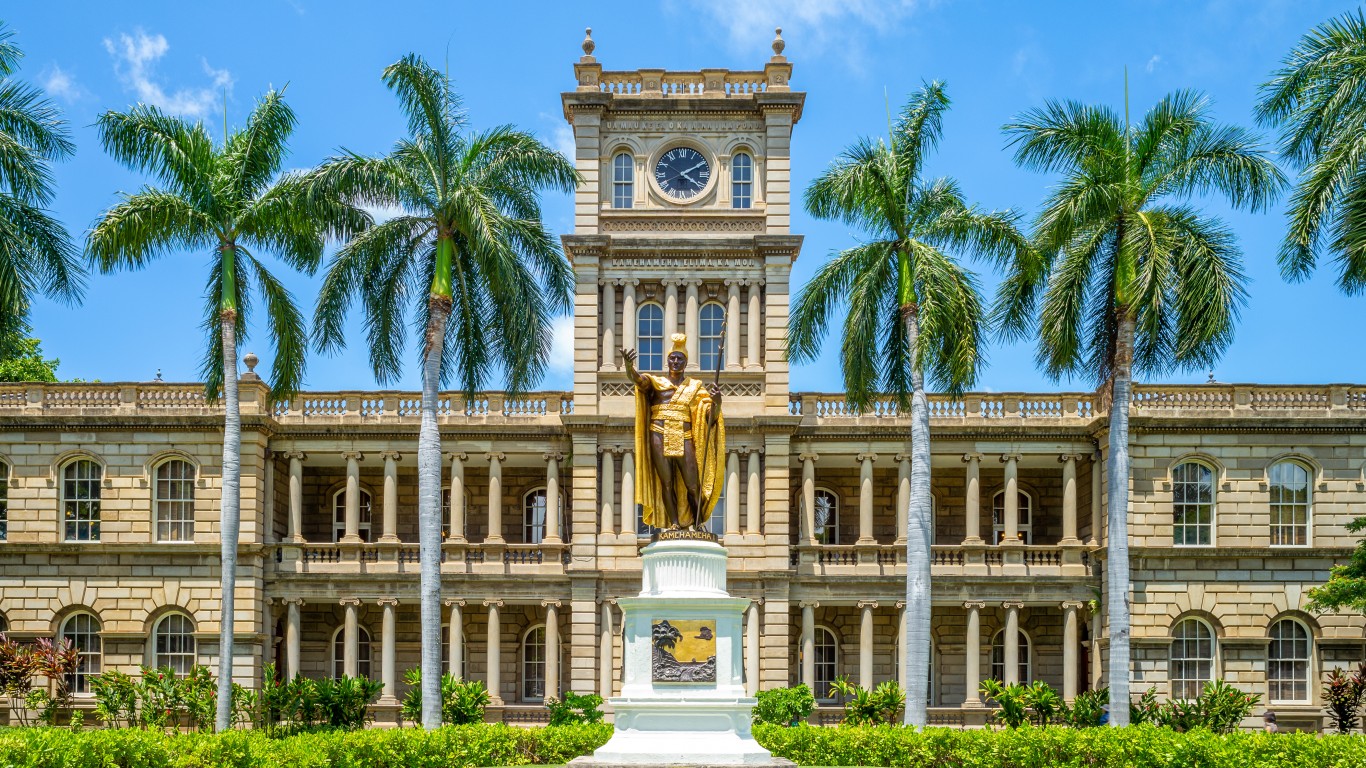
50. Hawaii
> Poverty rate: 9.4% Black, 9.5% white
> Homeownership rate: 23.3% Black, 54.7% white
> Unemployment rate: 9.3% Black, 4.6% white
> Median household income: $69,678 Black, $81,319 white
Hawaii has the smallest disparity in key socioeconomic indicators between Black and white residents of any state. Hawaii is also the only state in the country where the Black poverty rate is below the white poverty rate, at 9.4% compared to 9.5%.
Still, several measures reveal some degree of racial disparity in Hawaii. For example, even though the median income among Black households in the state is the highest in the country at $69,678, it is still about $11,600 less than the median income of $81,319 among white households in the state. At 9.3%, Black unemployment is also high in Hawaii – double the 4.6% white unemployment rate.
[in-text-ad]
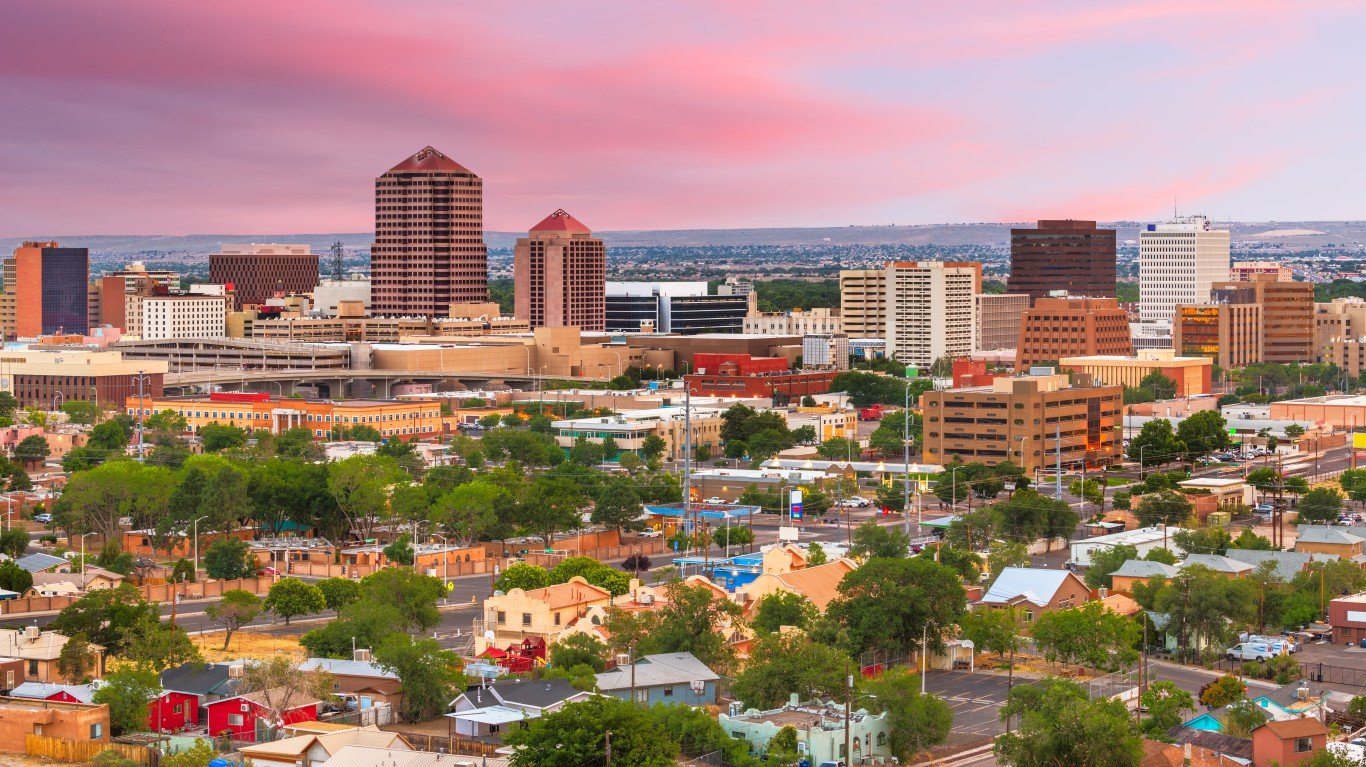
49. New Mexico
> Poverty rate: 24.2% Black, 16.7% white
> Homeownership rate: 40.2% Black, 69.7% white
> Unemployment rate: 7.3% Black, 5.9% white
> Median household income: $40,528 Black, $52,444 white
Though New Mexico joined the union in 1912, decades after the most oppressive and racist laws in the country’s history were taken off the books, it still introduced many of the same racist policies that led to segregated housing in other parts of the country in the 20th century. Housing covenants banning Black homeownership in certain parts of the state, including much of Albuquerque, have resulted in reduced Black homeownership in New Mexico. Today, the Black homeownership rate in the state of 40.2% is well below the 69.7% white homeownership rate.
Restrictive housing laws also limited Black families from building wealth through homeownership. Partially as a result, Black New Mexico residents are far more likely to struggle financially than white state residents. New Mexico’s Black poverty rate stands at 24.2%, compared to the 16.7% white poverty rate.
[recirclink id=944704]
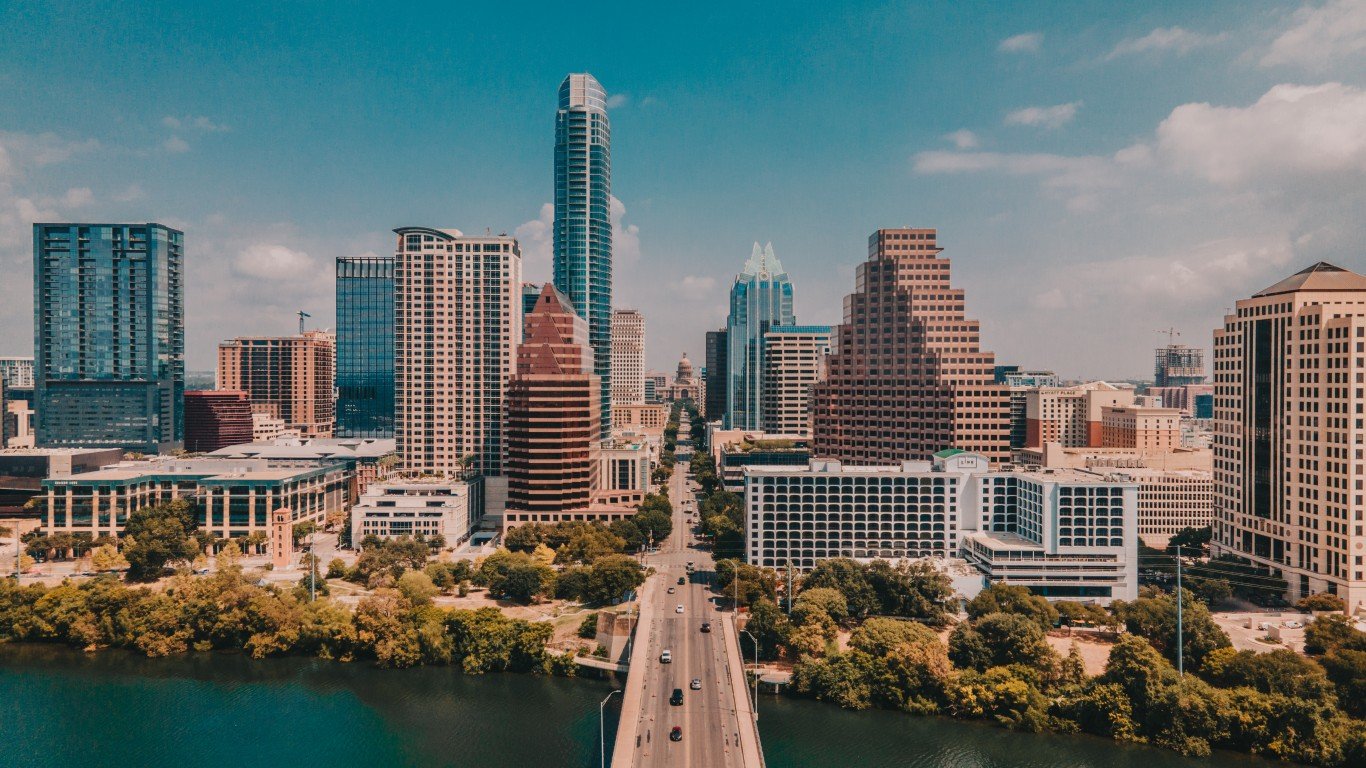
48. Texas
> Poverty rate: 19.3% Black, 13.8% white
> Homeownership rate: 40.7% Black, 66.4% white
> Unemployment rate: 7.8% Black, 4.6% white
> Median household income: $46,572 Black, $64,810 white
Segregation in Texas in the latter part of the 19th century and into the 20th century has shaped much of the racial inequality evident in the state today. Historically, Black schools in the state often had lower funding. Many labor unions rejected Black membership, and Black workers were typically relegated to unskilled labor jobs. And when they did hold the same job as white workers, they were often paid less.
Today, the 40.7% Black homeownership rate in the state is well below the 66.4% white homeownership rate. Earnings among Black Texas residents also remains well below white earnings. Most Black households in the state earn less than $47,000 a year, while most white households earn over $64,810.
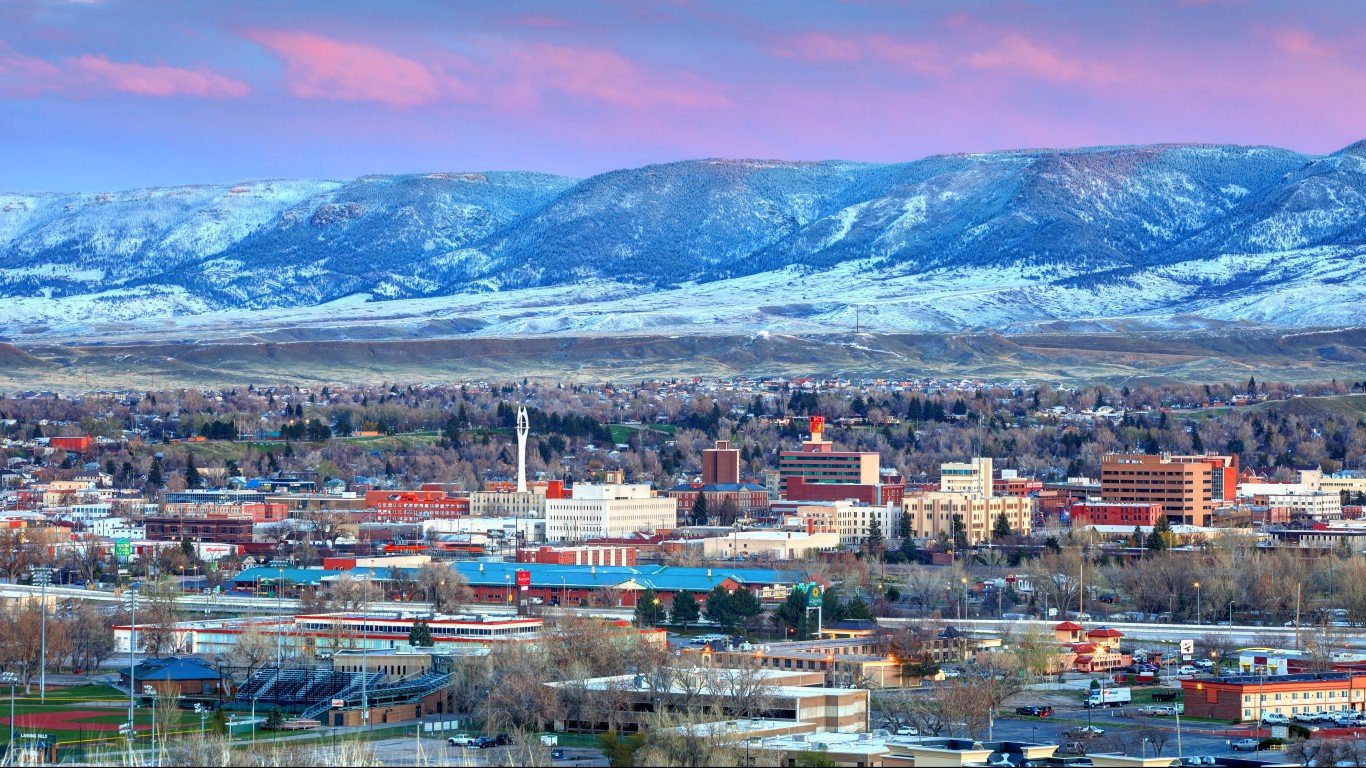
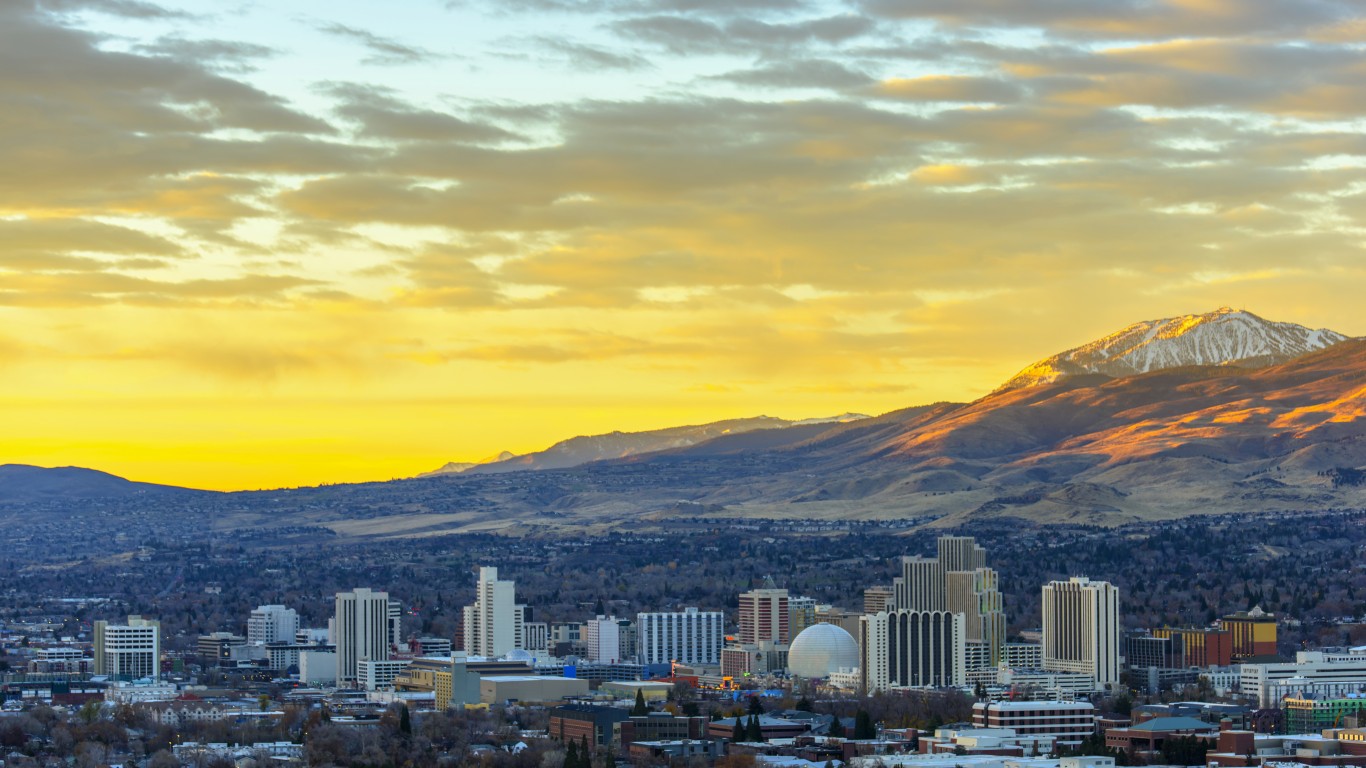
47. Wyoming
> Poverty rate: 15.3% Black, 10.5% white
> Homeownership rate: 28.8% Black, 71.6% white
> Unemployment rate: 8.9% Black, 4.2% white
> Median household income: $47,386 Black, $64,820 white
Wyoming has one of the smallest Black populations of any state. Only about 5,200 state residents identify as Black, or 0.9% of the total population. Wyoming did not enforce segregated school laws, and, unlike the other Rocky Mountain states, allowed Black men to vote without prompting from Washington D.C. Anecdotally, even though there were racist laws, including a prohibition on interracial marriages, Wyoming has generally been a more tolerant state historically than much of the rest of the country.
Still, as is the case everywhere in the United States, job opportunities and financial security are far more elusive for Black Wyoming residents than white state residents. Black unemployment in the state stands at 8.9%, more than double the 4.2% white jobless rate. Additionally, even though Wyoming’s 15.3% Black poverty rate is among the lowest in the country, it is considerably higher than the state’s 10.5% white poverty rate.
[in-text-ad-2]
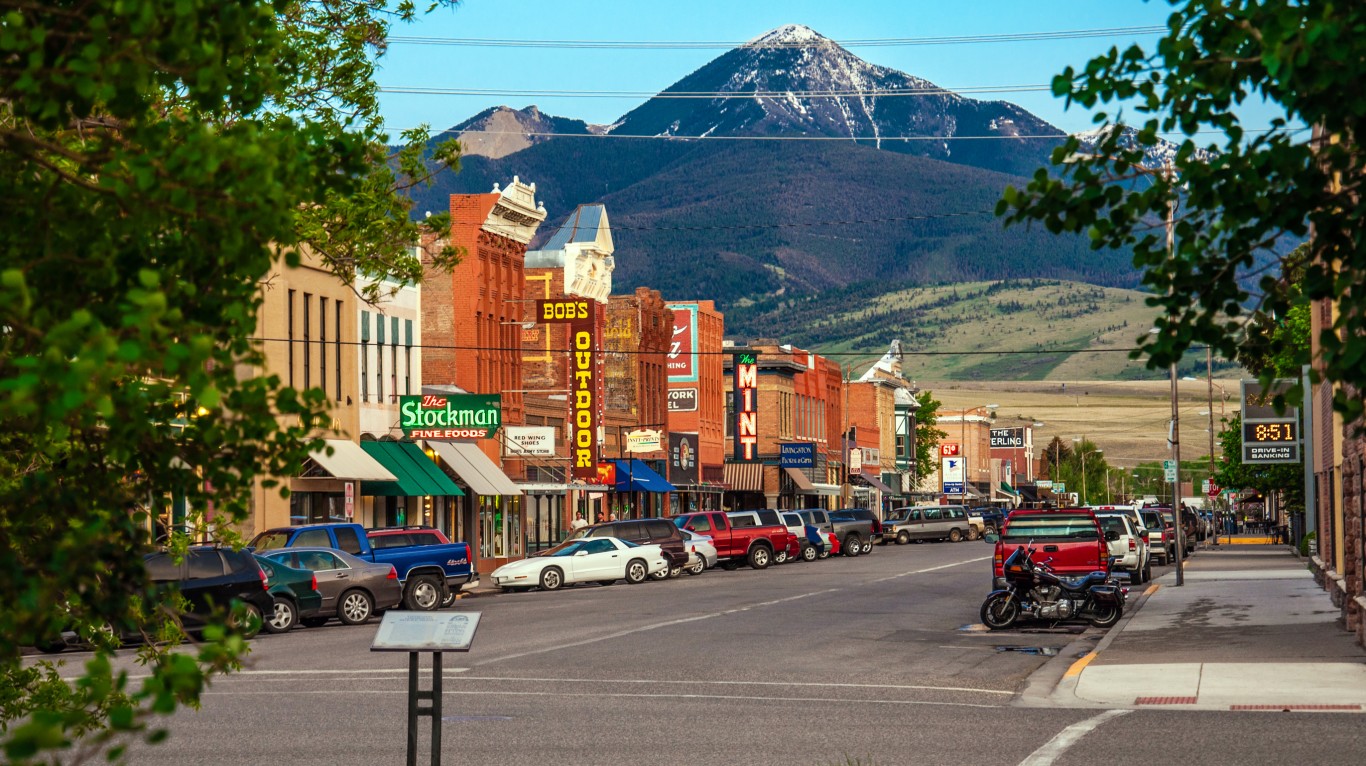
46. Montana
> Poverty rate: 16.3% Black, 11.6% white
> Homeownership rate: 27.8% Black, 69.8% white
> Unemployment rate: 6.6% Black, 3.5% white
> Median household income: $44,614 Black, $56,282 white
Montana has the smallest Black population in the United States. Only about 4,700 state residents, or 0.4% of the total population, are Black. In the late 19th and early 20th century, Montana had several racist laws on the books, including segregated schools and a prohibition of interracial marriage. Such discrimination pushed Black residents into their own enclaves and led to further social and economic segregation.
The legacy of these conditions are disparities in several key social and economic measures in the state. For example, Montana’s 27.8% Black homeownership rate is well below half the 69.8% white homeownership rate. Additionally, the typical Black household in the state earns $44,614 a year, about $11,700 less than the typical white household – even though Black Montana residents are more likely than their white counterparts to have a four-year college education.
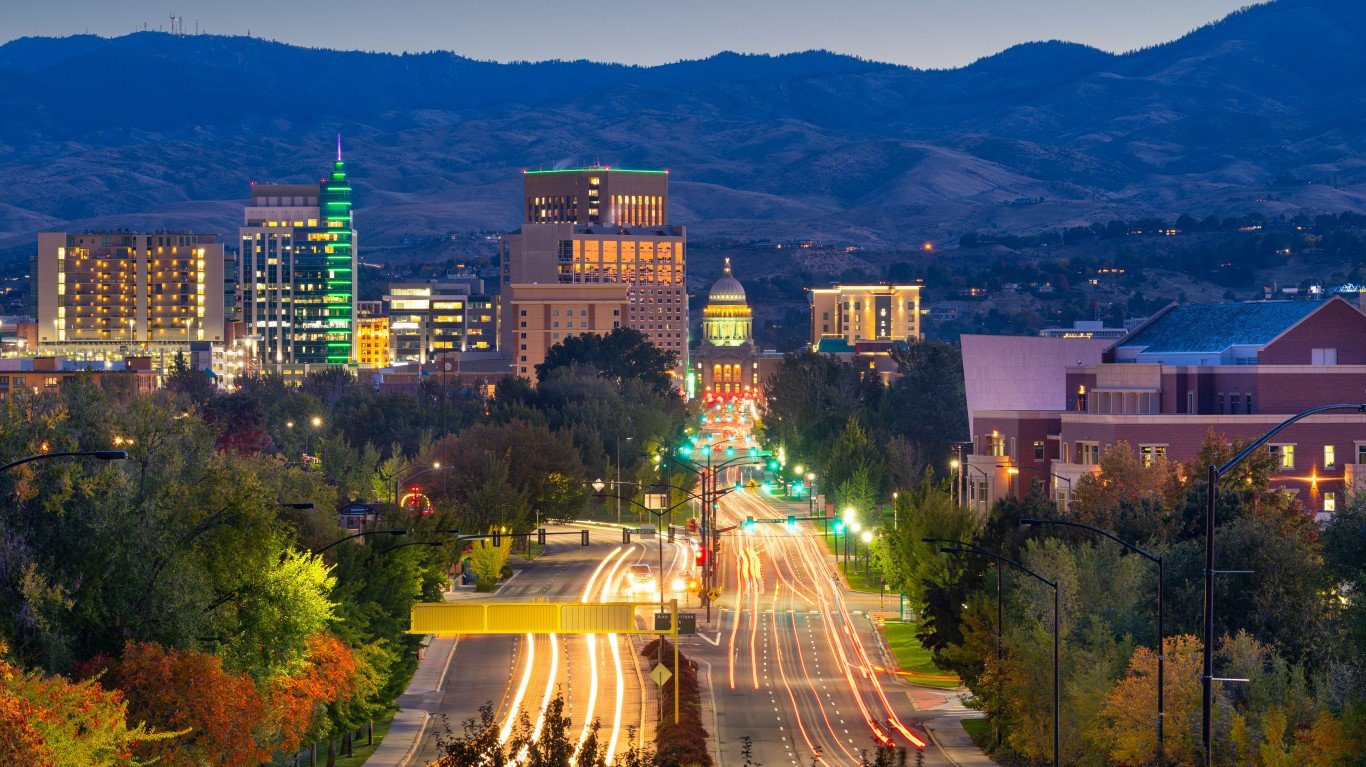
45. Idaho
> Poverty rate: 30.3% Black, 12.3% white
> Homeownership rate: 37.6% Black, 71.3% white
> Unemployment rate: 8.5% Black, 4.2% white
> Median household income: $43,034 Black, $56,683 white
Exclusionary housing covenants known as redlining have meaningfully impacted Black Americans’ ability to build wealth through homeownership in much of the United States, and Idaho is no exception. Cities like Boise and Pocatello employed redlining practices in the mid-20th Century – and today, the Black homeownership rate in Idaho is just 37.6%, just over half the 71.3% white homeownership rate.
Black Idaho residents are also far less likely to be financially secure than their white counterparts. Just over 30% of Black Idaho residents live below the poverty line, compared to the 12.3% white poverty rate – one of the largest such disparities in the country.
[in-text-ad]
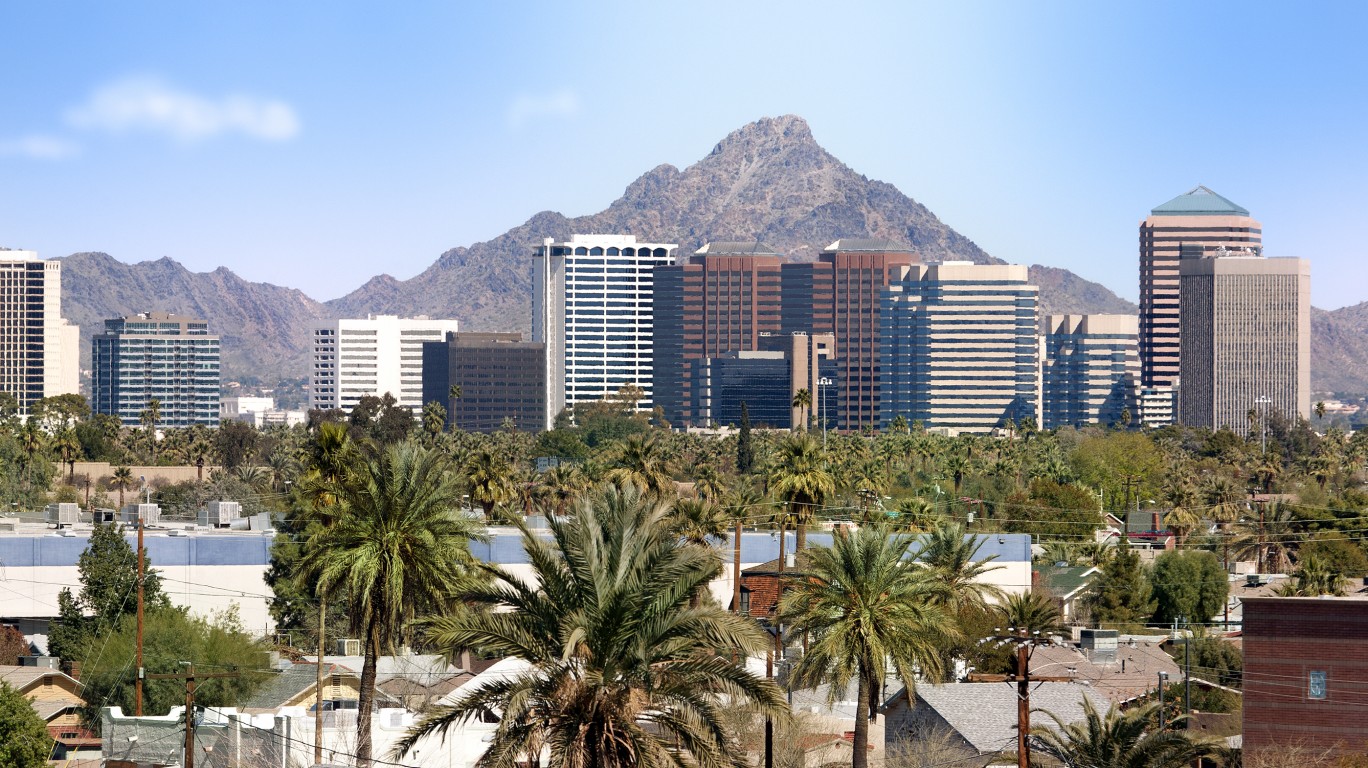
44. Arizona
> Poverty rate: 20.3% Black, 13.2% white
> Homeownership rate: 34.6% Black, 67.7% white
> Unemployment rate: 8.5% Black, 5.3% white
> Median household income: $47,386 Black, $61,172 white
Arizona was a highly segregated state in the early 20th century. Segregation in public schools across the state was characterized by unequal conditions for Black students who typically had far fewer resources than their white counterparts. The segregated education system and broader social segregation have left a legacy of disparity in the state.
The Black homeownership rate in Arizona stands at 34.6%, just over half the white homeownership rate in the state of 67.7%. Homeownership is one of the most practical ways to build intergenerational wealth in the United States, and historically, Black Arizona residents faced far greater restrictions on homeownership than white residents. Currently, more than one in every five Black Arizona residents live below the poverty line, compared to about 13% of white state residents.
[recirclink id=996411]
43. West Virginia
> Poverty rate: 29.2% Black, 16.9% white
> Homeownership rate: 42.4% Black, 74.7% white
> Unemployment rate: 10.5% Black, 6.4% white
> Median household income: $33,133 Black, $47,143 white
During the Reconstruction Era, West Virginia offered Black Americans a number of opportunities that were denied to them in other states. Still, the thousands of African Americans who moved to the state after the Civil War faced institutional segregation as well as discrimination.
Today, many in West Virginia are struggling economically – but economic hardship appears to be disproportionately shouldered by the state’s Black population. Nearly 30% of Black West Virginians live below the poverty line, compared to about 17% of the state’s white population. Additionally, Black unemployment in the state stands at 10.5%, compared to the 6.4% white jobless rate.

42. Alaska
> Poverty rate: 14.2% Black, 7.2% white
> Homeownership rate: 37.6% Black, 68.4% white
> Unemployment rate: 4.7% Black, 5.2% white
> Median household income: $62,191 Black, $85,298 white
Alaska was granted statehood in 1959, after much of the most oppressive racist laws were off the books in the United States. Indeed, racial disparities are less pronounced in Alaska than they are in much of the rest of the country. For example, Alaska is the only state in the country where the Black unemployment rate is lower than the white jobless rate, at 4.7% compared to 5.2%.
Still, certain socioeconomic measures reflect some level of racial inequality in Alaska. For example, while the typical Black household in the state earns $62,191 a year, more than in nearly every other state, the median income among white Alaska households is about $23,100 higher, at $85,298. Additionally, at 14.2%, the Black poverty rate is nearly twice as high as the 7.2% white poverty rate in Alaska.
[in-text-ad-2]
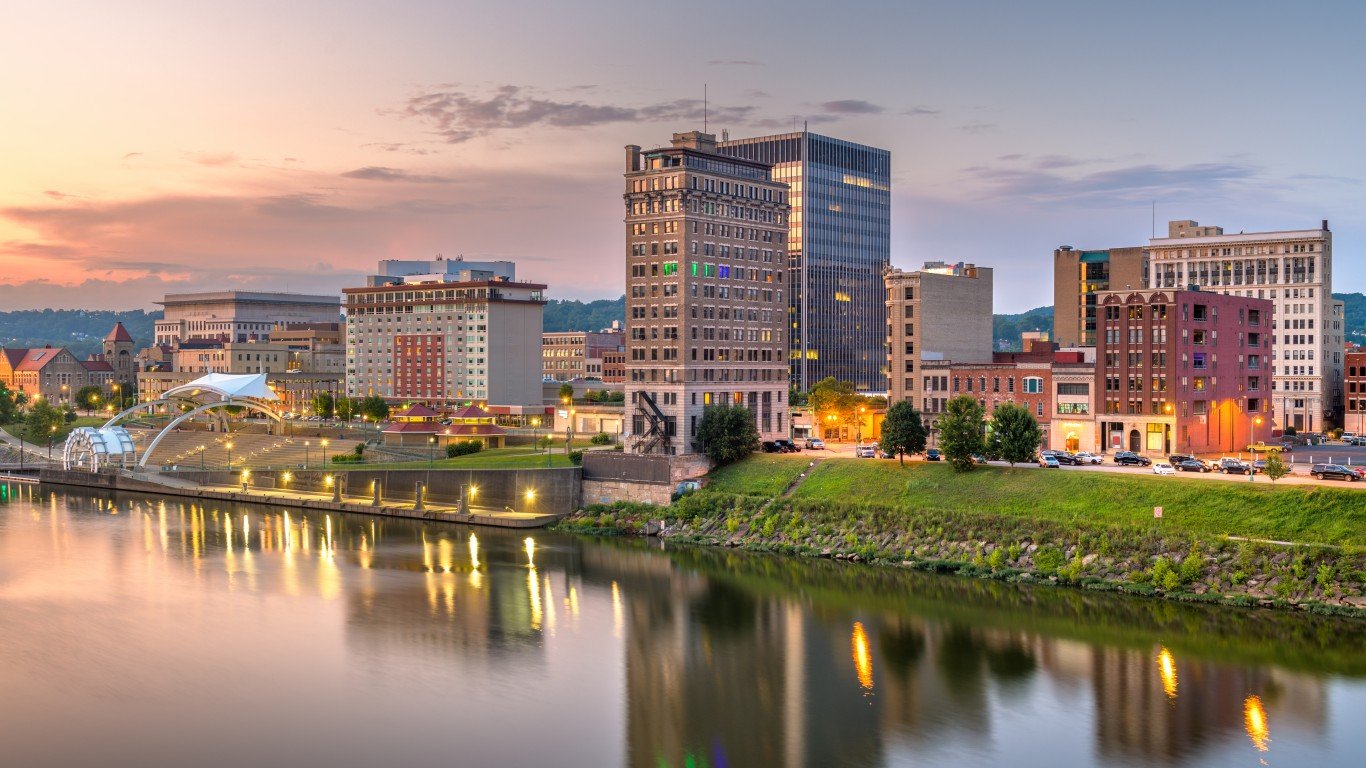
41. Kentucky
> Poverty rate: 27.8% Black, 16.0% white
> Homeownership rate: 36.6% Black, 70.8% white
> Unemployment rate: 9.5% Black, 5.1% white
> Median household income: $36,424 Black, $52,278 white
As was common across the South during Reconstruction, segregated life in Kentucky was marked by hardship for Black state residents. Limited employment opportunities, poverty, and police oppression were common in Black communities – and the legacy of these realities are still evident in Black communities across the state.
The typical Black household in the state earns $36,424 a year, about $15,900 less than the median income of $52,278 among white households. At 27.8%, the Black poverty rate in Kentucky is far higher than the 16.0% white poverty rate. Measures of public health reveal other racial disparities in Kentucky. For example, the infant mortality rate among the state’s Black population stands at 10.7 for every 1,000 live births, compared to 6.4 per 1,000 among white Kentucky residents.
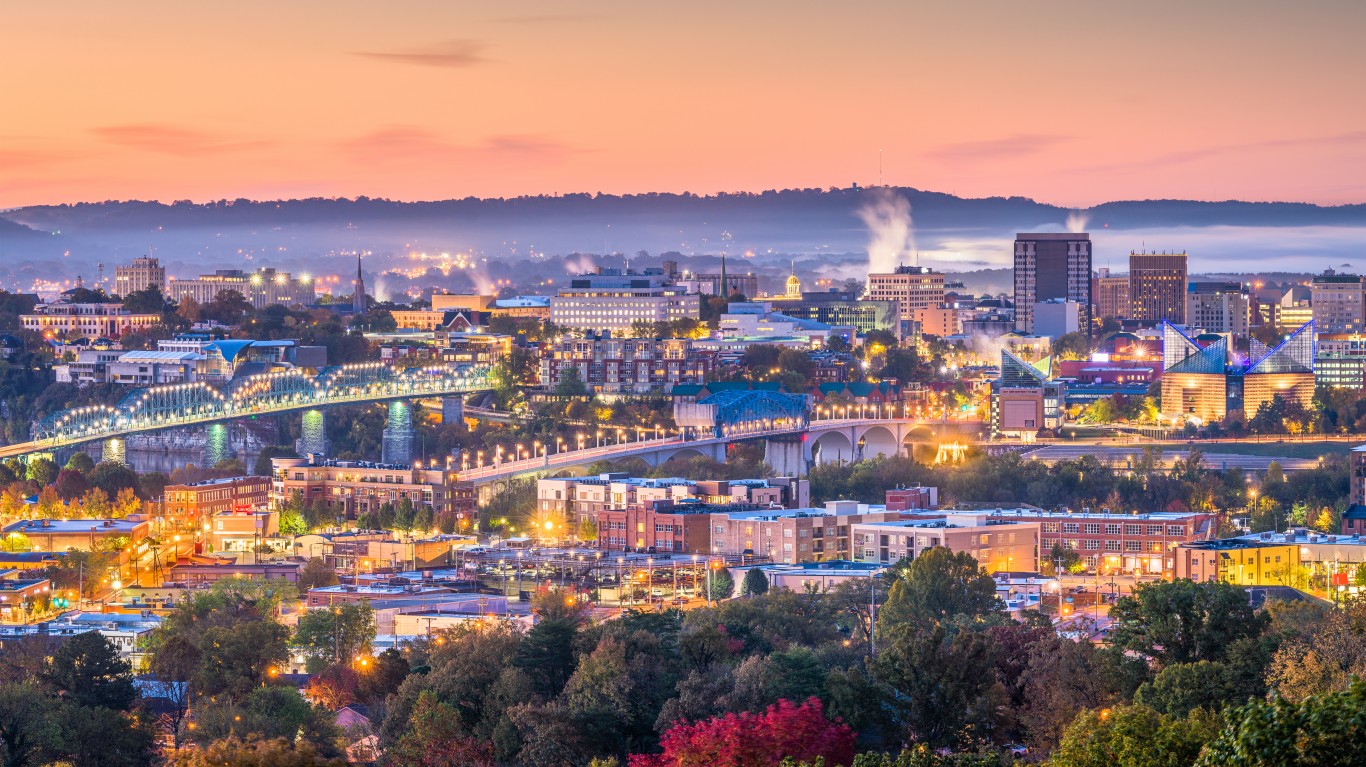
40. Tennessee
> Poverty rate: 24.7% Black, 12.9% white
> Homeownership rate: 43.0% Black, 71.8% white
> Unemployment rate: 8.9% Black, 4.5% white
> Median household income: $38,791 Black, $56,725 white
Even though racial oppression was not as pronounced in Tennessee as it was in parts of the Deep South, over a period of about 100 years ending in the 1950s, Tennessee enacted 20 Jim Crow laws. These included school segregation, a prohibition of interracial marriage, and seperate public accomodations, among others. Tennessee was also the birthplace of the Ku Klux Klan.
The legacy of Tennessee’s racial oppression still looms large. Today, the typical Black household in the state earns $38,791, about $18,000 less than the median income among white households. Black workers are also nearly twice as likely to be unemployed and Black residents more than twice as likely to live below the poverty line as their white counterparts.
[in-text-ad]
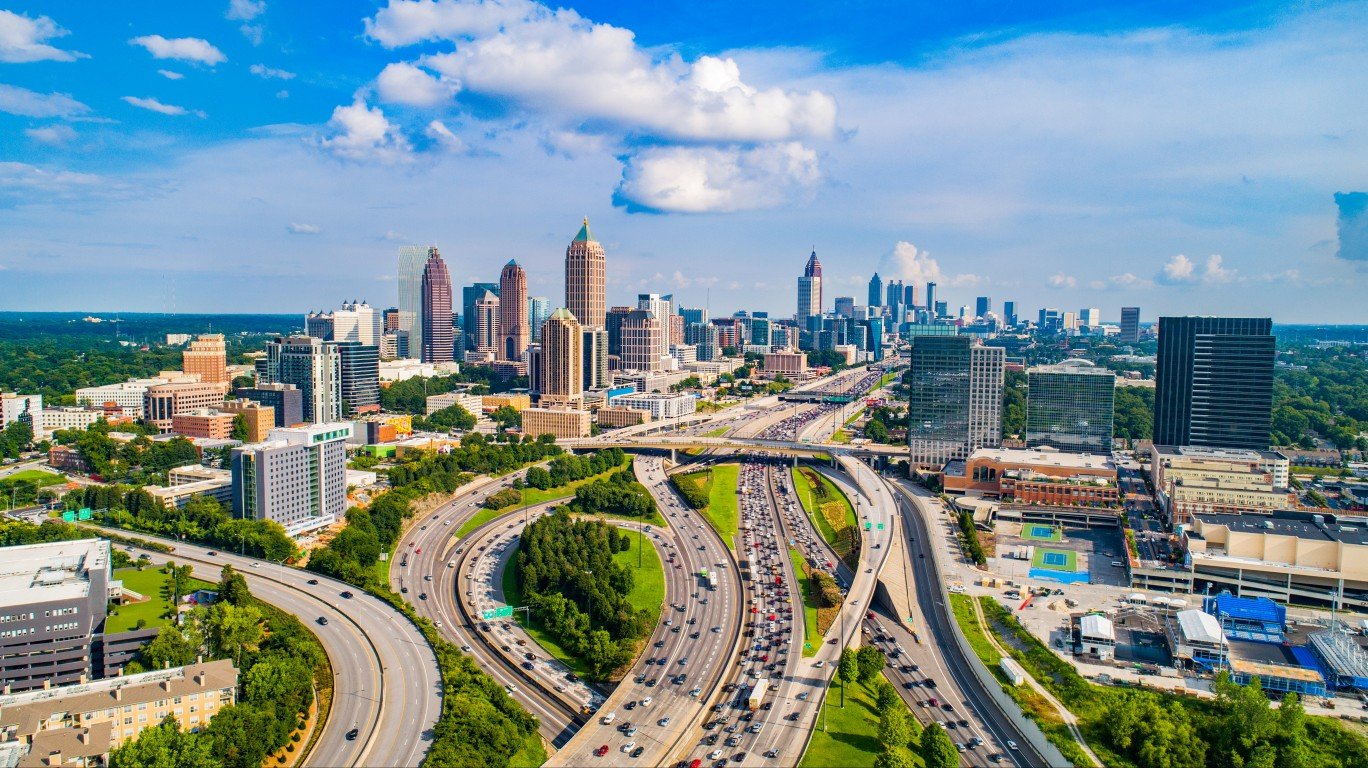
39. Georgia
> Poverty rate: 21.5% Black, 11.3% white
> Homeownership rate: 46.7% Black, 72.5% white
> Unemployment rate: 8.6% Black, 4.2% white
> Median household income: $44,670 Black, $66,473 white
A former slave state, and one in which Black residents were disenfranchised and subject to Jim Crow laws, Georgia also played a central role in the Civil Rights Movement. Still, the legacy of centuries of racist laws has given way to racial inequality to this day.
Black unemployment in the state stands at 8.6%, more than double the 4.2% white jobless rate. Additionally, the typical Black household in the state earns just $44,670 a year, well below the median income of $66,473 among white households in the state. Inequalities are not just economic, but also social – particularly with regard to education outcomes. Only 24% of Black adults in the state have a bachelor’s degree or higher, 10 percentage points below the white bachelor’s degree attainment rate.
[recirclink id=1029781]
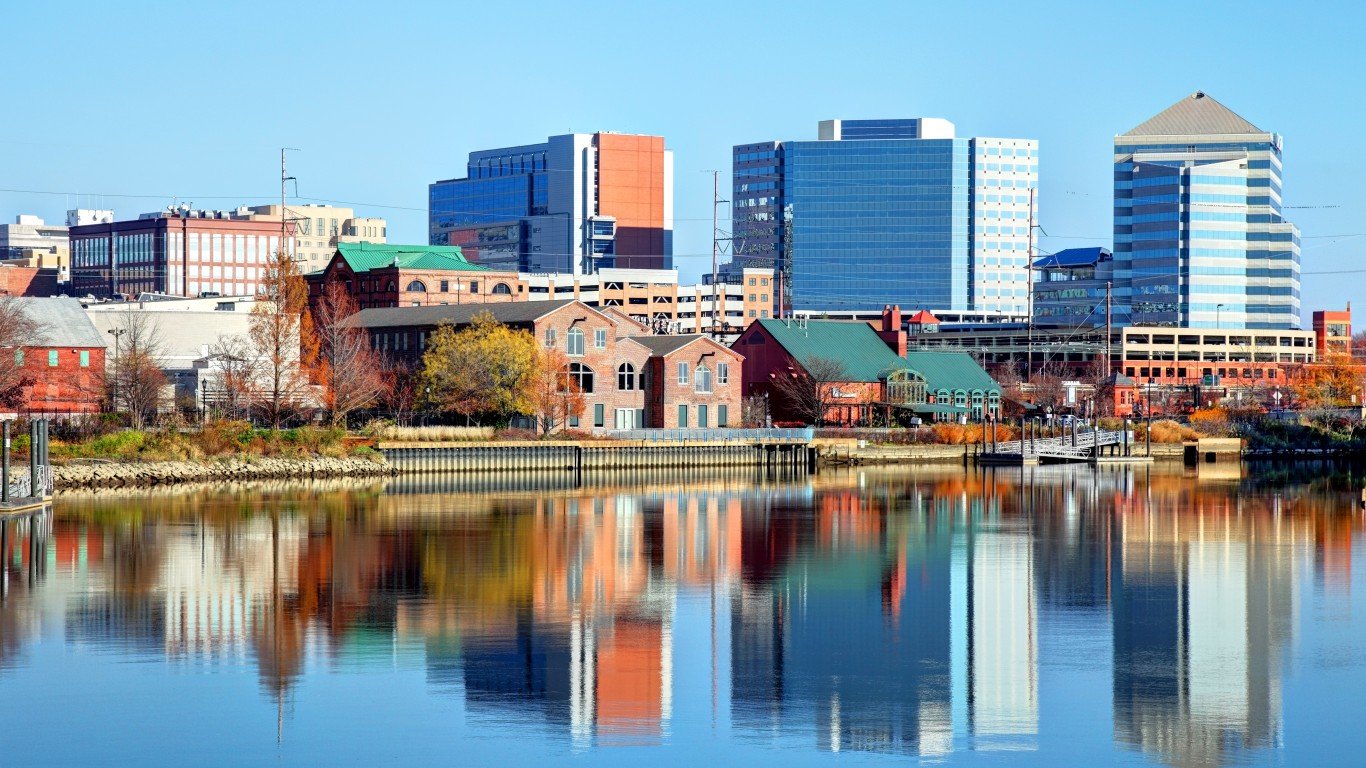
38. Delaware
> Poverty rate: 18.6% Black, 9.0% white
> Homeownership rate: 51.0% Black, 78.2% white
> Unemployment rate: 8.1% Black, 4.7% white
> Median household income: $50,361 Black, $72,508 white
Homeownership is one of the best ways to build wealth in the United States. Though the Black homeownership rate in Delaware of 51.0% is higher than the 41.8% national Black homeownership rate, it is well below the 78.2% white homeownership rate in the state. The lower homeownership rates among Black residents in the state are partly the result of racist housing policies of the previous century.
Also due in part to historic discrimination, which limited most Black Delaware residents to labor and service jobs, economic disparities remain evident along racial lines in the state. For example, the Black poverty rate in Delaware of 18.6% is more than double the state’s 9.0% white poverty rate.
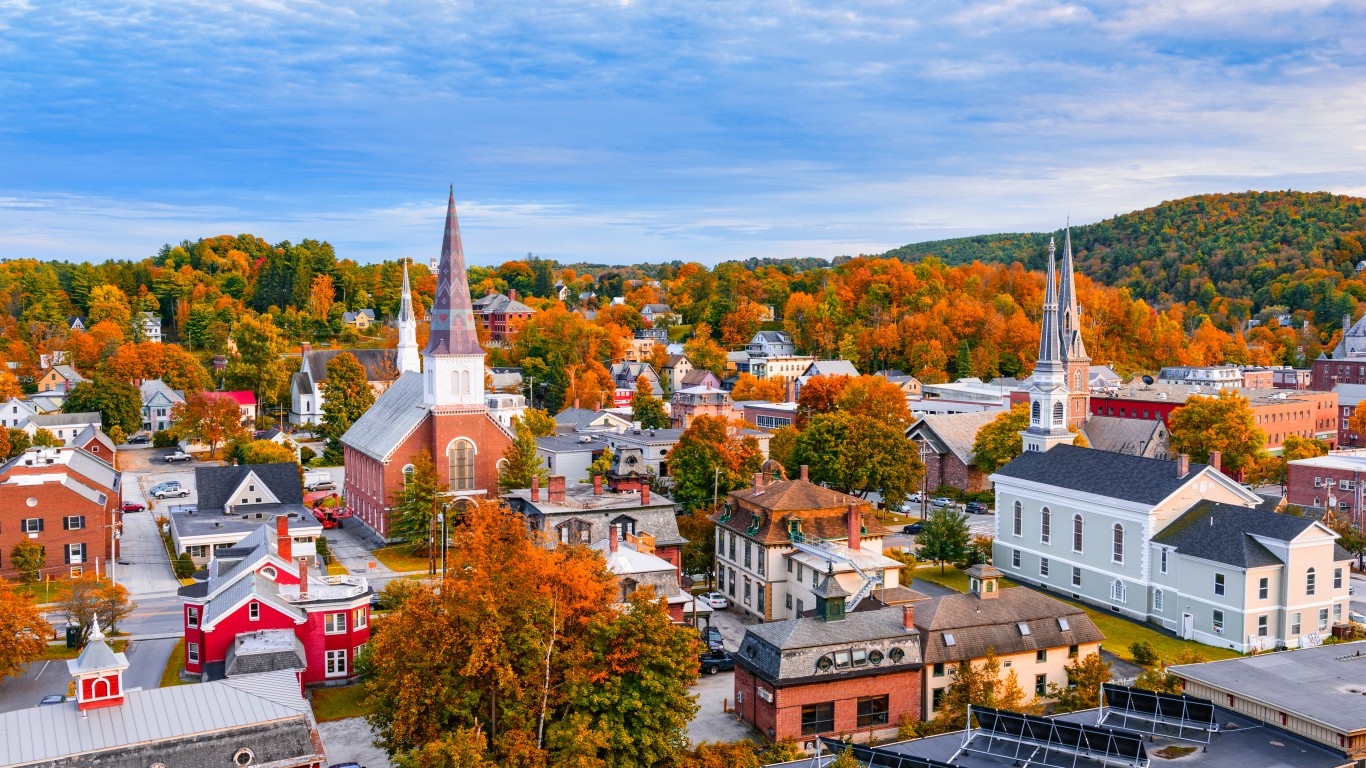
37. Vermont
> Poverty rate: 25.9% Black, 10.5% white
> Homeownership rate: 24.4% Black, 71.7% white
> Unemployment rate: 4.4% Black, 3.5% white
> Median household income: $39,400 Black, $62,539 white
Vermont has the smallest socioeconomic racial gaps of any Northeastern state. Still, variations in certain key measures along racial lines are stark. For example, more than one in every four Black Vermonters live below the poverty line, compared to about one in every 10 white state residents. Additionally, the Black homeownership rate in the state of 24.4% is a fraction of the 71.7% white homeownership rate.
Disparities are also evident in the state’s justice system. Black Vermont residents are over eight times more likely than white residents to be in a state or federal correctional institution. To put it another way, about 10% of the incarcerated population in the state are Black, even though Black residents comprise only 1.3% of the state’s population.
[in-text-ad-2]
36. Nevada
> Poverty rate: 23.0% Black, 11.0% white
> Homeownership rate: 29.3% Black, 61.6% white
> Unemployment rate: 10.3% Black, 5.6% white
> Median household income: $41,034 Black, $64,008 white
The vast majority of Nevada’s population reside in the Las Vegas area – a place where, until the 1960s, Black residents were restricted from living or working outside of the city’s Westside. Racial segregation is inherently unequal, and racial desparities are still evident in Nevada today.
Homeownership is one of the most practical ways to build intergenerational wealth in the United States, and the Black homeownership rate in Nevada stands at 29.3%, compared to the white homeownership rate in the state of 61.6%. Black Nevada residents are also twice as likely as white residents to live below the poverty line and Black workers are nearly twice as likely to be unemployed.
35. New Hampshire
> Poverty rate: 19.8% Black, 7.2% white
> Homeownership rate: 32.4% Black, 72.3% white
> Unemployment rate: 8.1% Black, 3.5% white
> Median household income: $57,925 Black, $77,015 white
New Hampshire has the second lowest level of socioeconomic racial inequality in the Northeast, after Vermont. Still, differences in social and economic outcomes along racial lines are stark in the state. For example, nearly 20% of Black New Hampshire residents live below the poverty line, compared to just 7.2% of white state residents. Black state residents are also far more likely than their white counterparts to be incarcerated in a state or federal correctional facility. Only 1.4% of New Hampshire’s population are Black, while nearly 7% of prisoners in the state are Black.
Education outcomes reveal further racial disparities in the state. Only 26.8% of Black adults in New Hampshire have a bachelor’s degree or higher, nearly 10 percentage points below the comparable share of white adults in the state.
[in-text-ad]
34. Maryland
> Poverty rate: 13.3% Black, 6.7% white
> Homeownership rate: 51.5% Black, 75.8% white
> Unemployment rate: 7.5% Black, 3.9% white
> Median household income: $67,583 Black, $94,278 white
Race based segregation can fuel inequality, and by some measures, Maryland is the most segregated state in the country. According to census data, 59.3% of Black Maryland residents live in majority Black neighborhoods, the largest share of any state in the country. These highly segregated communities often lack economic opportunity than more integrated communities.
Across Maryland, 7.5% of the Black labor force are unemployed, compared to the 3.9% white unemployment rate. Additionally, Maryland’s Black poverty rate of 13.3% is well above the 6.7% white poverty rate. Black Maryland residents are also more than five times as likely as their white counterparts to be incarcerated in a state or federal correctional facility.
[recirclink id=1029484]

33. Florida
> Poverty rate: 22.0% Black, 12.1% white
> Homeownership rate: 45.3% Black, 69.6% white
> Unemployment rate: 9.1% Black, 4.8% white
> Median household income: $41,702 Black, $58,809 white
Though racial disparities are less profound in Florida on aggregate than they are in most states – particularly other Southern states – there are still wide gaps in key socioeconomic measures by race.
The Black unemployment rate in Florida of 9.1% is nearly double the 4.8% white jobless rate. Additionally, the typical Black household in Florida earns just $41,702 a year, while most white households earn over $58,800 annually. Incarceration rates further underscore racial gaps in Florida. Florida’s Black imprisonment rate of 1,207 inmates per 100,000 people is more than four times higher than the white incarceration rate of 281 per 100,000.
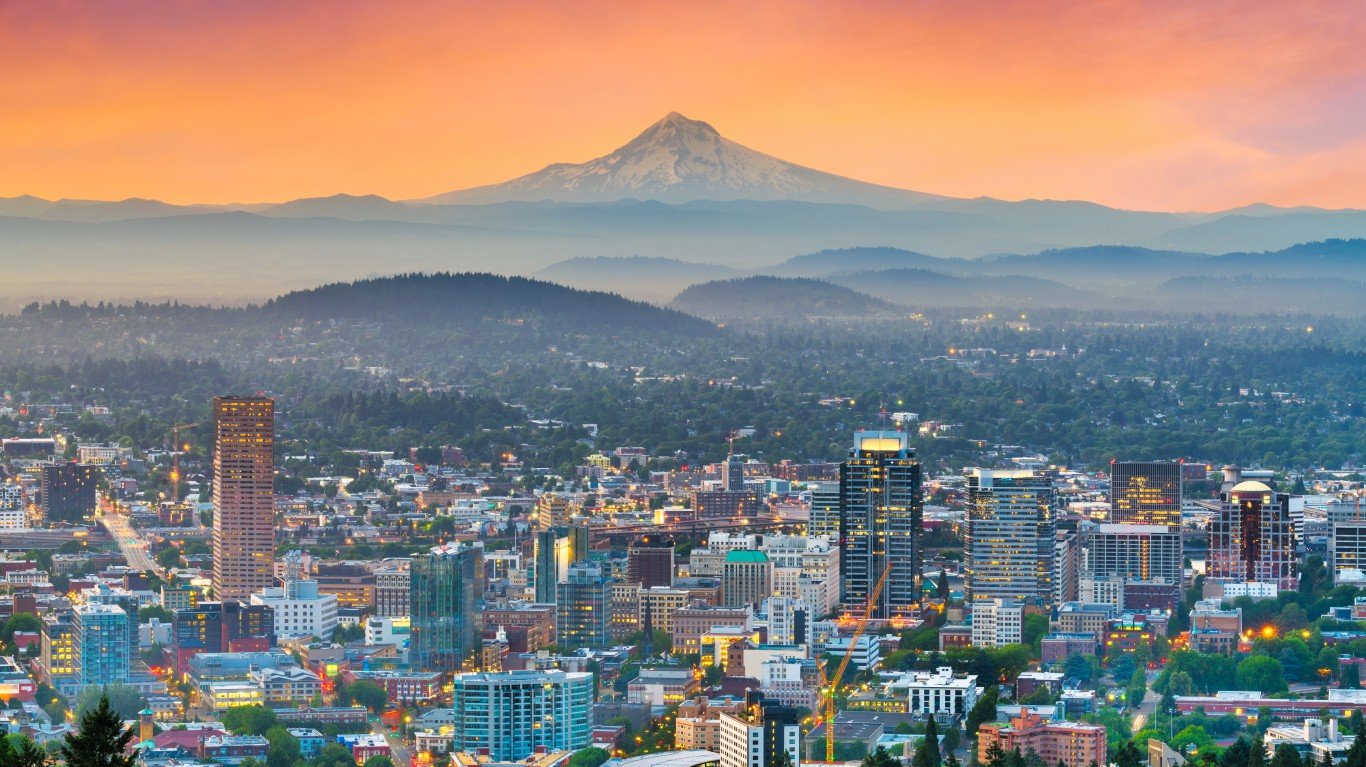
32. Oregon
> Poverty rate: 26.3% Black, 12.3% white
> Homeownership rate: 33.6% Black, 64.3% white
> Unemployment rate: 9.0% Black, 5.2% white
> Median household income: $41,773 Black, $63,499 white
When Oregon joined the union in 1859, it explicitly forbade Black people from living within its borders, making it the only state in the country to have had such racist and restrictive laws. It was not until 1926 that Black Americans would be allowed to move to the state. Today, socioeconomic racial disparities in Oregon are pronounced.
The poverty rate among Oregon’s Black population stands at 26.3%, more than double the 12.3% white poverty rate. Homeownership is one of the most practical ways to build intergenerational wealth in the United States, and the Black homeownership rate in Oregon stands at 33.6%, compared to the white homeownership rate in the state of 64.3%.
[in-text-ad-2]
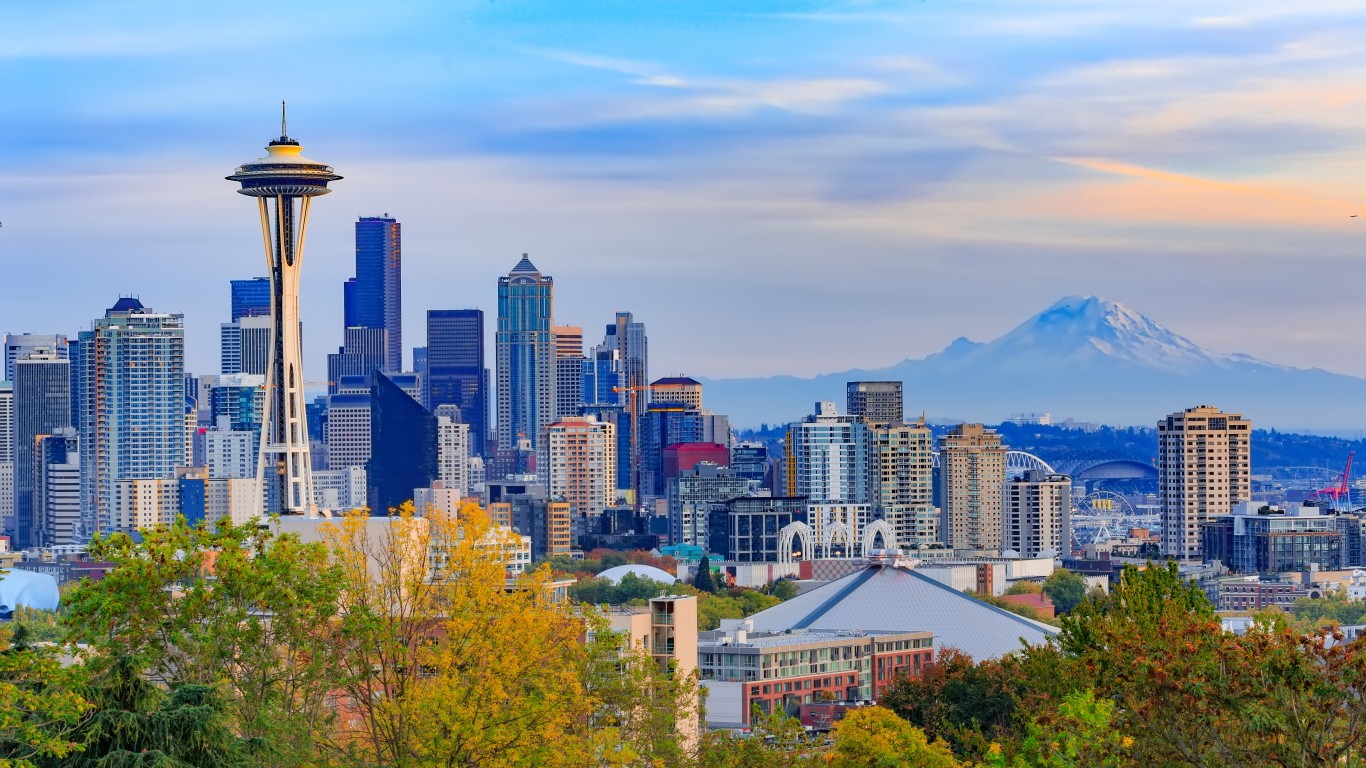
31. Washington
> Poverty rate: 20.4% Black, 9.5% white
> Homeownership rate: 31.5% Black, 66.4% white
> Unemployment rate: 7.8% Black, 4.6% white
> Median household income: $52,742 Black, $75,135 white
Seattle, like much of the country, was segregated for most of its history and left Black residents excluded from certain neighborhoods, employment opportunities, schools, and hospitals. The effects of racist policies such as these are evident in racial disparities across the state today.
The Black homeownership rate in Washington stands at 31.5%, less than half the white homeownership rate in the state of 66.4%. Homeownership is one of the most practical ways to build intergenerational wealth in the United States, and historically, Black Washington residents faced far greater restrictions to homeownership than white residents. Currently, more than one in every five Black Washington residents live below the poverty line, compared to less than one in every 10 white residents.
30. California
> Poverty rate: 20.5% Black, 12.2% white
> Homeownership rate: 34.8% Black, 58.8% white
> Unemployment rate: 10.4% Black, 5.7% white
> Median household income: $51,837 Black, $78,308 white
Racial inequity in California is perhaps best exemplified by the criminal justice system. Black state residents are over 10 times more likely to be incarcerated than white residents. To put it another way, over 29% of the people in correctional facilities in the state are Black, though Black residents comprise only 5% of the state’s population.
This large gap in incarceration rates can exacerbate other forms of inequality, as those in prison or with criminal records tend to have lower earning potential and fewer job opportunities. In California, the Black unemployment rate stands at 10.4%, compared to the 5.7% white jobless rate. Additionally, the typical Black household in the state earns $51,837 a year, about $26,500 less than the median income of $78,308 among white households.
[in-text-ad]
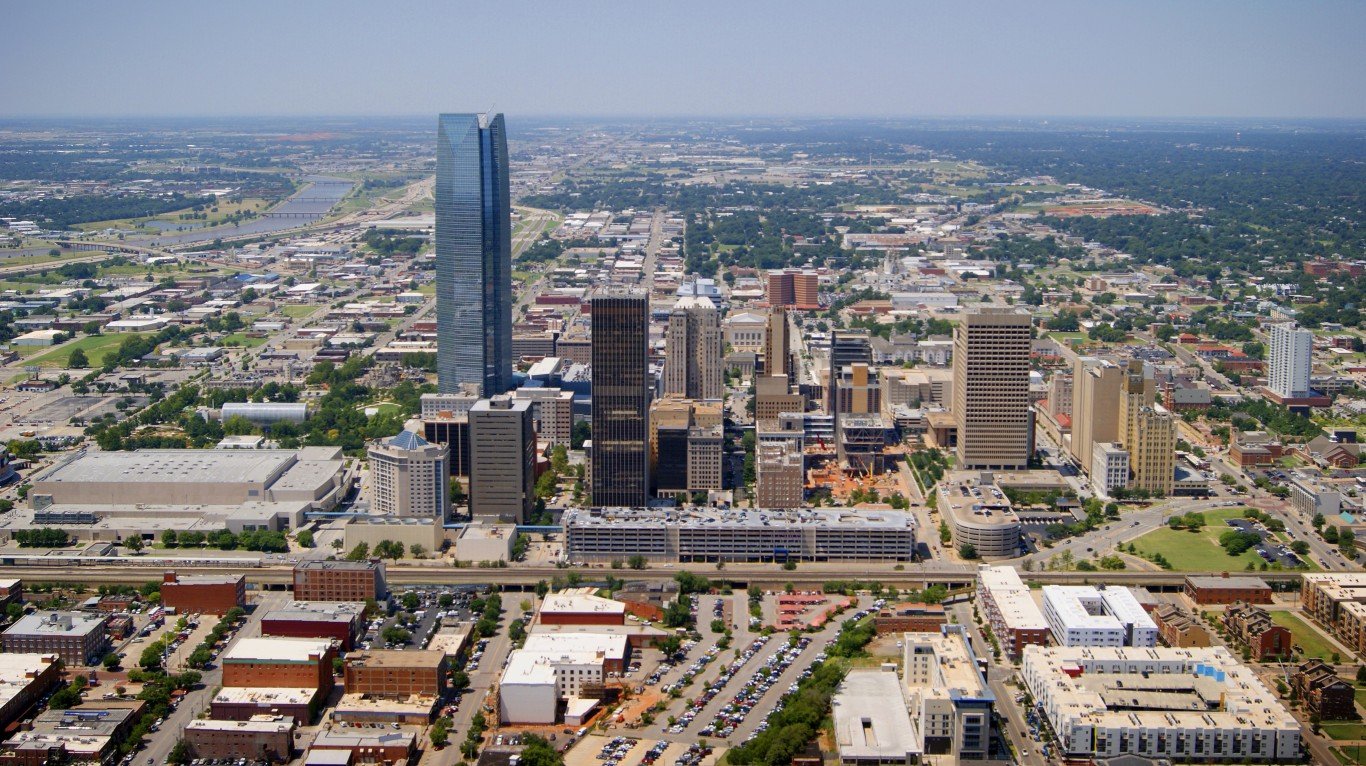
29. Oklahoma
> Poverty rate: 27.5% Black, 13.1% white
> Homeownership rate: 38.6% Black, 69.7% white
> Unemployment rate: 9.5% Black, 4.3% white
> Median household income: $35,296 Black, $56,266 white
Oklahoma is home to one of the most horrific acts of racial violence in American history – the Tulsa race massacre. In 1921, a white mob looted and destroyed a part of the city known as Black Wall Street, an economically prosperous Black enclave, leaving as many as 300 dead and thousands homeless. The event pushed many Black Tulsa residents out of the city permanently, and its effects are still felt today, a century later.
There are wide racial disparities in the state today, particularly in economic measures, including income, poverty, unemployment, and more. For example, 27.5% of the state’s Black population live below the poverty line, compared to 13.1% of white Oklahoma residents. Homeownership is one of the most practical ways to build intergenerational wealth in the United States, and in Oklahoma, the Black homeownership rate is just 38.6%, while the white homeownership rate is 69.7%.
[recirclink id=1042926]
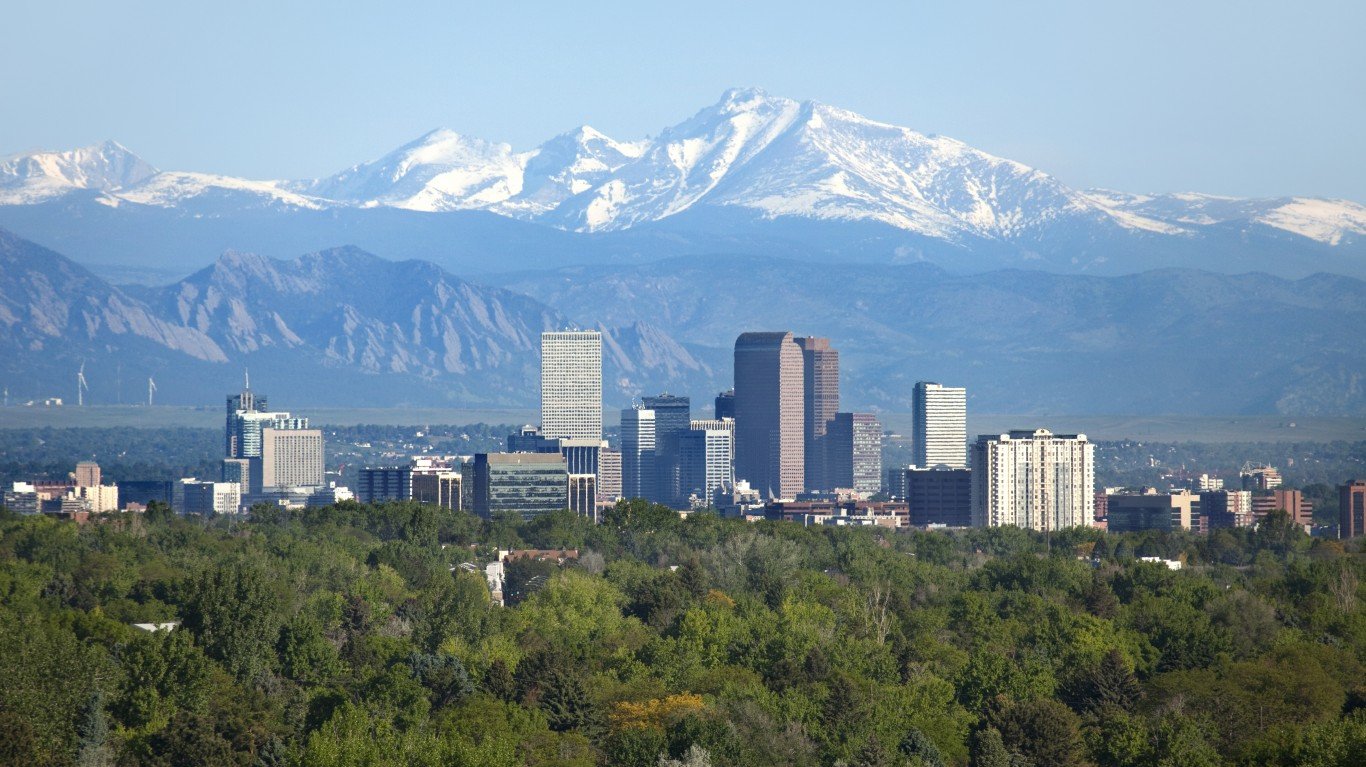
28. Colorado
> Poverty rate: 17.7% Black, 9.4% white
> Homeownership rate: 39.7% Black, 67.7% white
> Unemployment rate: 6.9% Black, 4.0% white
> Median household income: $51,677 Black, $74,730 white
Colorado ranks as the second worst Western state for Black Americans, trailing only Utah. One of the worst racial disparities in the state are incarceration rates. Black Colorado residents are over seven times more likely than white residents to be in a state or federal correctional institution. To put it another way, while only 3.9% of the state’s overall population are Black, about 19% of the incarcerated population in the state are Black.
Homeownership is one of the most practical ways to build intergenerational wealth in the United States, and historically, Black Americans have been excluded from certain housing markets. In Colorado, the Black homeownership rate is just 39.7%, while the white homeownership rate is 67.7%.
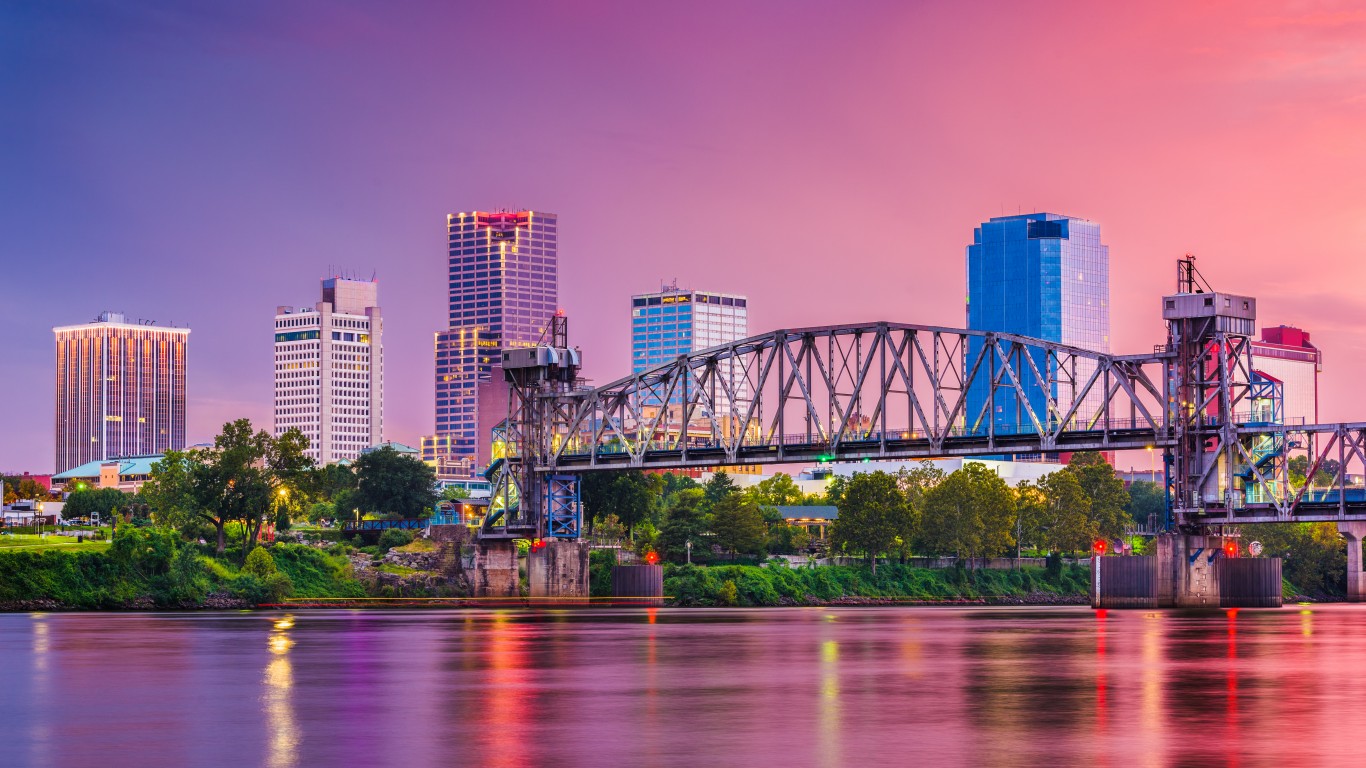
27. Arkansas
> Poverty rate: 29.3% Black, 14.1% white
> Homeownership rate: 43.5% Black, 70.7% white
> Unemployment rate: 9.0% Black, 4.3% white
> Median household income: $32,070 Black, $51,340 white
Segregation can fuel inequality, and Arkansas, like much of the South, is highly segregated. Nearly 44% of Black Arkansas residents live in majority Black neighborhoods, more than double the 19.5% share of all Black Americans residing in majority Black communities nationwide.
In Arkansas, majority Black neighborhoods tend to have relatively limited economic opportunities. For example, the 9.0% Black unemployment rate in the state is more than double the 4.3% white unemployment rate. Additionally, nearly 30% of Black Arkansas residents live below the poverty line, compared to 14.1% of white state residents.
[in-text-ad-2]
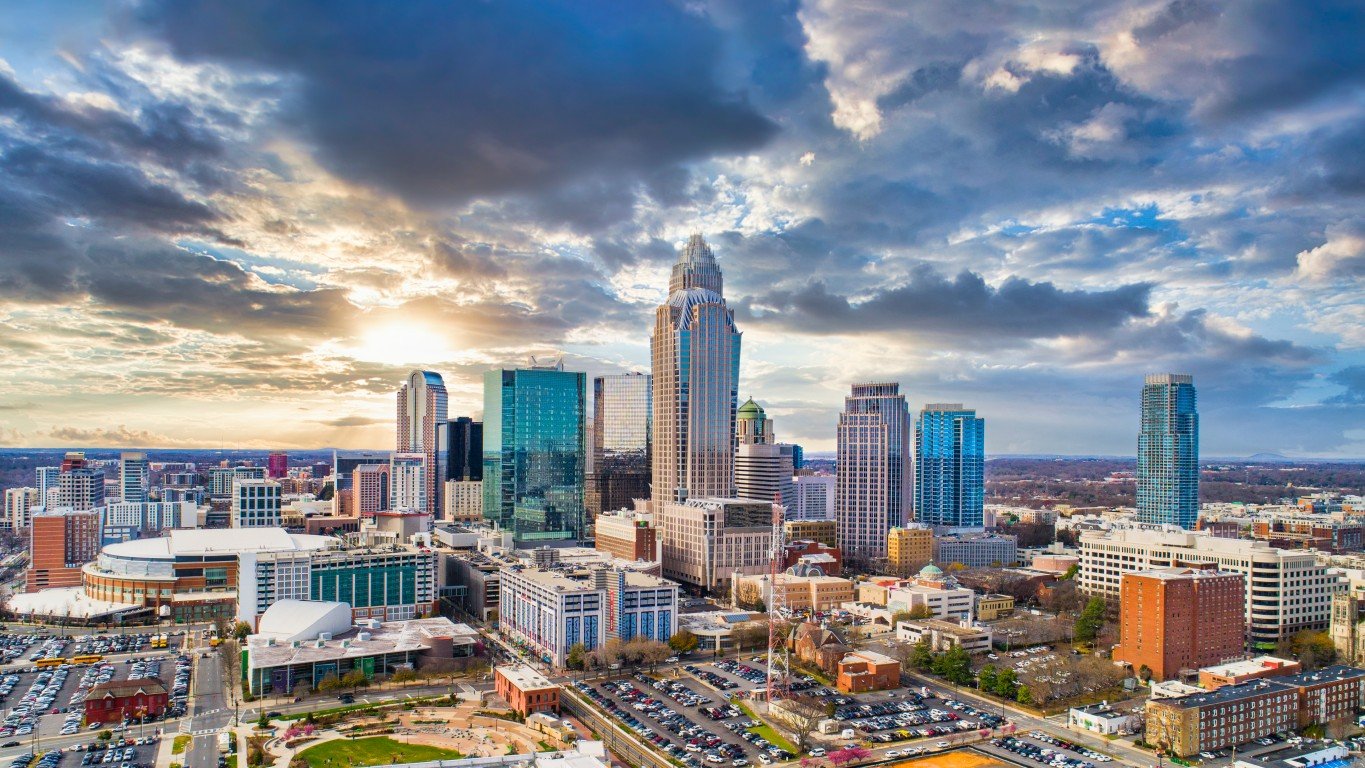
26. North Carolina
> Poverty rate: 22.5% Black, 11.5% white
> Homeownership rate: 45.5% Black, 72.1% white
> Unemployment rate: 9.1% Black, 4.4% white
> Median household income: $39,108 Black, $60,845 white
Some of the worst racial disparities in North Carolina are in measures of education outcomes. For example, only 21.3% of Black adults in the state have a bachelor’s degree or higher, compared to 34.0% of white adults. This wide gap is attributable to a multitude of factors, including segregated and inherently unequal public schools. Segregation remains a problem in the state today, and the problem is getting worse as white students are increasingly enrolling in charter schools.
The effects of segregation and unequal education outcomes are far reaching. Black North Carolinians are about twice as likely as their white counterparts to live below the poverty line and are more than twice as likely to be unemployed. Additionally, white households in the state typically earn nearly $22,000 more each year than Black households.
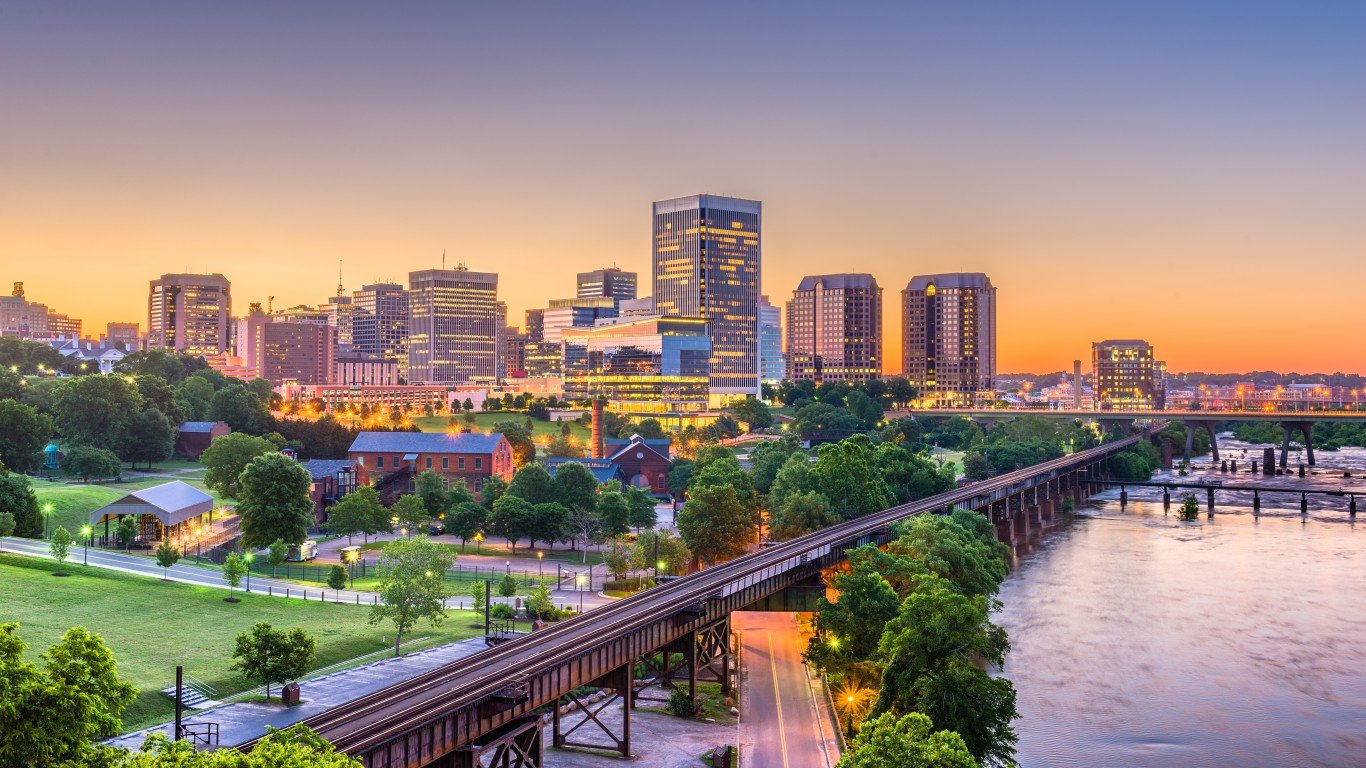
25. Virginia
> Poverty rate: 17.6% Black, 8.5% white
> Homeownership rate: 47.8% Black, 72.0% white
> Unemployment rate: 7.3% Black, 3.9% white
> Median household income: $51,654 Black, $79,578 white
Virginia ranks in the middle of all states in several key socioeconomic factors measuring racial disparities. The typical Black household in the state earns $51,654 a year, about $28,000 less than the median income of $79,578 among white households. At 17.6%, the Black poverty rate in Virginia is also more than double the 8.5% white poverty rate.
Measures of public health reveal other racial disparities in Virginia. For example, the infant mortality rate among the state’s Black population stands at 10.6 for every 1,000 live births, compared to 4.7 per 1,000 among white Virginia residents – a larger gap than in most other states.
[in-text-ad]
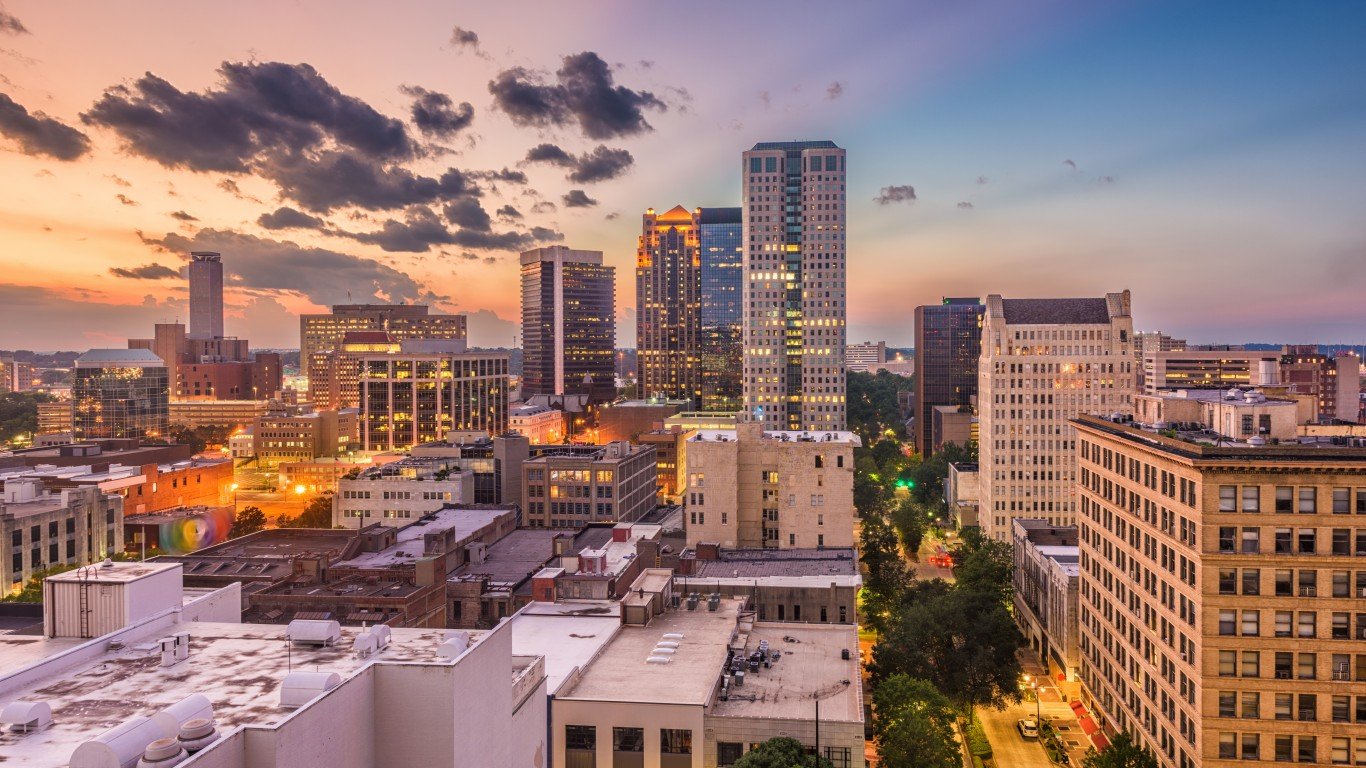
24. Alabama
> Poverty rate: 27.0% Black, 12.3% white
> Homeownership rate: 50.8% Black, 76.1% white
> Unemployment rate: 9.5% Black, 4.5% white
> Median household income: $33,928 Black, $57,551 white
Home to Rosa Parks and the Montgomery bus boycott, as well as the marches from Selma to Montgomery, Alabama was ground zero for much of the civil rights movement in the 20th century. Today, it ranks close to the middle of all states in key measures of racial disparities – and much of that inequality is attributable in part to continued segregation, a legacy of racist laws from the previous century. Currently, over half of all Black Alabama residents live in majority Black communities, making it one of the most segregated states in the country.
While many Alabama residents struggle with issues of poverty and unemployment, the burden is shouldered disproportionately by Black communities. The Black poverty rate of 27.0% in the state is more than double the 12.3% white poverty rate. Black workers are also more than twice as likely to be unemployed as white workers.
[recirclink id=944704]
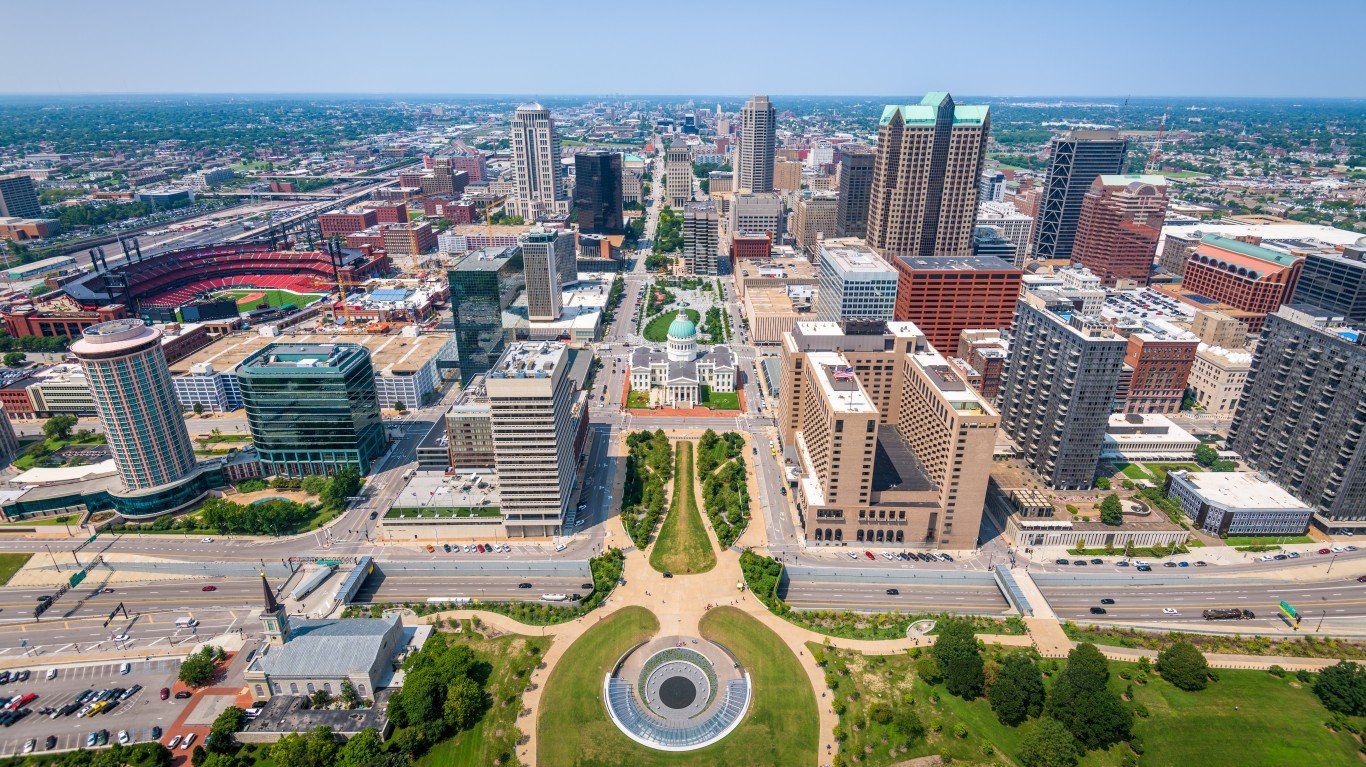
23. Missouri
> Poverty rate: 24.7% Black, 11.7% white
> Homeownership rate: 37.6% Black, 71.6% white
> Unemployment rate: 9.2% Black, 3.9% white
> Median household income: $37,179 Black, $58,921 white
Missouri has the lowest level of racial inequality in the Midwest. Still, it ranks among the top 25 states with the worst inequality nationwide. Nearly one in every four Black Missourians live below the poverty line, compared to about one in every nine white residents. Black state workers are also more than twice as likely as white workers to be unemployed.
As is the case in much of the United States, racial disparities in Missouri are attributable in part to segregation. Due to redlining and other discriminatory practices, particularly in major urban areas like Kansas City and St. Louis, Missouri is one of the most segregated states in the country. Over half of the state’s 696,000 Black residents live in majority Black neighborhoods. Many of these communities were underserved, had – and continue to have – limited economic opportunities, and have schools that are overcrowded and underfunded.
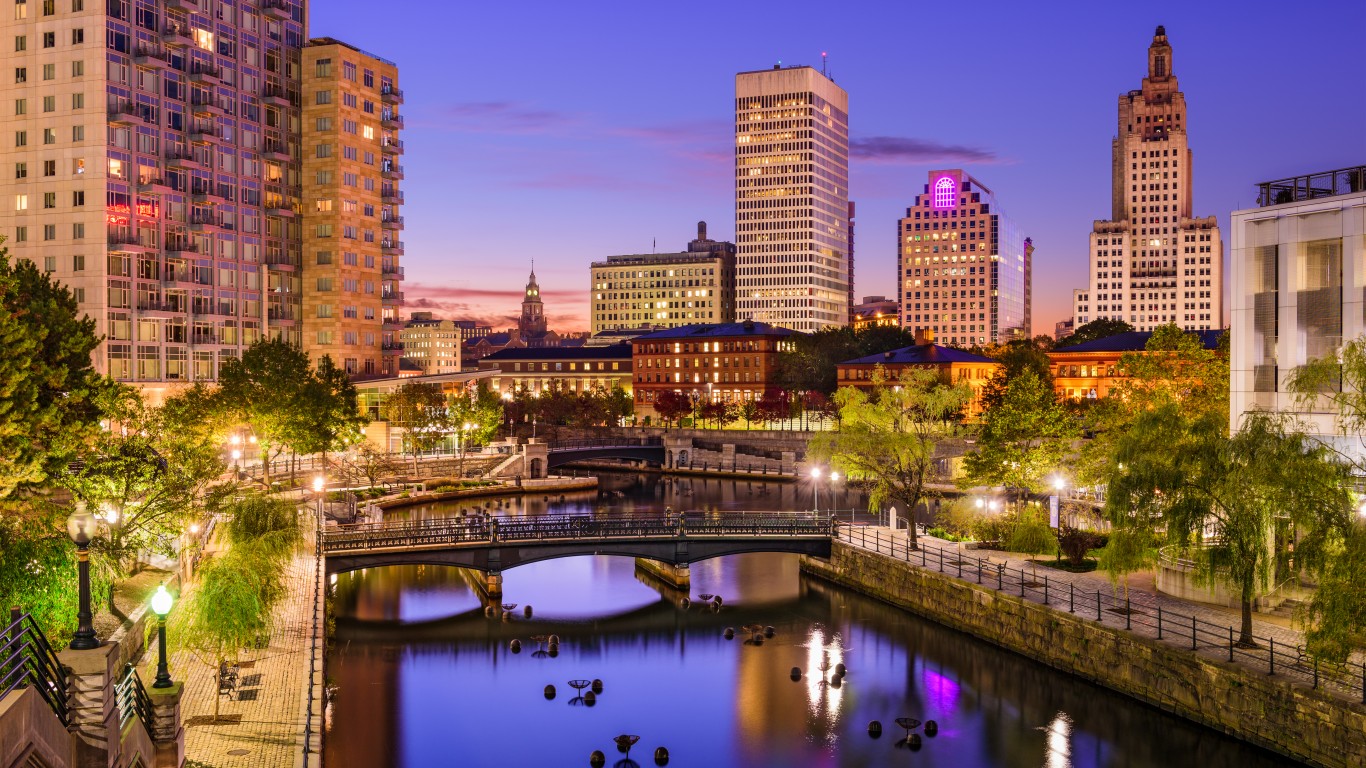
22. Rhode Island
> Poverty rate: 22.0% Black, 10.0% white
> Homeownership rate: 33.7% Black, 65.5% white
> Unemployment rate: 9.7% Black, 4.7% white
> Median household income: $45,727 Black, $71,096 white
Rhode Island ranks better than most Northeastern states for racial inequality but still ranks in the top 25 of states for racial inequality nationwide. Some of the worst disparities are in social measures – particularly with regard to law enforcement and the justice system. Black Rhode Islanders are nearly 10 times more likely than white residents to be incarcerated in a state of federal correctional facility. Black residents make up about 30% of the state’s prison population and only 5.7% of the overall population.
Other stark disparities in the state are in economic measures. For example, the Black poverty rate of 22.0% in Rhode Island is more than double the 10.0% white poverty rate. Black workers are also more than twice as likely to be unemployed than white workers.
[in-text-ad-2]

21. Indiana
> Poverty rate: 26.9% Black, 11.2% white
> Homeownership rate: 37.2% Black, 73.6% white
> Unemployment rate: 10.7% Black, 4.1% white
> Median household income: $34,895 Black, $59,415 white
Indiana’s public school system is highly segregated. A 2017 study found that the average Black student in Indiana attends school where more than two-thirds of students are non-white. Meanwhile, the average white student in Indiana attends school where less than 20% of students are non-white. Segregated schools are inherently unequal, and so are education outcomes in Indiana. Only about 18% of Black adults in the state have a bachelor’s degree or higher, compared to about 27% of white adults.
Disparities in educational outcomes have serious economic implications. Black Indiana residents are more than twice as likely as their white counterparts to live below the poverty line and more than twice as likely to be unemployed. The Midwestern U.S. has some of the worst racial disparities in the country. And though Indiana has worse inequality than most states, it compares favorably to nearly every other state in the Midwest.
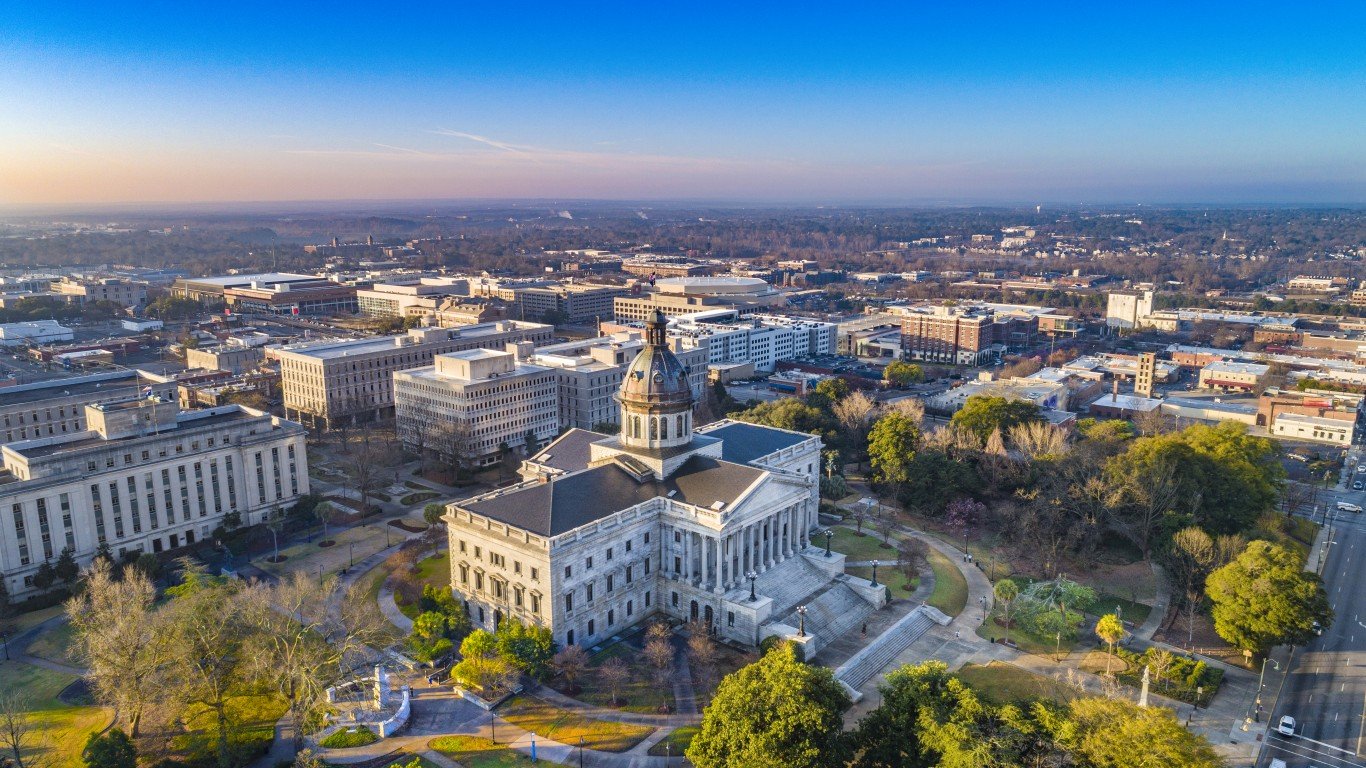
20. South Carolina
> Poverty rate: 24.5% Black, 10.9% white
> Homeownership rate: 53.1% Black, 76.3% white
> Unemployment rate: 9.1% Black, 4.5% white
> Median household income: $35,092 Black, $61,722 white
South Carolina has greater socioeconomic disparities along racial lines than most other states. Both the Black poverty rate and unemployment rate in the state are more than double the comparable rates among white area residents.
Some key measures of health outcomes also reveal racial disparity in the state. For example, the infant mortality rate among the state’s Black population stands at 10.5 for every 1,000 live births, compared to 5.0 per 1,000 among white South Carolinians.
[in-text-ad]
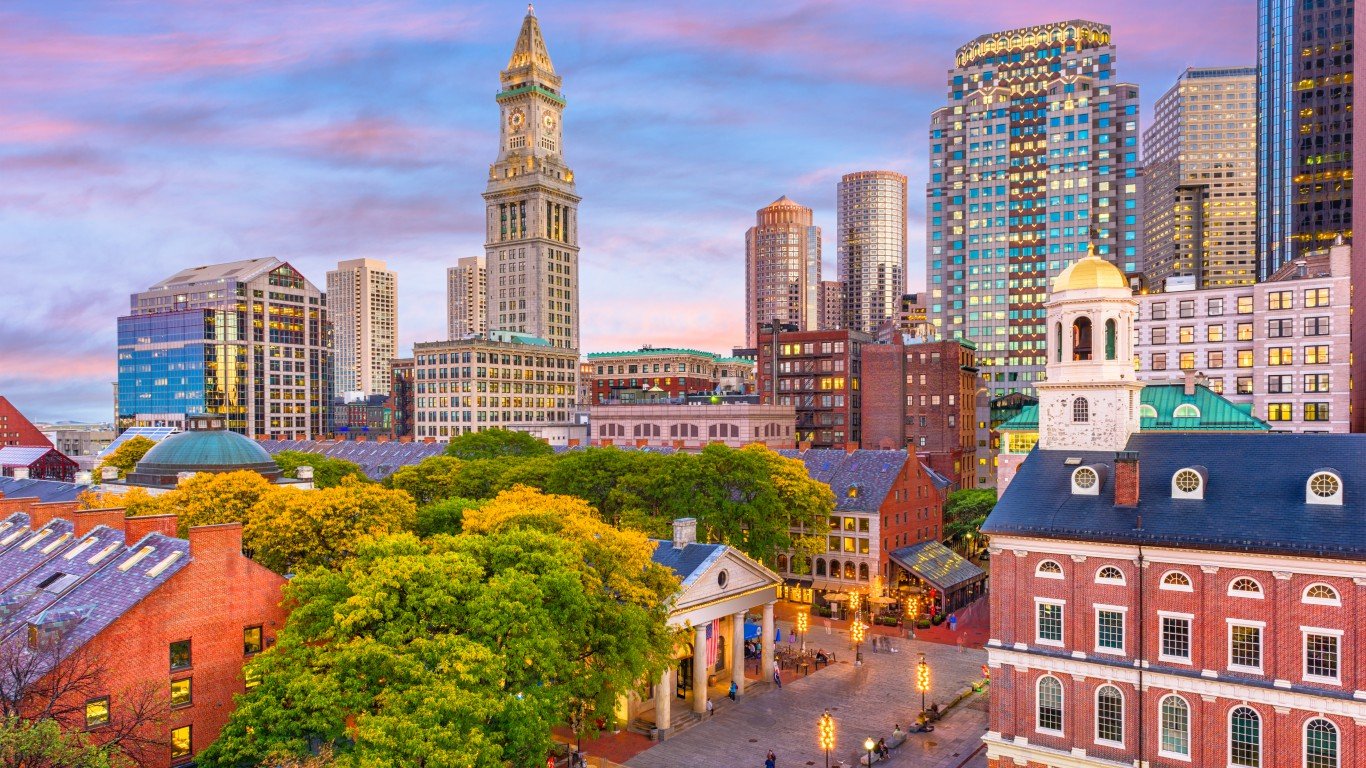
19. Massachusetts
> Poverty rate: 18.7% Black, 8.3% white
> Homeownership rate: 34.1% Black, 67.4% white
> Unemployment rate: 8.5% Black, 4.3% white
> Median household income: $51,842 Black, $85,789 white
Massachusetts is one of several states in the Northeast where disparities between white and Black residents in key measures are worse than in most other states. One of the most pronounced disparities in the state is between the white and Black incarceration rate. Though Massachusetts’ Black imprisonment rate of 409 inmates per 100,000 people is the lowest of any state, it is more than seven times higher than the white incarceration rate of 57 per 100,000. For context, Black Americans nationwide are about five times more likely than white Americans to be in a federal or state prison.
Disparate incarceration rates can exacerbate inequality in other areas, including income and employment. The Black unemployment rate of 8.5% in Massachusetts is nearly double the 4.3% white unemployment rate, and the typical white household in the state earns about $34,000 more per year than the typical Black household.
[recirclink id=996411]
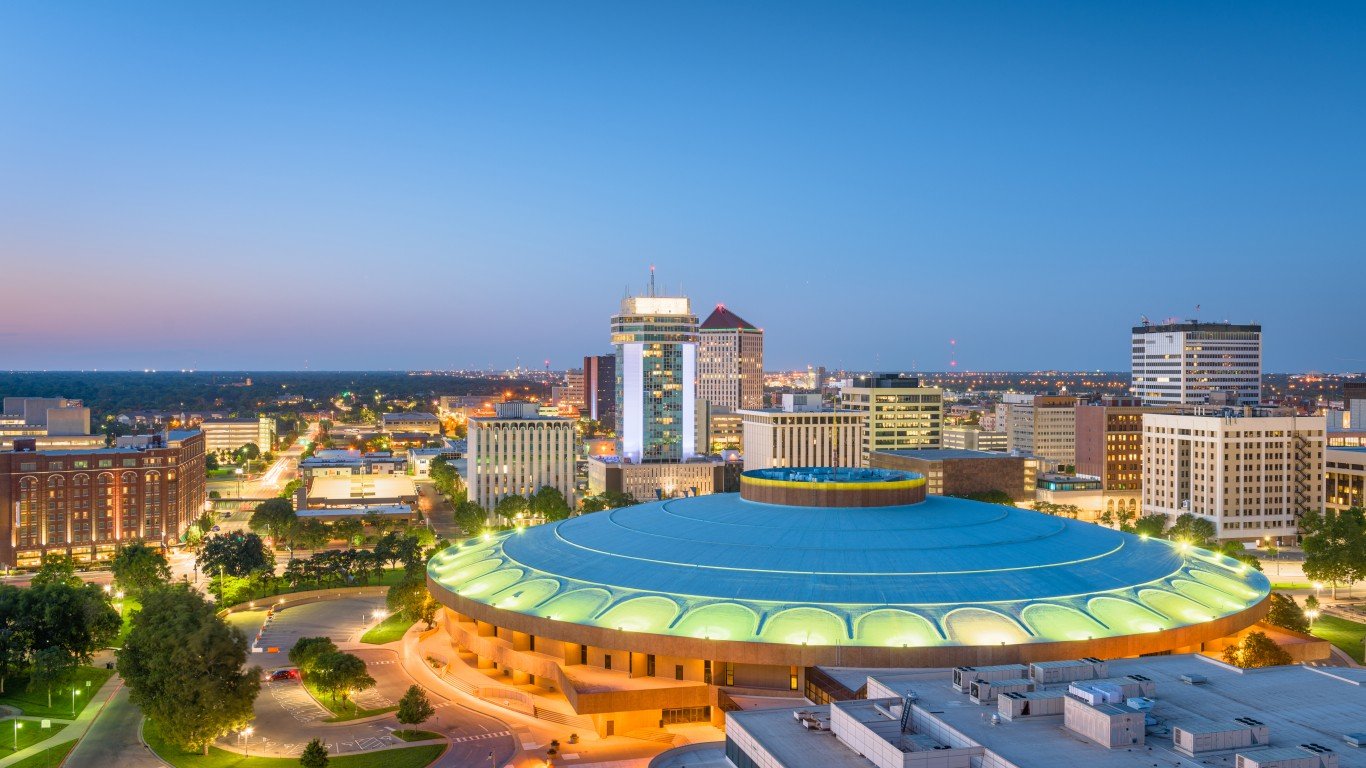
18. Kansas
> Poverty rate: 24.6% Black, 10.4% white
> Homeownership rate: 34.8% Black, 69.4% white
> Unemployment rate: 7.8% Black, 3.7% white
> Median household income: $38,079 Black, $61,812 white
Kansas ranks worse than most states in measures of socioeconomic racial disparity. One of the most pronounced disparities is in the state’s poverty rate. Nearly 25% of Black Kansas residents live below the poverty line, compared to about 10% of white Kansas residents.
Much of the racial inequality evident in the U.S. today can be traced to segregation, as majority Black neighborhoods were historically underfunded and underserved. Though segregation in Kansas in the 20th century was less rigid than in parts of the Deep South, school districts had the option to segregate elementary schools – which ultimately led to the Supreme Court Case, Brown V. Board of Education of Topeka that famously deemed school segregation to be unconstitutional. Today, the white high school diploma attainment rate among Kansas adults is about 5 percentage points higher than among Black adults, and the white bachelor’s degree attainment rate is about 14 percentage points higher.
17. Mississippi
> Poverty rate: 31.6% Black, 12.8% white
> Homeownership rate: 53.5% Black, 77.4% white
> Unemployment rate: 11.1% Black, 5.2% white
> Median household income: $30,714 Black, $55,957 white
Mississippi has historically been one of the most segregated states in the country – and much of that segregation, and its effects, are apparent today. According to the census, nearly 57% of Black Mississippi residents currently live in majority Black neighborhoods, a larger share than in all but three other states. Mississippi’s long history of stringent segregation and racial oppression has also wrought greater inequality than in most other states.
Today, the poverty rate among Black residents is 31.6%, well more than double the 12.8% poverty rate among white residents. Black labor force participants in Mississippi are also more than twice as likely to be unemployed as white workers.
[in-text-ad-2]
16. South Dakota
> Poverty rate: 22.9% Black, 8.8% white
> Homeownership rate: 19.2% Black, 71.5% white
> Unemployment rate: 3.8% Black, 2.4% white
> Median household income: $38,706 Black, $61,351 white
Only 2% of South Dakota’s population identify as Black, one of the smallest shares of any state – and the disparities between the state’s Black and white residents in key economic measures are among the largest in the country. For example, the Black poverty rate in the state of 22.9% is more than double the 8.8% white poverty rate.
South Dakota also incarcerates a far larger share of its Black residents than most states. A reported 1,547 in every 100,000 Black South Dakotans are in a state or federal correctional facility compared to only 242 white state residents per 100,000.
15. Maine
> Poverty rate: 34.8% Black, 11.1% white
> Homeownership rate: 22.1% Black, 73.3% white
> Unemployment rate: 7.5% Black, 4.0% white
> Median household income: $42,901 Black, $58,459 white
Based on racial disparities in several key socioeconomic measures, Maine ranks as the 15th worst state for Black Americans and second worst in the New England region. Maine has a Black poverty rate of 34.8%, the highest of any state and more than triple the white poverty rate in the state of 11.1%.
The higher likelihood of poverty for the state’s Black residents is likely partly the result of disparities in education outcomes. For example, only 82.5% of Black adults in Maine have a high school diploma, over 10 percentage points below the white high school diploma attainment rate. Black adults in Maine are also over nine times more likely than their white counterparts to be incarcerated in a state or federal correctional facility.
[in-text-ad]
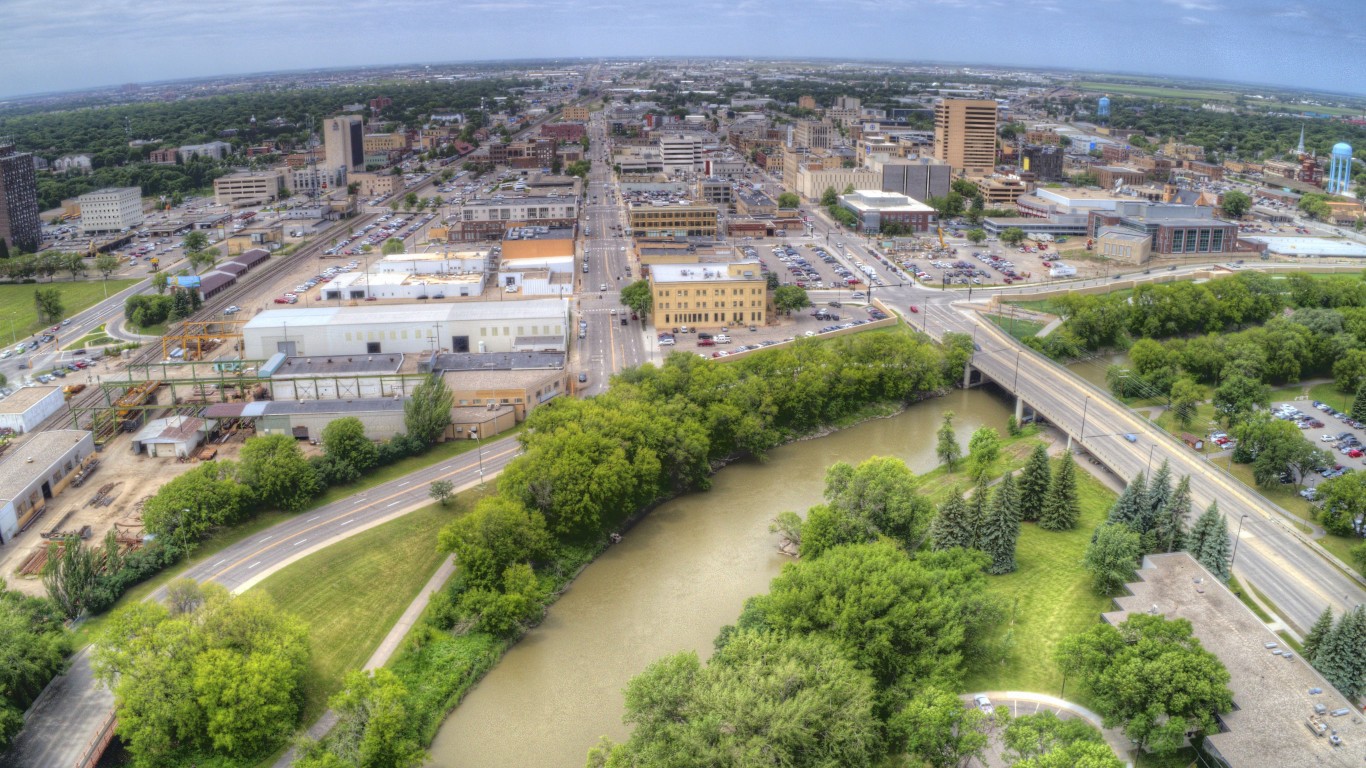
14. North Dakota
> Poverty rate: 25.7% Black, 8.4% white
> Homeownership rate: 7.8% Black, 65.9% white
> Unemployment rate: 7.3% Black, 2.2% white
> Median household income: $37,872 Black, $68,066 white
Homeownership is one of the most practical ways to build intergenerational wealth in the United States. In North Dakota, the Black homeownership rate is just 7.8%, the lowest of any state and a fraction of the state’s 65.9% white homeownership rate. The North Dakota Advisory Committee to the U.S. Commission on Civil Rights conducted a study on access to fair housing in the state for minority populations and provided a list of recommendations in July 2021. These included harsher penalties for housing discrimination and increased investment in affordable housing.
Other stark disparities in the state include poverty, as more than one in every four Black North Dakotans live below the poverty line, compared to fewer than one in every 10 white residents. Additionally, even though only less than 3% of North Dakota’s population are Black, Black prisoners account for 12% of the state’s incarcerated population.
[recirclink id=1029781]
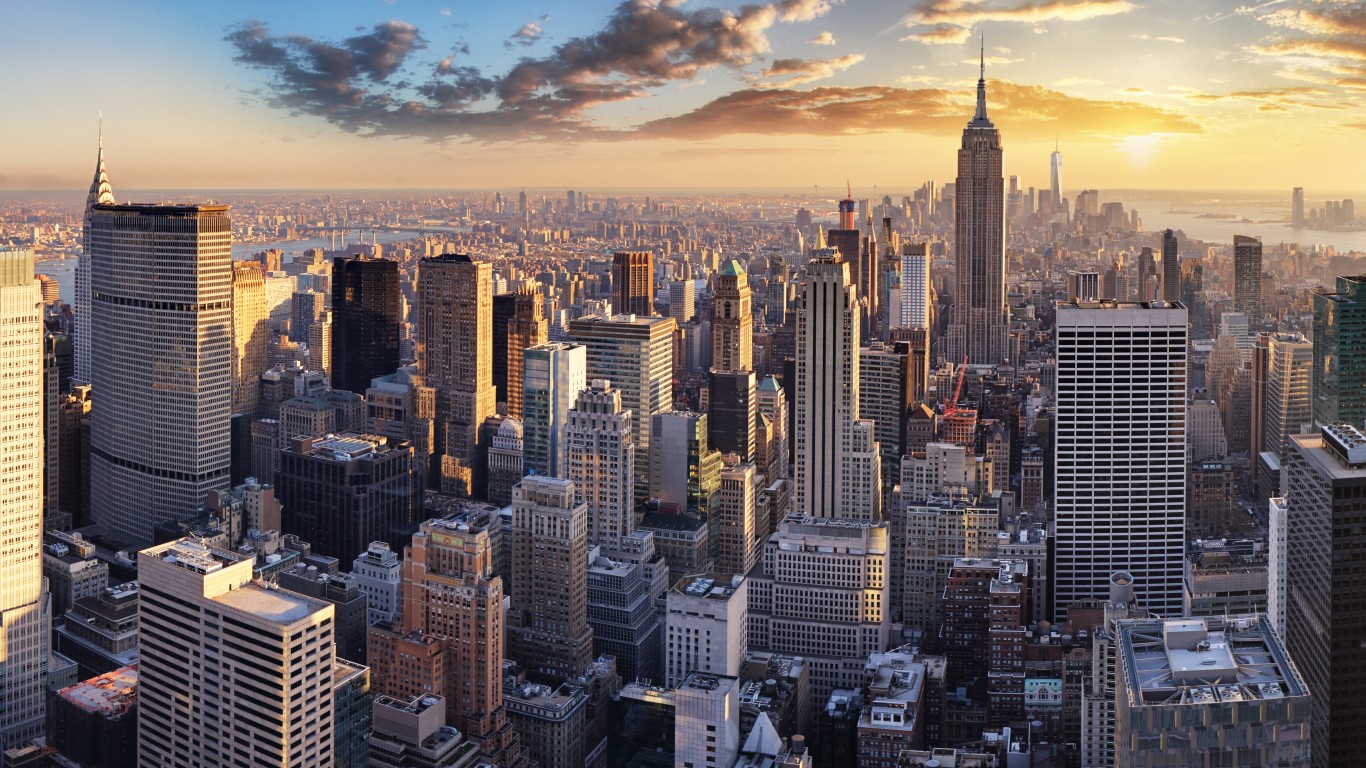
13. New York
> Poverty rate: 21.1% Black, 10.4% white
> Homeownership rate: 31.3% Black, 63.6% white
> Unemployment rate: 9.1% Black, 4.3% white
> Median household income: $48,557 Black, $76,737 white
New York state has the highest degree of income inequality in the United States – and inequality along racial lines is one contributing factor. The typical Black household in the state earns just $48,557 a year, compared to the median income among white households of $76,737. Additionally, about one in every five Black state residents live below the poverty line, compared to one in every 10 white residents.
Homeownership is one of the most practical ways to build intergenerational wealth in the United States, and the Black homeownership rate in New York of 31.3% is less than half the 63.6% homeownership rate among the state’s white population.
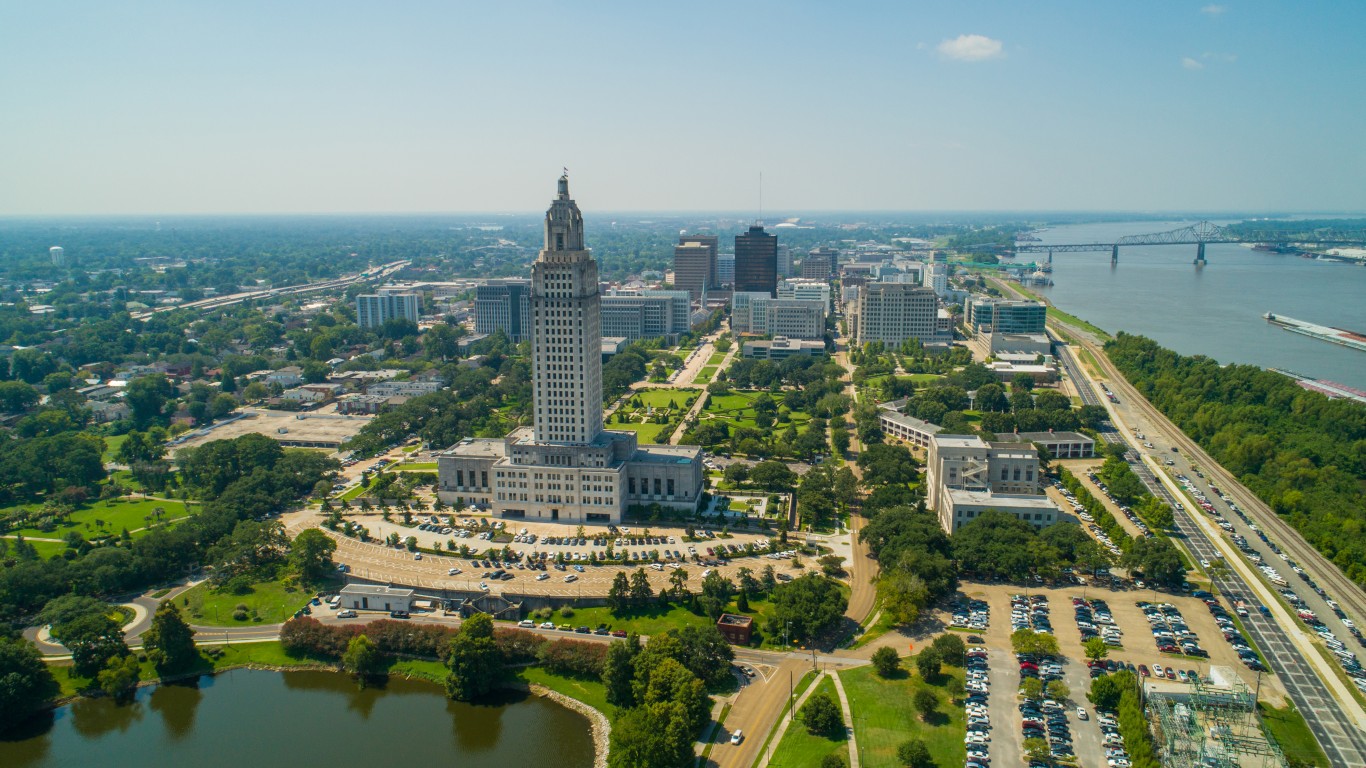
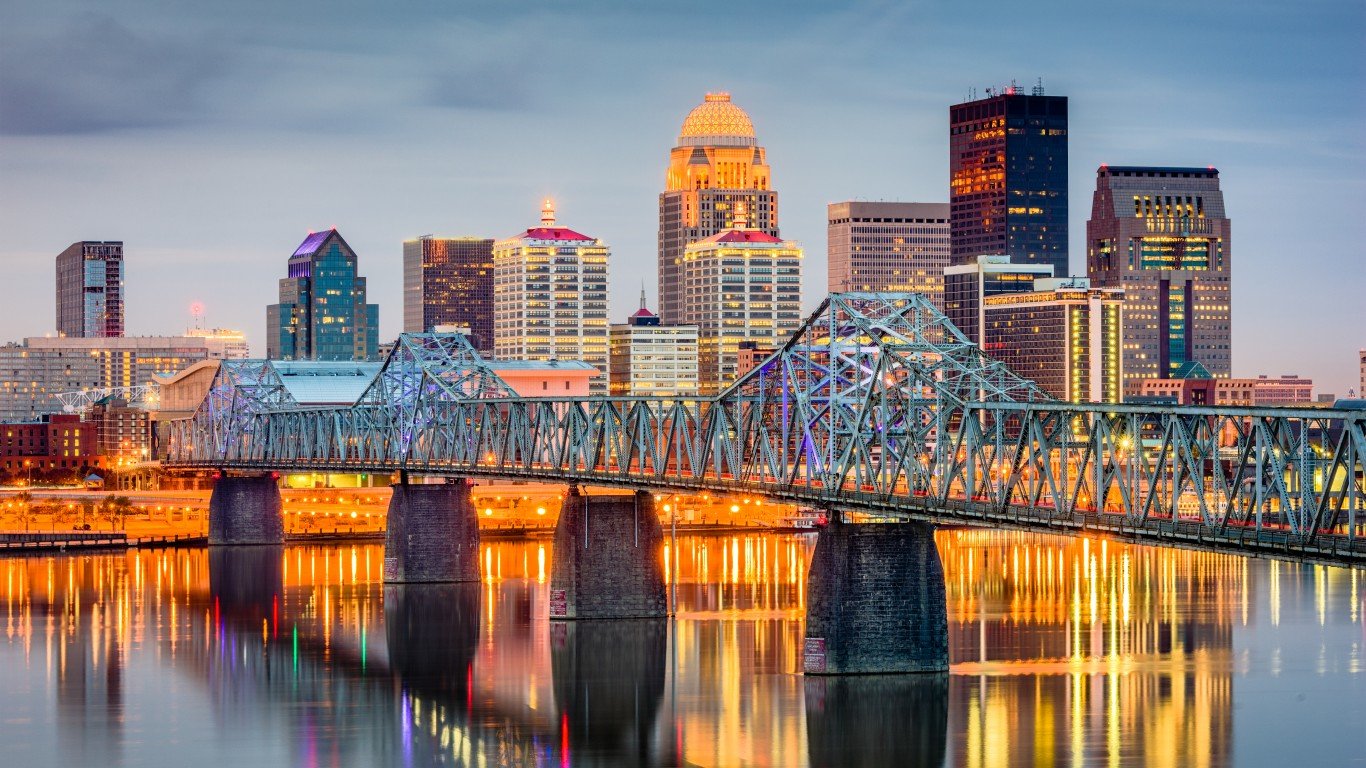
12. Louisiana
> Poverty rate: 31.4% Black, 12.8% white
> Homeownership rate: 47.2% Black, 74.7% white
> Unemployment rate: 10.0% Black, 4.8% white
> Median household income: $30,540 Black, $60,288 white
Like much of the Deep South, Louisiana had some of the most stringent and repressive segregation laws in the country, and the legacy of those policies loom large today. One of the most segregated states in the country, over 56% of Black Louisiana residents reside in majority Black communities. Many schools in the state are also largely segregated, which gives way to disparate educational outcomes. Currently, only about 80% of Black adults in Louisiana have a high school diploma, compared to 88% of white adults in the state.
Black Louisiana workers are also twice as likely to be unemployed and Black residents are twice as likely to live below the poverty line as their white counterparts.
[in-text-ad-2]
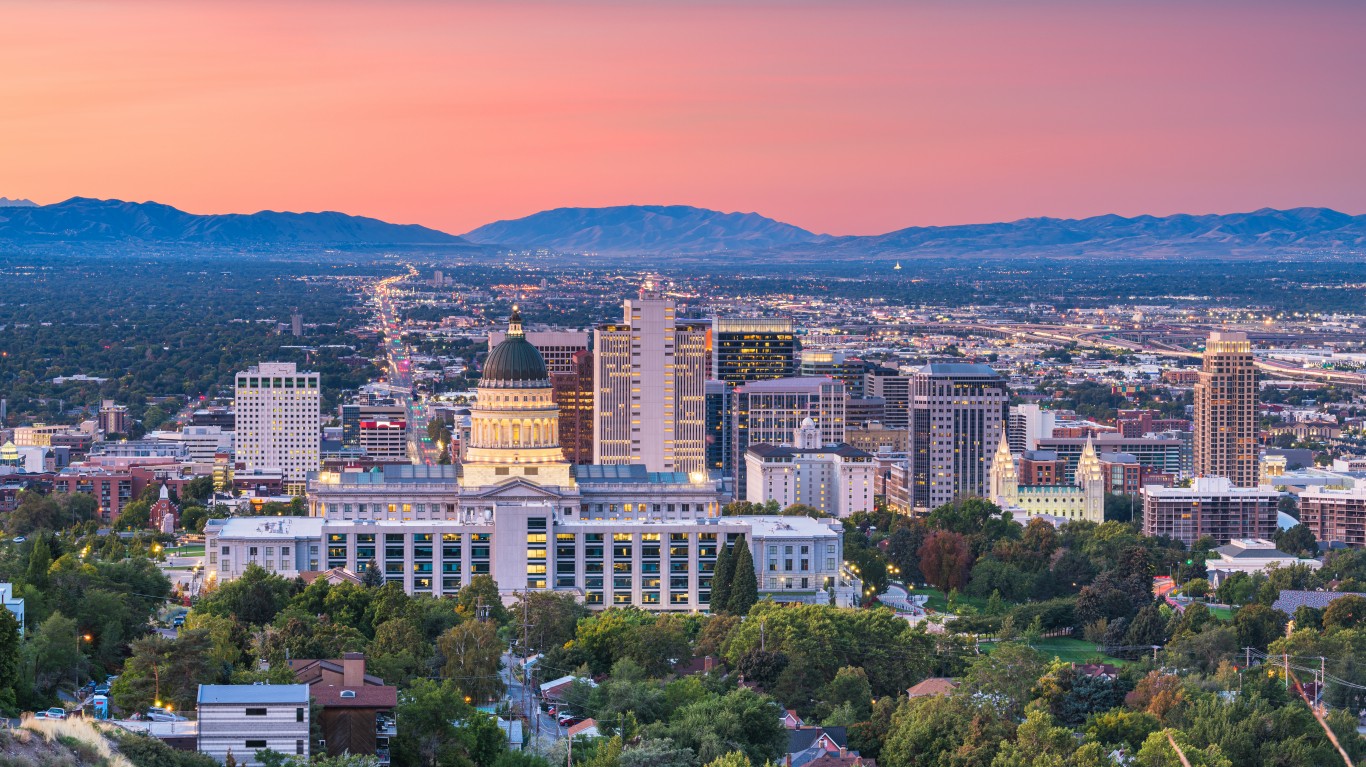
11. Utah
> Poverty rate: 27.2% Black, 8.6% white
> Homeownership rate: 28.9% Black, 72.5% white
> Unemployment rate: 6.4% Black, 3.3% white
> Median household income: $41,752 Black, $73,580 white
Utah ranks as the worst Western state for Black Americans and the 11th worst state nationwide. Only 1.1% of the state’s population identify as Black. As the second to last state in the West to repeal bans on interracial marriages, the state has had racist laws on the books more recently than much of the rest of the country. Today, Black state residents are nearly nine times as likely as white residents to be incarcerated in a state or federal correctional facility.
Economic disparities in Utah are also profound. The typical Black household in the state earns just $41,752 a year, compared to the median income among white households of $73,580. Additionally, more than one in every four Black state residents live below the poverty line, compared to fewer than one in every 10 white residents, one of the largest such gaps of any state.

10. Pennsylvania
> Poverty rate: 26.0% Black, 9.7% white
> Homeownership rate: 43.2% Black, 73.3% white
> Unemployment rate: 11.1% Black, 4.4% white
> Median household income: $38,560 Black, $65,306 white
Pennsylvania ranks as the 10th worst state for Black Americans and the third worst in the Northeast. Segregation can fuel racial disparities, and Pennsylvania is one of the more heavily segregated states, with about 47% of Black residents living in majority Black communities. One area of significant racial disparity in Pennsylvania is in the state’s job market. Black unemployment is an estimated 11.1% in the state, well more than double the 4.4% white unemployment rate.
Disparities are not just economic, but also social – particularly with regard to law enforcement and the justice system. Though only 10.7% of Pennsylvania’s population are Black, 46% of those incarcerated in the state are Black.
[in-text-ad]
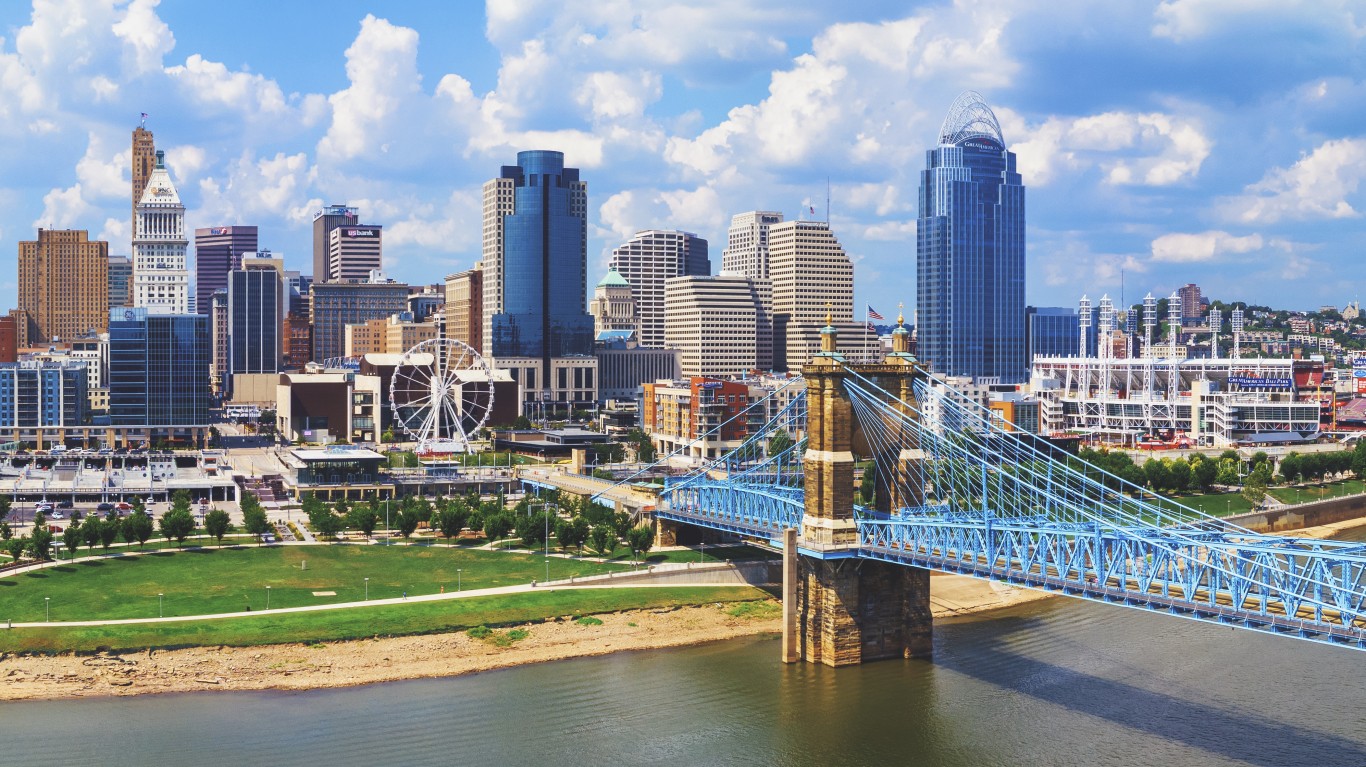
9. Ohio
> Poverty rate: 29.6% Black, 11.1% white
> Homeownership rate: 35.6% Black, 71.7% white
> Unemployment rate: 11.5% Black, 4.3% white
> Median household income: $33,158 Black, $61,108 white
Ohio is home to several Rust Belt cities – such as Cincinnati, Cleveland, and Dayton – that in the previous century, employed exclusionary housing covenants that entrenched segregated neighborhoods. As a result, Ohio remains one of the most segregated states in the country. Census data shows that 47% of Black Ohio residents live in majority Black neighborhoods. Segregation can lead to increased levels of inequity, and Ohio has some of the widest racial gaps in the country.
Some of the most glaring inequities in the state are economic. For example, the Black poverty rate of 29.6% in Ohio is nearly three times the 11.1% white poverty rate. Additionally, at 11.5%, Black unemployment is more than double the 4.3% white jobless rate.
[recirclink id=1029484]
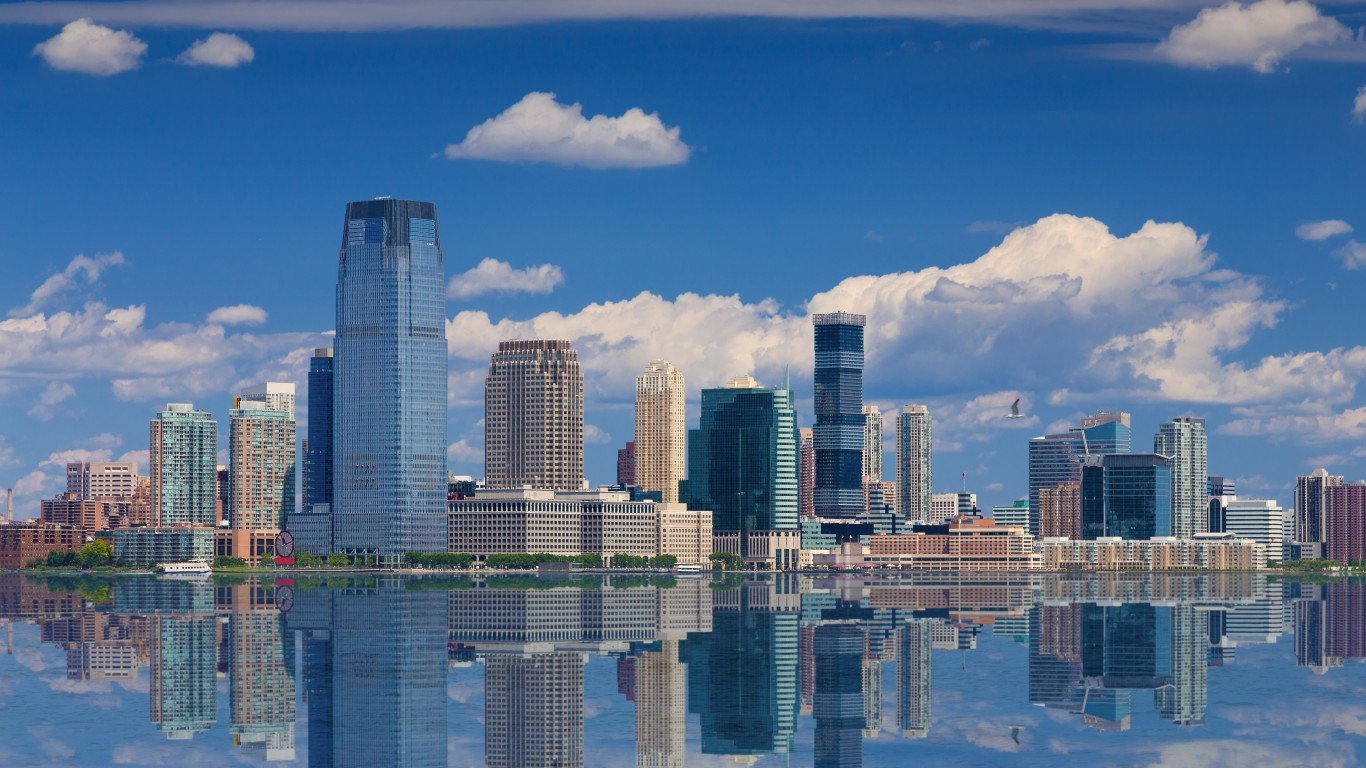
8. New Jersey
> Poverty rate: 17.3% Black, 7.8% white
> Homeownership rate: 38.9% Black, 71.4% white
> Unemployment rate: 9.8% Black, 4.7% white
> Median household income: $53,247 Black, $88,810 white
New Jersey ranks as the eighth worst state for Black Americans overall and the second worst in the Northeast. Its ranking is due in large part to disparities in some key health outcomes. For example, the infant mortality rate among the state’s Black population stands at 9.9 for every 1,000 live births, compared to 3.2 per 1,000 among white New Jersey residents – the largest such gap of any state.
Inequalities are not just health related, but also social – particularly with regard to law enforcement and the justice system. Only 12.7% of New Jersey’s population are Black, while more than 60% of those incarcerated in correctional facilities in the state are Black, the largest such disparity of any state.
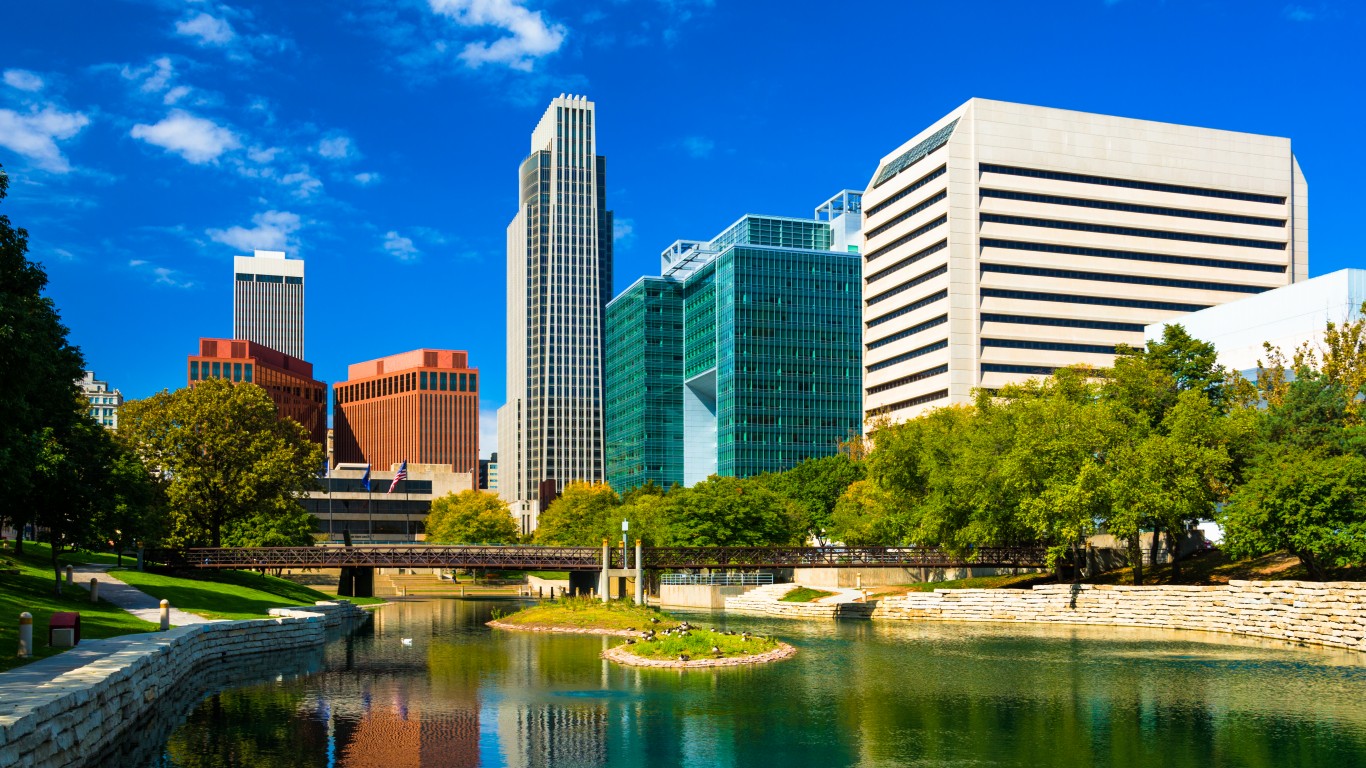
7. Nebraska
> Poverty rate: 25.0% Black, 9.6% white
> Homeownership rate: 30.1% Black, 69.1% white
> Unemployment rate: 8.0% Black, 2.9% white
> Median household income: $35,976 Black, $63,641 white
Segregation can lead to unequal socioeconomic outcomes, and communities and schools in parts of Nebraska, including Omaha, have historically been, and continue to be, highly segregated. One of the most pronounced disparities in the state is in income. The typical Black household in the state earns just $35,976 a year, well below the median income of $63,641 among white households.
The state’s large income gaps along racial lines are attributable in part to inequality in the job market. Black unemployment in Nebraska stands at 8%, nearly triple the 2.9% white jobless rate.
[in-text-ad-2]

6. Connecticut
> Poverty rate: 17.9% Black, 7.6% white
> Homeownership rate: 39.4% Black, 72.5% white
> Unemployment rate: 10.4% Black, 5.0% white
> Median household income: $49,000 Black, $85,502 white
Connecticut has some of the worst income inequality in the United States – and inequality along racial lines is one contributing factor. The typical Black household in the state earns just $49,000 a year, about $36,500 less than the median income of $85,502 among white households in the state. Income inequality is driven in part by disparities in the labor market, as Black workers in Connecticut are more than twice as likely to be unemployed as their white counterparts.
Inequalities are not just economic, but also social – particularly with regard to law enforcement and the justice system. Black Connecticut residents are nearly 11 times more likely than white residents to be incarcerated in a state of federal correctional facility. Partially as a result, Connecticut ranks as the worst state for Black Americans in the Northeast.
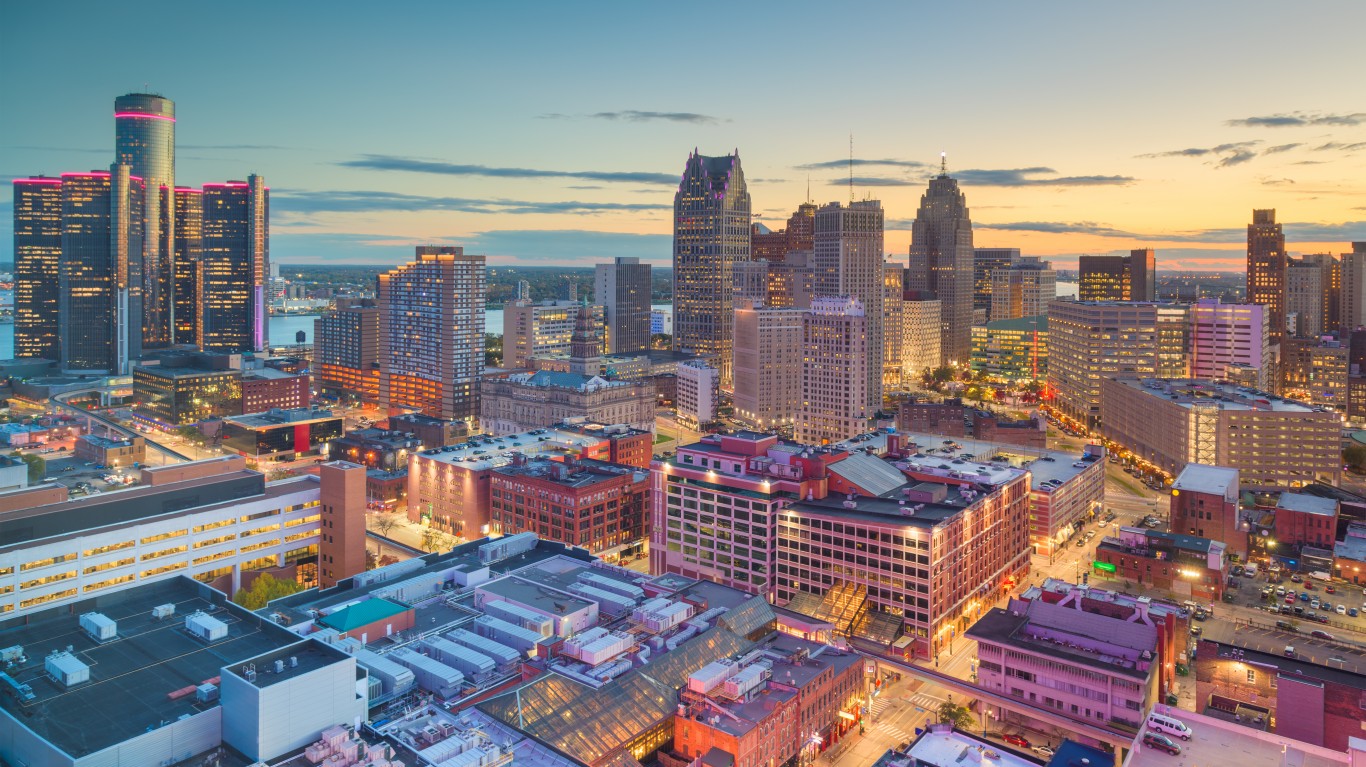
5. Michigan
> Poverty rate: 28.9% Black, 11.4% white
> Homeownership rate: 41.8% Black, 77.1% white
> Unemployment rate: 13.3% Black, 4.7% white
> Median household income: $35,322 Black, $61,400 white
Segregation can exacerbate inequality, and Michigan is home to many highly segregated Rust Belt cities, including Detroit, Flint, and Lansing. Indeed, the state as a whole is among the most segregated in the country, with 56.8% of Black residents living in majority Black communities. One effect of segregation in Michigan is reduced access to job opportunities in majority Black neighborhoods. Across the state, the Black unemployment rate stands at 13.3%, well above the 4.7% white jobless rate – the second largest unemployment gap among states.
High unemployment fuels further economic disparity in Michigan, particularly the likelihood of poverty. Nearly 29% of Michigan’s Black population live below the poverty line, compared to just over 11% of the state’s white residents.
[in-text-ad]
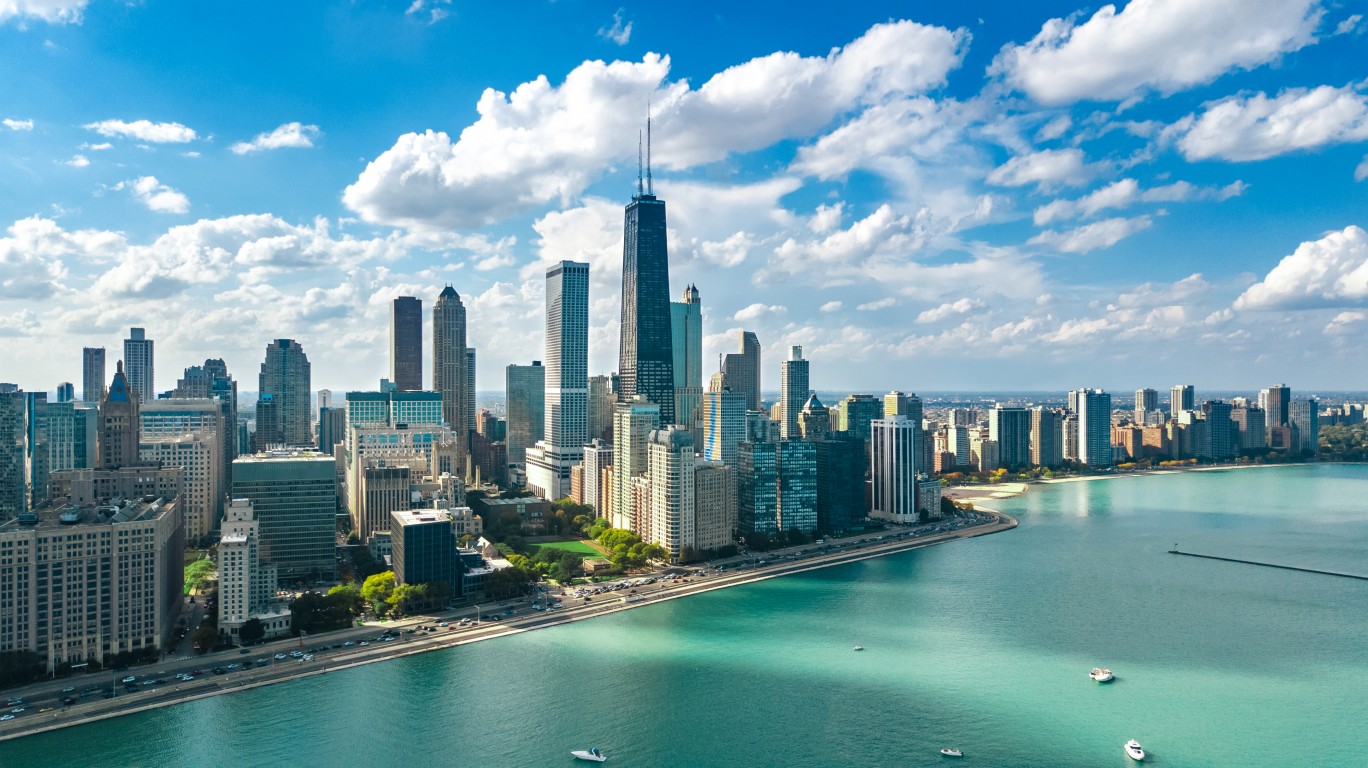
4. Illinois
> Poverty rate: 26.1% Black, 9.4% white
> Homeownership rate: 38.8% Black, 72.8% white
> Unemployment rate: 14.1% Black, 4.5% white
> Median household income: $38,573 Black, $71,922 white
Illinois is home to some of the most segregated cities in the country, including Chicago. Springfield, Rockford, Peoria, and Champaign-Urbana. Black communities in these cities are often underserved and have limited economic opportunity. Across Illinois, Black unemployment stands at 14.1%, more than three times the 4.5% white jobless rate – the largest unemployment gap in the country.
Due in part to the high Black unemployment, the state also has significant racial disparities in income and earnings. The typical Black household in the state earns just $38,573 a year, about $33,300 less than the median income of $71,922 among white households in the state. Black Illinois residents are also more than twice as likely as their white counterparts to live below the poverty line.
[recirclink id=1034361]
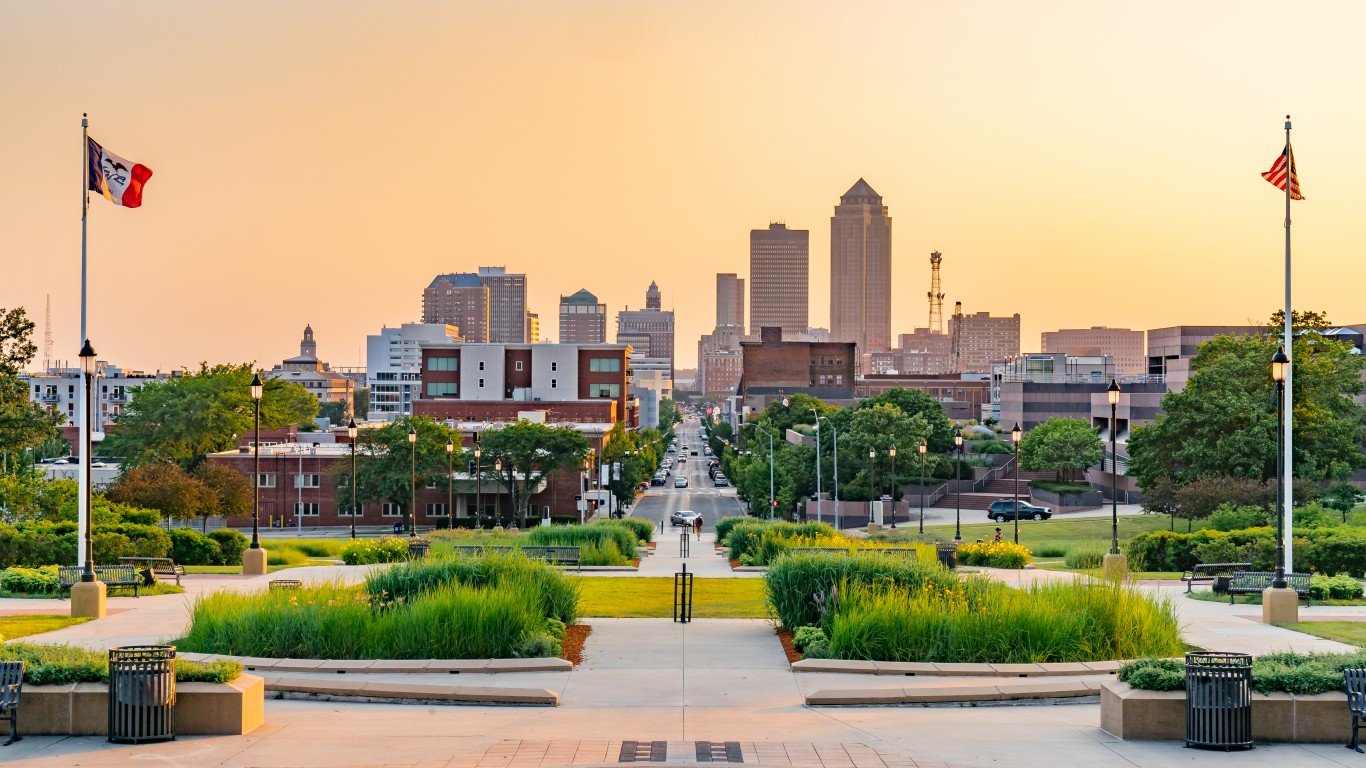
3. Iowa
> Poverty rate: 31.9% Black, 10.1% white
> Homeownership rate: 24.4% Black, 73.6% white
> Unemployment rate: 10.6% Black, 3.3% white
> Median household income: $32,139 Black, $62,097 white
In Iowa, Black residents are over nine times more likely to be incarcerated than white residents. Though only 3.6% of the state’s population are Black, over 25% of Iowans in a federal or state correctional facility are Black.
Such disparity contributes to inequality in other areas, including political and economic outcomes. For example, 11.4% of Black Iowans are disenfranchised due to a felony conviction compared to 1.5% of white Iowans. Incarceration and criminal records can also vastly reduce employment opportunities and earning potential. In Iowa, Black unemployment stands at 10.6% compared to the state’s 3.3% white unemployment rate. Additionally, the typical Black household in the state earns just $32,139 a year, well below the median income of $62,097 among white households in the state.
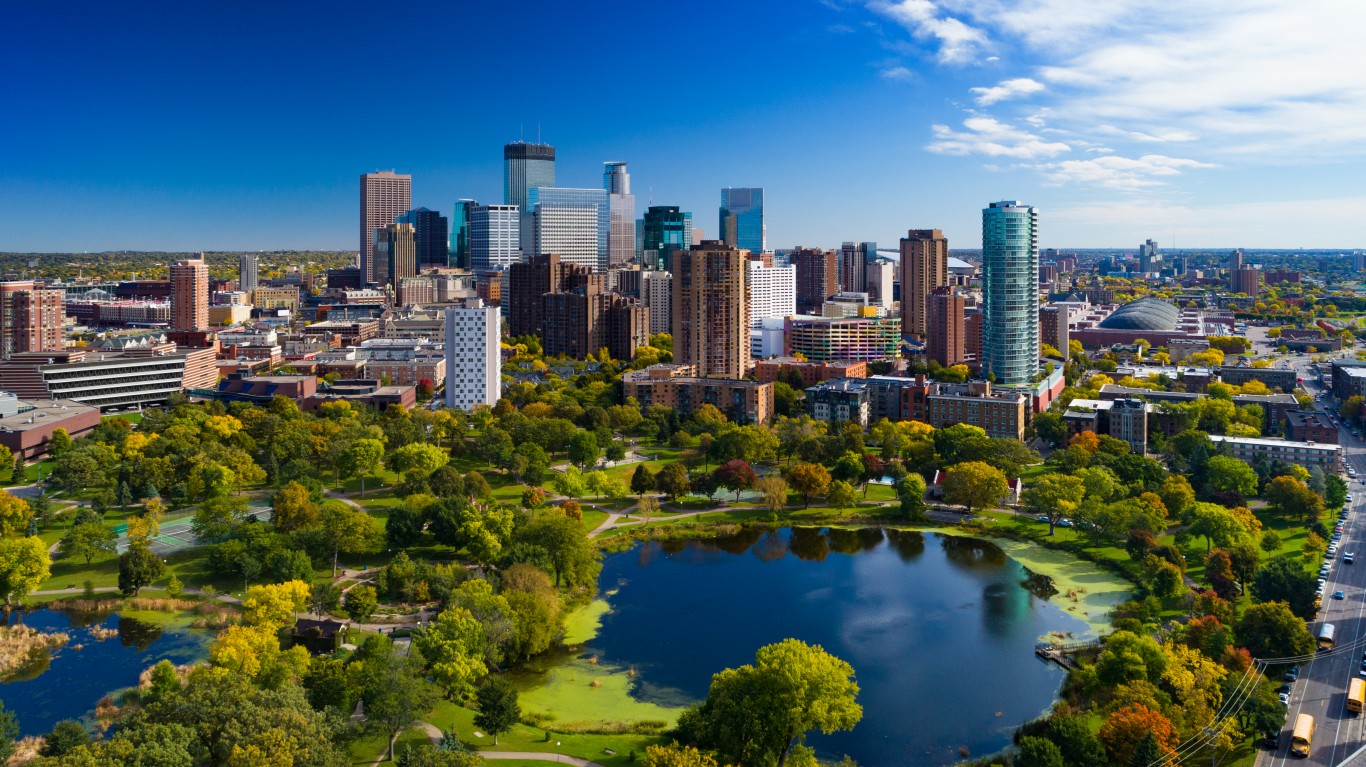
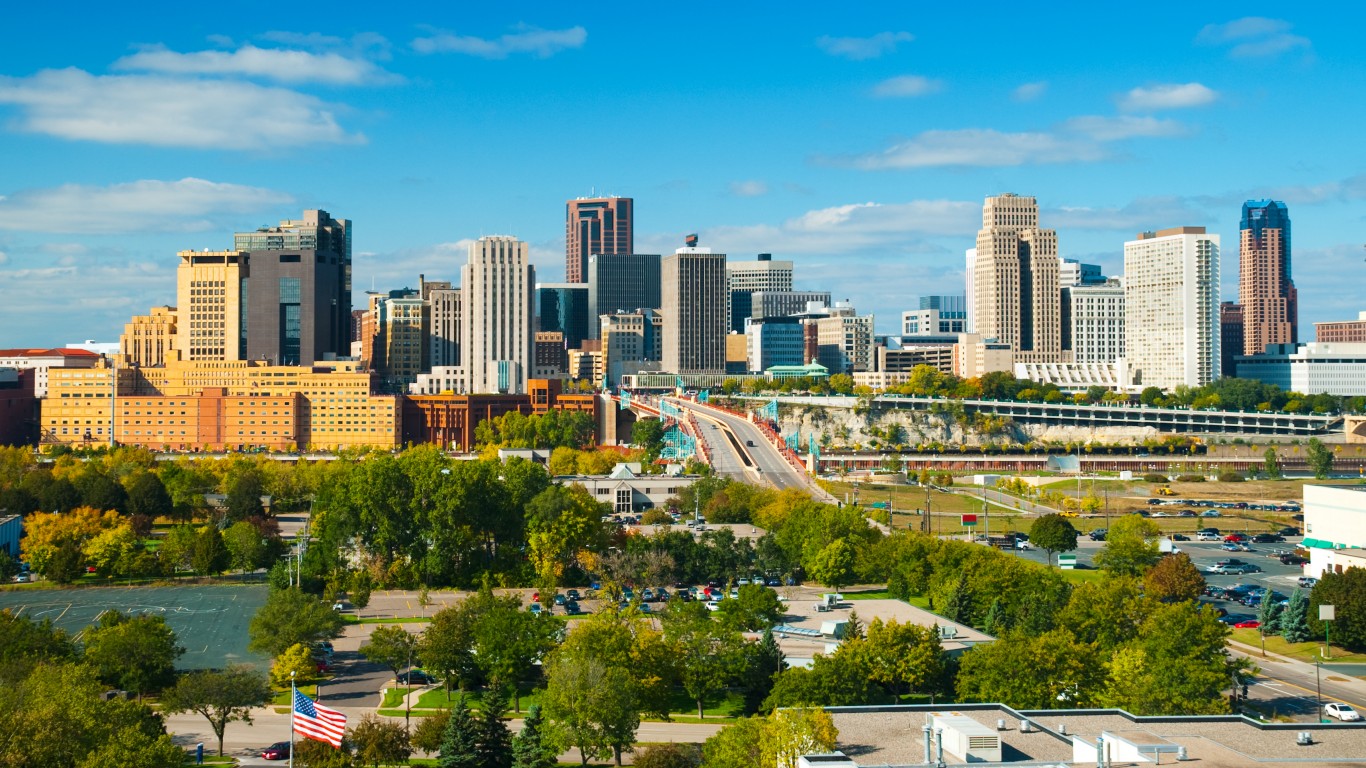
2. Minnesota
> Poverty rate: 28.6% Black, 7.3% white
> Homeownership rate: 24.3% Black, 76.0% white
> Unemployment rate: 8.8% Black, 3.0% white
> Median household income: $37,811 Black, $74,387 white
Racial gaps in several key socioeconomic outcomes makes Minnesota the second worst state in the country for Black Americans. Due to racial zoning and redlining, urban areas in Minnesota, particularly the Twin Cities, are among the most segregated places in the country. Housing segregation has given way to highly segregated public schools and vastly disparate education outcomes. Only 81% of Black adults in Minnesota have a high school diploma compared to over 95% of white adults. A high school education is a prerequisite for many employment opportunities, and the 8.8% Black unemployment rate across Minnesota is nearly three times the 3.0% white jobless rate.
Inequalities are not just economic, but also social – particularly with regard to law enforcement and the justice system. Black Minnesota residents are over 10 times more likely than white residents to be incarcerated in a state of federal correctional facility. Black residents make up over 36% of the state’s prison population and only 6.3% of the overall population.
[in-text-ad-2]
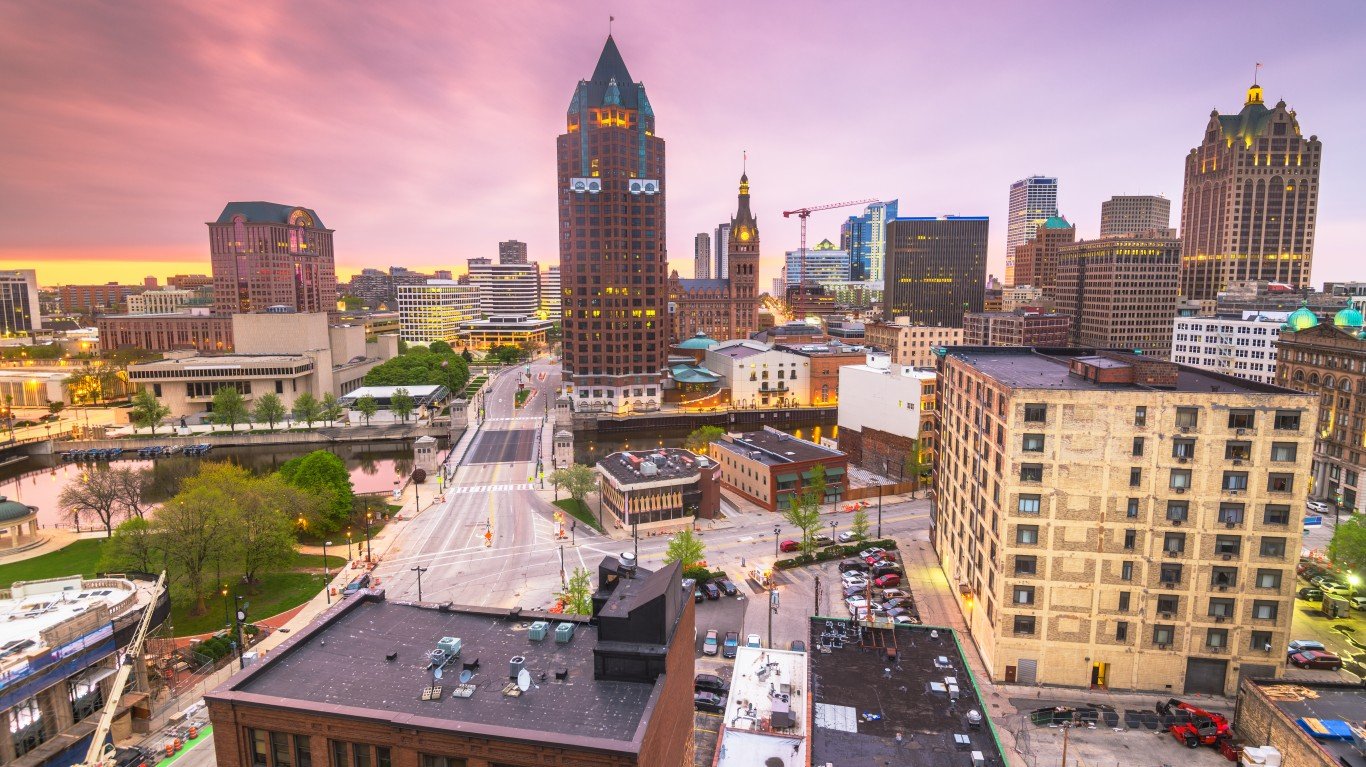
1. Wisconsin
> Poverty rate: 31.3% Black, 9.0% white
> Homeownership rate: 25.5% Black, 71.1% white
> Unemployment rate: 10.0% Black, 3.0% white
> Median household income: $31,351 Black, $64,377 white
Wisconsin ranks as the worst state in the country for Black Americans. Due in part to housing discrimination in cities like Madison and Milwaukee, Wisconsin is a highly segregated state, with over 50% of the Black population residing in majority Black neighborhoods. Segregation often fuels racial disparities, and many Black communities in Wisconsin are suffering. Black unemployment in the state stands at 10%, more than triple the 3.0% white jobless rate. Additionally, the typical Black household in the state earns just $31,351 a year, less than half the median income of $64,377 among white households in the state.
Inequalities are not just economic, but also social – particularly with regard to law enforcement and the justice system. Black Wisconsin residents are over 12 times more likely than white residents to be incarcerated in a state of federal correctional facility. Black residents make up over 42% of the state’s prison population and only 6.3% of the overall population.
Contact [email protected] for any questions or corrections.