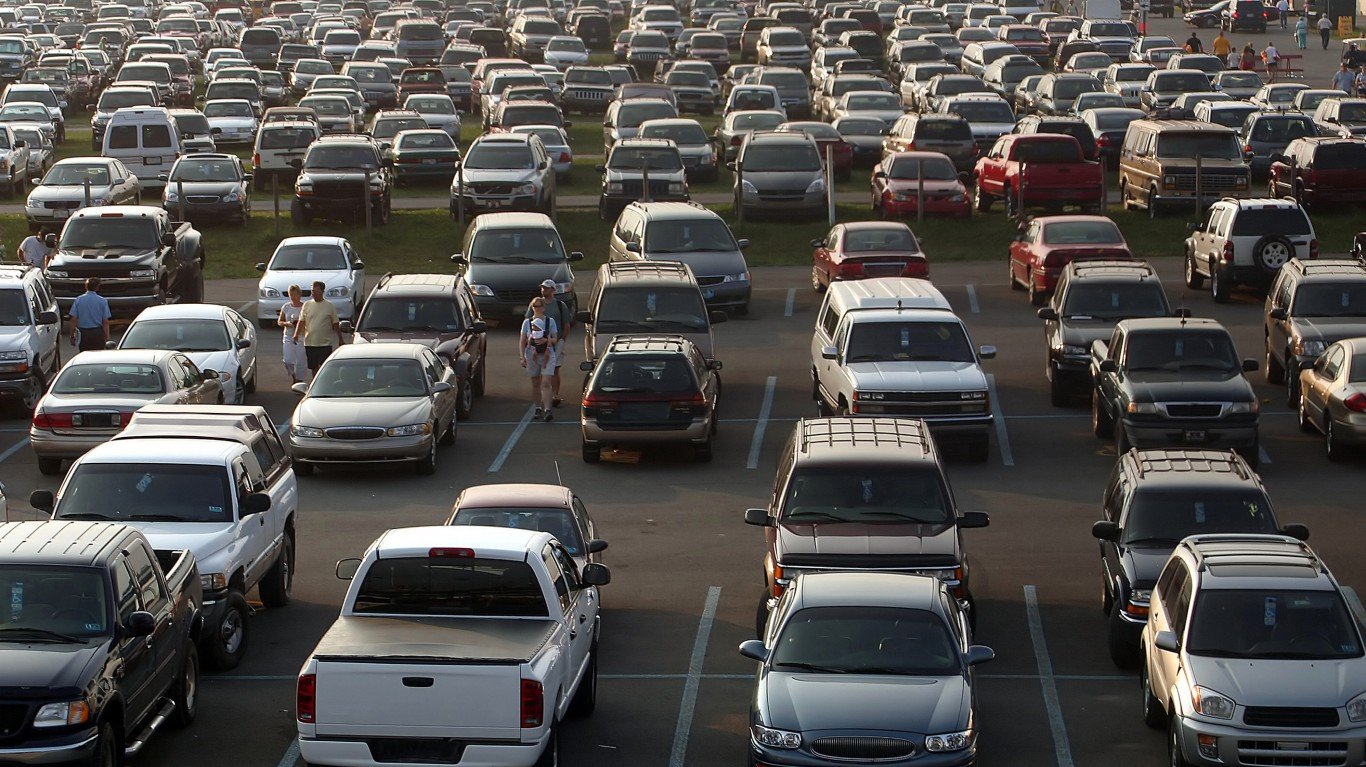
Motor vehicle theft, one of the most serious offenses tracked by the FBI, is on the rise in the United States. There were a total of 810,400 motor vehicle thefts nationwide in 2020, up 12% from the previous year and the most in over a decade.
Motor vehicle theft can be either the theft or attempted theft of a vehicle, such as a car or ATV. Some experts attribute the rising rates of vehicle theft to the COVID-19 pandemic, which led to vehicles sitting unattended and unused for longer stretches than usual. Here is a look at the 10 most stolen cars in America.
The country’s rising rates of motor vehicle theft are being led by surges in some U.S. cities.
Using data from the FBI’s 2020 Uniform Crime Report, 24/7 Wall St. identified the 50 cities where vehicle theft is rising fastest. Cities – defined as places with more than 25,000 people – are ranked by the year-over-year change in the number of reported vehicle thefts per 100,000 people in 2020. Among the cities on this list, the vehicle theft rate climbed anywhere from 205 incidents per 100,000 people to 491 per 100,000 people. Meanwhile, the national motor vehicle theft rate climbed by 25 incidents per 100,000 people in 2020.
Vehicle theft – along with larceny and burglary – is one component of the overall property crime category. Partially due to rising rates of vehicle theft, most of the cities on this list also reported an increase in the overall property crime rate in 2020. Here is a look at the cities where property crime is soaring.
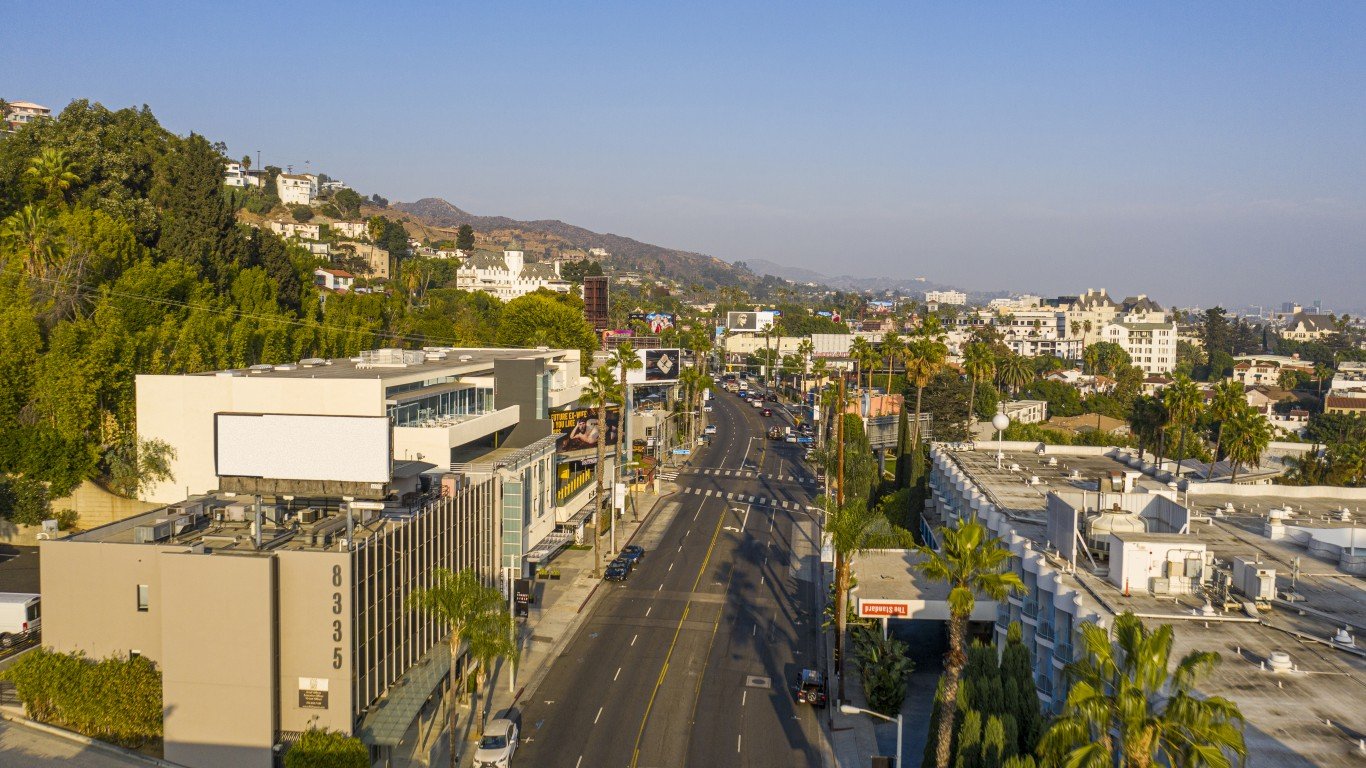
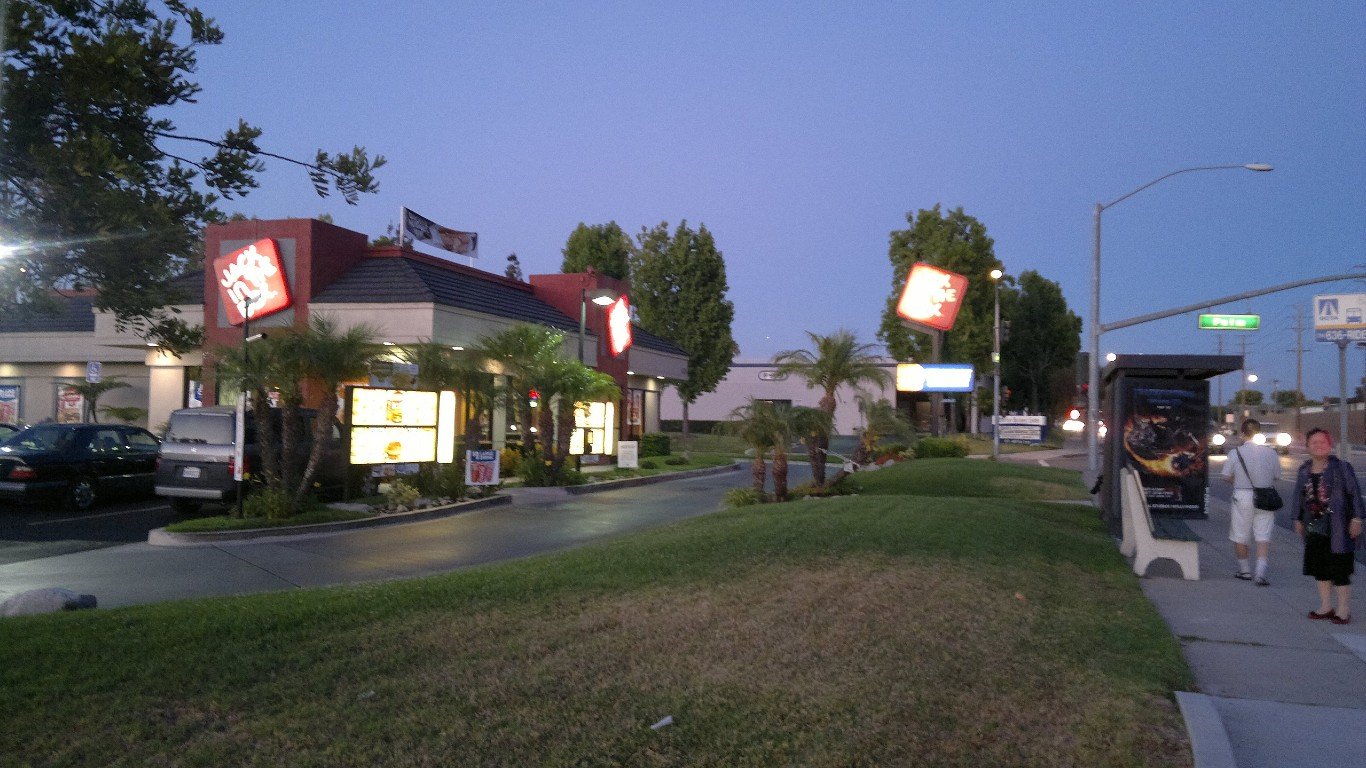
Most of the cities that reported the largest increases in vehicle thefts per capita are in the West, including 21 in California alone. Every city on this list has a higher motor vehicle theft rate than the national rate of 246 per 100,000 people.
Click here to see the cities where the motor vehicle theft rate is soaring
Click here to read our detailed methodology

50. Vancouver, Washington
> Change in reported vehicle theft rate, 2019-2020: +204.8
> Vehicle-thefts reported in 2020: 1,196 — 56th highest of 1,124 cities
> Vehicle-thefts per 100K people in 2020: 641.5 — 80th highest of 1,124 cities
> 1-yr. change in all property crime: +356.9 — 69th highest of 1,037 cities
> Property crimes per 100K people in 2020: 3,598.5 — 130th highest of 1,043 cities
> Population: 180,556
[in-text-ad]
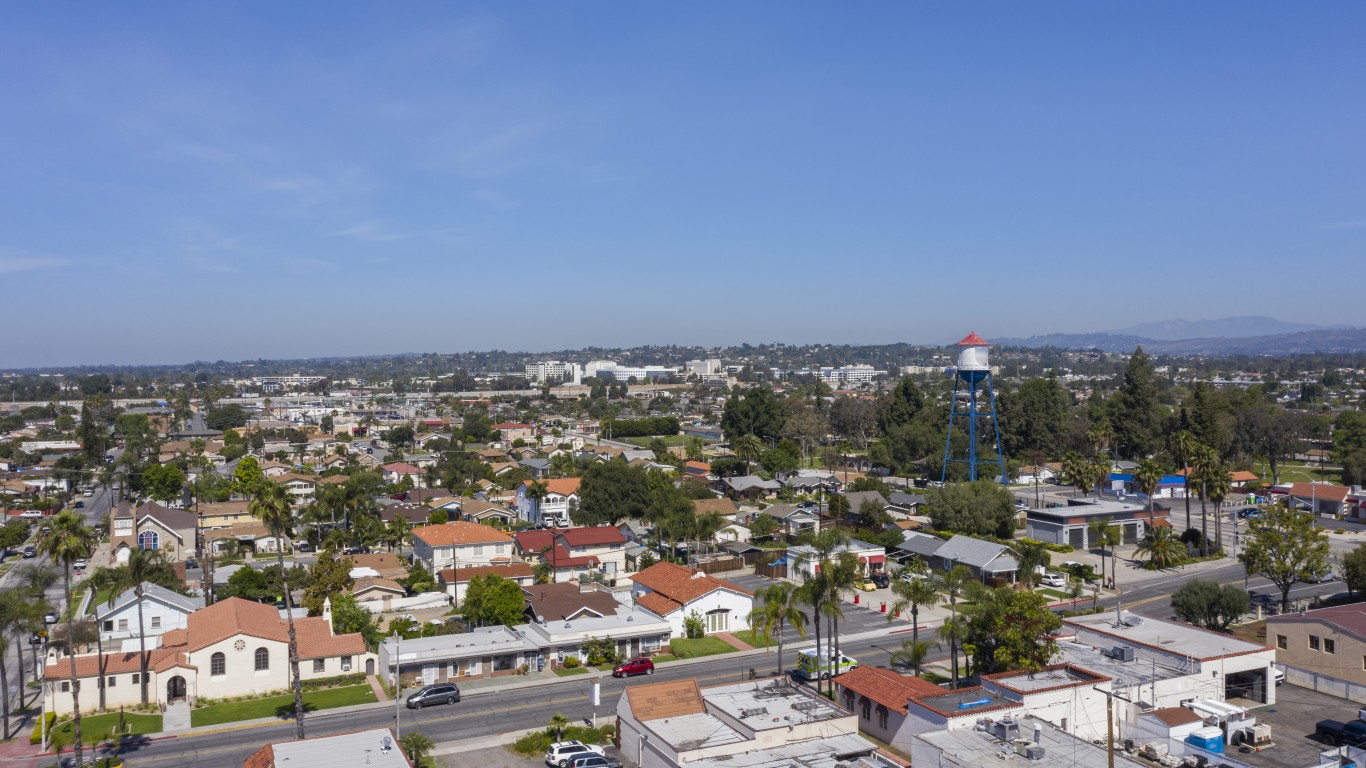
49. Paramount, California
> Change in reported vehicle theft rate, 2019-2020: +204.9
> Vehicle-thefts reported in 2020: 392 — 206th highest of 1,124 cities (tied)
> Vehicle-thefts per 100K people in 2020: 726.7 — 56th highest of 1,124 cities
> 1-yr. change in all property crime: +137.3 — 191st highest of 1,037 cities
> Property crimes per 100K people in 2020: 2,426.8 — 380th highest of 1,043 cities
> Population: 54,513
[recirclink id=1016086]

48. Grand Junction, Colorado
> Change in reported vehicle theft rate, 2019-2020: +205.0
> Vehicle-thefts reported in 2020: 283 — 269th highest of 1,124 cities (tied)
> Vehicle-thefts per 100K people in 2020: 441.2 — 191st highest of 1,124 cities
> 1-yr. change in all property crime: +772.1 — 19th highest of 1,037 cities
> Property crimes per 100K people in 2020: 4,623.6 — 50th highest of 1,043 cities
> Population: 62,062
47. Pueblo, Colorado
> Change in reported vehicle theft rate, 2019-2020: +208.1
> Vehicle-thefts reported in 2020: 938 — 79th highest of 1,124 cities
> Vehicle-thefts per 100K people in 2020: 830.1 — 36th highest of 1,124 cities
> 1-yr. change in all property crime: +358.8 — 67th highest of 1,037 cities
> Property crimes per 100K people in 2020: 4,630.9 — 48th highest of 1,043 cities
> Population: 110,841
[in-text-ad-2]

46. Kalamazoo, Michigan
> Change in reported vehicle theft rate, 2019-2020: +210.4
> Vehicle-thefts reported in 2020: 488 — 158th highest of 1,124 cities
> Vehicle-thefts per 100K people in 2020: 638.7 — 82nd highest of 1,124 cities
> 1-yr. change in all property crime: +145.8 — 183rd highest of 1,037 cities
> Property crimes per 100K people in 2020: 4,803.0 — 40th highest of 1,043 cities
> Population: 76,019

45. South Pasadena, California
> Change in reported vehicle theft rate, 2019-2020: +215.3
> Vehicle-thefts reported in 2020: 92 — 496th lowest of 1,124 cities (tied)
> Vehicle-thefts per 100K people in 2020: 363.7 — 268th highest of 1,124 cities
> 1-yr. change in all property crime: +284.3 — 94th highest of 1,037 cities
> Property crimes per 100K people in 2020: 2,494.2 — 364th highest of 1,043 cities
> Population: 25,661
[in-text-ad]

44. Tulsa, Oklahoma
> Change in reported vehicle theft rate, 2019-2020: +215.7
> Vehicle-thefts reported in 2020: 3,904 — 23rd highest of 1,124 cities
> Vehicle-thefts per 100K people in 2020: 970.7 — 19th highest of 1,124 cities
> 1-yr. change in all property crime: -199.9 — 440th lowest of 1,037 cities
> Property crimes per 100K people in 2020: 5,111.6 — 28th highest of 1,043 cities
> Population: 402,324
[recirclink id=1062431]

43. Kentwood, Michigan
> Change in reported vehicle theft rate, 2019-2020: +216.3
> Vehicle-thefts reported in 2020: 204 — 368th highest of 1,124 cities (tied)
> Vehicle-thefts per 100K people in 2020: 390.3 — 235th highest of 1,124 cities
> 1-yr. change in all property crime: +184.1 — 150th highest of 1,037 cities
> Property crimes per 100K people in 2020: 2,309.5 — 423rd highest of 1,043 cities
> Population: 51,693
42. Thornton, Colorado
> Change in reported vehicle theft rate, 2019-2020: +216.6
> Vehicle-thefts reported in 2020: 952 — 78th highest of 1,124 cities
> Vehicle-thefts per 100K people in 2020: 660.4 — 75th highest of 1,124 cities
> 1-yr. change in all property crime: +121.3 — 199th highest of 1,037 cities
> Property crimes per 100K people in 2020: 3,148.0 — 210th highest of 1,043 cities
> Population: 136,868
[in-text-ad-2]

41. Fridley, Minnesota
> Change in reported vehicle theft rate, 2019-2020: +221.4
> Vehicle-thefts reported in 2020: 139 — 484th highest of 1,124 cities (tied)
> Vehicle-thefts per 100K people in 2020: 498.4 — 151st highest of 1,124 cities
> 1-yr. change in all property crime: +863.2 — 9th highest of 1,037 cities
> Property crimes per 100K people in 2020: 4,589.1 — 52nd highest of 1,043 cities
> Population: 27,668

40. Inglewood, California
> Change in reported vehicle theft rate, 2019-2020: +222.6
> Vehicle-thefts reported in 2020: 889 — 86th highest of 1,124 cities
> Vehicle-thefts per 100K people in 2020: 823.3 — 39th highest of 1,124 cities
> 1-yr. change in all property crime: +188.6 — 145th highest of 1,037 cities
> Property crimes per 100K people in 2020: 2,310.5 — 422nd highest of 1,043 cities
> Population: 109,613
[in-text-ad]

39. SeaTac, Washington
> Change in reported vehicle theft rate, 2019-2020: +223.8
> Vehicle-thefts reported in 2020: 362 — 218th highest of 1,124 cities
> Vehicle-thefts per 100K people in 2020: 1,236.3 — 4th highest of 1,124 cities
> 1-yr. change in all property crime: +1,042.7 — 5th highest of 1,037 cities
> Property crimes per 100K people in 2020: 4,760.6 — 44th highest of 1,043 cities
> Population: 29,019
[recirclink id=1066891]

38. Newark, California
> Change in reported vehicle theft rate, 2019-2020: +227.4
> Vehicle-thefts reported in 2020: 238 — 325th highest of 1,124 cities (tied)
> Vehicle-thefts per 100K people in 2020: 476.6 — 167th highest of 1,124 cities
> 1-yr. change in all property crime: +31.5 — 308th highest of 1,037 cities
> Property crimes per 100K people in 2020: 2,889.8 — 262nd highest of 1,043 cities
> Population: 47,171

37. Grandview, Missouri
> Change in reported vehicle theft rate, 2019-2020: +228.0
> Vehicle-thefts reported in 2020: 211 — 358th highest of 1,124 cities (tied)
> Vehicle-thefts per 100K people in 2020: 847.5 — 34th highest of 1,124 cities
> 1-yr. change in all property crime: +296.4 — 91st highest of 1,037 cities
> Property crimes per 100K people in 2020: 4,169.0 — 77th highest of 1,043 cities
> Population: 25,069
[in-text-ad-2]

36. Spartanburg, South Carolina
> Change in reported vehicle theft rate, 2019-2020: +233.0
> Vehicle-thefts reported in 2020: 257 — 298th highest of 1,124 cities
> Vehicle-thefts per 100K people in 2020: 685.9 — 68th highest of 1,124 cities
> 1-yr. change in all property crime: -388.3 — 253rd lowest of 1,037 cities
> Property crimes per 100K people in 2020: 6,101.0 — 11th highest of 1,043 cities
> Population: 37,424
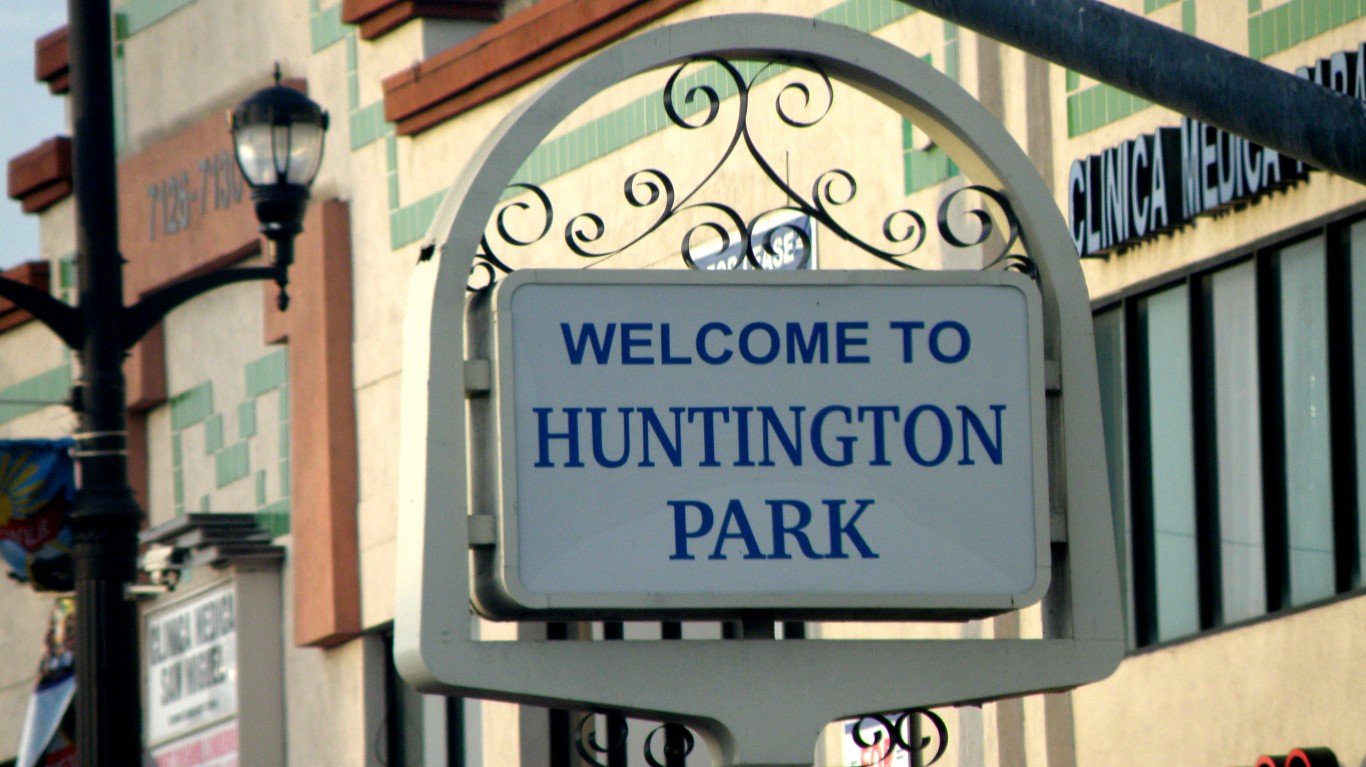
35. Huntington Park, California
> Change in reported vehicle theft rate, 2019-2020: +234.3
> Vehicle-thefts reported in 2020: 648 — 116th highest of 1,124 cities (tied)
> Vehicle-thefts per 100K people in 2020: 1,128.1 — 10th highest of 1,124 cities
> 1-yr. change in all property crime: +252.9 — 108th highest of 1,037 cities
> Property crimes per 100K people in 2020: 2,994.3 — 240th highest of 1,043 cities
> Population: 58,353
[in-text-ad]
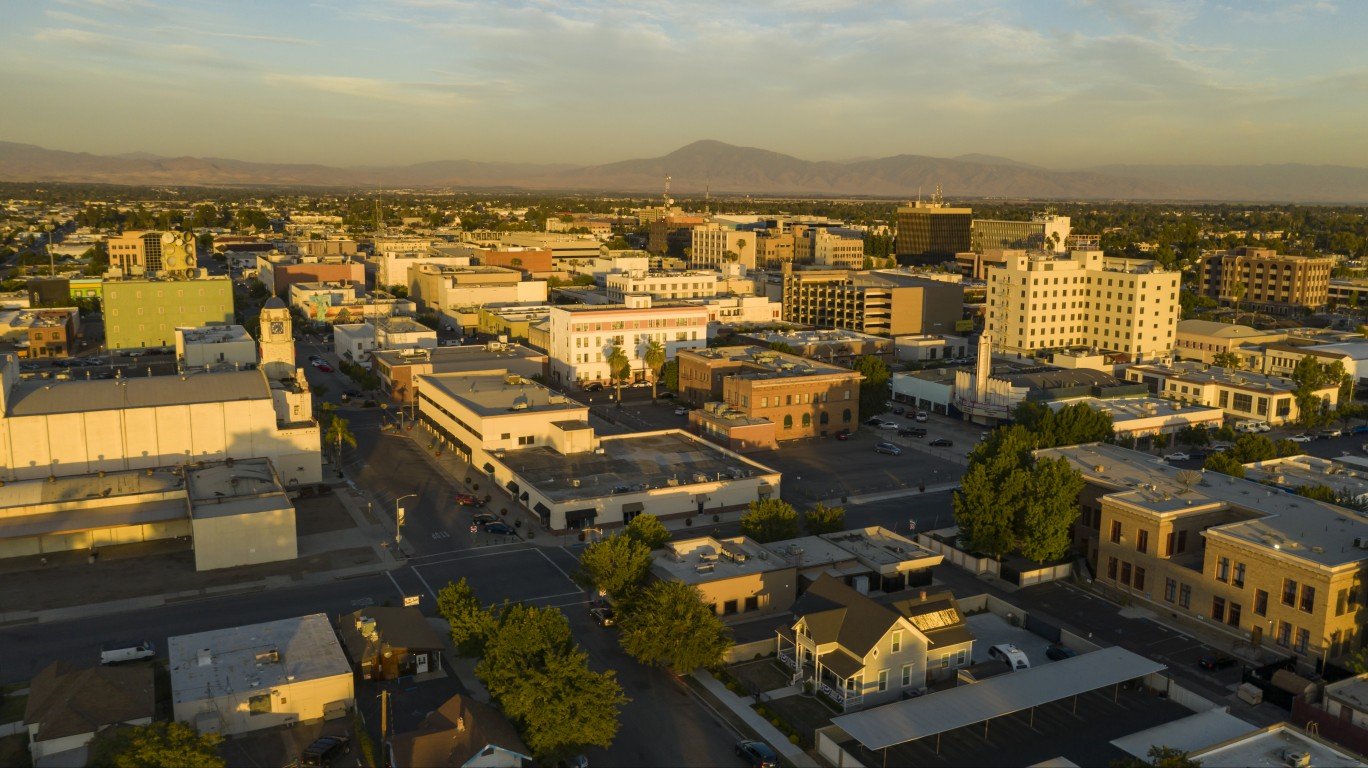
34. Bakersfield, California
> Change in reported vehicle theft rate, 2019-2020: +236.6
> Vehicle-thefts reported in 2020: 3,829 — 24th highest of 1,124 cities
> Vehicle-thefts per 100K people in 2020: 986.2 — 15th highest of 1,124 cities
> 1-yr. change in all property crime: -119.2 — 493rd highest of 1,037 cities
> Property crimes per 100K people in 2020: 4,022.8 — 92nd highest of 1,043 cities
> Population: 377,917
[recirclink id=1033410]

33. Minneapolis, Minnesota
> Change in reported vehicle theft rate, 2019-2020: +238.4
> Vehicle-thefts reported in 2020: 3,965 — 21st highest of 1,124 cities
> Vehicle-thefts per 100K people in 2020: 911.3 — 26th highest of 1,124 cities
> 1-yr. change in all property crime: +41.1 — 289th highest of 1,037 cities
> Property crimes per 100K people in 2020: 4,558.1 — 53rd highest of 1,043 cities
> Population: 420,324
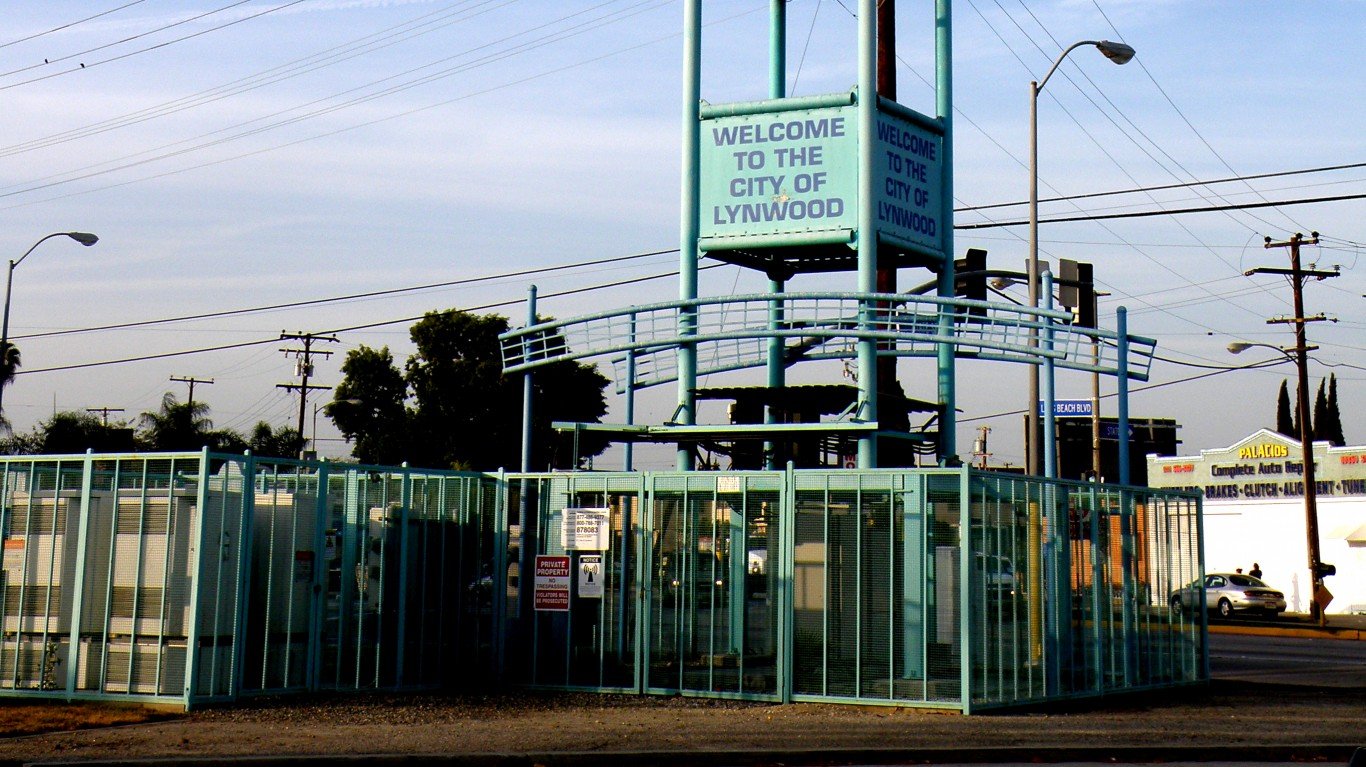
32. Lynwood, California
> Change in reported vehicle theft rate, 2019-2020: +238.9
> Vehicle-thefts reported in 2020: 669 — 114th highest of 1,124 cities
> Vehicle-thefts per 100K people in 2020: 956.8 — 21st highest of 1,124 cities
> 1-yr. change in all property crime: +151.6 — 179th highest of 1,037 cities
> Property crimes per 100K people in 2020: 2,161.0 — 479th highest of 1,043 cities
> Population: 70,635
[in-text-ad-2]

31. Lakewood, Washington
> Change in reported vehicle theft rate, 2019-2020: +240.0
> Vehicle-thefts reported in 2020: 454 — 172nd highest of 1,124 cities
> Vehicle-thefts per 100K people in 2020: 739.0 — 54th highest of 1,124 cities
> 1-yr. change in all property crime: +495.8 — 36th highest of 1,037 cities
> Property crimes per 100K people in 2020: 4,264.9 — 68th highest of 1,043 cities
> Population: 60,111

30. Richmond, California
> Change in reported vehicle theft rate, 2019-2020: +240.4
> Vehicle-thefts reported in 2020: 1,511 — 50th highest of 1,124 cities
> Vehicle-thefts per 100K people in 2020: 1,356.8 — 3rd highest of 1,124 cities
> 1-yr. change in all property crime: -469.9 — 191st lowest of 1,037 cities
> Property crimes per 100K people in 2020: 3,303.5 — 177th highest of 1,043 cities
> Population: 109,884
[in-text-ad]

29. Tacoma, Washington
> Change in reported vehicle theft rate, 2019-2020: +241.7
> Vehicle-thefts reported in 2020: 2,169 — 40th highest of 1,124 cities
> Vehicle-thefts per 100K people in 2020: 985.4 — 16th highest of 1,124 cities
> 1-yr. change in all property crime: +286.7 — 93rd highest of 1,037 cities
> Property crimes per 100K people in 2020: 5,507.4 — 20th highest of 1,043 cities
> Population: 212,869
[recirclink id=1026293]

28. Brighton, Colorado
> Change in reported vehicle theft rate, 2019-2020: +242.0
> Vehicle-thefts reported in 2020: 271 — 281st highest of 1,124 cities (tied)
> Vehicle-thefts per 100K people in 2020: 637.1 — 84th highest of 1,124 cities
> 1-yr. change in all property crime: +427.6 — 52nd highest of 1,037 cities
> Property crimes per 100K people in 2020: 3,075.0 — 224th highest of 1,043 cities
> Population: 39,836

27. Des Moines, Washington
> Change in reported vehicle theft rate, 2019-2020: +242.9
> Vehicle-thefts reported in 2020: 256 — 299th highest of 1,124 cities (tied)
> Vehicle-thefts per 100K people in 2020: 784.0 — 45th highest of 1,124 cities
> 1-yr. change in all property crime: +449.4 — 46th highest of 1,037 cities
> Property crimes per 100K people in 2020: 3,528.1 — 141st highest of 1,043 cities
> Population: 31,734
[in-text-ad-2]
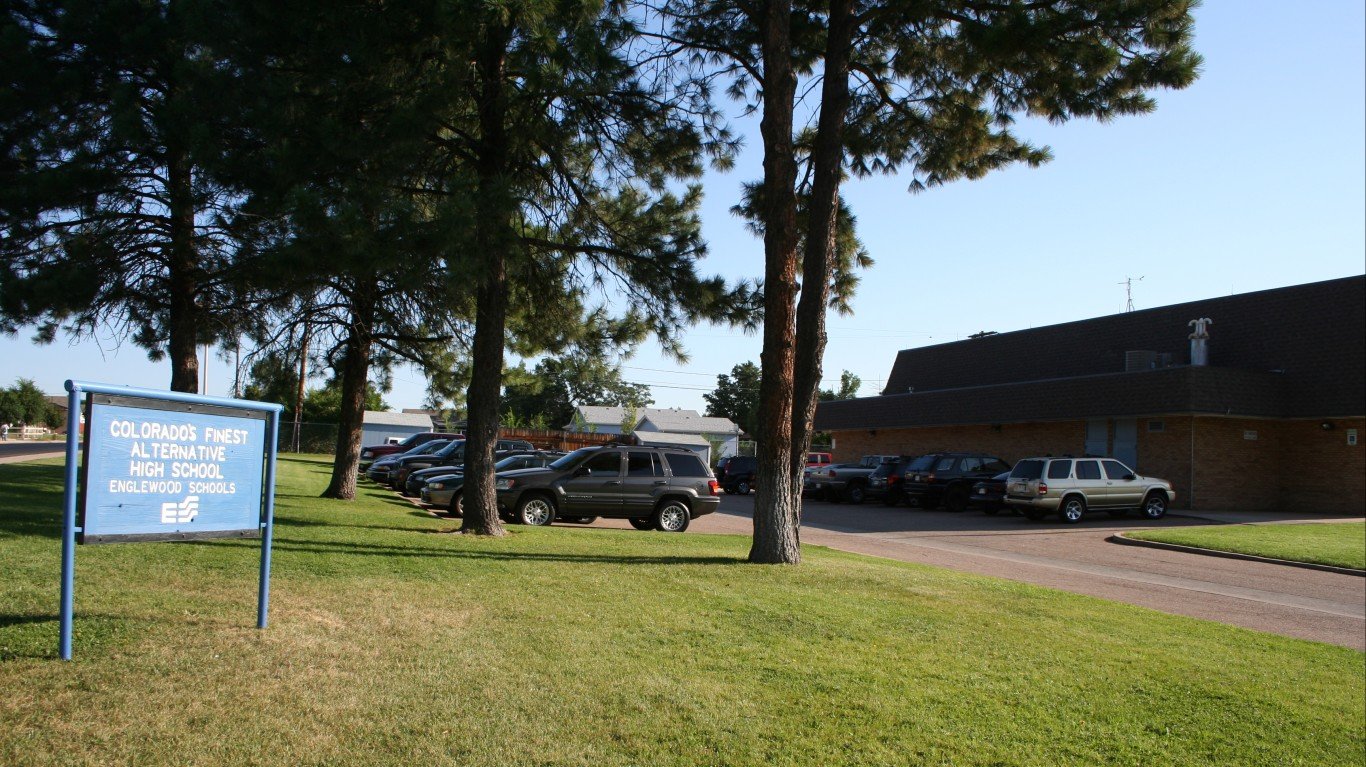
26. Englewood, Colorado
> Change in reported vehicle theft rate, 2019-2020: +249.2
> Vehicle-thefts reported in 2020: 393 — 205th highest of 1,124 cities
> Vehicle-thefts per 100K people in 2020: 1,108.2 — 11th highest of 1,124 cities
> 1-yr. change in all property crime: +442.8 — 47th highest of 1,037 cities
> Property crimes per 100K people in 2020: 5,667.7 — 17th highest of 1,043 cities
> Population: 34,259
25. Placentia, California
> Change in reported vehicle theft rate, 2019-2020: +249.7
> Vehicle-thefts reported in 2020: 230 — 337th highest of 1,124 cities (tied)
> Vehicle-thefts per 100K people in 2020: 448.7 — 185th highest of 1,124 cities
> 1-yr. change in all property crime: +361.9 — 66th highest of 1,037 cities
> Property crimes per 100K people in 2020: 2,079.6 — 510th highest of 1,043 cities
> Population: 51,818
[in-text-ad]

24. Lawndale, California
> Change in reported vehicle theft rate, 2019-2020: +254.2
> Vehicle-thefts reported in 2020: 181 — 404th highest of 1,124 cities (tied)
> Vehicle-thefts per 100K people in 2020: 559.6 — 122nd highest of 1,124 cities
> 1-yr. change in all property crime: +241.4 — 117th highest of 1,037 cities
> Property crimes per 100K people in 2020: 1,496.3 — 300th lowest of 1,043 cities
> Population: 32,819
[recirclink id=1016086]

23. Berkeley, California
> Change in reported vehicle theft rate, 2019-2020: +257.3
> Vehicle-thefts reported in 2020: 805 — 93rd highest of 1,124 cities
> Vehicle-thefts per 100K people in 2020: 658.0 — 76th highest of 1,124 cities
> 1-yr. change in all property crime: -570.9 — 130th lowest of 1,037 cities
> Property crimes per 100K people in 2020: 4,524.1 — 57th highest of 1,043 cities
> Population: 121,485
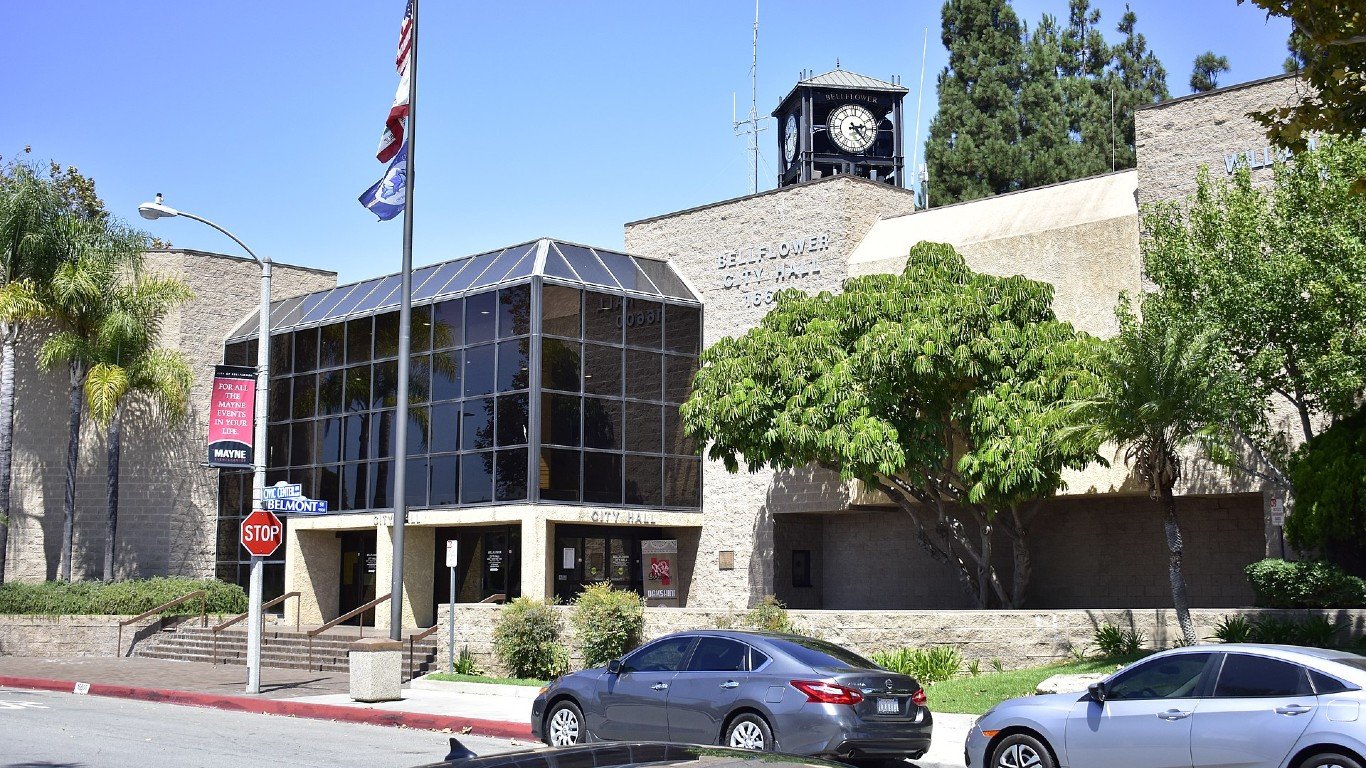
22. Bellflower, California
> Change in reported vehicle theft rate, 2019-2020: +263.3
> Vehicle-thefts reported in 2020: 518 — 148th highest of 1,124 cities (tied)
> Vehicle-thefts per 100K people in 2020: 677.9 — 70th highest of 1,124 cities
> 1-yr. change in all property crime: +403.4 — 55th highest of 1,037 cities
> Property crimes per 100K people in 2020: 2,354.2 — 402nd highest of 1,043 cities
> Population: 77,195
[in-text-ad-2]
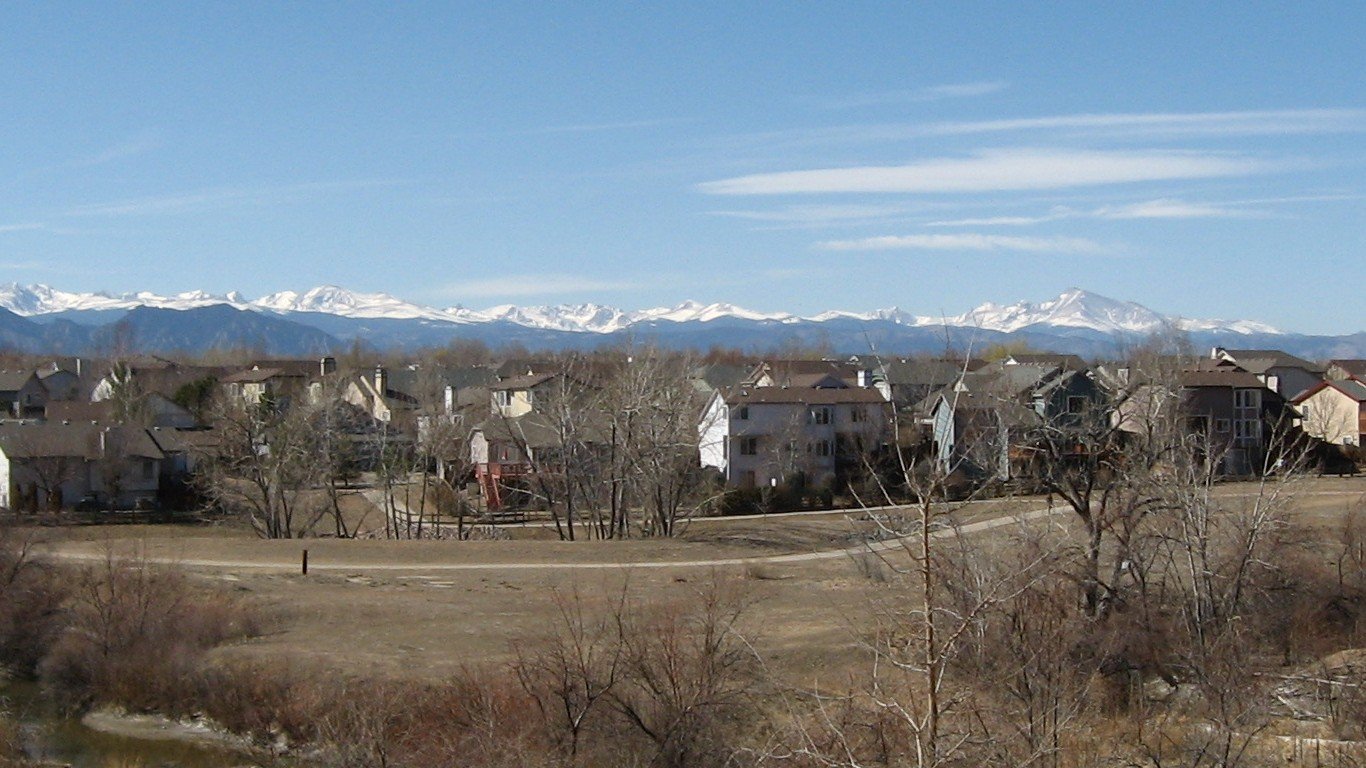
21. Westminster, Colorado
> Change in reported vehicle theft rate, 2019-2020: +264.6
> Vehicle-thefts reported in 2020: 933 — 80th highest of 1,124 cities
> Vehicle-thefts per 100K people in 2020: 818.8 — 40th highest of 1,124 cities
> 1-yr. change in all property crime: +293.7 — 92nd highest of 1,037 cities
> Property crimes per 100K people in 2020: 3,539.6 — 137th highest of 1,043 cities
> Population: 112,962

20. Gilroy, California
> Change in reported vehicle theft rate, 2019-2020: +270.9
> Vehicle-thefts reported in 2020: 423 — 190th highest of 1,124 cities
> Vehicle-thefts per 100K people in 2020: 701.9 — 63rd highest of 1,124 cities
> 1-yr. change in all property crime: +39.8 — 292nd highest of 1,037 cities
> Property crimes per 100K people in 2020: 2,500.5 — 363rd highest of 1,043 cities
> Population: 56,766
[in-text-ad]

19. Bellingham, Washington
> Change in reported vehicle theft rate, 2019-2020: +276.5
> Vehicle-thefts reported in 2020: 376 — 213th highest of 1,124 cities
> Vehicle-thefts per 100K people in 2020: 401.6 — 225th highest of 1,124 cities
> 1-yr. change in all property crime: +1,673.2 — 3rd highest of 1,037 cities
> Property crimes per 100K people in 2020: 4,599.0 — 51st highest of 1,043 cities
> Population: 88,764
[recirclink id=1062431]
18. Gardena, California
> Change in reported vehicle theft rate, 2019-2020: +276.7
> Vehicle-thefts reported in 2020: 470 — 162nd highest of 1,124 cities (tied)
> Vehicle-thefts per 100K people in 2020: 791.4 — 43rd highest of 1,124 cities
> 1-yr. change in all property crime: +220.6 — 126th highest of 1,037 cities
> Property crimes per 100K people in 2020: 2,229.5 — 463rd highest of 1,043 cities
> Population: 59,709
17. East Palo Alto, California
> Change in reported vehicle theft rate, 2019-2020: +284.9
> Vehicle-thefts reported in 2020: 189 — 393rd highest of 1,124 cities (tied)
> Vehicle-thefts per 100K people in 2020: 642.0 — 79th highest of 1,124 cities
> 1-yr. change in all property crime: +477.0 — 41st highest of 1,037 cities
> Property crimes per 100K people in 2020: 2,272.5 — 435th highest of 1,043 cities
> Population: 29,593
[in-text-ad-2]
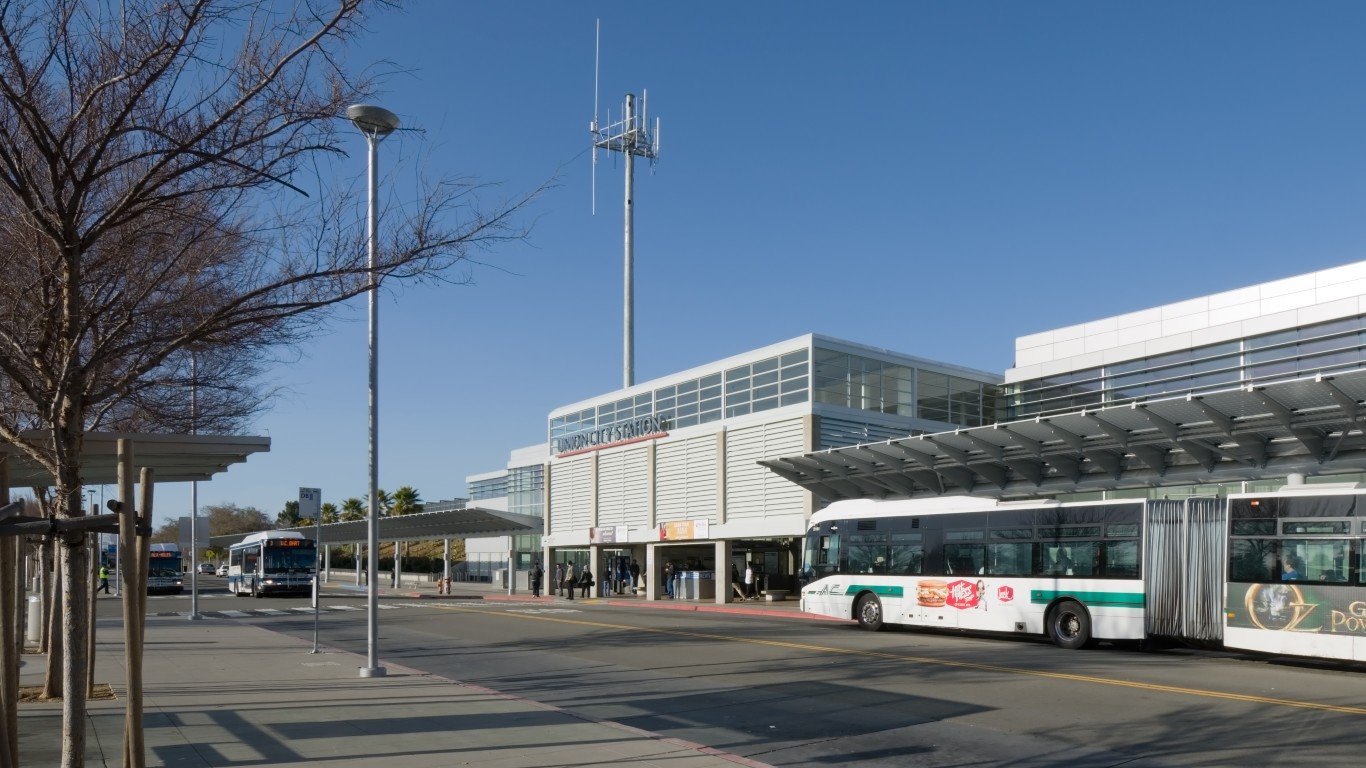
16. Union City, California
> Change in reported vehicle theft rate, 2019-2020: +294.5
> Vehicle-thefts reported in 2020: 444 — 175th highest of 1,124 cities
> Vehicle-thefts per 100K people in 2020: 595.0 — 102nd highest of 1,124 cities
> 1-yr. change in all property crime: +257.5 — 107th highest of 1,037 cities
> Property crimes per 100K people in 2020: 2,542.0 — 353rd highest of 1,043 cities
> Population: 74,722
15. Commerce City, Colorado
> Change in reported vehicle theft rate, 2019-2020: +297.2
> Vehicle-thefts reported in 2020: 572 — 133rd highest of 1,124 cities
> Vehicle-thefts per 100K people in 2020: 920.1 — 24th highest of 1,124 cities
> 1-yr. change in all property crime: +234.5 — 123rd highest of 1,037 cities
> Property crimes per 100K people in 2020: 3,299.3 — 179th highest of 1,043 cities
> Population: 56,448
[in-text-ad]

14. San Leandro, California
> Change in reported vehicle theft rate, 2019-2020: +307.3
> Vehicle-thefts reported in 2020: 1,054 — 71st highest of 1,124 cities
> Vehicle-thefts per 100K people in 2020: 1,181.1 — 6th highest of 1,124 cities
> 1-yr. change in all property crime: -718.2 — 79th lowest of 1,037 cities
> Property crimes per 100K people in 2020: 3,827.9 — 104th highest of 1,043 cities
> Population: 90,025
[recirclink id=1066891]
13. Calumet City, Illinois
> Change in reported vehicle theft rate, 2019-2020: +321.3
> Vehicle-thefts reported in 2020: 315 — 249th highest of 1,124 cities
> Vehicle-thefts per 100K people in 2020: 880.4 — 30th highest of 1,124 cities
> 1-yr. change in all property crime: N/A
> Property crimes per 100K people in 2020: N/A
> Population: 36,551
12. Lansing, Illinois
> Change in reported vehicle theft rate, 2019-2020: +355.5
> Vehicle-thefts reported in 2020: 202 — 372nd highest of 1,124 cities (tied)
> Vehicle-thefts per 100K people in 2020: 740.0 — 53rd highest of 1,124 cities
> 1-yr. change in all property crime: N/A
> Property crimes per 100K people in 2020: N/A
> Population: 27,904
[in-text-ad-2]

11. Oakland, California
> Change in reported vehicle theft rate, 2019-2020: +371.3
> Vehicle-thefts reported in 2020: 6,712 — 10th highest of 1,124 cities
> Vehicle-thefts per 100K people in 2020: 1,532.7 — 2nd highest of 1,124 cities
> 1-yr. change in all property crime: -1,254.9 — 17th lowest of 1,037 cities
> Property crimes per 100K people in 2020: 5,165.7 — 23rd highest of 1,043 cities
> Population: 425,097

10. Murray, Utah
> Change in reported vehicle theft rate, 2019-2020: +382.1
> Vehicle-thefts reported in 2020: 589 — 130th highest of 1,124 cities
> Vehicle-thefts per 100K people in 2020: 1,197.9 — 5th highest of 1,124 cities
> 1-yr. change in all property crime: +830.9 — 10th highest of 1,037 cities
> Property crimes per 100K people in 2020: 6,652.6 — 5th highest of 1,043 cities
> Population: 49,105
[in-text-ad]

9. Maywood, California
> Change in reported vehicle theft rate, 2019-2020: +390.7
> Vehicle-thefts reported in 2020: 197 — 379th highest of 1,124 cities (tied)
> Vehicle-thefts per 100K people in 2020: 731.6 — 55th highest of 1,124 cities
> 1-yr. change in all property crime: +619.7 — 27th highest of 1,037 cities
> Property crimes per 100K people in 2020: 1,704.5 — 392nd lowest of 1,043 cities
> Population: 27,332
[recirclink id=1033410]
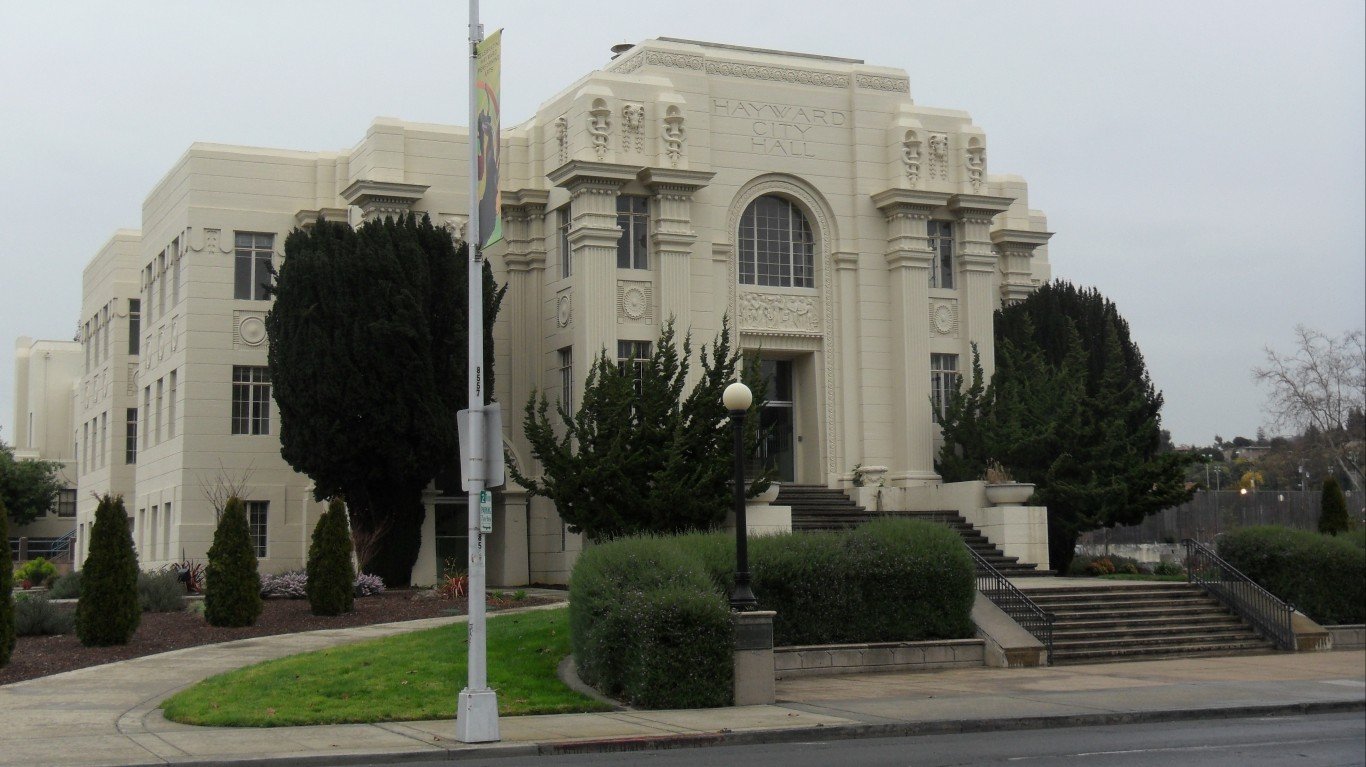
8. Hayward, California
> Change in reported vehicle theft rate, 2019-2020: +399.2
> Vehicle-thefts reported in 2020: 1,878 — 43rd highest of 1,124 cities (tied)
> Vehicle-thefts per 100K people in 2020: 1,167.2 — 7th highest of 1,124 cities
> 1-yr. change in all property crime: +301.5 — 86th highest of 1,037 cities
> Property crimes per 100K people in 2020: 3,325.2 — 172nd highest of 1,043 cities
> Population: 159,293

7. Denver, Colorado
> Change in reported vehicle theft rate, 2019-2020: +413.6
> Vehicle-thefts reported in 2020: 8,409 — 6th highest of 1,124 cities
> Vehicle-thefts per 100K people in 2020: 1,139.9 — 9th highest of 1,124 cities
> 1-yr. change in all property crime: +905.2 — 7th highest of 1,037 cities
> Property crimes per 100K people in 2020: 4,648.7 — 47th highest of 1,043 cities
> Population: 705,576
[in-text-ad-2]

6. Aurora, Colorado
> Change in reported vehicle theft rate, 2019-2020: +415.9
> Vehicle-thefts reported in 2020: 3,929 — 22nd highest of 1,124 cities
> Vehicle-thefts per 100K people in 2020: 1,018.6 — 14th highest of 1,124 cities
> 1-yr. change in all property crime: +472.8 — 43rd highest of 1,037 cities
> Property crimes per 100K people in 2020: 3,390.8 — 164th highest of 1,043 cities
> Population: 369,111

5. Chattanooga, Tennessee
> Change in reported vehicle theft rate, 2019-2020: +418.0
> Vehicle-thefts reported in 2020: 2,101 — 41st highest of 1,124 cities
> Vehicle-thefts per 100K people in 2020: 1,140.5 — 8th highest of 1,124 cities
> 1-yr. change in all property crime: +798.9 — 12th highest of 1,037 cities
> Property crimes per 100K people in 2020: 6,356.3 — 8th highest of 1,043 cities
> Population: 179,690
[in-text-ad]

4. South Salt Lake, Utah
> Change in reported vehicle theft rate, 2019-2020: +422.3
> Vehicle-thefts reported in 2020: 462 — 168th highest of 1,124 cities
> Vehicle-thefts per 100K people in 2020: 1,789.6 — the highest of 1,124 cities
> 1-yr. change in all property crime: +1,918.2 — the highest of 1,037 cities
> Property crimes per 100K people in 2020: 9,203.6 — the highest of 1,043 cities
> Population: 25,017
[recirclink id=1026293]

3. Woodburn, Oregon
> Change in reported vehicle theft rate, 2019-2020: +445.0
> Vehicle-thefts reported in 2020: 260 — 294th highest of 1,124 cities (tied)
> Vehicle-thefts per 100K people in 2020: 980.4 — 18th highest of 1,124 cities
> 1-yr. change in all property crime: -197.5 — 445th lowest of 1,037 cities
> Property crimes per 100K people in 2020: 3,288.0 — 181st highest of 1,043 cities
> Population: 25,738

2. Salt Lake City, Utah
> Change in reported vehicle theft rate, 2019-2020: +461.7
> Vehicle-thefts reported in 2020: 2,192 — 39th highest of 1,124 cities
> Vehicle-thefts per 100K people in 2020: 1,084.1 — 12th highest of 1,124 cities
> 1-yr. change in all property crime: +1,694.7 — 2nd highest of 1,037 cities
> Property crimes per 100K people in 2020: 7,352.1 — 3rd highest of 1,043 cities
> Population: 197,756
[in-text-ad-2]

1. San Rafael, California
> Change in reported vehicle theft rate, 2019-2020: +490.7
> Vehicle-thefts reported in 2020: 500 — 154th highest of 1,124 cities
> Vehicle-thefts per 100K people in 2020: 854.5 — 33rd highest of 1,124 cities
> 1-yr. change in all property crime: +401.3 — 56th highest of 1,037 cities
> Property crimes per 100K people in 2020: 3,267.7 — 185th highest of 1,043 cities
> Population: 58,775
Methodology
To determine the cities where the motor vehicle theft rate is rising fastest, 24/7 Wall St. reviewed the change in motor vehicle thefts per 100,000 people from the FBI’s 2019 and 2020 Uniform Crime Reports. Crime rates were calculated using population figures provided by the FBI in the 2020 and 2019 UCR.
Limited data was available in the 2020 UCR for areas in Alabama, Maryland, Pennsylvania, and Illinois, though cities in these states were not excluded from analysis. Because some state and local agencies changed reporting practices between 2019 and 2020, the figures are not comparable, and the areas were excluded.
To concentrate on urban areas, we excluded places with fewer than 25,000 people based on five-year estimates from the U.S. Census Bureau’s 2019 American Community Survey.
Contact [email protected] for any questions or corrections.