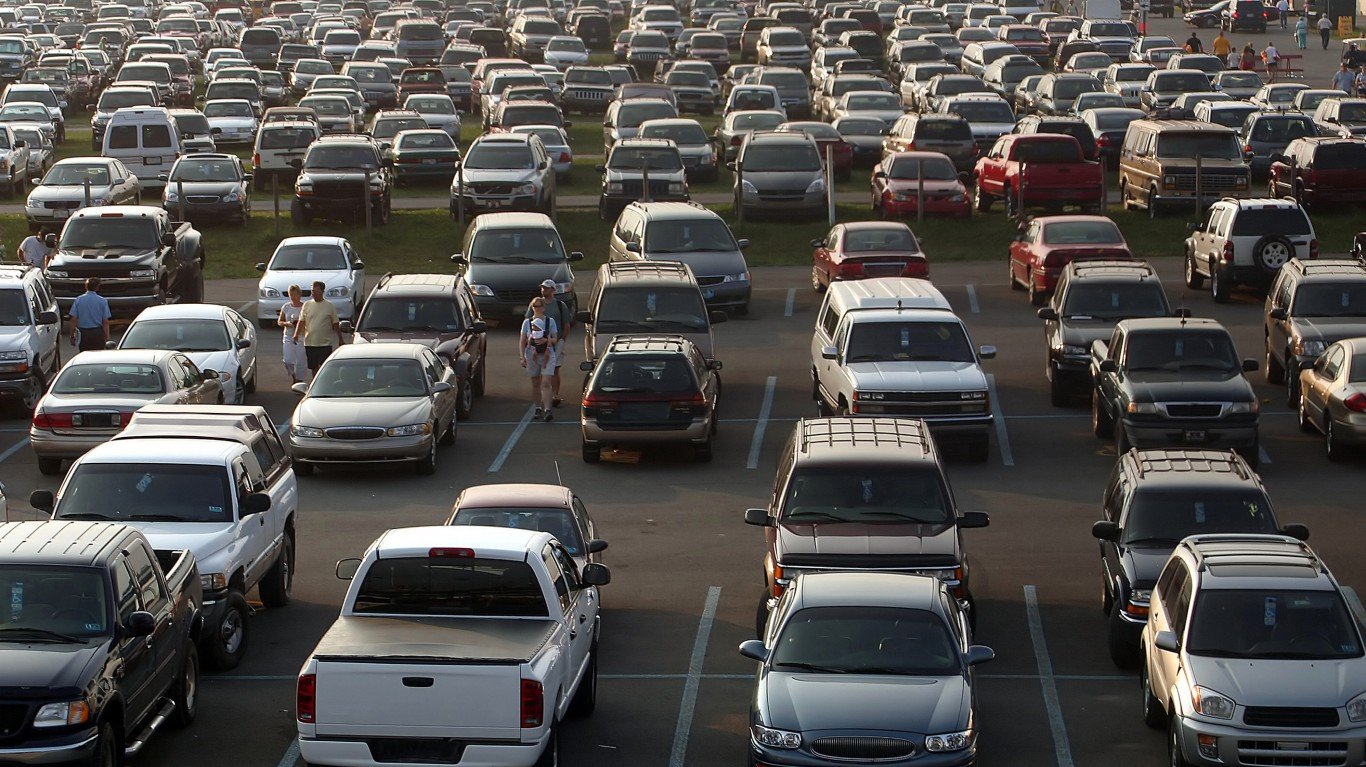
Motor vehicle theft, one of the most serious offenses tracked by the FBI, is on the rise in the United States. There were a total of 810,400 motor vehicle thefts nationwide in 2020, up 12% from the previous year and the most in over a decade.
Motor vehicle theft can be either the theft or attempted theft of a vehicle, such as a car or ATV. Some experts attribute the rising rates of vehicle theft to the COVID-19 pandemic, which led to vehicles sitting unattended and unused for longer stretches than usual. Here is a look at the 10 most stolen cars in America.
The country’s rising rates of motor vehicle theft are being led by surges in some American towns.
Using data from the FBI’s 2020 Uniform Crime Report, 24/7 Wall St. identified the 50 towns where vehicle theft is rising fastest. Towns – defined as places with populations between 2,500 and 25,000 – are ranked by the year-over-year change in the number of reported vehicle thefts per 100,000 people in 2020. Among the towns on this list, the vehicle theft rate climbed anywhere from 252 incidents per 100,000 people to 1,629 per 100,000 people. Meanwhile, the national motor vehicle theft rate climbed by 25 incidents per 100,000 people in 2020.
Vehicle theft – along with larceny and burglary – is one component of the overall property crime category. Partially due to rising rates of vehicle theft, most of the towns on this list also reported an increase in the overall property crime rate in 2020. Here is a look at the cities where property crime is soaring.
The largest share of towns that reported the greatest increases in vehicle thefts per capita are in the West, including 11 in California alone. Every town on this list has a higher motor vehicle theft rate than the national rate of 246 per 100,000 people.
Click here to see the towns where the motor vehicle theft rate is soaring
Click here to read our detailed methodology
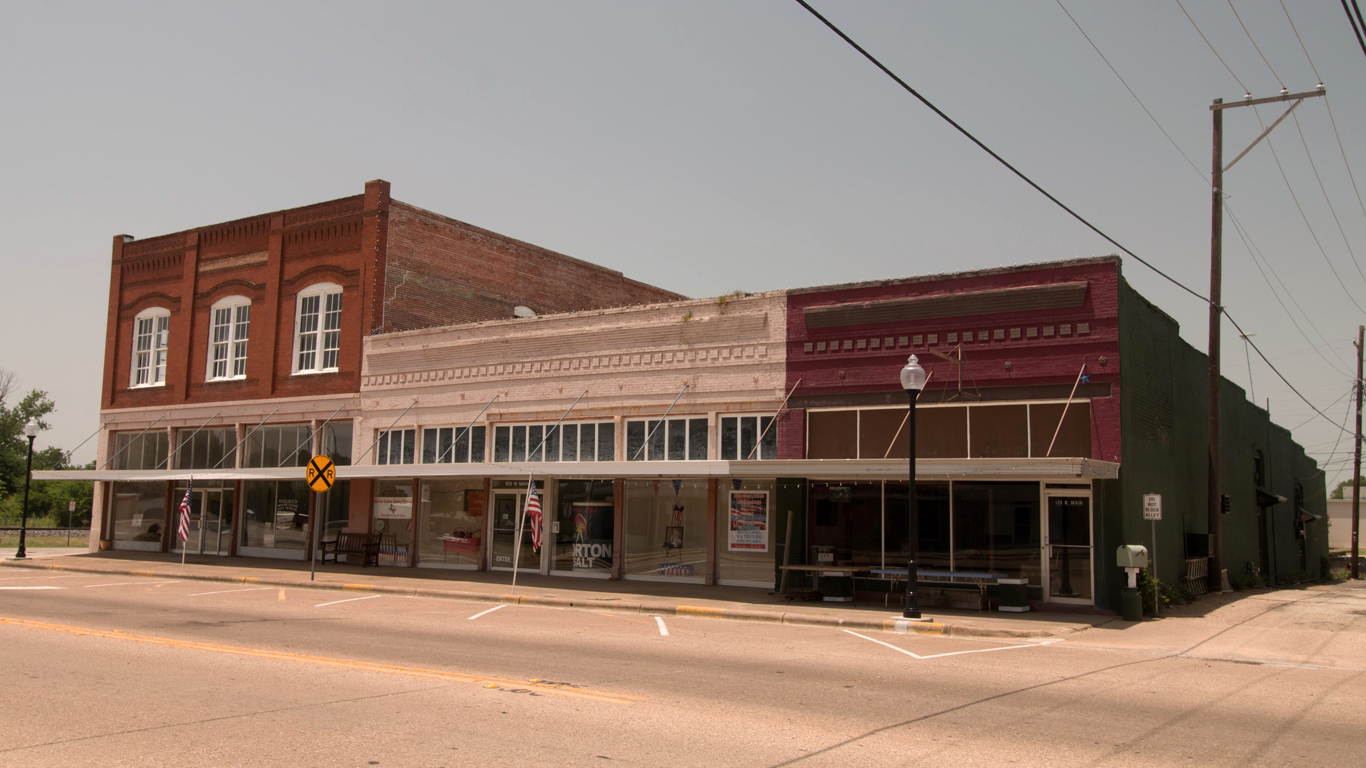
50. Grand Saline, Texas
> Change in reported vehicle theft rate, 2019-2020: +251.5
> Vehicle-thefts reported in 2020: 11 — 1,135th highest of 2,899 towns (tied)
> Vehicle-thefts per 100K people in 2020: 346.1 — 284th highest of 2,899 towns
> 1-yr. change in all property crime: -96.8 — 1,326th highest of 2,654 towns
> Property crimes per 100K people in 2020: 975.5 — 799th lowest of 2,663 towns
> Population: 3,115
[in-text-ad]
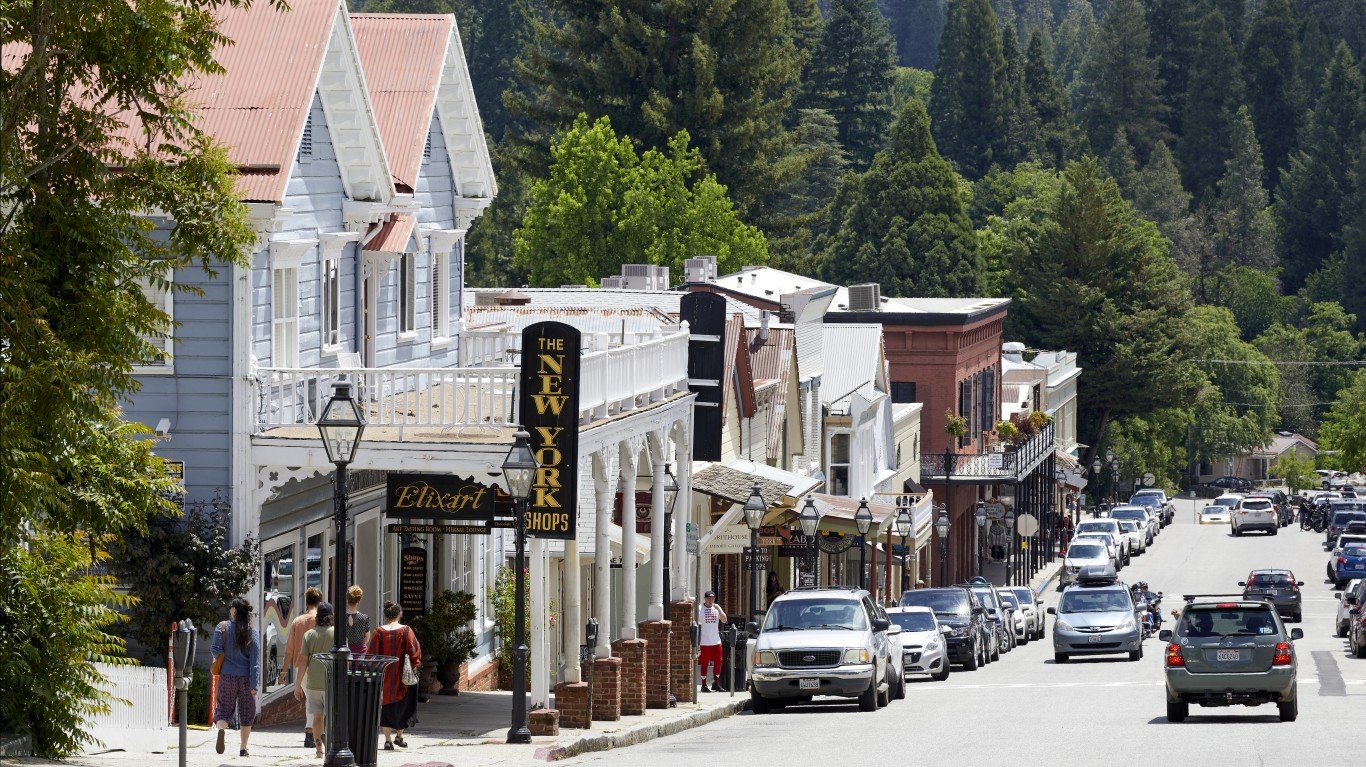
49. Nevada City, California
> Change in reported vehicle theft rate, 2019-2020: +252.6
> Vehicle-thefts reported in 2020: 22 — 584th highest of 2,899 towns (tied)
> Vehicle-thefts per 100K people in 2020: 697.1 — 32nd highest of 2,899 towns
> 1-yr. change in all property crime: -5.4 — 1,076th highest of 2,654 towns
> Property crimes per 100K people in 2020: 2,820.0 — 541st highest of 2,663 towns
> Population: 3,144
[recirclink id=1016086]
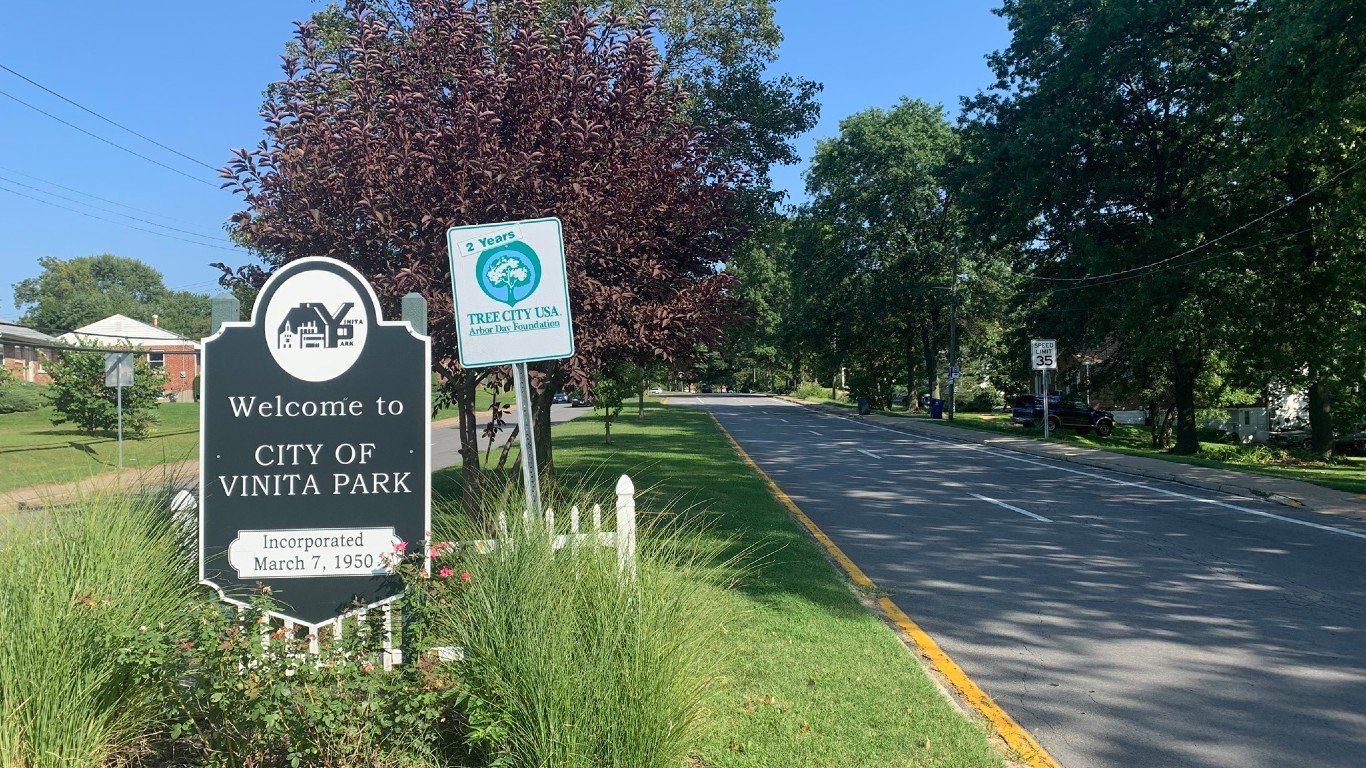
48. Vinita Park, Missouri
> Change in reported vehicle theft rate, 2019-2020: +257.6
> Vehicle-thefts reported in 2020: 109 — 32nd highest of 2,899 towns (tied)
> Vehicle-thefts per 100K people in 2020: 995.3 — 16th highest of 2,899 towns
> 1-yr. change in all property crime: -844.4 — 226th lowest of 2,654 towns
> Property crimes per 100K people in 2020: 4,620.6 — 133rd highest of 2,663 towns
> Population: 1,619
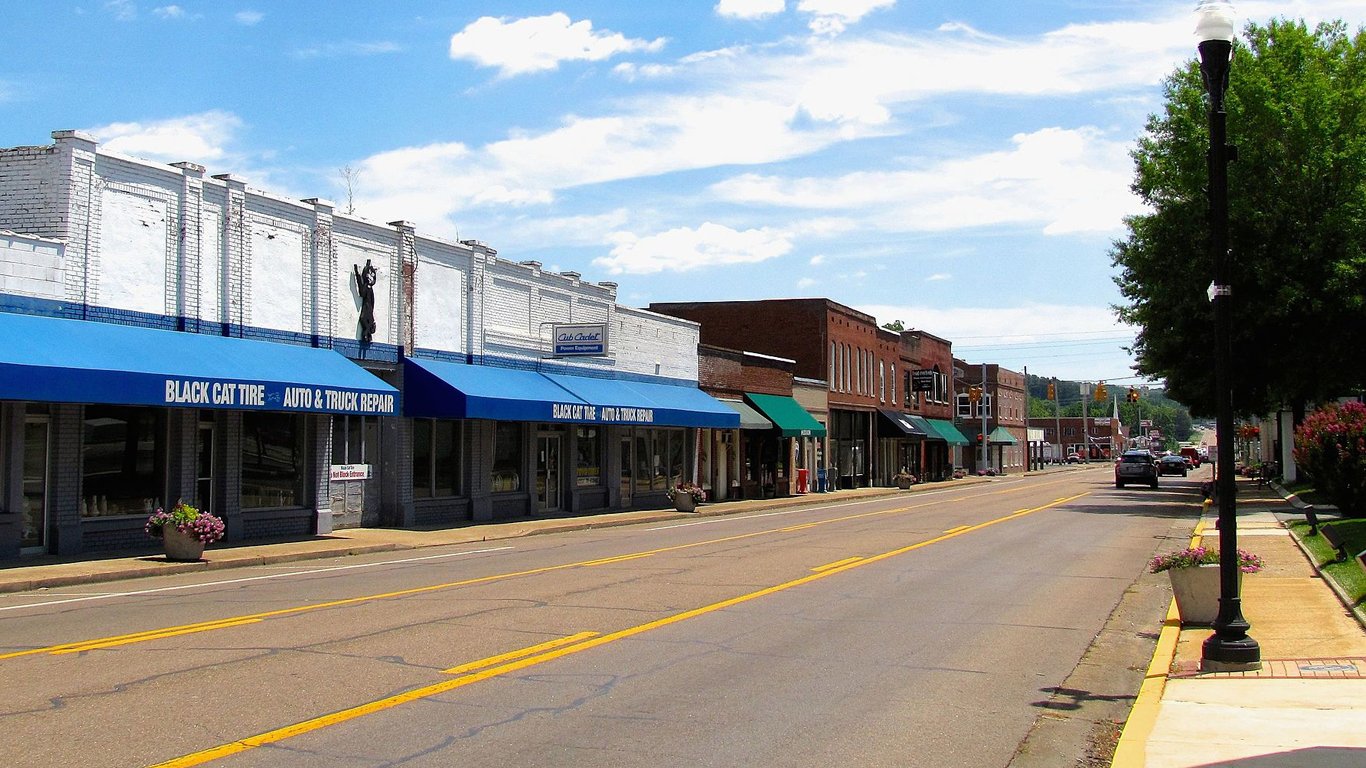
47. Dunlap, Tennessee
> Change in reported vehicle theft rate, 2019-2020: +264.8
> Vehicle-thefts reported in 2020: 31 — 376th highest of 2,899 towns (tied)
> Vehicle-thefts per 100K people in 2020: 594.6 — 55th highest of 2,899 towns
> 1-yr. change in all property crime: -282.3 — 851st lowest of 2,654 towns
> Property crimes per 100K people in 2020: 2,627.5 — 624th highest of 2,663 towns
> Population: 5,103
[in-text-ad-2]

46. Osceola, Arkansas
> Change in reported vehicle theft rate, 2019-2020: +266.5
> Vehicle-thefts reported in 2020: 38 — 275th highest of 2,899 towns (tied)
> Vehicle-thefts per 100K people in 2020: 582.2 — 60th highest of 2,899 towns
> 1-yr. change in all property crime: -260.7 — 888th lowest of 2,654 towns
> Property crimes per 100K people in 2020: 4,489.0 — 147th highest of 2,663 towns
> Population: 6,908

45. Waldron, Arkansas
> Change in reported vehicle theft rate, 2019-2020: +269.0
> Vehicle-thefts reported in 2020: 10 — 1,208th highest of 2,899 towns (tied)
> Vehicle-thefts per 100K people in 2020: 299.0 — 389th highest of 2,899 towns
> 1-yr. change in all property crime: +675.7 — 139th highest of 2,654 towns
> Property crimes per 100K people in 2020: 4,037.1 — 200th highest of 2,663 towns
> Population: 3,405
[in-text-ad]

44. Cahokia, Illinois
> Change in reported vehicle theft rate, 2019-2020: +273.2
> Vehicle-thefts reported in 2020: 95 — 46th highest of 2,899 towns
> Vehicle-thefts per 100K people in 2020: 691.5 — 35th highest of 2,899 towns
> 1-yr. change in all property crime: N/A
> Property crimes per 100K people in 2020: N/A
> Population: 14,162
[recirclink id=1062431]
43. King City, California
> Change in reported vehicle theft rate, 2019-2020: +273.8
> Vehicle-thefts reported in 2020: 64 — 103rd highest of 2,899 towns (tied)
> Vehicle-thefts per 100K people in 2020: 450.3 — 136th highest of 2,899 towns
> 1-yr. change in all property crime: +672.2 — 140th highest of 2,654 towns
> Property crimes per 100K people in 2020: 1,716.6 — 1,155th highest of 2,663 towns
> Population: 13,921

42. Woodlynne, New Jersey
> Change in reported vehicle theft rate, 2019-2020: +275.0
> Vehicle-thefts reported in 2020: 13 — 991st highest of 2,899 towns (tied)
> Vehicle-thefts per 100K people in 2020: 447.4 — 139th highest of 2,899 towns
> 1-yr. change in all property crime: +512.9 — 233rd highest of 2,654 towns
> Property crimes per 100K people in 2020: 2,408.8 — 720th highest of 2,663 towns
> Population: 2,920
[in-text-ad-2]

41. Heber Springs, Arkansas
> Change in reported vehicle theft rate, 2019-2020: +276.6
> Vehicle-thefts reported in 2020: 25 — 515th highest of 2,899 towns (tied)
> Vehicle-thefts per 100K people in 2020: 363.4 — 259th highest of 2,899 towns
> 1-yr. change in all property crime: +480.7 — 259th highest of 2,654 towns
> Property crimes per 100K people in 2020: 3,822.7 — 237th highest of 2,663 towns
> Population: 6,992
40. Corcoran, California
> Change in reported vehicle theft rate, 2019-2020: +277.4
> Vehicle-thefts reported in 2020: 111 — 30th highest of 2,899 towns
> Vehicle-thefts per 100K people in 2020: 511.5 — 88th highest of 2,899 towns
> 1-yr. change in all property crime: +532.6 — 220th highest of 2,654 towns
> Property crimes per 100K people in 2020: 1,806.5 — 1,077th highest of 2,663 towns
> Population: 22,156
[in-text-ad]

39. Pembroke Park, Florida
> Change in reported vehicle theft rate, 2019-2020: +278.2
> Vehicle-thefts reported in 2020: 42 — 233rd highest of 2,899 towns (tied)
> Vehicle-thefts per 100K people in 2020: 616.6 — 49th highest of 2,899 towns
> 1-yr. change in all property crime: -314.8 — 779th lowest of 2,654 towns
> Property crimes per 100K people in 2020: 2,862.6 — 522nd highest of 2,663 towns
> Population: 6,677
[recirclink id=1066891]
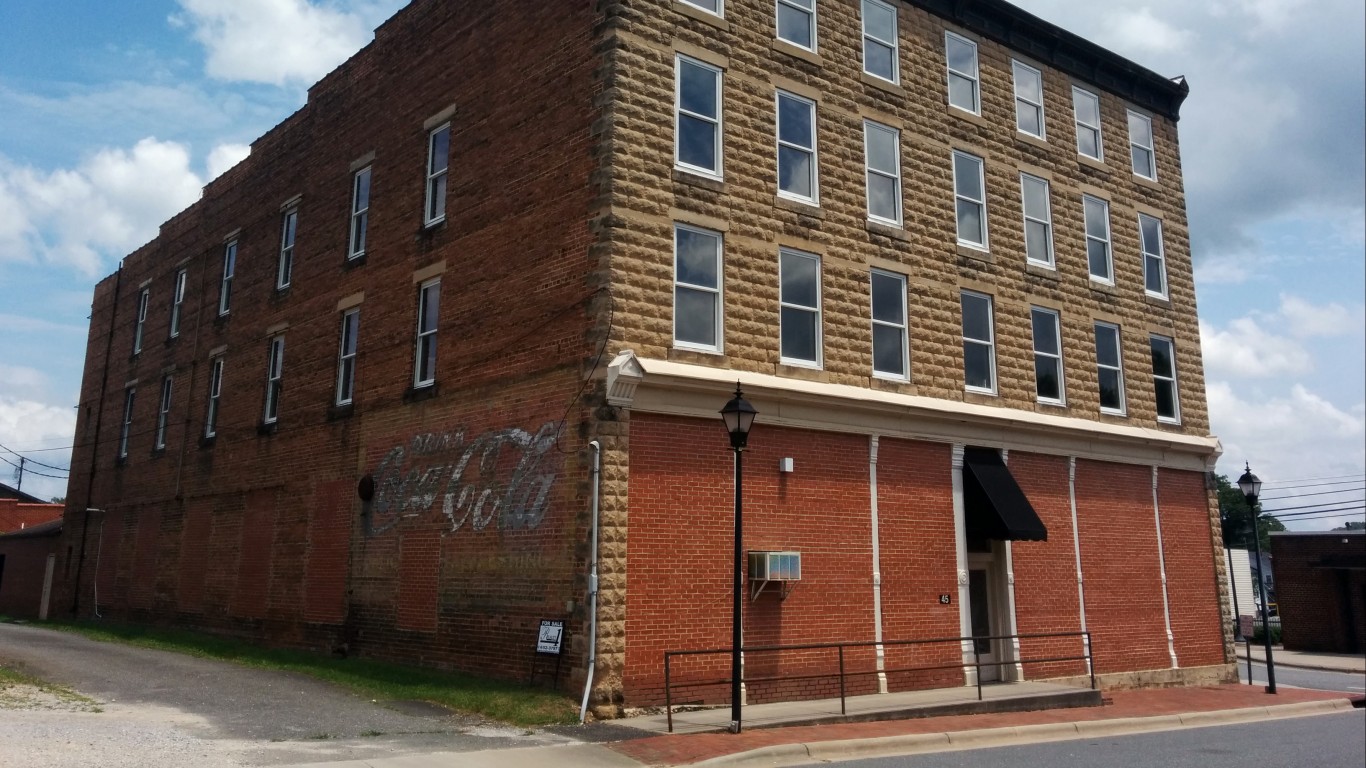
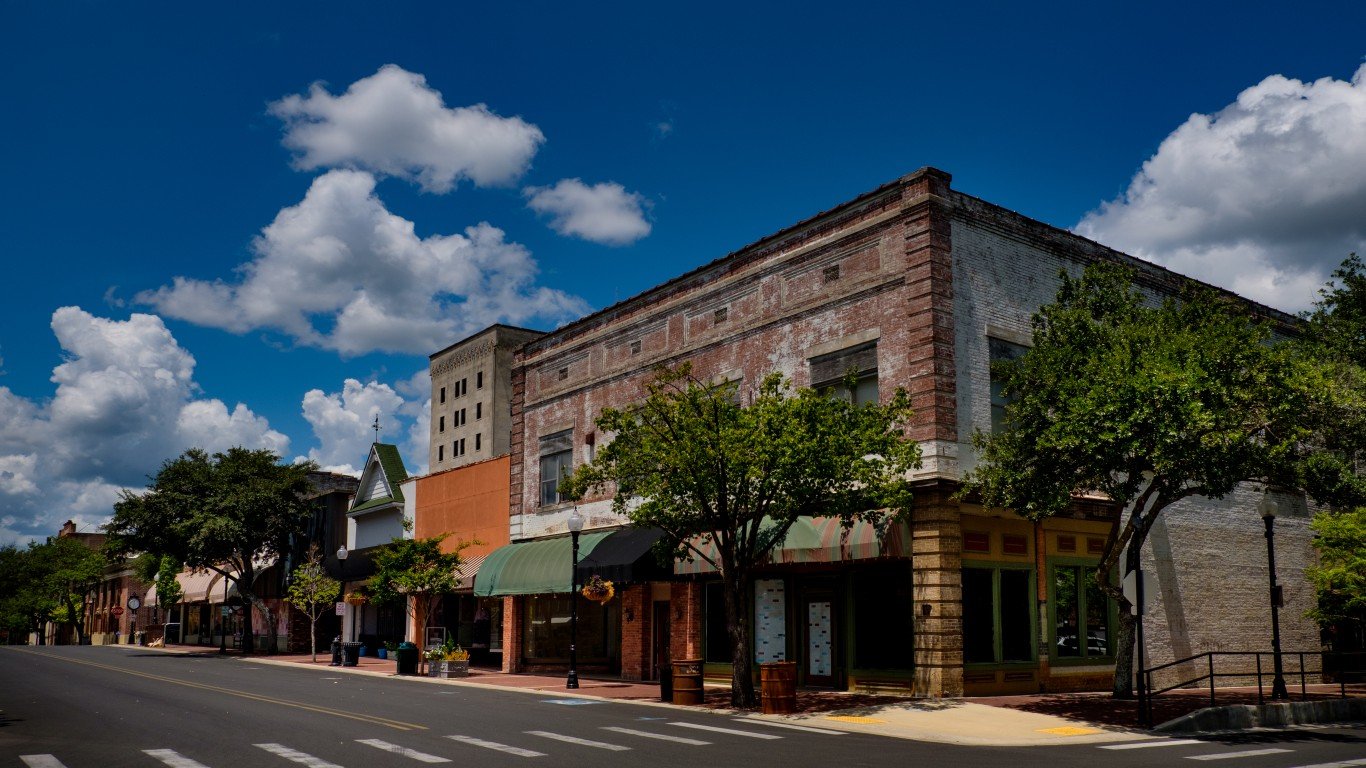
38. Marion, North Carolina
> Change in reported vehicle theft rate, 2019-2020: +279.0
> Vehicle-thefts reported in 2020: 45 — 199th highest of 2,899 towns (tied)
> Vehicle-thefts per 100K people in 2020: 572.4 — 66th highest of 2,899 towns
> 1-yr. change in all property crime: +238.1 — 512th highest of 2,654 towns
> Property crimes per 100K people in 2020: 5,584.5 — 75th highest of 2,663 towns
> Population: 7,834

37. Sand Springs, Oklahoma
> Change in reported vehicle theft rate, 2019-2020: +279.6
> Vehicle-thefts reported in 2020: 136 — 15th highest of 2,899 towns
> Vehicle-thefts per 100K people in 2020: 679.1 — 38th highest of 2,899 towns
> 1-yr. change in all property crime: +119.4 — 751st highest of 2,654 towns
> Property crimes per 100K people in 2020: 4,504.1 — 144th highest of 2,663 towns
> Population: 19,794
[in-text-ad-2]

36. Algona, Washington
> Change in reported vehicle theft rate, 2019-2020: +279.7
> Vehicle-thefts reported in 2020: 14 — 929th highest of 2,899 towns (tied)
> Vehicle-thefts per 100K people in 2020: 433.7 — 151st highest of 2,899 towns
> 1-yr. change in all property crime: +598.0 — 182nd highest of 2,654 towns
> Property crimes per 100K people in 2020: 2,199.5 — 826th highest of 2,663 towns
> Population: 3,211
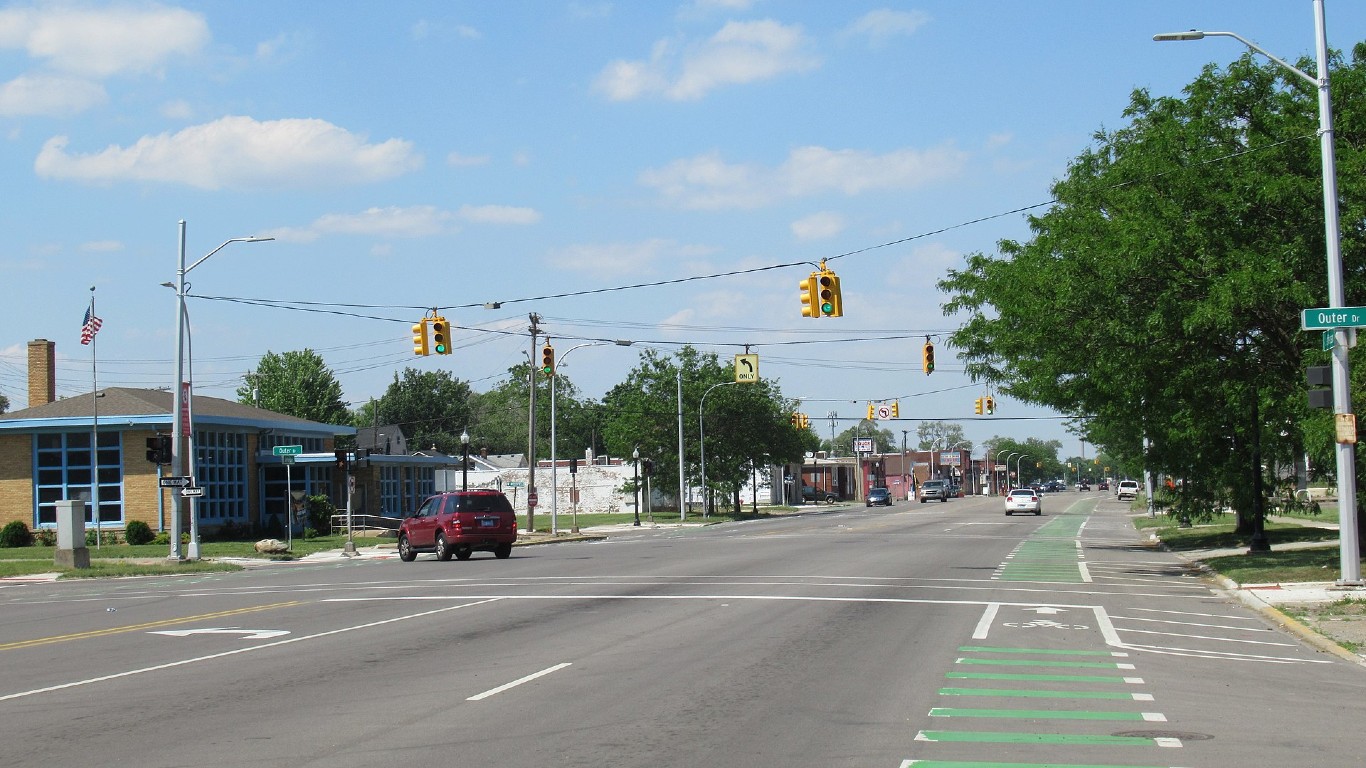
35. Ecorse, Michigan
> Change in reported vehicle theft rate, 2019-2020: +282.3
> Vehicle-thefts reported in 2020: 39 — 268th highest of 2,899 towns (tied)
> Vehicle-thefts per 100K people in 2020: 407.3 — 176th highest of 2,899 towns
> 1-yr. change in all property crime: +1,360.4 — 30th highest of 2,654 towns
> Property crimes per 100K people in 2020: 2,464.5 — 691st highest of 2,663 towns
> Population: 9,432
[in-text-ad]
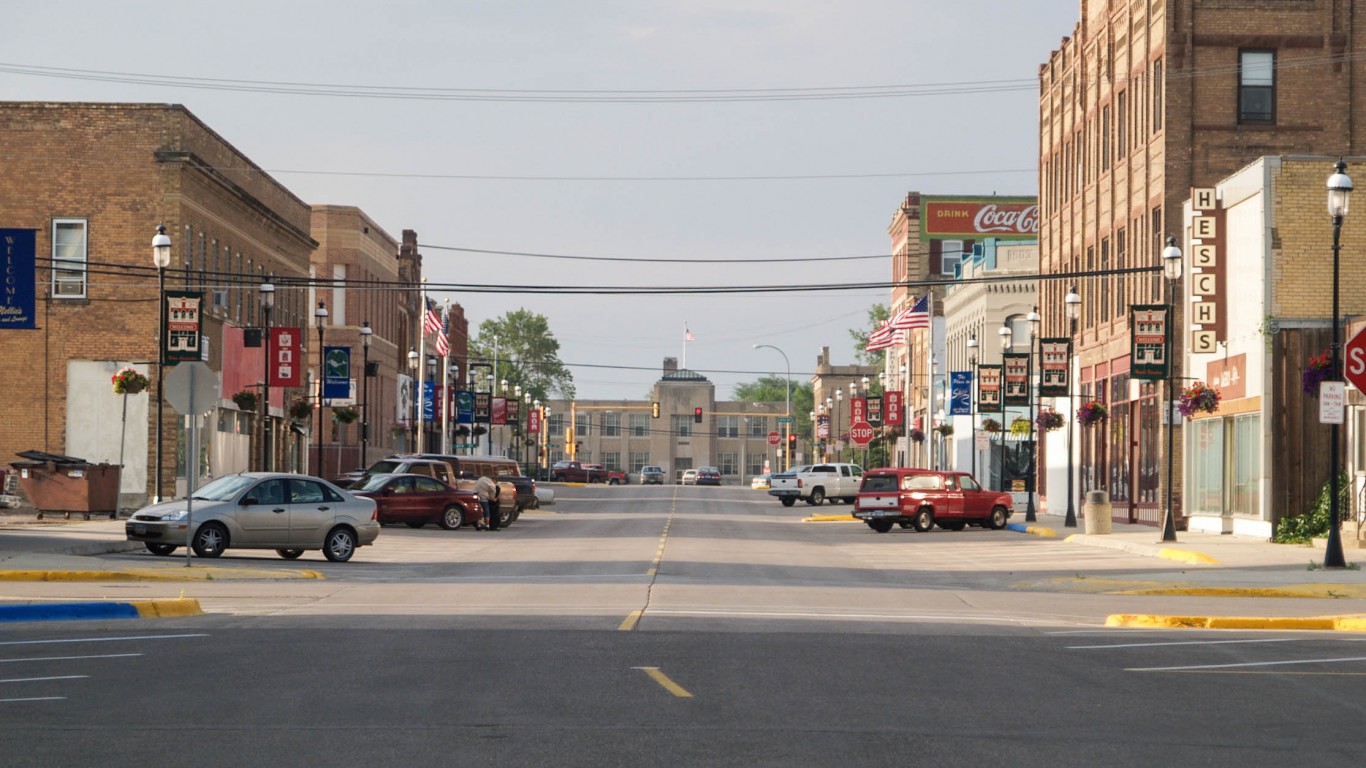
34. Devils Lake, North Dakota
> Change in reported vehicle theft rate, 2019-2020: +284.8
> Vehicle-thefts reported in 2020: 37 — 287th highest of 2,899 towns (tied)
> Vehicle-thefts per 100K people in 2020: 504.2 — 95th highest of 2,899 towns
> 1-yr. change in all property crime: -50.0 — 1,205th highest of 2,654 towns
> Property crimes per 100K people in 2020: 3,665.3 — 268th highest of 2,663 towns
> Population: 7,344
[recirclink id=1033410]

33. Grayson, Kentucky
> Change in reported vehicle theft rate, 2019-2020: +286.7
> Vehicle-thefts reported in 2020: 18 — 724th highest of 2,899 towns (tied)
> Vehicle-thefts per 100K people in 2020: 465.1 — 115th highest of 2,899 towns
> 1-yr. change in all property crime: +697.3 — 133rd highest of 2,654 towns
> Property crimes per 100K people in 2020: 2,558.1 — 649th highest of 2,663 towns
> Population: 3,976
32. Dumfries, Virginia
> Change in reported vehicle theft rate, 2019-2020: +288.4
> Vehicle-thefts reported in 2020: 22 — 584th highest of 2,899 towns (tied)
> Vehicle-thefts per 100K people in 2020: 364.4 — 254th highest of 2,899 towns
> 1-yr. change in all property crime: +82.5 — 840th highest of 2,654 towns
> Property crimes per 100K people in 2020: 861.2 — 657th lowest of 2,663 towns
> Population: 5,373
[in-text-ad-2]

31. Caseyville, Illinois
> Change in reported vehicle theft rate, 2019-2020: +292.7
> Vehicle-thefts reported in 2020: 24 — 538th highest of 2,899 towns (tied)
> Vehicle-thefts per 100K people in 2020: 586.2 — 59th highest of 2,899 towns
> 1-yr. change in all property crime: N/A
> Property crimes per 100K people in 2020: N/A
> Population: 4,179

30. Cle Elum, Washington
> Change in reported vehicle theft rate, 2019-2020: +296.6
> Vehicle-thefts reported in 2020: 12 — 1,055th highest of 2,899 towns (tied)
> Vehicle-thefts per 100K people in 2020: 397.0 — 188th highest of 2,899 towns
> 1-yr. change in all property crime: +1,228.1 — 42nd highest of 2,654 towns
> Property crimes per 100K people in 2020: 3,804.2 — 240th highest of 2,663 towns
> Population: 3,017
[in-text-ad]
29. West Milwaukee, Wisconsin
> Change in reported vehicle theft rate, 2019-2020: +297.9
> Vehicle-thefts reported in 2020: 37 — 287th highest of 2,899 towns (tied)
> Vehicle-thefts per 100K people in 2020: 906.6 — 21st highest of 2,899 towns
> 1-yr. change in all property crime: -13,715.1 — the lowest of 2,654 towns
> Property crimes per 100K people in 2020: 22,004.4 — the highest of 2,663 towns
> Population: 4,146
[recirclink id=1026293]
28. Long View, North Carolina
> Change in reported vehicle theft rate, 2019-2020: +303.1
> Vehicle-thefts reported in 2020: 28 — 440th highest of 2,899 towns (tied)
> Vehicle-thefts per 100K people in 2020: 567.3 — 68th highest of 2,899 towns
> 1-yr. change in all property crime: +1,838.2 — 14th highest of 2,654 towns
> Property crimes per 100K people in 2020: 3,626.4 — 280th highest of 2,663 towns
> Population: 4,959
27. Clay Center, Kansas
> Change in reported vehicle theft rate, 2019-2020: +304.4
> Vehicle-thefts reported in 2020: 20 — 643rd highest of 2,899 towns (tied)
> Vehicle-thefts per 100K people in 2020: 507.1 — 92nd highest of 2,899 towns
> 1-yr. change in all property crime: +660.4 — 146th highest of 2,654 towns
> Property crimes per 100K people in 2020: 2,915.8 — 497th highest of 2,663 towns
> Population: 4,026
[in-text-ad-2]
26. Ferguson, Missouri
> Change in reported vehicle theft rate, 2019-2020: +334.0
> Vehicle-thefts reported in 2020: 196 — 5th highest of 2,899 towns
> Vehicle-thefts per 100K people in 2020: 958.2 — 17th highest of 2,899 towns
> 1-yr. change in all property crime: +348.0 — 380th highest of 2,654 towns
> Property crimes per 100K people in 2020: 5,192.1 — 97th highest of 2,663 towns
> Population: 20,738
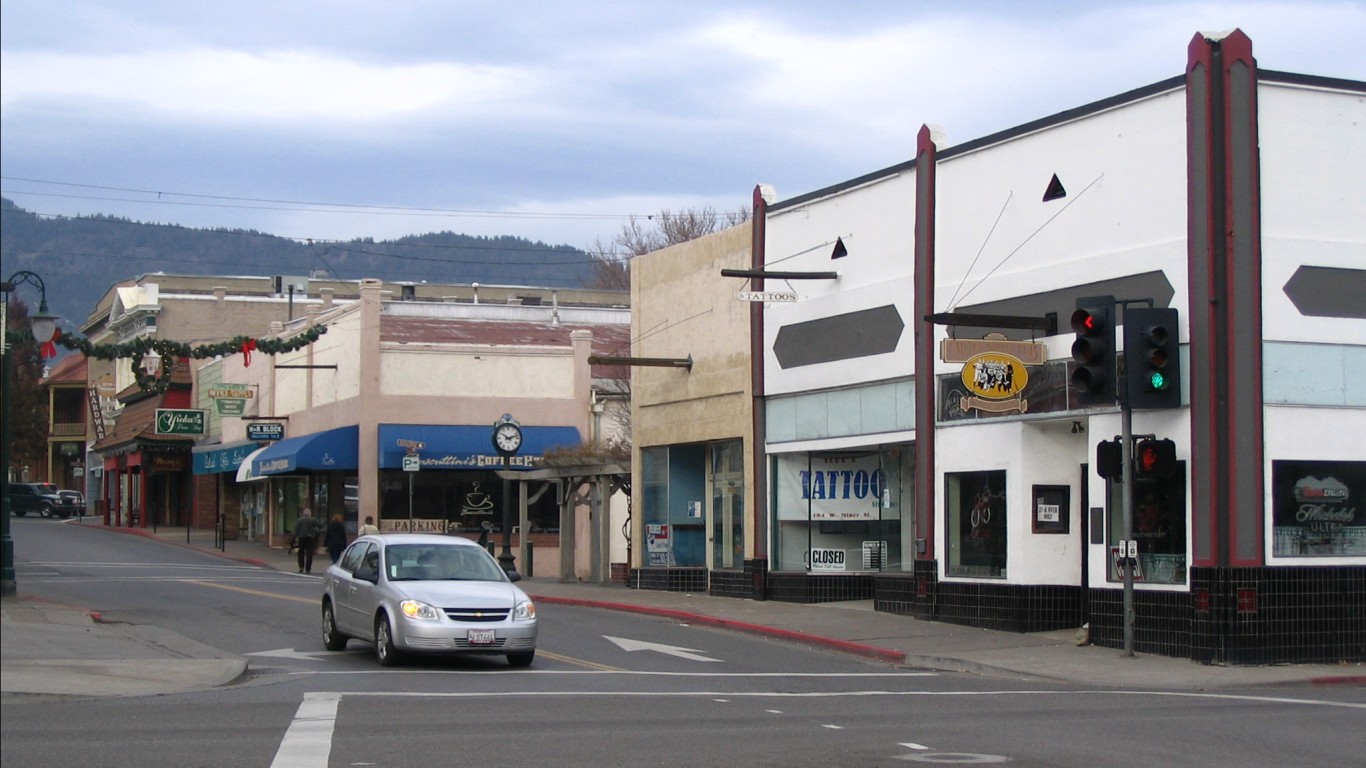
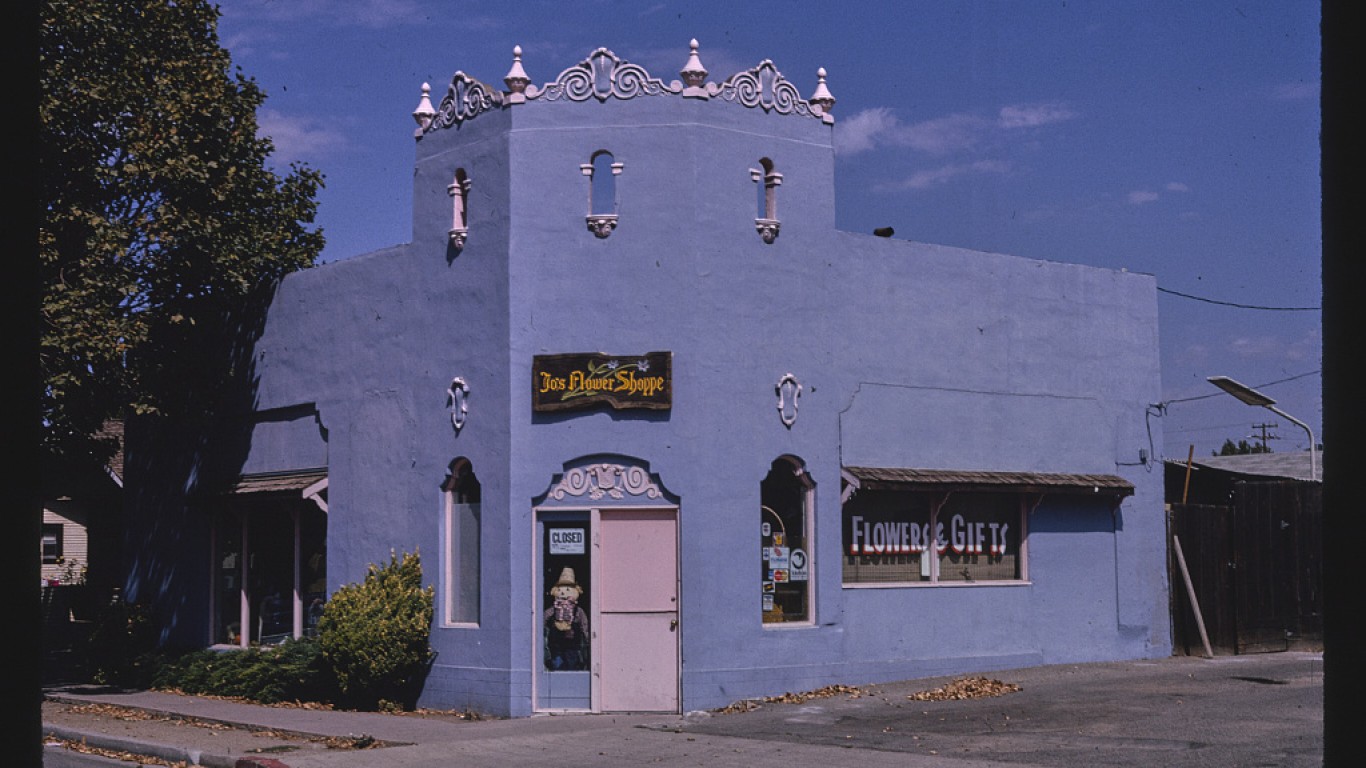
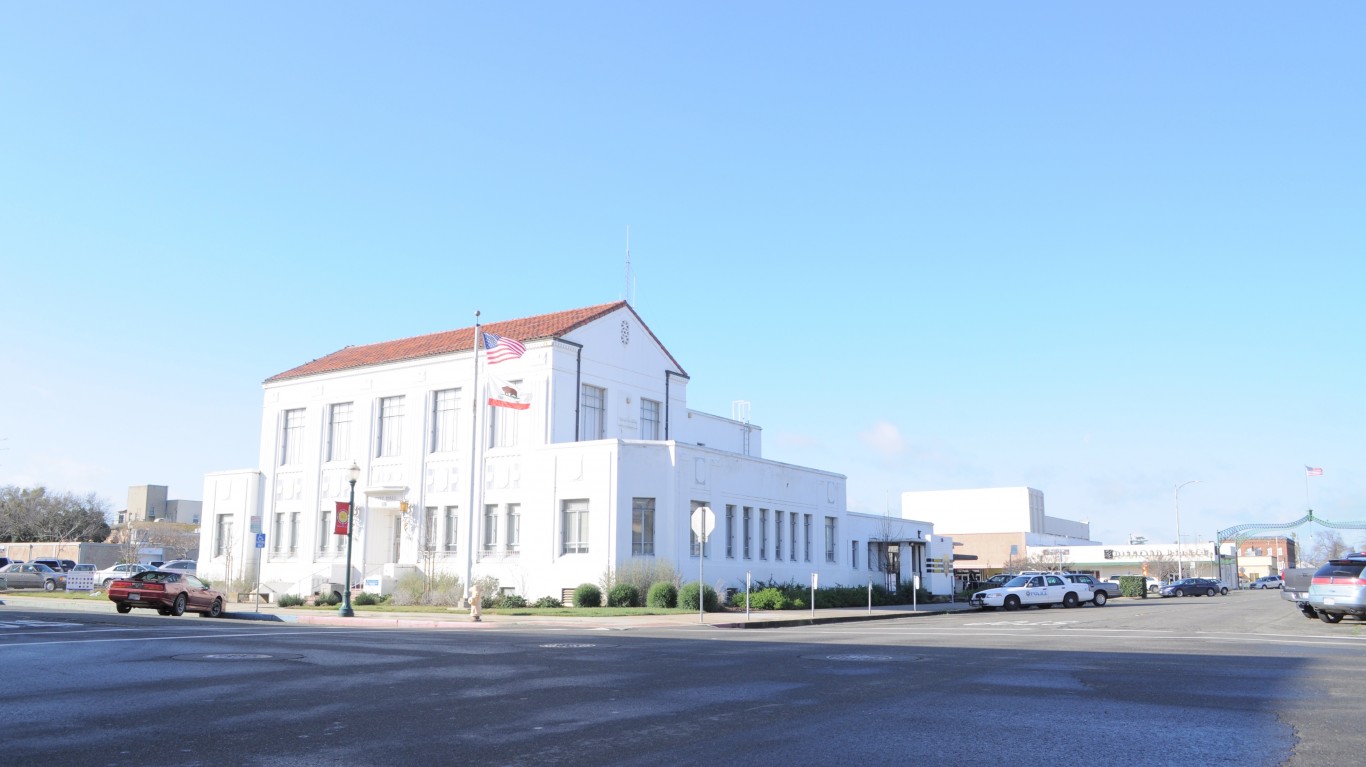
25. Yreka, California
> Change in reported vehicle theft rate, 2019-2020: +335.8
> Vehicle-thefts reported in 2020: 54 — 139th highest of 2,899 towns (tied)
> Vehicle-thefts per 100K people in 2020: 721.1 — 30th highest of 2,899 towns
> 1-yr. change in all property crime: -157.7 — 1,171st lowest of 2,654 towns
> Property crimes per 100K people in 2020: 2,964.3 — 475th highest of 2,663 towns
> Population: 7,562
[in-text-ad]

24. Dayton, Tennessee
> Change in reported vehicle theft rate, 2019-2020: +339.9
> Vehicle-thefts reported in 2020: 32 — 350th highest of 2,899 towns (tied)
> Vehicle-thefts per 100K people in 2020: 434.4 — 149th highest of 2,899 towns
> 1-yr. change in all property crime: +109.8 — 771st highest of 2,654 towns
> Property crimes per 100K people in 2020: 2,769.1 — 562nd highest of 2,663 towns
> Population: 7,344
[recirclink id=1016086]

23. Tolleson, Arizona
> Change in reported vehicle theft rate, 2019-2020: +352.5
> Vehicle-thefts reported in 2020: 97 — 43rd highest of 2,899 towns (tied)
> Vehicle-thefts per 100K people in 2020: 1,298.5 — 11th highest of 2,899 towns
> 1-yr. change in all property crime: +3,167.5 — the highest of 2,654 towns
> Property crimes per 100K people in 2020: 12,168.7 — 5th highest of 2,663 towns
> Population: 7,246

22. Edwardsville, Kansas
> Change in reported vehicle theft rate, 2019-2020: +355.4
> Vehicle-thefts reported in 2020: 26 — 485th highest of 2,899 towns (tied)
> Vehicle-thefts per 100K people in 2020: 577.4 — 63rd highest of 2,899 towns
> 1-yr. change in all property crime: +489.7 — 250th highest of 2,654 towns
> Property crimes per 100K people in 2020: 2,975.8 — 470th highest of 2,663 towns
> Population: 4,492
[in-text-ad-2]

21. Paradise, California
> Change in reported vehicle theft rate, 2019-2020: +361.0
> Vehicle-thefts reported in 2020: 25 — 515th highest of 2,899 towns (tied)
> Vehicle-thefts per 100K people in 2020: 613.9 — 50th highest of 2,899 towns
> 1-yr. change in all property crime: +1,679.7 — 19th highest of 2,654 towns
> Property crimes per 100K people in 2020: 2,431.2 — 706th highest of 2,663 towns
> Population: 22,135

20. Dandridge, Tennessee
> Change in reported vehicle theft rate, 2019-2020: +369.8
> Vehicle-thefts reported in 2020: 15 — 874th highest of 2,899 towns (tied)
> Vehicle-thefts per 100K people in 2020: 464.5 — 116th highest of 2,899 towns
> 1-yr. change in all property crime: +640.8 — 157th highest of 2,654 towns
> Property crimes per 100K people in 2020: 2,787.2 — 557th highest of 2,663 towns
> Population: 3,157
[in-text-ad]
19. Davison, Michigan
> Change in reported vehicle theft rate, 2019-2020: +392.2
> Vehicle-thefts reported in 2020: 22 — 584th highest of 2,899 towns (tied)
> Vehicle-thefts per 100K people in 2020: 453.8 — 132nd highest of 2,899 towns
> 1-yr. change in all property crime: +561.1 — 206th highest of 2,654 towns
> Property crimes per 100K people in 2020: 1,340.8 — 1,179th lowest of 2,663 towns
> Population: 4,937
[recirclink id=1062431]
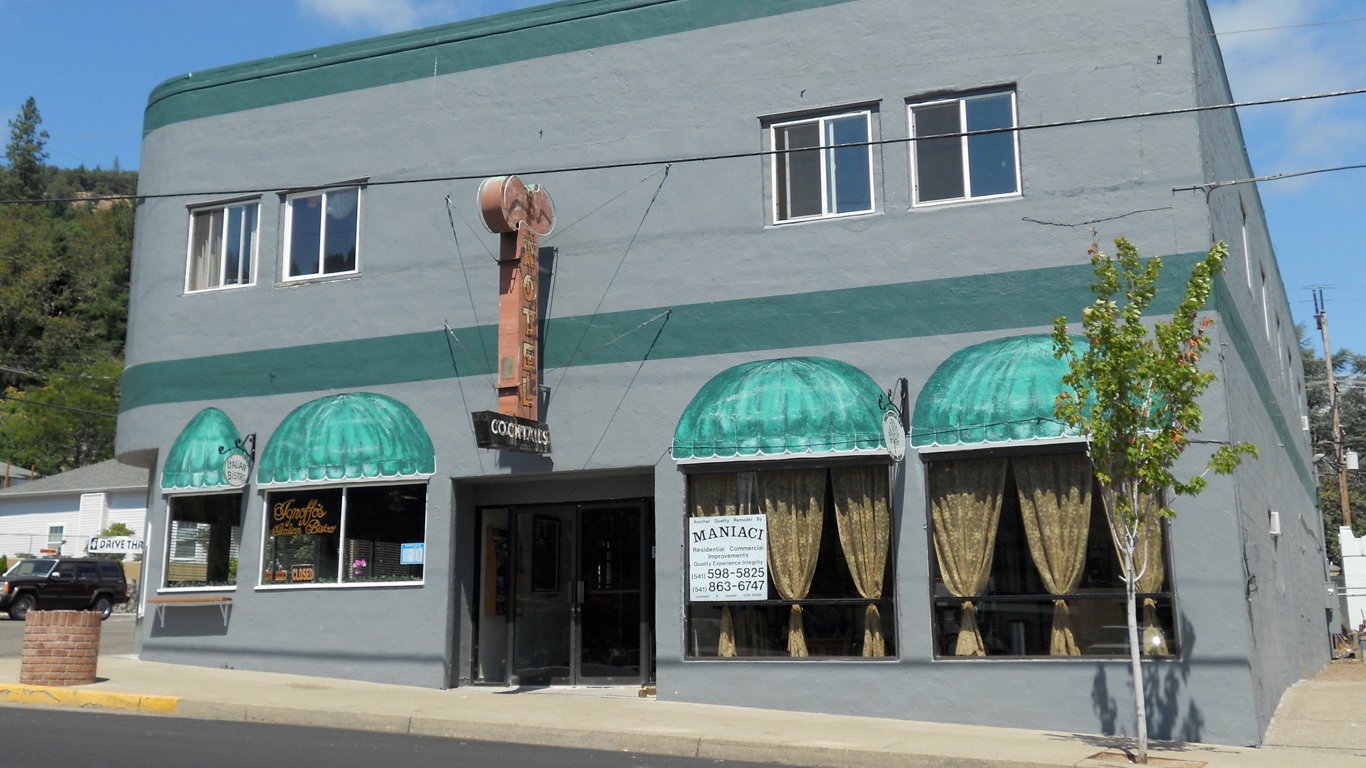
18. Myrtle Creek, Oregon
> Change in reported vehicle theft rate, 2019-2020: +401.8
> Vehicle-thefts reported in 2020: 22 — 584th highest of 2,899 towns (tied)
> Vehicle-thefts per 100K people in 2020: 629.8 — 48th highest of 2,899 towns
> 1-yr. change in all property crime: +1,189.1 — 46th highest of 2,654 towns
> Property crimes per 100K people in 2020: 4,752.4 — 124th highest of 2,663 towns
> Population: 3,428

17. Derby, Connecticut
> Change in reported vehicle theft rate, 2019-2020: +409.8
> Vehicle-thefts reported in 2020: 72 — 77th highest of 2,899 towns (tied)
> Vehicle-thefts per 100K people in 2020: 586.3 — 58th highest of 2,899 towns
> 1-yr. change in all property crime: +1,079.7 — 59th highest of 2,654 towns
> Property crimes per 100K people in 2020: 3,004.6 — 462nd highest of 2,663 towns
> Population: 12,485
[in-text-ad-2]
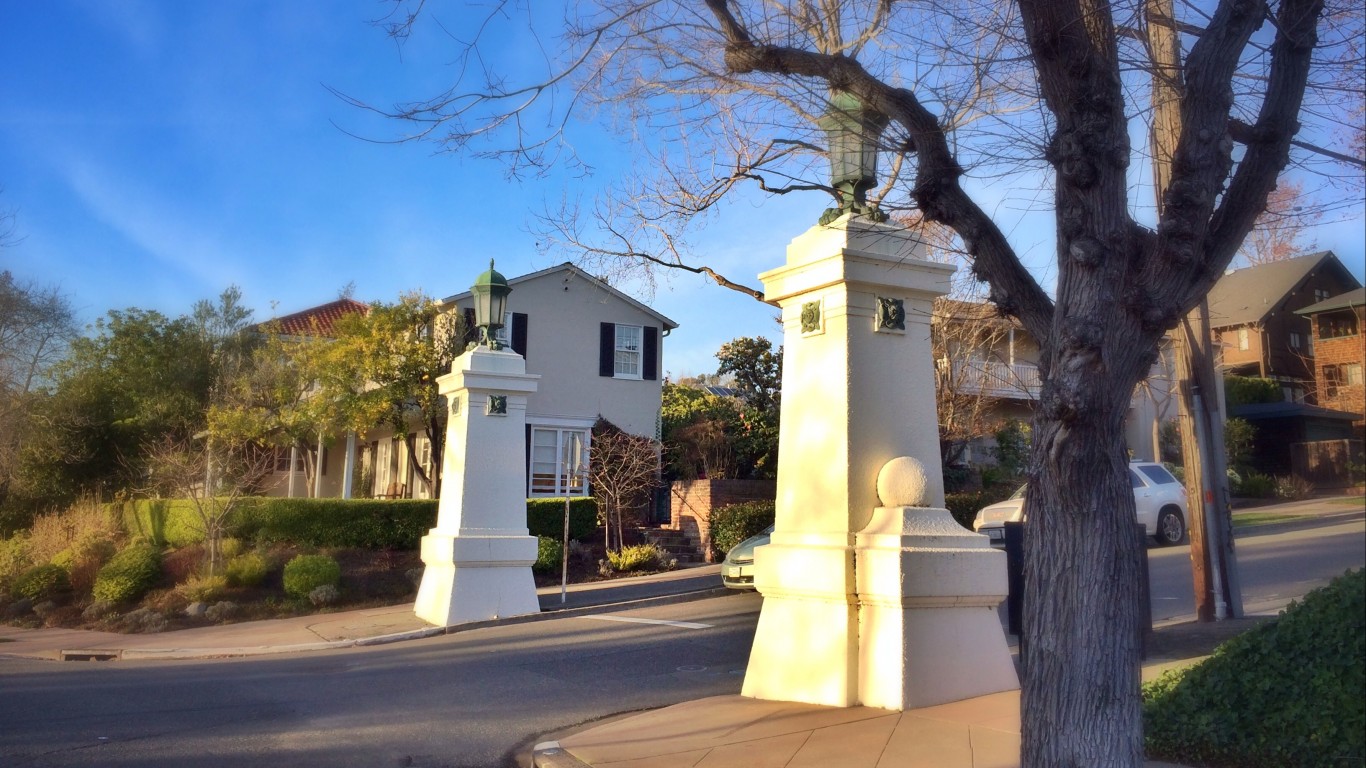
16. Piedmont, California
> Change in reported vehicle theft rate, 2019-2020: +431.0
> Vehicle-thefts reported in 2020: 67 — 92nd highest of 2,899 towns (tied)
> Vehicle-thefts per 100K people in 2020: 599.1 — 52nd highest of 2,899 towns
> 1-yr. change in all property crime: +1,273.9 — 38th highest of 2,654 towns
> Property crimes per 100K people in 2020: 3,281.5 — 372nd highest of 2,663 towns
> Population: 11,317

15. Colonial Beach, Virginia
> Change in reported vehicle theft rate, 2019-2020: +440.5
> Vehicle-thefts reported in 2020: 18 — 724th highest of 2,899 towns (tied)
> Vehicle-thefts per 100K people in 2020: 496.1 — 97th highest of 2,899 towns
> 1-yr. change in all property crime: +207.6 — 571st highest of 2,654 towns
> Property crimes per 100K people in 2020: 1,543.6 — 1,298th highest of 2,663 towns
> Population: 3,574
[in-text-ad]

14. Emeryville, California
> Change in reported vehicle theft rate, 2019-2020: +474.3
> Vehicle-thefts reported in 2020: 171 — 8th highest of 2,899 towns
> Vehicle-thefts per 100K people in 2020: 1,387.1 — 9th highest of 2,899 towns
> 1-yr. change in all property crime: -9,433.7 — 2nd lowest of 2,654 towns
> Property crimes per 100K people in 2020: 11,753.7 — 6th highest of 2,663 towns
> Population: 11,899
[recirclink id=1066891]
13. Marysville, California
> Change in reported vehicle theft rate, 2019-2020: +475.9
> Vehicle-thefts reported in 2020: 195 — 6th highest of 2,899 towns
> Vehicle-thefts per 100K people in 2020: 1,557.6 — 8th highest of 2,899 towns
> 1-yr. change in all property crime: -604.8 — 398th lowest of 2,654 towns
> Property crimes per 100K people in 2020: 3,698.4 — 257th highest of 2,663 towns
> Population: 12,327
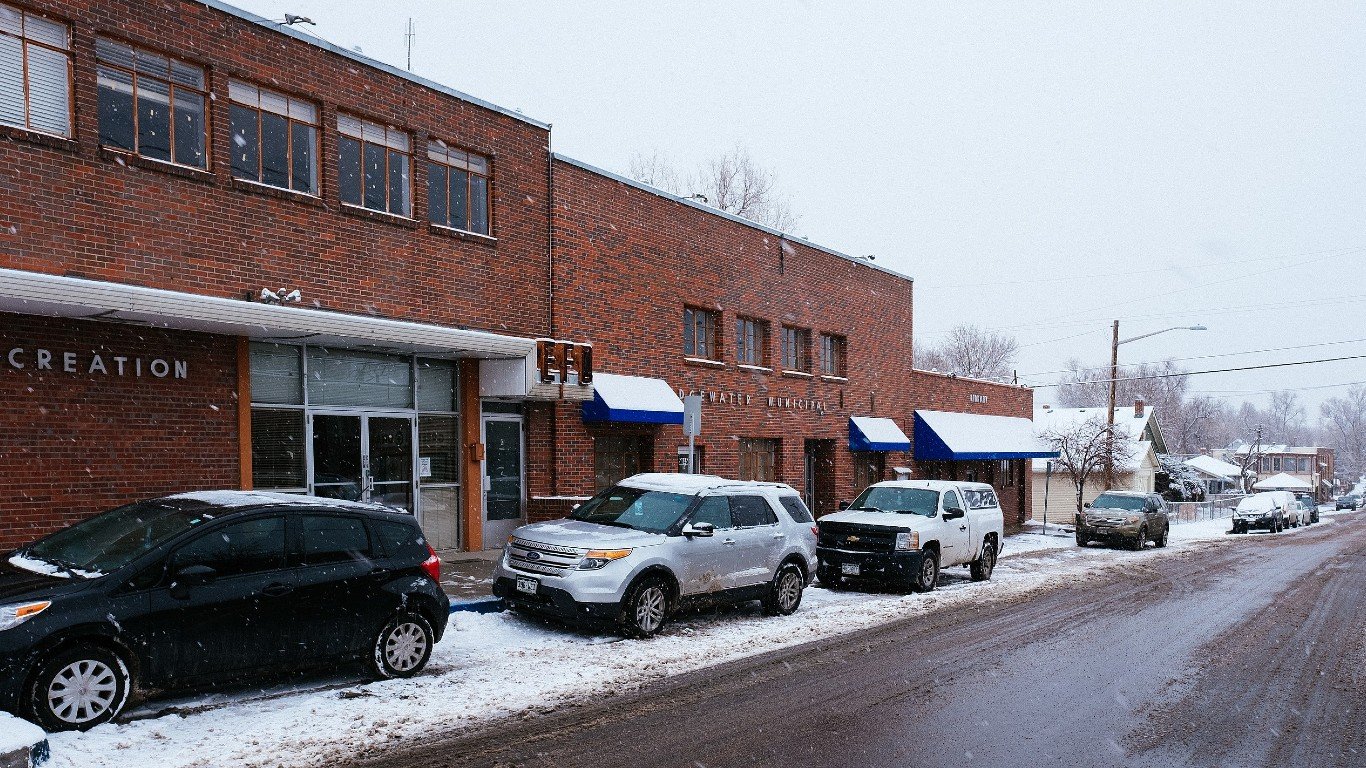
12. Edgewater, Colorado
> Change in reported vehicle theft rate, 2019-2020: +486.8
> Vehicle-thefts reported in 2020: 56 — 130th highest of 2,899 towns (tied)
> Vehicle-thefts per 100K people in 2020: 1,046.1 — 15th highest of 2,899 towns
> 1-yr. change in all property crime: +348.5 — 379th highest of 2,654 towns
> Property crimes per 100K people in 2020: 6,912.0 — 28th highest of 2,663 towns
> Population: 5,328
[in-text-ad-2]

11. Signal Hill, California
> Change in reported vehicle theft rate, 2019-2020: +497.4
> Vehicle-thefts reported in 2020: 133 — 16th highest of 2,899 towns (tied)
> Vehicle-thefts per 100K people in 2020: 1,159.9 — 13th highest of 2,899 towns
> 1-yr. change in all property crime: +603.1 — 179th highest of 2,654 towns
> Property crimes per 100K people in 2020: 6,435.9 — 37th highest of 2,663 towns
> Population: 11,512
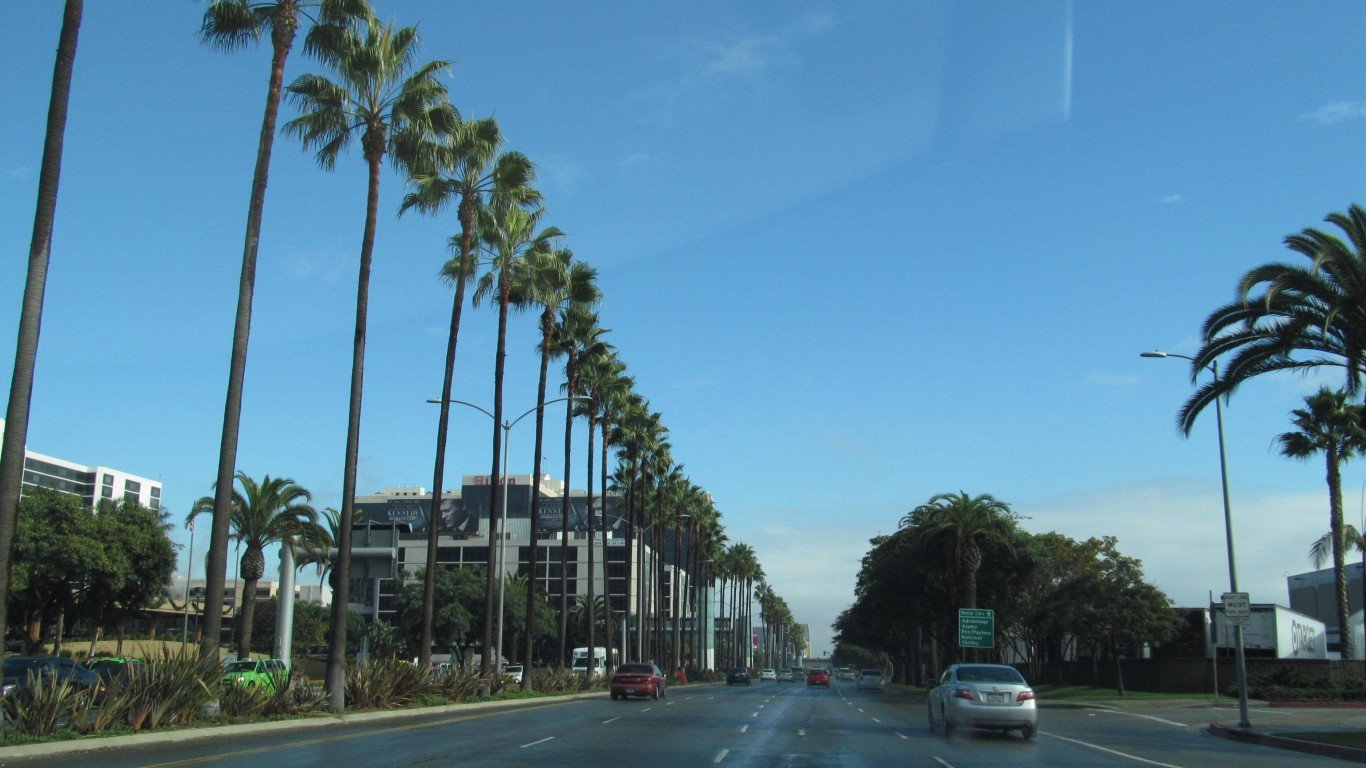
10. El Segundo, California
> Change in reported vehicle theft rate, 2019-2020: +503.1
> Vehicle-thefts reported in 2020: 157 — 11th highest of 2,899 towns
> Vehicle-thefts per 100K people in 2020: 945.5 — 19th highest of 2,899 towns
> 1-yr. change in all property crime: +930.8 — 87th highest of 2,654 towns
> Property crimes per 100K people in 2020: 4,667.3 — 128th highest of 2,663 towns
> Population: 16,731
[in-text-ad]
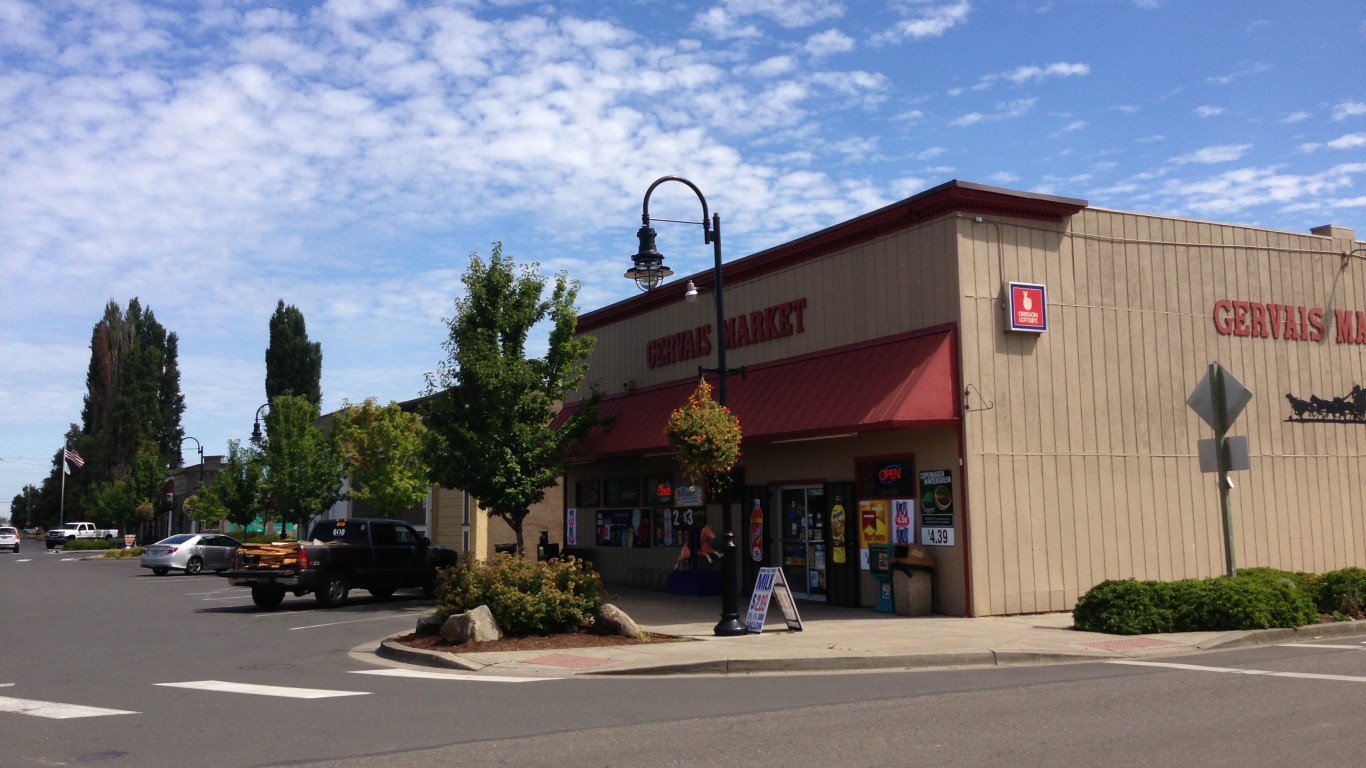
9. Gervais, Oregon
> Change in reported vehicle theft rate, 2019-2020: +607.9
> Vehicle-thefts reported in 2020: 19 — 680th highest of 2,899 towns (tied)
> Vehicle-thefts per 100K people in 2020: 679.8 — 37th highest of 2,899 towns
> 1-yr. change in all property crime: +1,035.6 — 65th highest of 2,654 towns
> Property crimes per 100K people in 2020: 1,502.7 — 1,325th lowest of 2,663 towns
> Population: 2,713
[recirclink id=1033410]
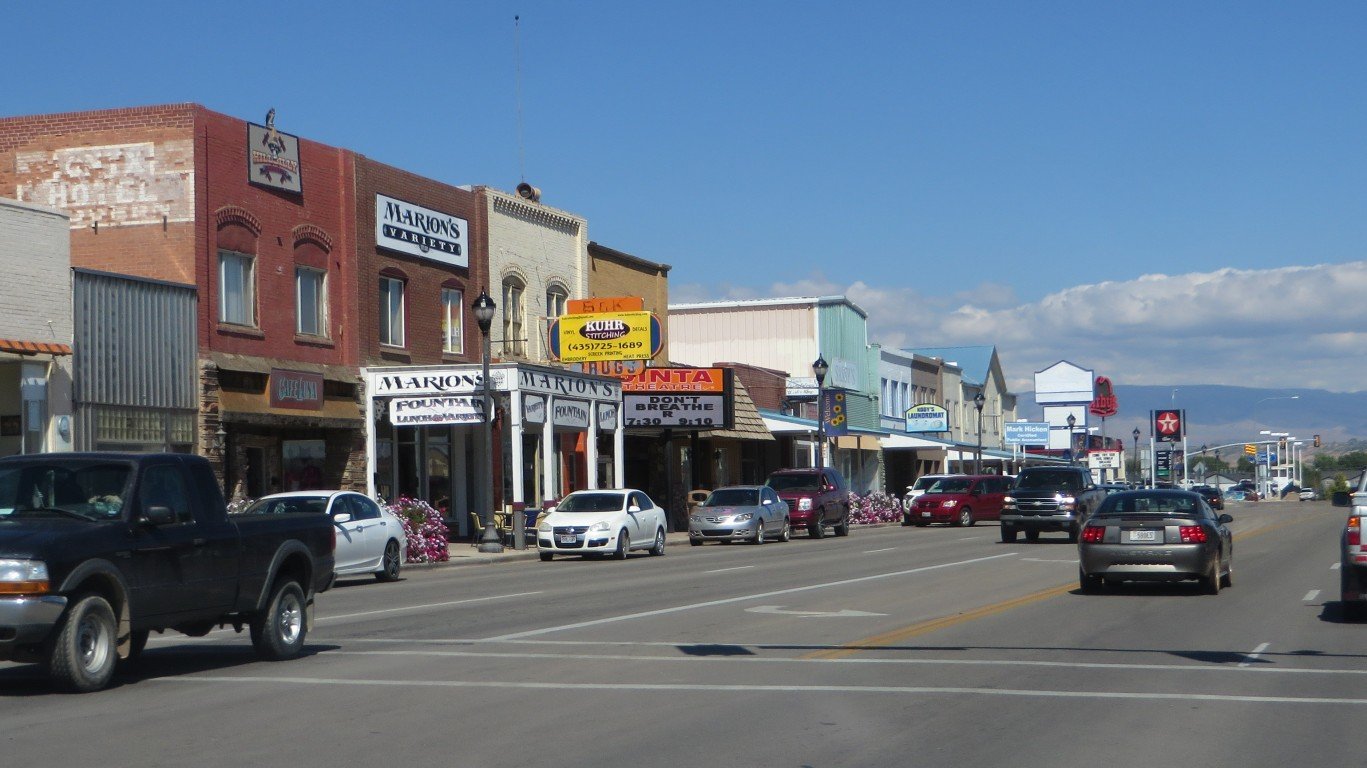
8. Roosevelt, Utah
> Change in reported vehicle theft rate, 2019-2020: +631.9
> Vehicle-thefts reported in 2020: 68 — 88th highest of 2,899 towns (tied)
> Vehicle-thefts per 100K people in 2020: 924.0 — 20th highest of 2,899 towns
> 1-yr. change in all property crime: +1,426.3 — 27th highest of 2,654 towns
> Property crimes per 100K people in 2020: 4,389.2 — 159th highest of 2,663 towns
> Population: 7,041

7. North Kansas City, Missouri
> Change in reported vehicle theft rate, 2019-2020: +634.1
> Vehicle-thefts reported in 2020: 110 — 31st highest of 2,899 towns
> Vehicle-thefts per 100K people in 2020: 2,383.5 — 5th highest of 2,899 towns
> 1-yr. change in all property crime: +2,481.9 — 7th highest of 2,654 towns
> Property crimes per 100K people in 2020: 10,725.9 — 7th highest of 2,663 towns
> Population: 4,477
[in-text-ad-2]
6. Merriam, Kansas
> Change in reported vehicle theft rate, 2019-2020: +700.6
> Vehicle-thefts reported in 2020: 146 — 13th highest of 2,899 towns
> Vehicle-thefts per 100K people in 2020: 1,316.9 — 10th highest of 2,899 towns
> 1-yr. change in all property crime: +1,792.7 — 16th highest of 2,654 towns
> Property crimes per 100K people in 2020: 6,115.3 — 47th highest of 2,663 towns
> Population: 11,185

5. Commerce, California
> Change in reported vehicle theft rate, 2019-2020: +863.9
> Vehicle-thefts reported in 2020: 358 — 2nd highest of 2,899 towns
> Vehicle-thefts per 100K people in 2020: 2,832.1 — 2nd highest of 2,899 towns
> 1-yr. change in all property crime: +615.3 — 169th highest of 2,654 towns
> Property crimes per 100K people in 2020: 8,456.6 — 15th highest of 2,663 towns
> Population: 12,830
[in-text-ad]

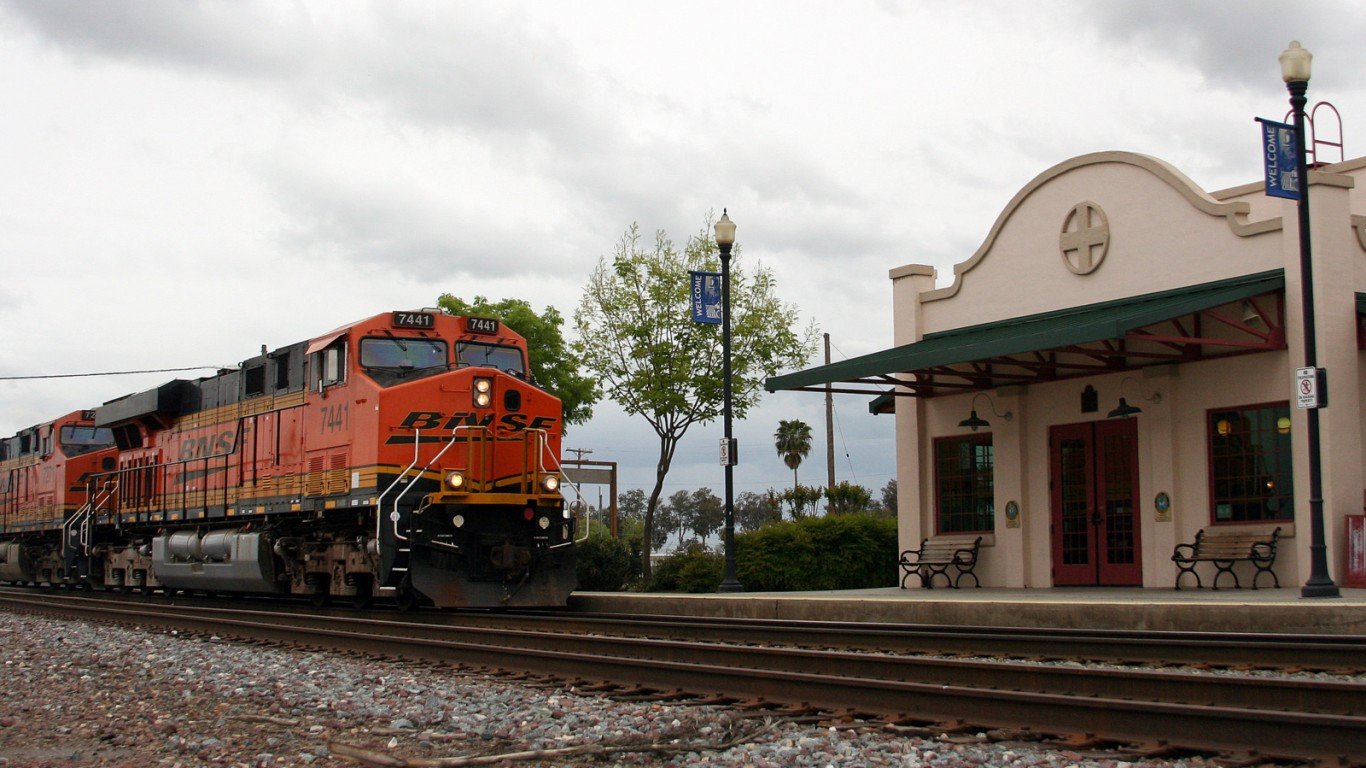
4. Fife, Washington
> Change in reported vehicle theft rate, 2019-2020: +1,071.6
> Vehicle-thefts reported in 2020: 284 — 3rd highest of 2,899 towns
> Vehicle-thefts per 100K people in 2020: 2,757.0 — 3rd highest of 2,899 towns
> 1-yr. change in all property crime: +2,315.1 — 9th highest of 2,654 towns
> Property crimes per 100K people in 2020: 8,746.7 — 14th highest of 2,663 towns
> Population: 10,096
[recirclink id=1026293]

3. Sheridan, Colorado
> Change in reported vehicle theft rate, 2019-2020: +1,295.4
> Vehicle-thefts reported in 2020: 125 — 21st highest of 2,899 towns
> Vehicle-thefts per 100K people in 2020: 2,001.3 — 6th highest of 2,899 towns
> 1-yr. change in all property crime: +2,882.8 — 2nd highest of 2,654 towns
> Property crimes per 100K people in 2020: 10,102.5 — 9th highest of 2,663 towns
> Population: 6,089

2. Glendale, Colorado
> Change in reported vehicle theft rate, 2019-2020: +1,329.5
> Vehicle-thefts reported in 2020: 150 — 12th highest of 2,899 towns
> Vehicle-thefts per 100K people in 2020: 2,861.0 — the highest of 2,899 towns
> 1-yr. change in all property crime: -455.1 — 563rd lowest of 2,654 towns
> Property crimes per 100K people in 2020: 17,242.0 — 2nd highest of 2,663 towns
> Population: 5,177
[in-text-ad-2]

1. Brownfield, Texas
> Change in reported vehicle theft rate, 2019-2020: +1,629.3
> Vehicle-thefts reported in 2020: 167 — 10th highest of 2,899 towns
> Vehicle-thefts per 100K people in 2020: 1,791.1 — 7th highest of 2,899 towns
> 1-yr. change in all property crime: +1,376.0 — 29th highest of 2,654 towns
> Property crimes per 100K people in 2020: 2,681.3 — 608th highest of 2,663 towns
> Population: 9,525
Methodology
To determine the towns where the motor vehicle theft rate is rising fastest, 24/7 Wall St. reviewed the change in motor vehicle thefts per 100,000 people from the FBI’s 2019 and 2020 Uniform Crime Reports. Crime rates were calculated using population figures provided by the FBI in the 2020 and 2019 UCR.
We defined towns based on population thresholds — having at least 2,500 people and less than 25,000 people — using five-year estimates from the U.S. Census Bureau’s 2019 American Community Survey. Limited data was available in the 2020 UCR for areas in Alabama, Maryland, Pennsylvania, and Illinois, though towns in these states were not excluded from analysis. Because some state and local agencies changed reporting practices between 2019 and 2020, the figures are not comparable, and the areas were excluded.
Population figures are five-year estimates from the U.S. Census Bureau’s 2019 American Community Survey.
Contact [email protected] for any questions or corrections.