
Of all the most serious crimes tracked by the FBI – known as Part I offenses – larceny is by far the most common. There were 4.6 million cases of larceny-theft reported in the United States in 2020, accounting for nearly 60% of all Part I offenses, which also include murder, assault, robbery, rаpe, vehicle theft, and burglary.
Larceny is a classification of crime that includes all nonviolent theft, with the exception of motor-vehicle theft. Common examples of larceny include purse snatching, pick pocketing, shoplifting, and bicycle theft. According to the FBI, larceny-thefts result in billions of dollars in losses annually.
Reported incidents of larceny have been declining for years in the United States. Between 2019 and 2020 alone, the number of reported larceny cases fell by 11%, or, adjusting for population, 171 incidents for every 100,000 people. However, some major U.S. metro areas are reporting rising larceny rates, breaking with the broader trend.
Using data from the FBI’s 2020 Uniform Crime Report, 24/7 Wall St. determined the 25 metropolitan areas where the larceny-theft rate is rising fastest. Metro areas are ranked by the change in the number of larcenies reported for every 100,000 people between 2019 and 2020. Among the metro areas on this list, the larceny rate climbed anywhere from about 30 to 327 incidents per 100,000 people.
Larceny – along with motor vehicle theft and burglary – is one component of the property crime category. Partially due to a rising larceny rate, the overall property crime rate also increased in every metro area on this list with available data. Here is a look at the U.S. towns where property crime is soaring.
The metro areas on this list span the country, though Wisconsin alone is home to five, the most of any state. In the majority of metro areas on this list, the larceny-theft rate is higher than the national rate of 1,398 per 100,000 people. Here is a look at the city with the most larceny thefts in every state.
Click here to see the metros where the larceny-theft rate is soaring
Click here to read our detailed methodology

25. Oxnard-Thousand Oaks-Ventura, CA
> Change in reported larceny-theft rate, 2019-2020: +28.8
> Larceny-thefts reported in 2020: 9,616 – 43rd highest of 203 metros
> Larceny-thefts per 100K people in 2020: 1,145.0 – 62nd lowest of 203 metros
> 1-yr. change in all property crime: +66.2 – 27th highest of 188 metros
> Property crimes per 100K people in 2020: 1,557.8 – 59th lowest of 199 metros
> Population: 846,006
[in-text-ad]

24. Shreveport-Bossier City, LA
> Change in reported larceny-theft rate, 2019-2020: +35.8
> Larceny-thefts reported in 2020: 10,533 – 39th highest of 203 metros
> Larceny-thefts per 100K people in 2020: 2,681.3 – 3rd highest of 203 metros
> 1-yr. change in all property crime: +49.7 – 30th highest of 188 metros
> Property crimes per 100K people in 2020: 3,588.1 – 7th highest of 199 metros
> Population: 394,706
[recirclink id=1059954]

23. Madison, WI
> Change in reported larceny-theft rate, 2019-2020: +41.5
> Larceny-thefts reported in 2020: 9,148 – 45th highest of 203 metros
> Larceny-thefts per 100K people in 2020: 1,363.0 – 96th lowest of 203 metros
> 1-yr. change in all property crime: +90.7 – 21st highest of 188 metros
> Property crimes per 100K people in 2020: 1,805.4 – 81st lowest of 199 metros
> Population: 664,865
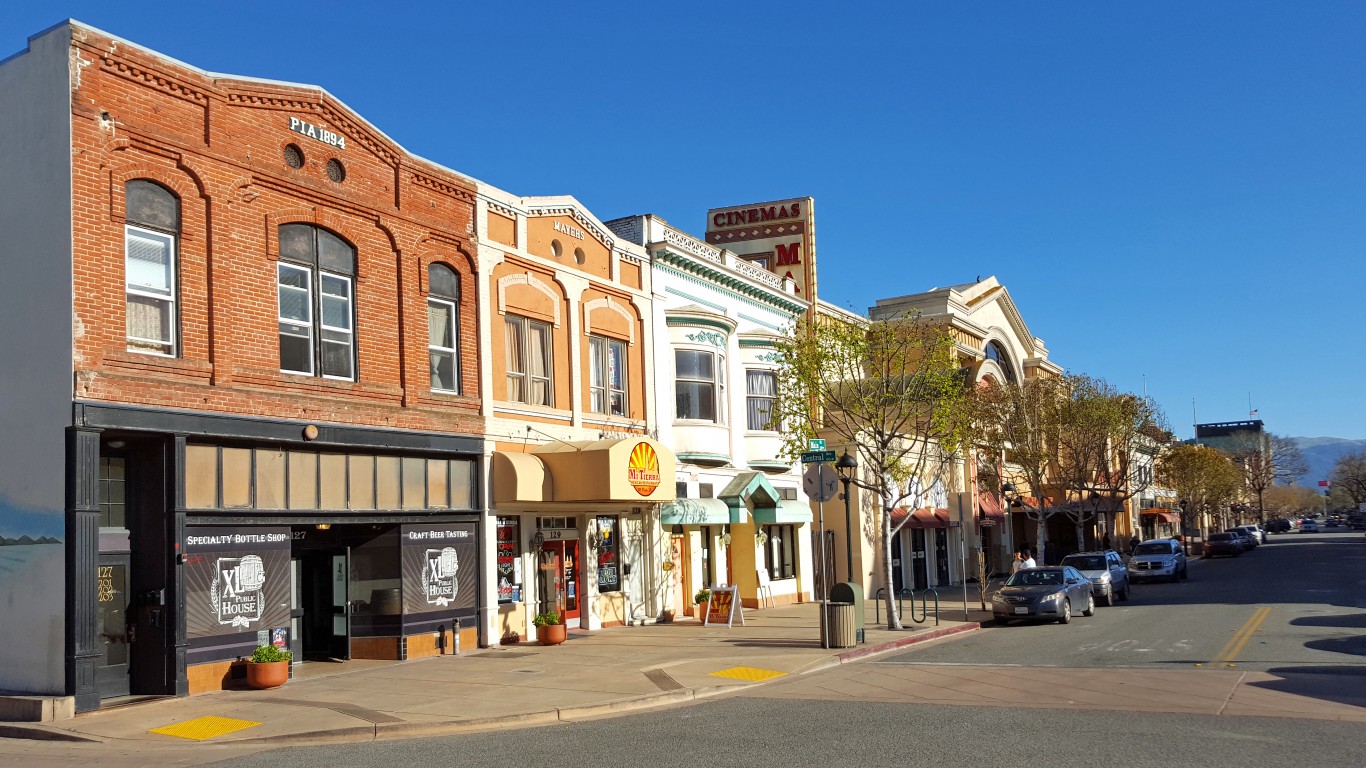
22. Salinas, CA
> Change in reported larceny-theft rate, 2019-2020: +46.8
> Larceny-thefts reported in 2020: 4,736 – 81st highest of 203 metros
> Larceny-thefts per 100K people in 2020: 1,097.0 – 55th lowest of 203 metros
> 1-yr. change in all property crime: +9.3 – 36th highest of 188 metros
> Property crimes per 100K people in 2020: 1,790.1 – 78th lowest of 199 metros
> Population: 434,061
[in-text-ad-2]
21. Appleton, WI
> Change in reported larceny-theft rate, 2019-2020: +50.2
> Larceny-thefts reported in 2020: 2,319 – 64th lowest of 203 metros
> Larceny-thefts per 100K people in 2020: 969.7 – 39th lowest of 203 metros
> 1-yr. change in all property crime: +81.3 – 24th highest of 188 metros
> Property crimes per 100K people in 2020: 1,170.0 – 26th lowest of 199 metros
> Population: 237,974

20. Staunton, VA
> Change in reported larceny-theft rate, 2019-2020: +57.2
> Larceny-thefts reported in 2020: 1,438 – 31st lowest of 203 metros
> Larceny-thefts per 100K people in 2020: 1,163.7 – 64th lowest of 203 metros
> 1-yr. change in all property crime: +37.6 – 31st highest of 188 metros
> Property crimes per 100K people in 2020: 1,466.4 – 48th lowest of 199 metros
> Population: 123,120
[in-text-ad]

19. Raleigh-Cary, NC
> Change in reported larceny-theft rate, 2019-2020: +58.4
> Larceny-thefts reported in 2020: 16,068 – 25th highest of 203 metros
> Larceny-thefts per 100K people in 2020: 1,129.7 – 60th lowest of 203 metros
> 1-yr. change in all property crime: +106.6 – 19th highest of 188 metros
> Property crimes per 100K people in 2020: 1,504.3 – 55th lowest of 199 metros
> Population: 1,390,785
[recirclink id=1017922]

18. Idaho Falls, ID
> Change in reported larceny-theft rate, 2019-2020: +81.4
> Larceny-thefts reported in 2020: 1,241 – 21st lowest of 203 metros
> Larceny-thefts per 100K people in 2020: 801.7 – 15th lowest of 203 metros
> 1-yr. change in all property crime: +199.1 – 14th highest of 188 metros
> Property crimes per 100K people in 2020: 1,288.2 – 34th lowest of 199 metros
> Population: 151,516

17. Akron, OH
> Change in reported larceny-theft rate, 2019-2020: +89.0
> Larceny-thefts reported in 2020: 11,389 – 38th highest of 203 metros
> Larceny-thefts per 100K people in 2020: 1,620.9 – 62nd highest of 203 metros
> 1-yr. change in all property crime: +86.9 – 22nd highest of 188 metros
> Property crimes per 100K people in 2020: 2,139.4 – 78th highest of 199 metros
> Population: 703,479
[in-text-ad-2]
16. Fond du Lac, WI
> Change in reported larceny-theft rate, 2019-2020: +98.1
> Larceny-thefts reported in 2020: 1,003 – 10th lowest of 203 metros
> Larceny-thefts per 100K people in 2020: 968.9 – 38th lowest of 203 metros
> 1-yr. change in all property crime: +49.9 – 29th highest of 188 metros
> Property crimes per 100K people in 2020: 1,146.7 – 19th lowest of 199 metros
> Population: 103,403

15. Eau Claire, WI
> Change in reported larceny-theft rate, 2019-2020: +101.7
> Larceny-thefts reported in 2020: 2,227 – 61st lowest of 203 metros
> Larceny-thefts per 100K people in 2020: 1,309.8 – 88th lowest of 203 metros
> 1-yr. change in all property crime: +200.4 – 13th highest of 188 metros
> Property crimes per 100K people in 2020: 1,735.6 – 73rd lowest of 199 metros
> Population: 169,304
[in-text-ad]

14. Boulder, CO
> Change in reported larceny-theft rate, 2019-2020: +122.0
> Larceny-thefts reported in 2020: 6,723 – 58th highest of 203 metros
> Larceny-thefts per 100K people in 2020: 2,051.3 – 20th highest of 203 metros
> 1-yr. change in all property crime: +314.5 – 7th highest of 188 metros
> Property crimes per 100K people in 2020: 2,760.1 – 26th highest of 199 metros
> Population: 326,196
[recirclink id=1039645]

13. Oshkosh-Neenah, WI
> Change in reported larceny-theft rate, 2019-2020: +136.9
> Larceny-thefts reported in 2020: 1,808 – 45th lowest of 203 metros
> Larceny-thefts per 100K people in 2020: 1,049.3 – 50th lowest of 203 metros
> 1-yr. change in all property crime: +152.9 – 15th highest of 188 metros
> Property crimes per 100K people in 2020: 1,325.0 – 37th lowest of 199 metros
> Population: 171,907

12. Bellingham, WA
> Change in reported larceny-theft rate, 2019-2020: +140.0
> Larceny-thefts reported in 2020: 4,129 – 92nd highest of 203 metros
> Larceny-thefts per 100K people in 2020: 1,781.4 – 40th highest of 203 metros
> 1-yr. change in all property crime: +254.4 – 10th highest of 188 metros
> Property crimes per 100K people in 2020: 2,355.2 – 51st highest of 199 metros
> Population: 229,247
[in-text-ad-2]

11. Dubuque, IA
> Change in reported larceny-theft rate, 2019-2020: +158.8
> Larceny-thefts reported in 2020: 1,004 – 11th lowest of 203 metros
> Larceny-thefts per 100K people in 2020: 1,029.2 – 47th lowest of 203 metros
> 1-yr. change in all property crime: +257.1 – 9th highest of 188 metros
> Property crimes per 100K people in 2020: 1,397.2 – 45th lowest of 199 metros
> Population: 97,311

10. Kennewick-Richland, WA
> Change in reported larceny-theft rate, 2019-2020: +188.0
> Larceny-thefts reported in 2020: 5,010 – 79th highest of 203 metros
> Larceny-thefts per 100K people in 2020: 1,648.2 – 55th highest of 203 metros
> 1-yr. change in all property crime: +314.1 – 8th highest of 188 metros
> Property crimes per 100K people in 2020: 2,259.8 – 59th highest of 199 metros
> Population: 299,612
[in-text-ad]
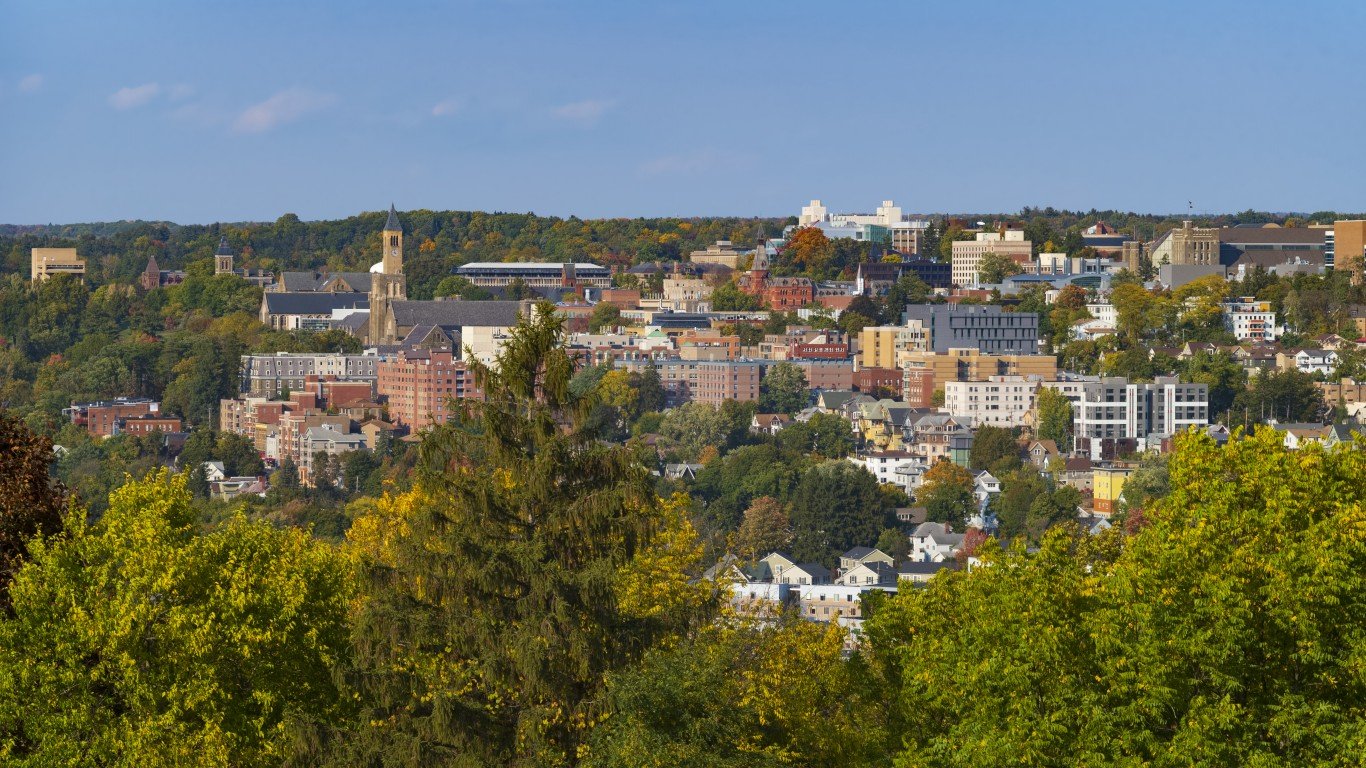
9. Ithaca, NY
> Change in reported larceny-theft rate, 2019-2020: +190.3
> Larceny-thefts reported in 2020: 1,660 – 42nd lowest of 203 metros
> Larceny-thefts per 100K people in 2020: 1,634.2 – 58th highest of 203 metros
> 1-yr. change in all property crime: +226.5 – 12th highest of 188 metros
> Property crimes per 100K people in 2020: 1,894.1 – 92nd lowest of 199 metros
> Population: 102,180
[recirclink id=1066891]

8. Grand Junction, CO
> Change in reported larceny-theft rate, 2019-2020: +193.4
> Larceny-thefts reported in 2020: 3,361 – 98th lowest of 203 metros
> Larceny-thefts per 100K people in 2020: 2,180.7 – 14th highest of 203 metros
> 1-yr. change in all property crime: +443.3 – 6th highest of 188 metros
> Property crimes per 100K people in 2020: 2,980.7 – 18th highest of 199 metros
> Population: 154,210

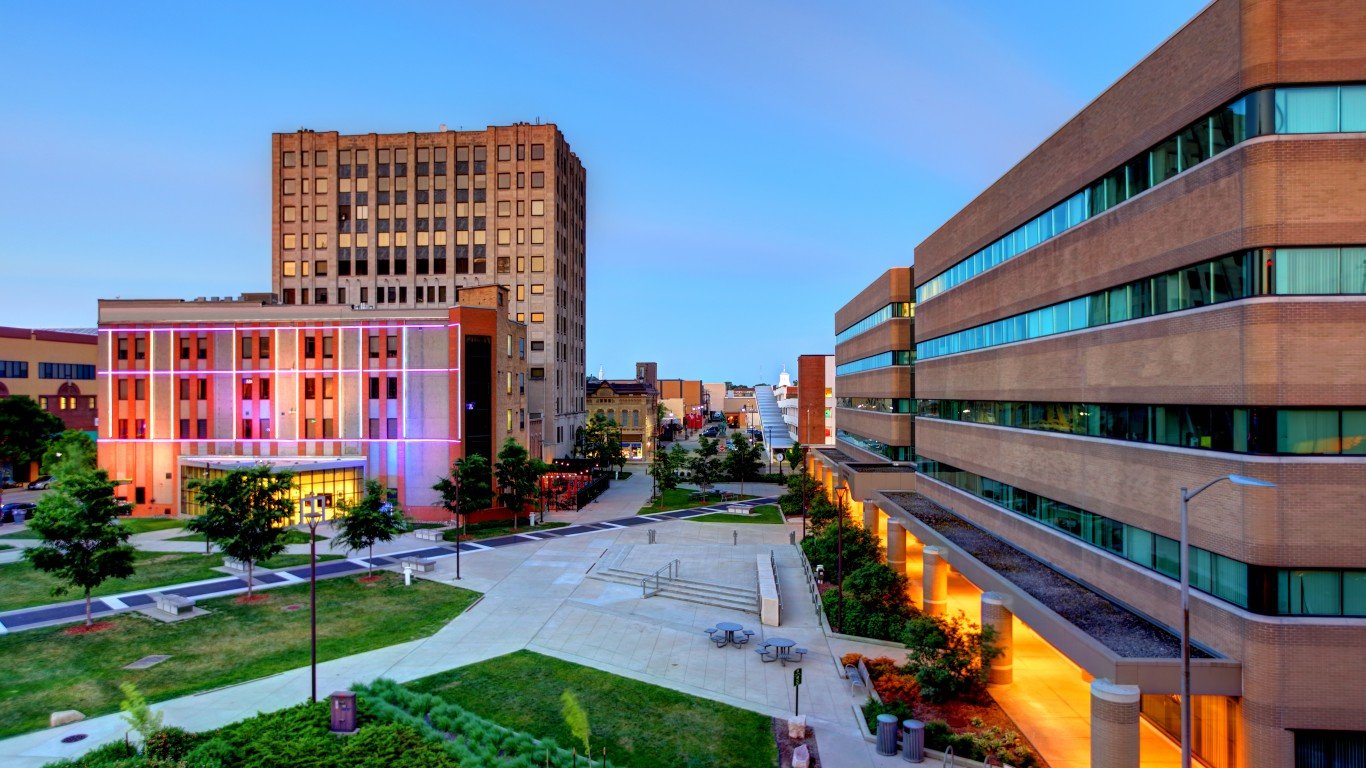
7. Springfield, OH
> Change in reported larceny-theft rate, 2019-2020: +235.1
> Larceny-thefts reported in 2020: 2,719 – 79th lowest of 203 metros (tied)
> Larceny-thefts per 100K people in 2020: 2,037.4 – 21st highest of 203 metros
> 1-yr. change in all property crime: +246.8 – 11th highest of 188 metros
> Property crimes per 100K people in 2020: 2,901.3 – 21st highest of 199 metros
> Population: 134,083
[in-text-ad-2]

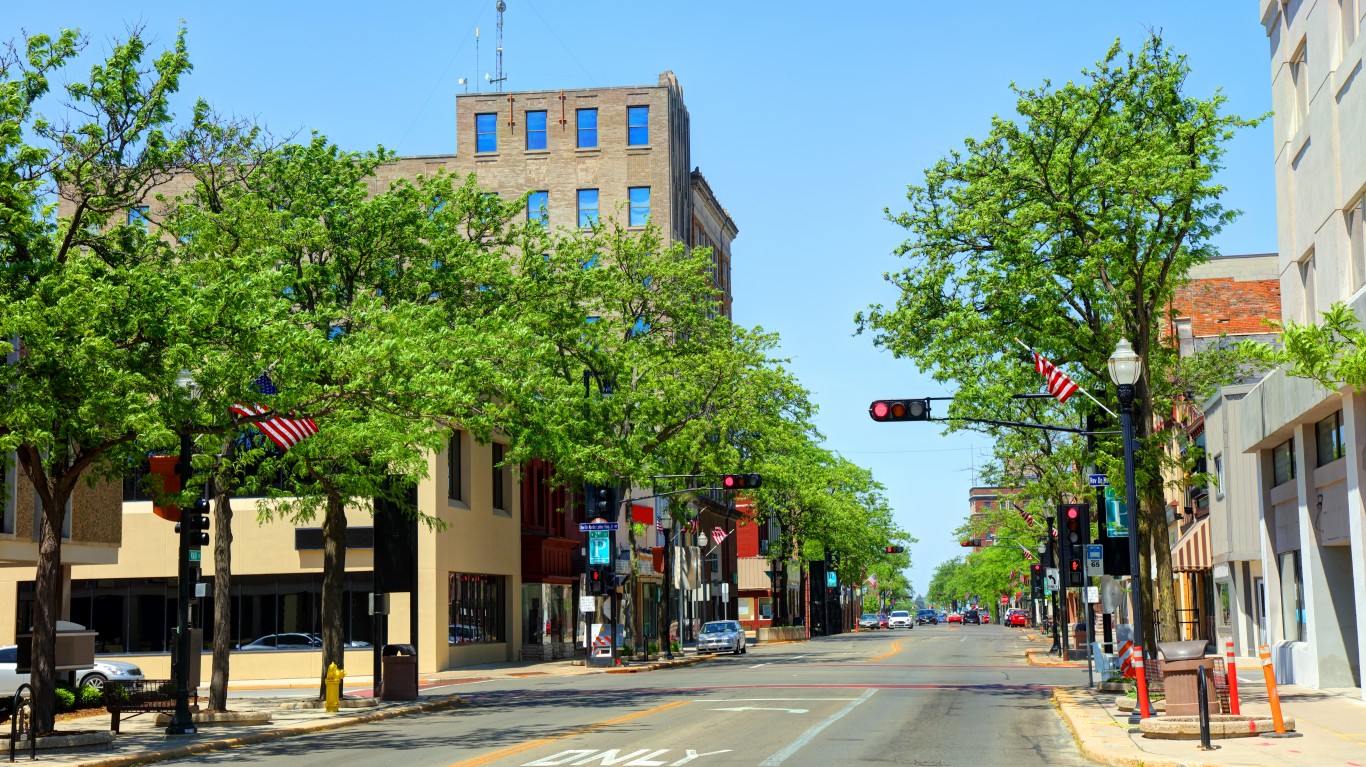
6. Fargo, ND-MN
> Change in reported larceny-theft rate, 2019-2020: +247.2
> Larceny-thefts reported in 2020: 4,690 – 82nd highest of 203 metros
> Larceny-thefts per 100K people in 2020: 1,888.3 – 28th highest of 203 metros
> 1-yr. change in all property crime: +490.7 – 4th highest of 188 metros
> Property crimes per 100K people in 2020: 2,829.3 – 25th highest of 199 metros
> Population: 246,145

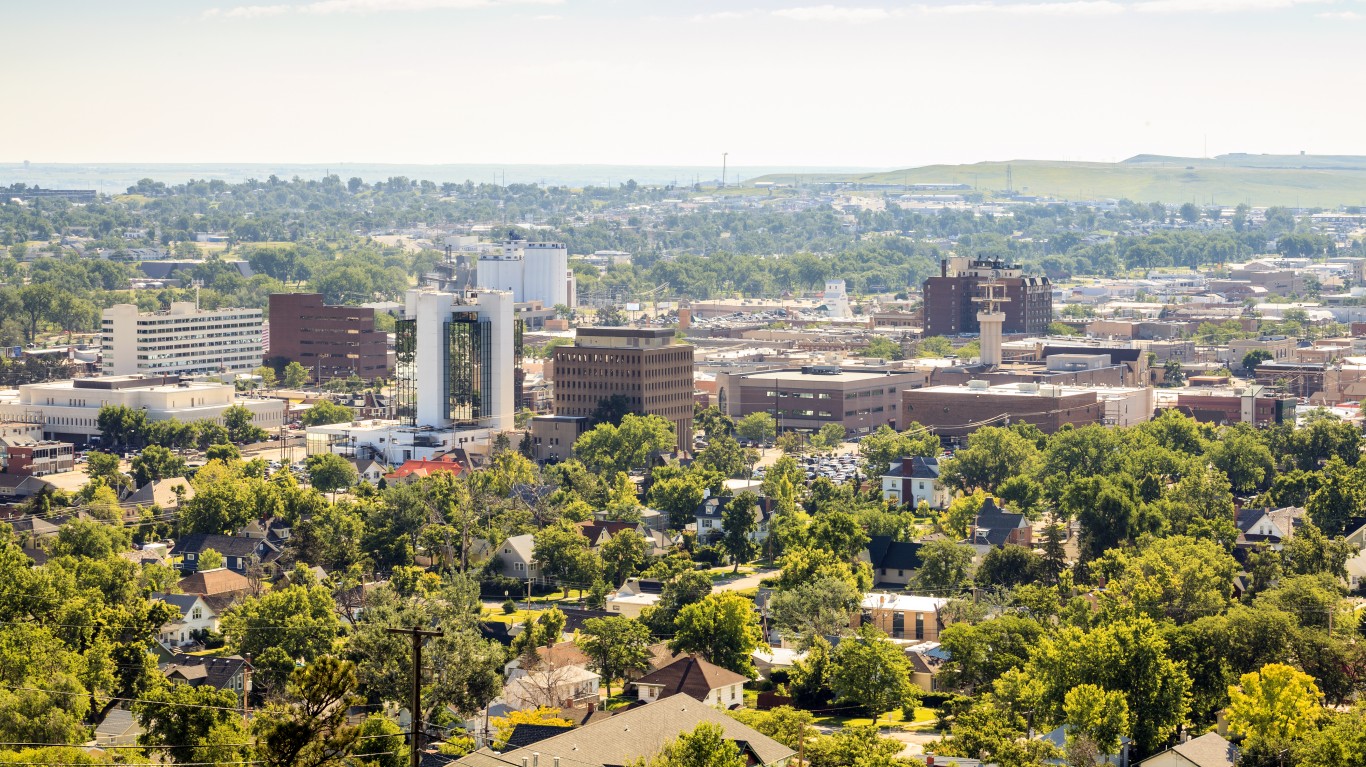
5. Billings, MT
> Change in reported larceny-theft rate, 2019-2020: +248.0
> Larceny-thefts reported in 2020: 4,512 – 85th highest of 203 metros
> Larceny-thefts per 100K people in 2020: 2,456.1 – 9th highest of 203 metros
> 1-yr. change in all property crime: +459.4 – 5th highest of 188 metros
> Property crimes per 100K people in 2020: 3,471.9 – 11th highest of 199 metros
> Population: 181,667
[in-text-ad]

4. Hartford-East Hartford-Middletown, CT
> Change in reported larceny-theft rate, 2019-2020: +260.8
> Larceny-thefts reported in 2020: 16,043 – 26th highest of 203 metros
> Larceny-thefts per 100K people in 2020: 1,581.1 – 71st highest of 203 metros
> 1-yr. change in all property crime: N/A
> Property crimes per 100K people in 2020: 2,088.9 – 84th highest of 199 metros
> Population: 1,204,877
[recirclink id=1025193]
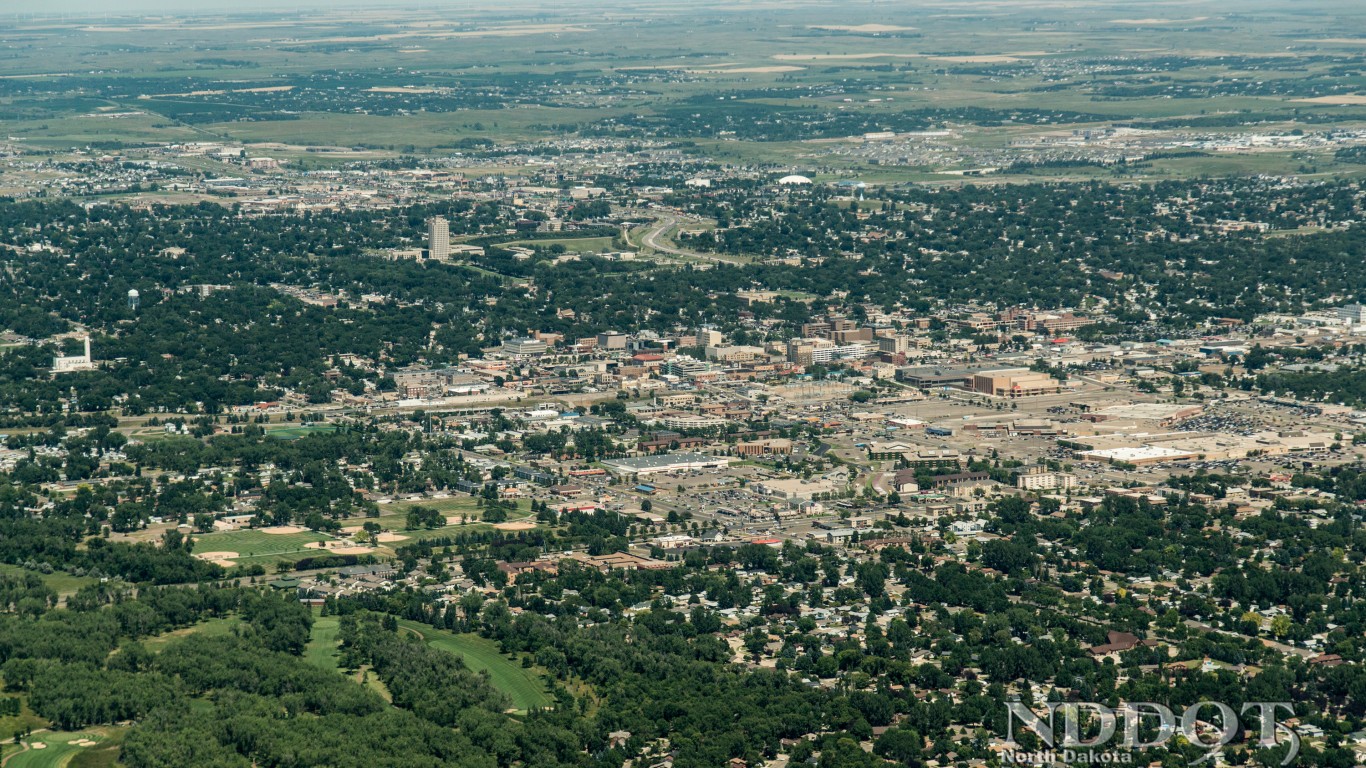
3. Bismarck, ND
> Change in reported larceny-theft rate, 2019-2020: +283.5
> Larceny-thefts reported in 2020: 2,677 – 78th lowest of 203 metros
> Larceny-thefts per 100K people in 2020: 2,064.4 – 16th highest of 203 metros
> 1-yr. change in all property crime: +532.4 – 2nd highest of 188 metros
> Property crimes per 100K people in 2020: 2,847.1 – 24th highest of 199 metros
> Population: 129,115

2. Greeley, CO
> Change in reported larceny-theft rate, 2019-2020: +320.6
> Larceny-thefts reported in 2020: 5,076 – 77th highest of 203 metros
> Larceny-thefts per 100K people in 2020: 1,532.2 – 82nd highest of 203 metros
> 1-yr. change in all property crime: +530.5 – 3rd highest of 188 metros
> Property crimes per 100K people in 2020: 2,162.8 – 69th highest of 199 metros
> Population: 324,492
[in-text-ad-2]
1. Rapid City, SD
> Change in reported larceny-theft rate, 2019-2020: +327.4
> Larceny-thefts reported in 2020: 2,804 – 82nd lowest of 203 metros
> Larceny-thefts per 100K people in 2020: 1,948.8 – 26th highest of 203 metros
> 1-yr. change in all property crime: +568.2 – the highest of 188 metros
> Property crimes per 100K people in 2020: 2,971.1 – 19th highest of 199 metros
> Population: 142,191
Methodology
To determine the metro areas where the larceny-theft rate is rising fastest, 24/7 Wall St. reviewed the change in larceny-thefts per 100,000 people from the FBI’s 2019 and 2020 Uniform Crime Reports. Crime rates were calculated using population figures provided by the FBI in the 2020 and 2019 UCR.
Limited data was available in the 2020 UCR for areas in Alabama, Maryland, Pennsylvania, and Illinois, though metro areas in these states were not excluded from analysis. Only metro areas for which the boundaries defined by the FBI match the boundaries as defined by the U.S. Census Bureau were considered. Because some state and local agencies changed reporting practices between 2019 and 2020, the figures are not comparable, and the areas were excluded.
Population figures are five-year estimates from the U.S. Census Bureau’s 2019 American Community Survey.
Contact [email protected] for any questions or corrections.