Motor vehicle theft, one of the most serious offenses tracked by the FBI, is on the rise in the United States. There were a total of 810,400 motor vehicle thefts nationwide in 2020, up 12% from the previous year and the most in over a decade.
Motor vehicle theft can be either the theft or attempted theft of a vehicle, such as a car or ATV. Some experts attribute the rising rates of vehicle theft to the COVID-19 pandemic, which led to vehicles sitting unattended and unused for longer stretches than usual. Here is a look at the 10 most stolen cars in America.
While cases of motor vehicle theft are surging across the country, some American towns are bucking the national trend, reporting substantial year-over-year declines in vehicle theft cases per capita.
Using data from the FBI’s 2020 Uniform Crime Report, 24/7 Wall St. identified the 50 towns where vehicle theft is falling fastest. Towns – defined as places with populations between 2,500 and 25,000 – are ranked by the year-over-year change in the number of reported vehicle thefts per 100,000 people. Among the towns on this list, the vehicle theft rate fell anywhere from 198 incidents per 100,000 people to 827 per 100,000 people. Meanwhile, the national motor vehicle theft rate climbed by 25 incidents per 100,000 people in 2020.
Vehicle theft – along with larceny and burglary – is one component of the overall property crime category. Partially due to falling rates of vehicle theft, most towns on this list also reported a decline in the overall property crime rate in 2020. Here is a look at the cities where property crime is falling fastest.
Most of the towns that reported the largest declines in vehicle thefts per capita are in the South, including seven in Texas alone. Despite the decline in cases of vehicle theft, in nearly half of the towns on this list, the vehicle theft rate remains higher than the national rate of 246 per 100,000 people.
Click here to see towns where the motor vehicle theft rate is falling
Click here to see our detailed methodology

50. Lake Delton, Wisconsin
> Change in reported vehicle theft rate, 2019-2020: -198.2
> Vehicle-thefts reported in 2020: 12 — 1,055th highest of 2,899 towns (tied)
> Vehicle-thefts per 100K people in 2020: 400.8 — 182nd highest of 2,899 towns
> 1-yr. change in all property crime: -6,356.8 — 3rd lowest of 2,654 towns
> Property crimes per 100K people in 2020: 8,884.4 — 12th highest of 2,663 towns
> Population: 2,989
[in-text-ad]

49. Mount Healthy, Ohio
> Change in reported vehicle theft rate, 2019-2020: -201.7
> Vehicle-thefts reported in 2020: 12 — 1,055th highest of 2,899 towns (tied)
> Vehicle-thefts per 100K people in 2020: 178.3 — 927th highest of 2,899 towns
> 1-yr. change in all property crime: -1,203.8 — 115th lowest of 2,654 towns
> Property crimes per 100K people in 2020: 3,819.3 — 238th highest of 2,663 towns
> Population: 6,767
[recirclink id=1016086]

48. Bethel, Alaska
> Change in reported vehicle theft rate, 2019-2020: -202.0
> Vehicle-thefts reported in 2020: 15 — 874th highest of 2,899 towns (tied)
> Vehicle-thefts per 100K people in 2020: 225.8 — 660th highest of 2,899 towns
> 1-yr. change in all property crime: -948.2 — 184th lowest of 2,654 towns
> Property crimes per 100K people in 2020: 1,069.0 — 901st lowest of 2,663 towns
> Population: 6,472

47. West Park, Florida
> Change in reported vehicle theft rate, 2019-2020: -202.6
> Vehicle-thefts reported in 2020: 40 — 253rd highest of 2,899 towns (tied)
> Vehicle-thefts per 100K people in 2020: 263.1 — 511th highest of 2,899 towns
> 1-yr. change in all property crime: -972.2 — 175th lowest of 2,654 towns
> Property crimes per 100K people in 2020: 1,848.2 — 1,038th highest of 2,663 towns
> Population: 15,012
[in-text-ad-2]
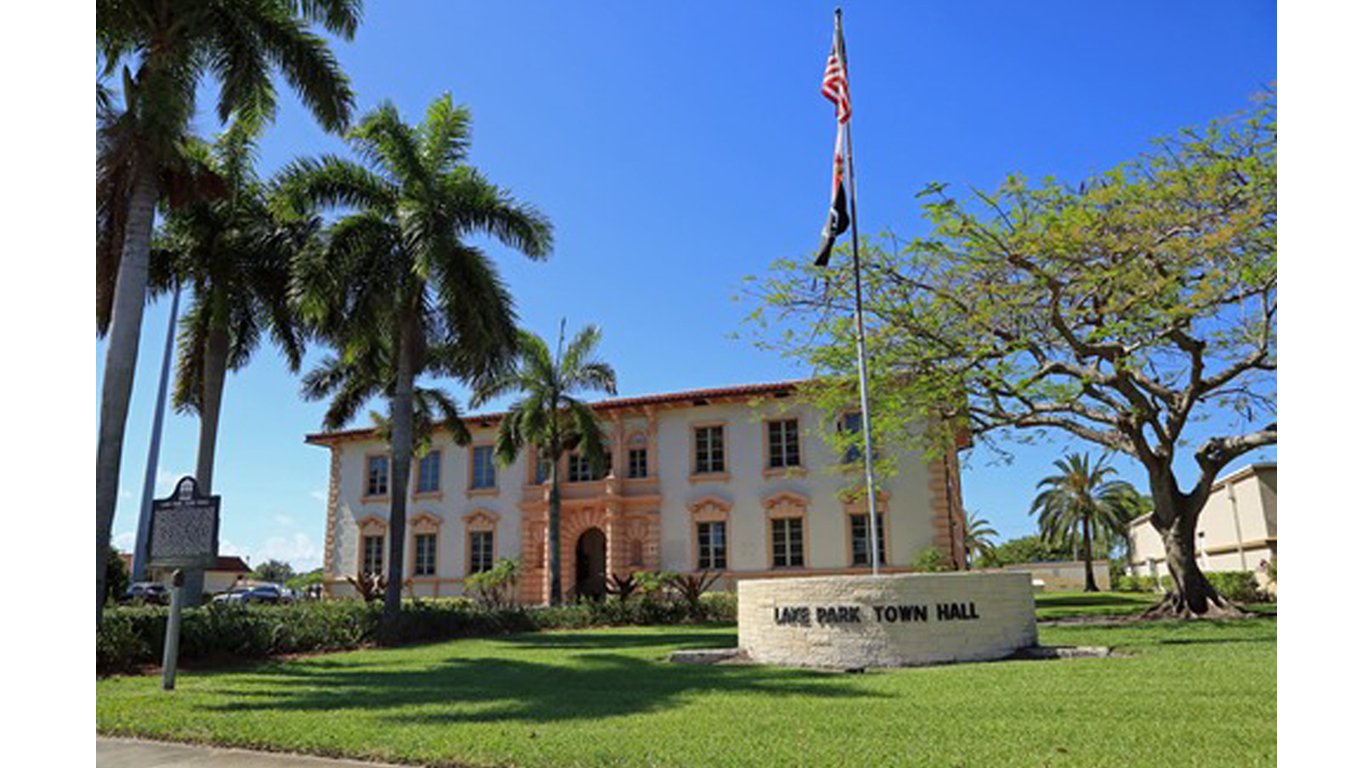
46. Lake Park, Florida
> Change in reported vehicle theft rate, 2019-2020: -204.7
> Vehicle-thefts reported in 2020: 37 — 287th highest of 2,899 towns (tied)
> Vehicle-thefts per 100K people in 2020: 429.6 — 156th highest of 2,899 towns
> 1-yr. change in all property crime: -1,304.2 — 95th lowest of 2,654 towns
> Property crimes per 100K people in 2020: 6,769.6 — 30th highest of 2,663 towns
> Population: 8,508

45. North Myrtle Beach, South Carolina
> Change in reported vehicle theft rate, 2019-2020: -205.9
> Vehicle-thefts reported in 2020: 63 — 108th highest of 2,899 towns (tied)
> Vehicle-thefts per 100K people in 2020: 366.6 — 250th highest of 2,899 towns
> 1-yr. change in all property crime: -779.0 — 263rd lowest of 2,654 towns
> Property crimes per 100K people in 2020: 5,802.2 — 61st highest of 2,663 towns
> Population: 16,200
[in-text-ad]

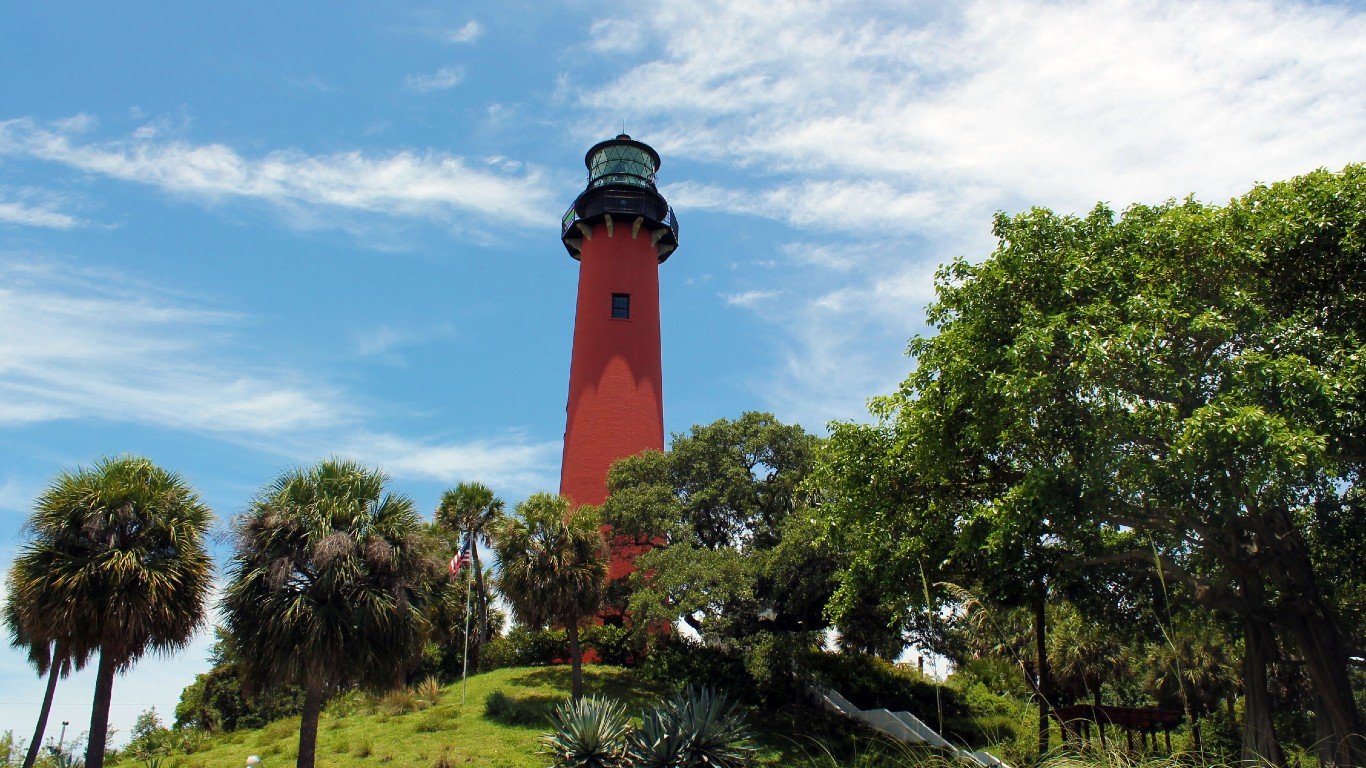
44. Hypoluxo, Florida
> Change in reported vehicle theft rate, 2019-2020: -213.7
> Vehicle-thefts reported in 2020: 0 reported — the lowest of 2,899 towns (tied)
> Vehicle-thefts per 100K people in 2020: 0.0 reported — the lowest of 2,899 towns (tied)
> 1-yr. change in all property crime: +41.4 — 952nd highest of 2,654 towns
> Property crimes per 100K people in 2020: 1,394.7 — 1,234th lowest of 2,663 towns
> Population: 2,781
[recirclink id=1062431]
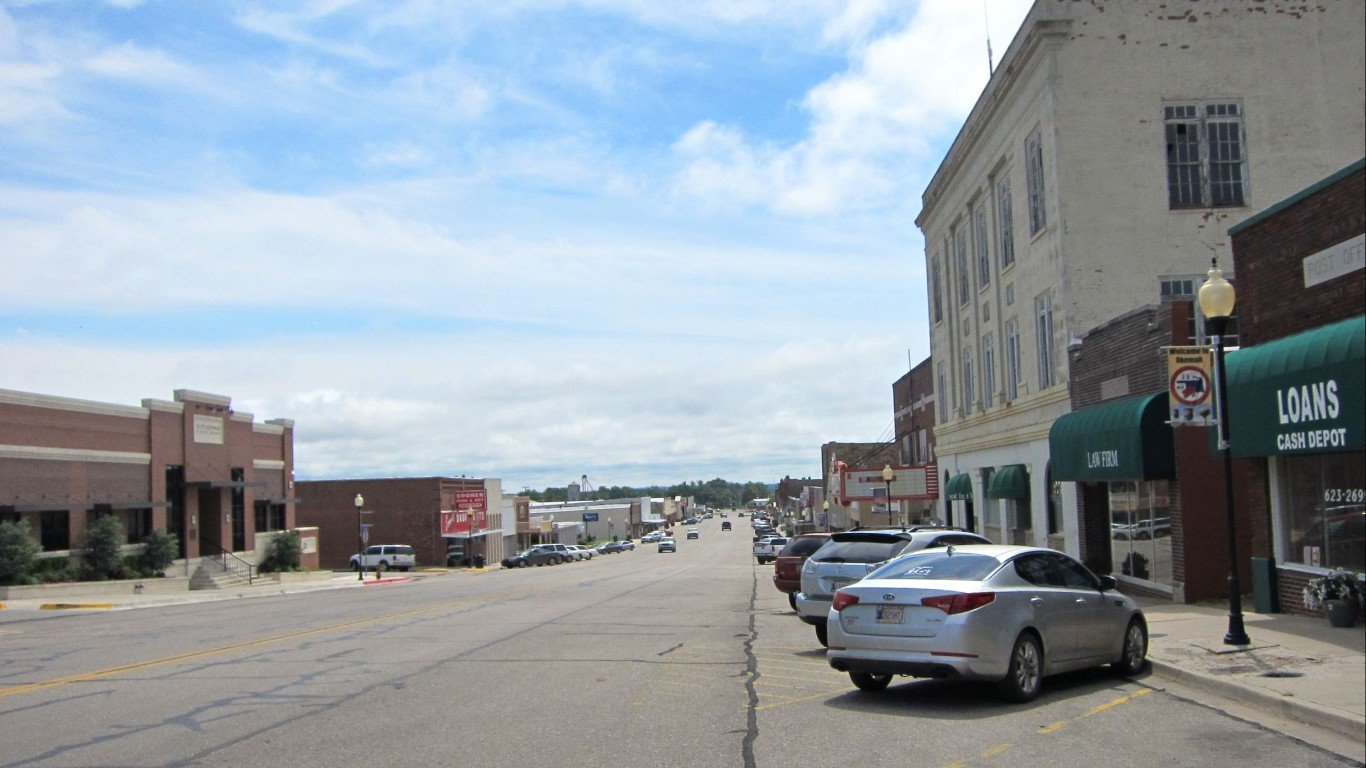
43. Okemah, Oklahoma
> Change in reported vehicle theft rate, 2019-2020: -216.1
> Vehicle-thefts reported in 2020: 10 — 1,208th highest of 2,899 towns (tied)
> Vehicle-thefts per 100K people in 2020: 320.5 — 330th highest of 2,899 towns (tied)
> 1-yr. change in all property crime: -2,380.5 — 17th lowest of 2,654 towns
> Property crimes per 100K people in 2020: 3,301.3 — 365th highest of 2,663 towns
> Population: 3,178

42. Williston, Florida
> Change in reported vehicle theft rate, 2019-2020: -222.4
> Vehicle-thefts reported in 2020: 5 — 969th lowest of 2,899 towns (tied)
> Vehicle-thefts per 100K people in 2020: 183.0 — 894th highest of 2,899 towns
> 1-yr. change in all property crime: +48.9 — 935th highest of 2,654 towns
> Property crimes per 100K people in 2020: 3,550.5 — 306th highest of 2,663 towns
> Population: 2,699
[in-text-ad-2]
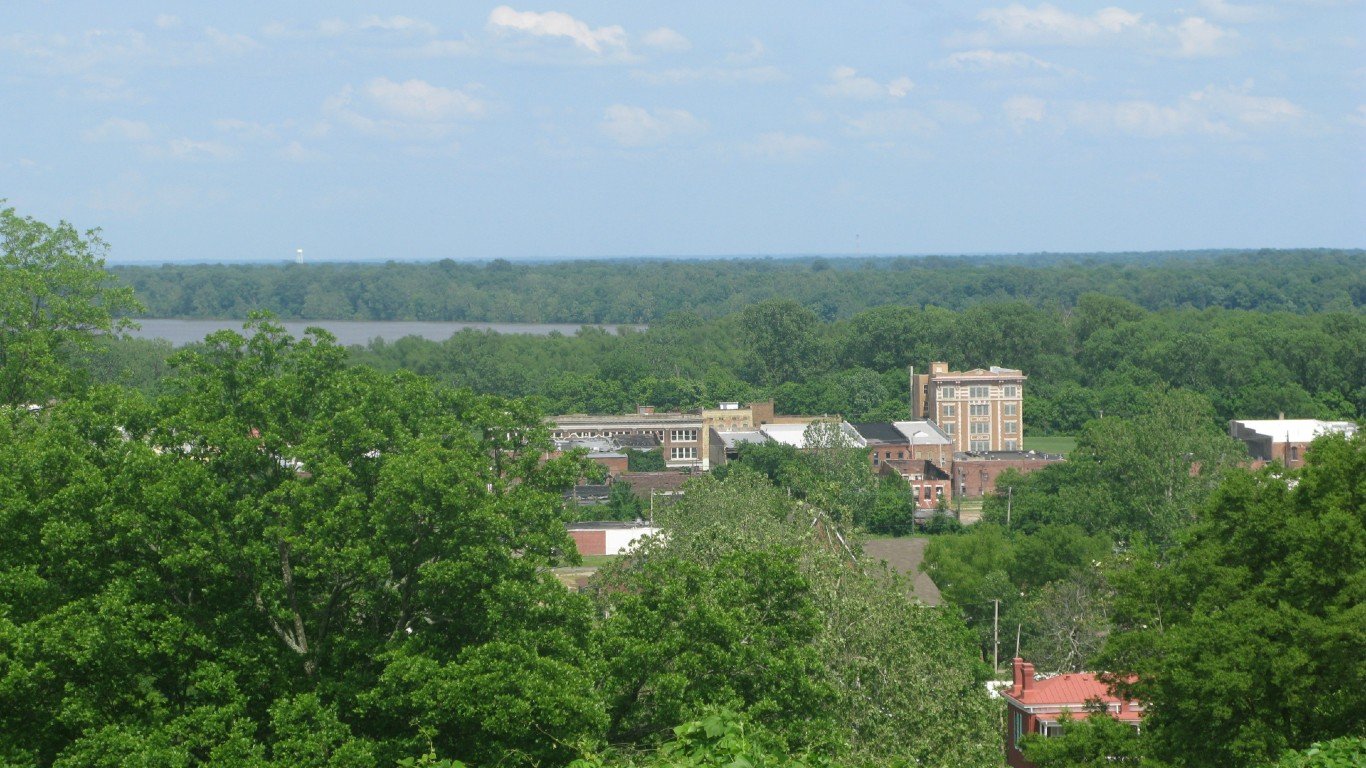
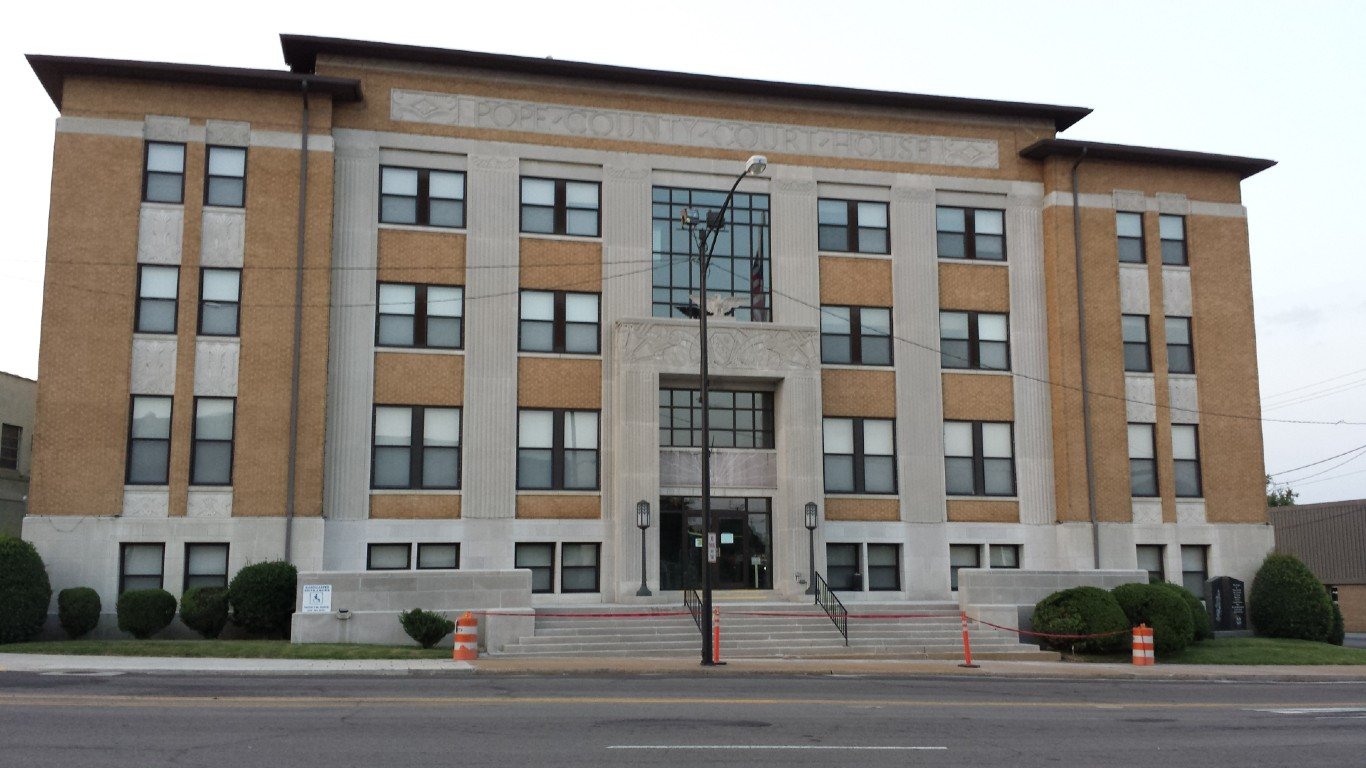
41. Helena-West Helena, Arkansas
> Change in reported vehicle theft rate, 2019-2020: -223.4
> Vehicle-thefts reported in 2020: 24 — 538th highest of 2,899 towns (tied)
> Vehicle-thefts per 100K people in 2020: 238.0 — 612th highest of 2,899 towns
> 1-yr. change in all property crime: -766.1 — 278th lowest of 2,654 towns
> Property crimes per 100K people in 2020: 4,907.8 — 112th highest of 2,663 towns
> Population: 10,749

40. Onalaska, Texas
> Change in reported vehicle theft rate, 2019-2020: -224.7
> Vehicle-thefts reported in 2020: 8 — 1,372nd lowest of 2,899 towns (tied)
> Vehicle-thefts per 100K people in 2020: 266.1 — 500th highest of 2,899 towns
> 1-yr. change in all property crime: -841.4 — 232nd lowest of 2,654 towns
> Property crimes per 100K people in 2020: 1,297.4 — 1,125th lowest of 2,663 towns
> Population: 2,779
[in-text-ad]

39. Pearisburg, Virginia
> Change in reported vehicle theft rate, 2019-2020: -227.1
> Vehicle-thefts reported in 2020: 1 — 182nd lowest of 2,899 towns (tied)
> Vehicle-thefts per 100K people in 2020: 38.2 — 587th lowest of 2,899 towns
> 1-yr. change in all property crime: +1,355.8 — 31st highest of 2,654 towns
> Property crimes per 100K people in 2020: 3,894.6 — 225th highest of 2,663 towns
> Population: 2,652
[recirclink id=1066891]

38. Savannah, Tennessee
> Change in reported vehicle theft rate, 2019-2020: -230.0
> Vehicle-thefts reported in 2020: 20 — 643rd highest of 2,899 towns (tied)
> Vehicle-thefts per 100K people in 2020: 288.7 — 420th highest of 2,899 towns
> 1-yr. change in all property crime: -725.0 — 300th lowest of 2,654 towns
> Property crimes per 100K people in 2020: 5,210.7 — 94th highest of 2,663 towns
> Population: 6,947
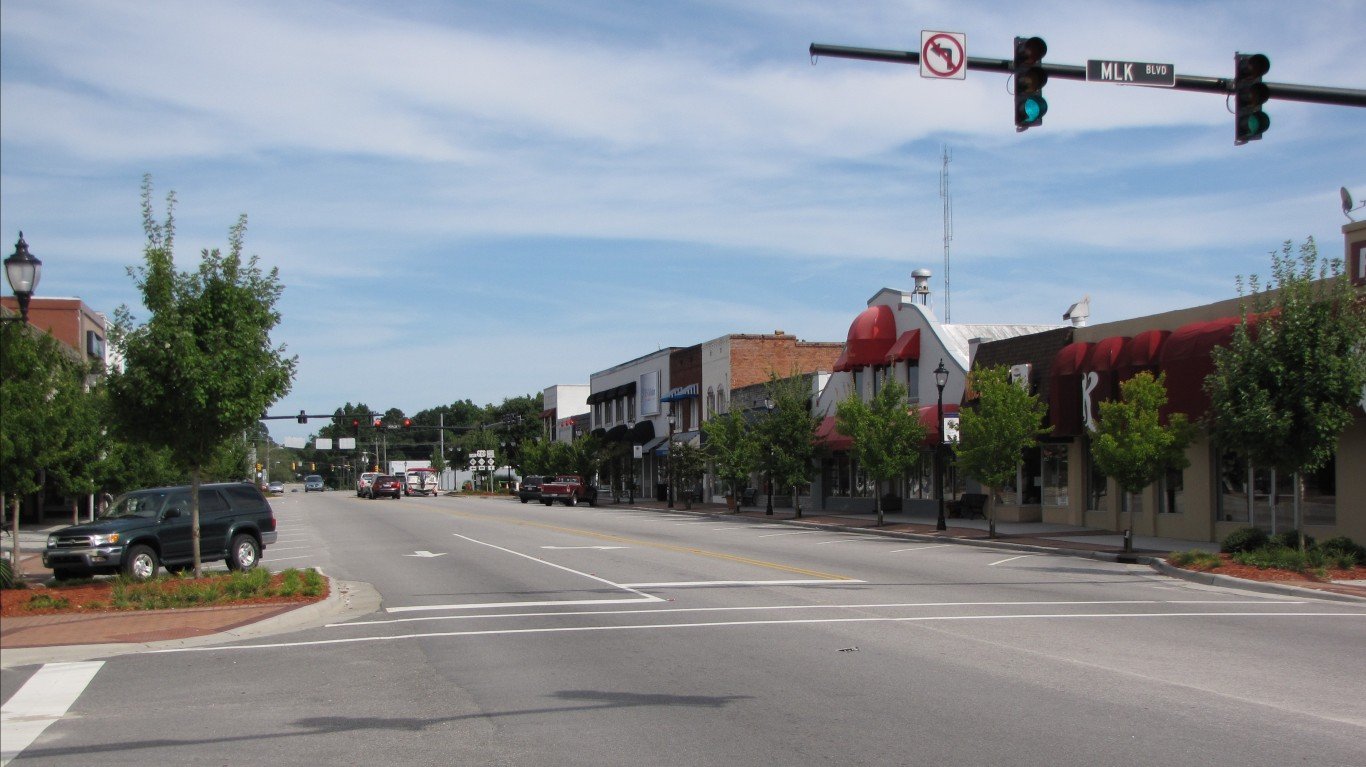
37. Elizabethtown, North Carolina
> Change in reported vehicle theft rate, 2019-2020: -230.4
> Vehicle-thefts reported in 2020: 2 — 409th lowest of 2,899 towns (tied)
> Vehicle-thefts per 100K people in 2020: 59.7 — 872nd lowest of 2,899 towns
> 1-yr. change in all property crime: -2,914.4 — 9th lowest of 2,654 towns
> Property crimes per 100K people in 2020: 3,613.0 — 282nd highest of 2,663 towns
> Population: 3,464
[in-text-ad-2]
36. Atkins, Arkansas
> Change in reported vehicle theft rate, 2019-2020: -230.6
> Vehicle-thefts reported in 2020: 2 — 409th lowest of 2,899 towns (tied)
> Vehicle-thefts per 100K people in 2020: 65.8 — 960th lowest of 2,899 towns
> 1-yr. change in all property crime: -134.0 — 1,233rd lowest of 2,654 towns
> Property crimes per 100K people in 2020: 2,368.4 — 744th highest of 2,663 towns
> Population: 3,048
35. Havana, Illinois
> Change in reported vehicle theft rate, 2019-2020: -231.4
> Vehicle-thefts reported in 2020: 2 — 409th lowest of 2,899 towns (tied)
> Vehicle-thefts per 100K people in 2020: 67.7 — 984th lowest of 2,899 towns
> 1-yr. change in all property crime: N/A
> Property crimes per 100K people in 2020: N/A
> Population: 3,197
[in-text-ad]

34. Fulton, Illinois
> Change in reported vehicle theft rate, 2019-2020: -239.6
> Vehicle-thefts reported in 2020: 2 — 409th lowest of 2,899 towns (tied)
> Vehicle-thefts per 100K people in 2020: 60.7 — 885th lowest of 2,899 towns
> 1-yr. change in all property crime: N/A
> Property crimes per 100K people in 2020: N/A
> Population: 3,178
[recirclink id=1033410]
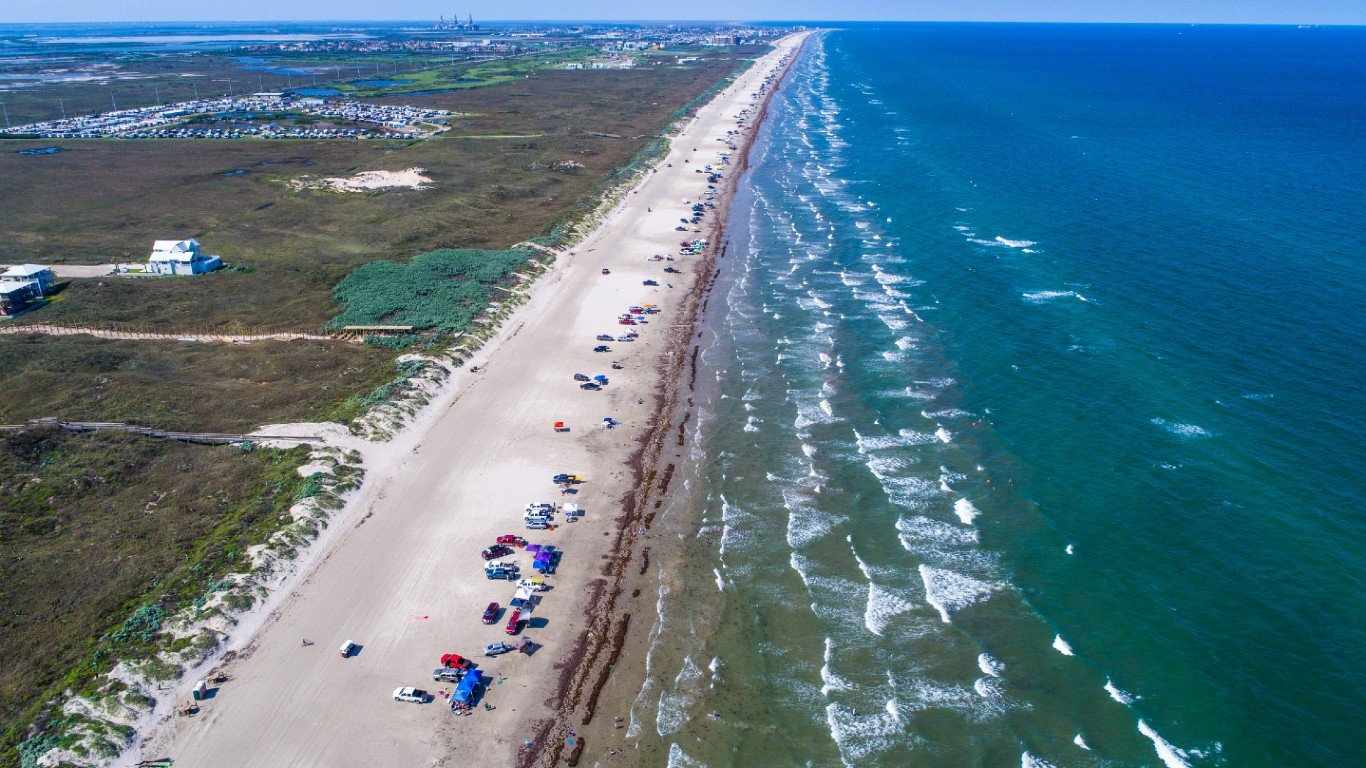
33. Port Aransas, Texas
> Change in reported vehicle theft rate, 2019-2020: -244.1
> Vehicle-thefts reported in 2020: 17 — 777th highest of 2,899 towns (tied)
> Vehicle-thefts per 100K people in 2020: 389.7 — 207th highest of 2,899 towns
> 1-yr. change in all property crime: -364.7 — 696th lowest of 2,654 towns
> Property crimes per 100K people in 2020: 4,447.5 — 151st highest of 2,663 towns
> Population: 4,123

32. Broadview, Illinois
> Change in reported vehicle theft rate, 2019-2020: -245.1
> Vehicle-thefts reported in 2020: 21 — 618th highest of 2,899 towns (tied)
> Vehicle-thefts per 100K people in 2020: 276.9 — 463rd highest of 2,899 towns
> 1-yr. change in all property crime: N/A
> Property crimes per 100K people in 2020: N/A
> Population: 7,755
[in-text-ad-2]

31. Firebaugh, California
> Change in reported vehicle theft rate, 2019-2020: -247.8
> Vehicle-thefts reported in 2020: 16 — 835th highest of 2,899 towns (tied)
> Vehicle-thefts per 100K people in 2020: 191.0 — 842nd highest of 2,899 towns
> 1-yr. change in all property crime: -159.0 — 1,163rd lowest of 2,654 towns
> Property crimes per 100K people in 2020: 1,062.4 — 890th lowest of 2,663 towns
> Population: 8,300
30. Loxahatchee Groves, Florida
> Change in reported vehicle theft rate, 2019-2020: -250.6
> Vehicle-thefts reported in 2020: 8 — 1,372nd lowest of 2,899 towns (tied)
> Vehicle-thefts per 100K people in 2020: 219.8 — 694th highest of 2,899 towns
> 1-yr. change in all property crime: -789.4 — 259th lowest of 2,654 towns
> Property crimes per 100K people in 2020: 2,033.0 — 918th highest of 2,663 towns
> Population: 3,520
[in-text-ad]

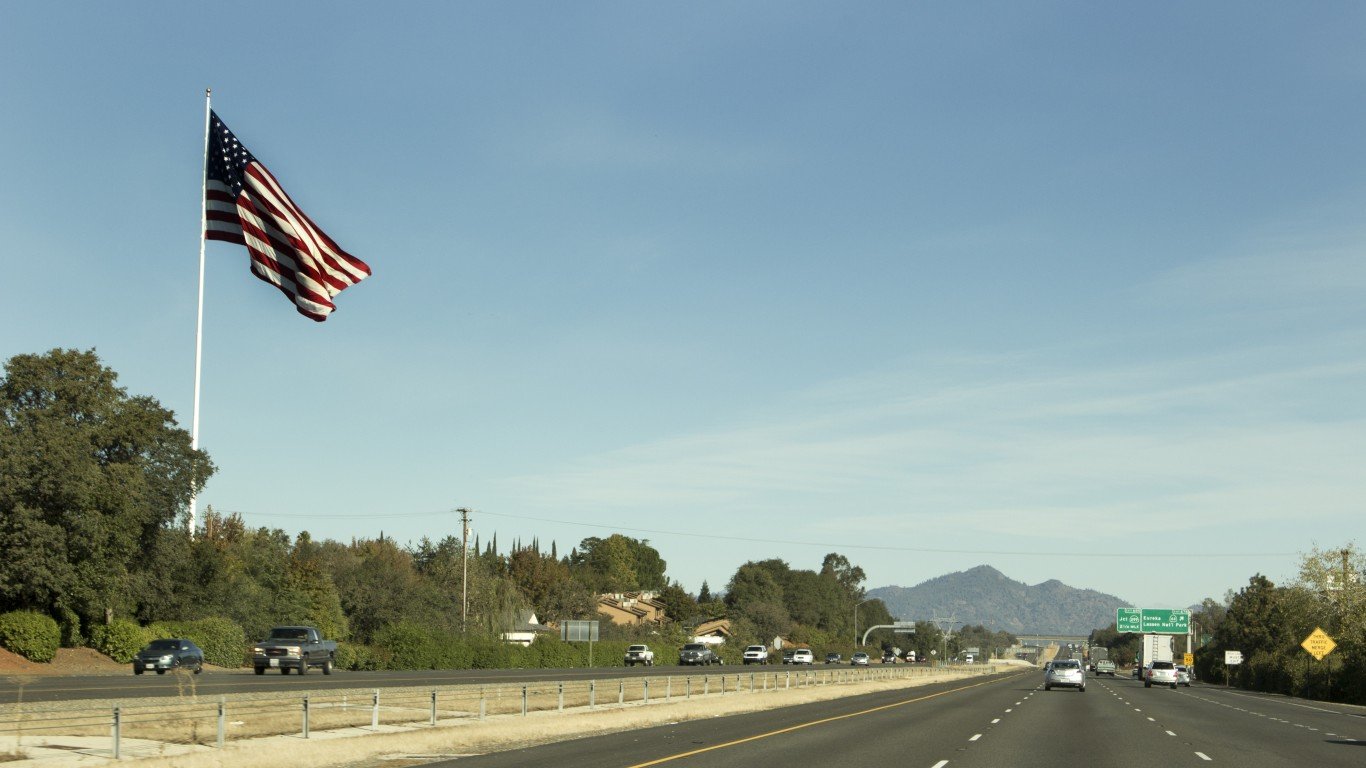
29. Red Bluff, California
> Change in reported vehicle theft rate, 2019-2020: -255.4
> Vehicle-thefts reported in 2020: 80 — 66th highest of 2,899 towns (tied)
> Vehicle-thefts per 100K people in 2020: 548.3 — 75th highest of 2,899 towns
> 1-yr. change in all property crime: -1,134.4 — 130th lowest of 2,654 towns
> Property crimes per 100K people in 2020: 4,366.0 — 162nd highest of 2,663 towns
> Population: 14,264
[recirclink id=1026293]

28. Palmer, Alaska
> Change in reported vehicle theft rate, 2019-2020: -255.8
> Vehicle-thefts reported in 2020: 8 — 1,372nd lowest of 2,899 towns (tied)
> Vehicle-thefts per 100K people in 2020: 104.7 — 1,394th lowest of 2,899 towns
> 1-yr. change in all property crime: -1,624.3 — 45th lowest of 2,654 towns
> Property crimes per 100K people in 2020: 1,099.3 — 925th lowest of 2,663 towns
> Population: 7,131
27. Rockwood, Tennessee
> Change in reported vehicle theft rate, 2019-2020: -255.9
> Vehicle-thefts reported in 2020: 15 — 874th highest of 2,899 towns (tied)
> Vehicle-thefts per 100K people in 2020: 277.3 — 460th highest of 2,899 towns
> 1-yr. change in all property crime: -63.1 — 1,235th highest of 2,654 towns
> Property crimes per 100K people in 2020: 5,415.9 — 81st highest of 2,663 towns
> Population: 5,423
[in-text-ad-2]
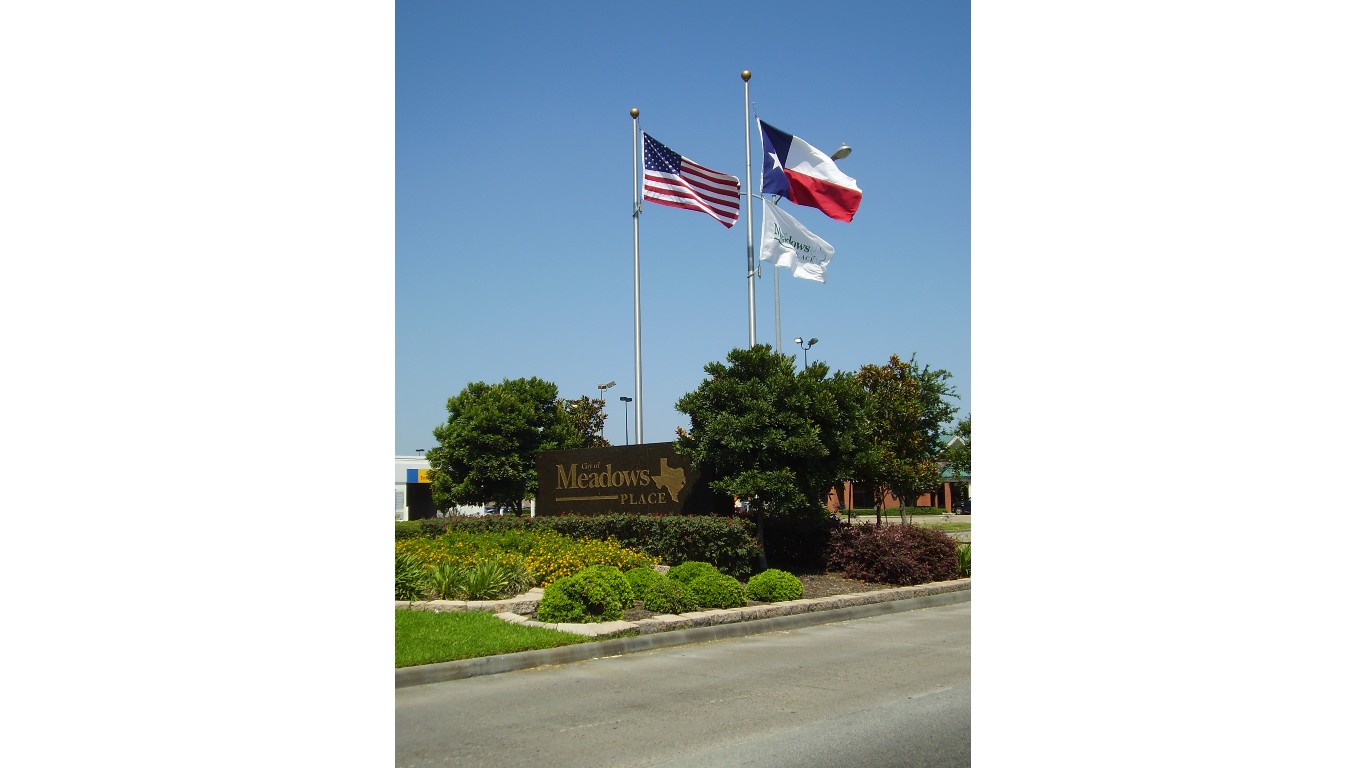
26. Meadows Place, Texas
> Change in reported vehicle theft rate, 2019-2020: -259.8
> Vehicle-thefts reported in 2020: 1 — 182nd lowest of 2,899 towns (tied)
> Vehicle-thefts per 100K people in 2020: 21.8 — 330th lowest of 2,899 towns
> 1-yr. change in all property crime: -175.9 — 1,103rd lowest of 2,654 towns
> Property crimes per 100K people in 2020: 3,030.3 — 452nd highest of 2,663 towns
> Population: 4,653
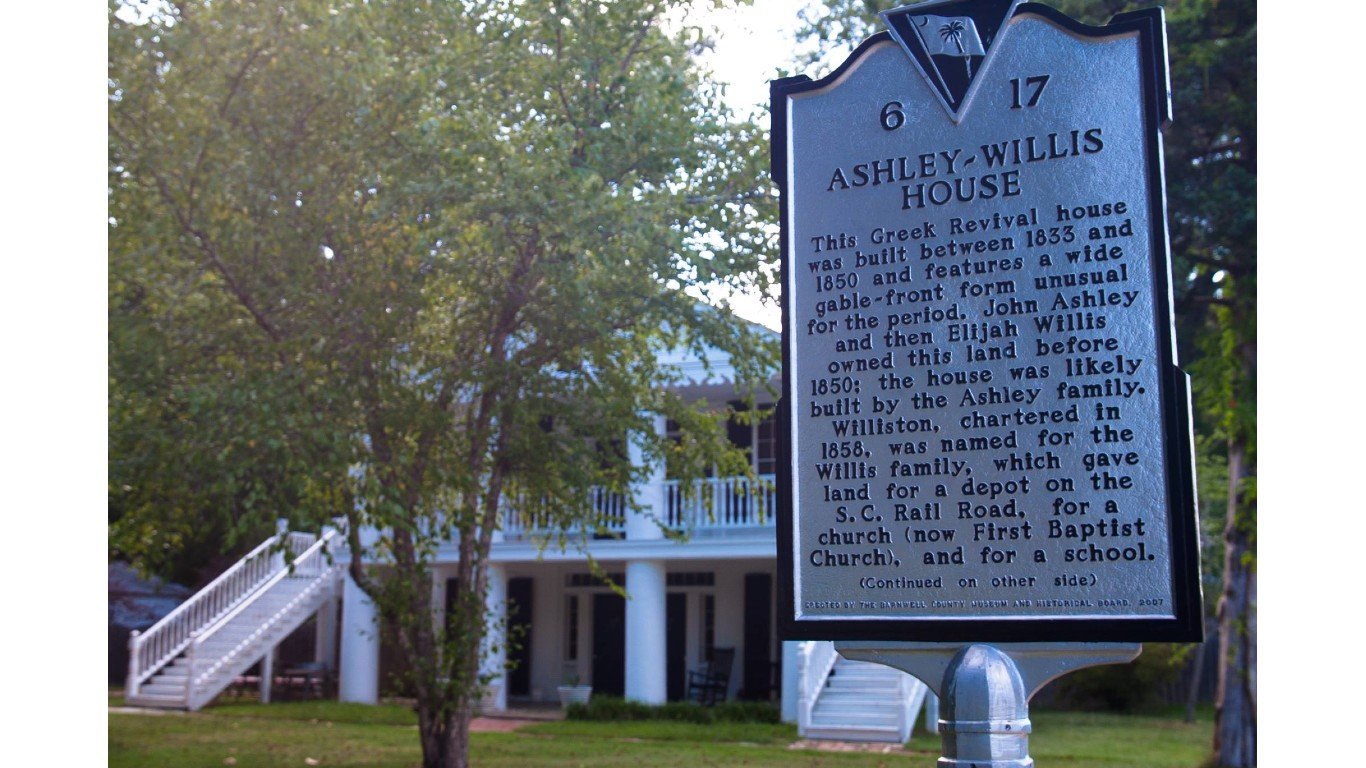
25. Williston, South Carolina
> Change in reported vehicle theft rate, 2019-2020: -274.7
> Vehicle-thefts reported in 2020: 9 — 1,306th highest of 2,899 towns (tied)
> Vehicle-thefts per 100K people in 2020: 310.1 — 362nd highest of 2,899 towns
> 1-yr. change in all property crime: -577.2 — 413th lowest of 2,654 towns
> Property crimes per 100K people in 2020: 4,410.8 — 157th highest of 2,663 towns
> Population: 2,983
[in-text-ad]

24. Bartonville, Illinois
> Change in reported vehicle theft rate, 2019-2020: -275.8
> Vehicle-thefts reported in 2020: 7 — 1,242nd lowest of 2,899 towns (tied)
> Vehicle-thefts per 100K people in 2020: 115.2 — 1,409th highest of 2,899 towns
> 1-yr. change in all property crime: N/A
> Property crimes per 100K people in 2020: N/A
> Population: 6,249
[recirclink id=1016086]

23. Waterford, California
> Change in reported vehicle theft rate, 2019-2020: -277.1
> Vehicle-thefts reported in 2020: 25 — 515th highest of 2,899 towns (tied)
> Vehicle-thefts per 100K people in 2020: 277.2 — 461st highest of 2,899 towns
> 1-yr. change in all property crime: -720.3 — 304th lowest of 2,654 towns
> Property crimes per 100K people in 2020: 864.8 — 660th lowest of 2,663 towns
> Population: 8,877

22. Sparta, Tennessee
> Change in reported vehicle theft rate, 2019-2020: -282.6
> Vehicle-thefts reported in 2020: 11 — 1,135th highest of 2,899 towns (tied)
> Vehicle-thefts per 100K people in 2020: 221.8 — 684th highest of 2,899 towns
> 1-yr. change in all property crime: -1,171.9 — 121st lowest of 2,654 towns
> Property crimes per 100K people in 2020: 3,004.0 — 463rd highest of 2,663 towns
> Population: 4,937
[in-text-ad-2]

21. Richland Hills, Texas
> Change in reported vehicle theft rate, 2019-2020: -282.9
> Vehicle-thefts reported in 2020: 18 — 724th highest of 2,899 towns (tied)
> Vehicle-thefts per 100K people in 2020: 225.8 — 661st highest of 2,899 towns
> 1-yr. change in all property crime: -449.7 — 571st lowest of 2,654 towns
> Property crimes per 100K people in 2020: 3,098.7 — 425th highest of 2,663 towns
> Population: 8,051

20. Oroville, California
> Change in reported vehicle theft rate, 2019-2020: -284.9
> Vehicle-thefts reported in 2020: 170 — 9th highest of 2,899 towns
> Vehicle-thefts per 100K people in 2020: 810.2 — 23rd highest of 2,899 towns
> 1-yr. change in all property crime: -1,463.9 — 66th lowest of 2,654 towns
> Property crimes per 100K people in 2020: 2,802.3 — 550th highest of 2,663 towns
> Population: 19,393
[in-text-ad]
19. Peotone, Illinois
> Change in reported vehicle theft rate, 2019-2020: -290.0
> Vehicle-thefts reported in 2020: 1 — 182nd lowest of 2,899 towns (tied)
> Vehicle-thefts per 100K people in 2020: 24.4 — 380th lowest of 2,899 towns
> 1-yr. change in all property crime: N/A
> Property crimes per 100K people in 2020: N/A
> Population: 4,331
[recirclink id=1062431]

18. Plymouth, North Carolina
> Change in reported vehicle theft rate, 2019-2020: -291.0
> Vehicle-thefts reported in 2020: 4 — 806th lowest of 2,899 towns (tied)
> Vehicle-thefts per 100K people in 2020: 120.8 — 1,355th highest of 2,899 towns
> 1-yr. change in all property crime: -1,521.0 — 57th lowest of 2,654 towns
> Property crimes per 100K people in 2020: 2,567.2 — 645th highest of 2,663 towns
> Population: 3,478

17. Mendota, California
> Change in reported vehicle theft rate, 2019-2020: -299.3
> Vehicle-thefts reported in 2020: 26 — 485th highest of 2,899 towns (tied)
> Vehicle-thefts per 100K people in 2020: 225.5 — 666th highest of 2,899 towns
> 1-yr. change in all property crime: +153.3 — 679th highest of 2,654 towns
> Property crimes per 100K people in 2020: 1,509.0 — 1,329th lowest of 2,663 towns
> Population: 11,531
[in-text-ad-2]

16. Livingston, Texas
> Change in reported vehicle theft rate, 2019-2020: -300.6
> Vehicle-thefts reported in 2020: 15 — 874th highest of 2,899 towns (tied)
> Vehicle-thefts per 100K people in 2020: 286.3 — 428th highest of 2,899 towns (tied)
> 1-yr. change in all property crime: -1,000.7 — 161st lowest of 2,654 towns
> Property crimes per 100K people in 2020: 4,809.2 — 119th highest of 2,663 towns
> Population: 5,115
15. Anderson, California
> Change in reported vehicle theft rate, 2019-2020: -321.3
> Vehicle-thefts reported in 2020: 59 — 120th highest of 2,899 towns (tied)
> Vehicle-thefts per 100K people in 2020: 551.1 — 73rd highest of 2,899 towns
> 1-yr. change in all property crime: -1,602.1 — 50th lowest of 2,654 towns
> Property crimes per 100K people in 2020: 1,840.3 — 1,047th highest of 2,663 towns
> Population: 10,407
[in-text-ad]

14. Forrest City, Arkansas
> Change in reported vehicle theft rate, 2019-2020: -328.8
> Vehicle-thefts reported in 2020: 79 — 69th highest of 2,899 towns (tied)
> Vehicle-thefts per 100K people in 2020: 578.5 — 62nd highest of 2,899 towns
> 1-yr. change in all property crime: -314.1 — 782nd lowest of 2,654 towns
> Property crimes per 100K people in 2020: 4,496.2 — 146th highest of 2,663 towns
> Population: 14,285
[recirclink id=1066891]

13. Covington, Tennessee
> Change in reported vehicle theft rate, 2019-2020: -356.3
> Vehicle-thefts reported in 2020: 27 — 466th highest of 2,899 towns (tied)
> Vehicle-thefts per 100K people in 2020: 306.2 — 373rd highest of 2,899 towns
> 1-yr. change in all property crime: -356.6 — 705th lowest of 2,654 towns
> Property crimes per 100K people in 2020: 5,114.5 — 101st highest of 2,663 towns
> Population: 8,857
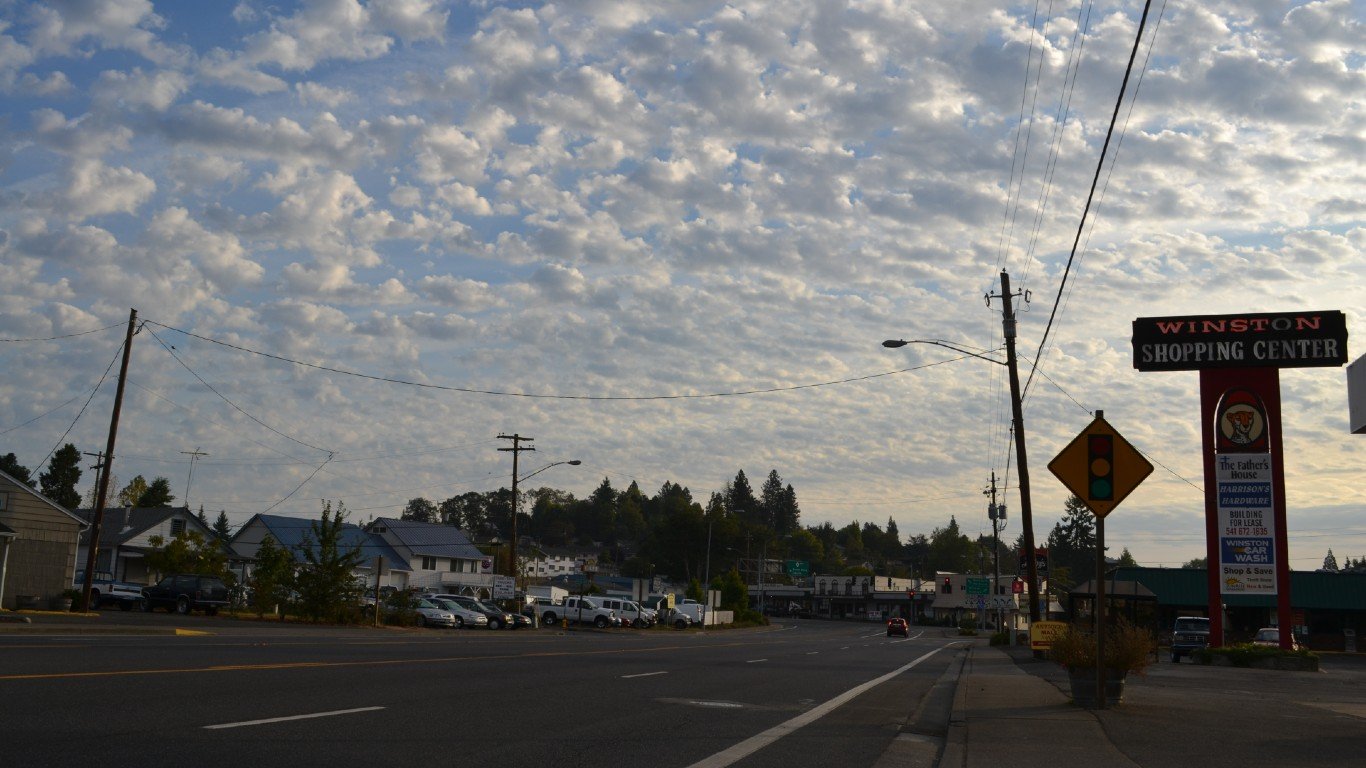
12. Winston, Oregon
> Change in reported vehicle theft rate, 2019-2020: -363.4
> Vehicle-thefts reported in 2020: 17 — 777th highest of 2,899 towns (tied)
> Vehicle-thefts per 100K people in 2020: 307.5 — 369th highest of 2,899 towns
> 1-yr. change in all property crime: -6.2 — 1,079th highest of 2,654 towns
> Property crimes per 100K people in 2020: 2,623.0 — 625th highest of 2,663 towns
> Population: 5,416
[in-text-ad-2]

11. Kodiak, Alaska
> Change in reported vehicle theft rate, 2019-2020: -382.8
> Vehicle-thefts reported in 2020: 8 — 1,372nd lowest of 2,899 towns (tied)
> Vehicle-thefts per 100K people in 2020: 138.5 — 1,204th highest of 2,899 towns
> 1-yr. change in all property crime: -1,619.9 — 46th lowest of 2,654 towns
> Property crimes per 100K people in 2020: 1,574.9 — 1,270th highest of 2,663 towns
> Population: 6,022
10. Dos Palos, California
> Change in reported vehicle theft rate, 2019-2020: -393.3
> Vehicle-thefts reported in 2020: 22 — 584th highest of 2,899 towns (tied)
> Vehicle-thefts per 100K people in 2020: 393.3 — 200th highest of 2,899 towns
> 1-yr. change in all property crime: -1,251.3 — 106th lowest of 2,654 towns
> Property crimes per 100K people in 2020: 1,769.8 — 1,108th highest of 2,663 towns
> Population: 5,351
[in-text-ad]
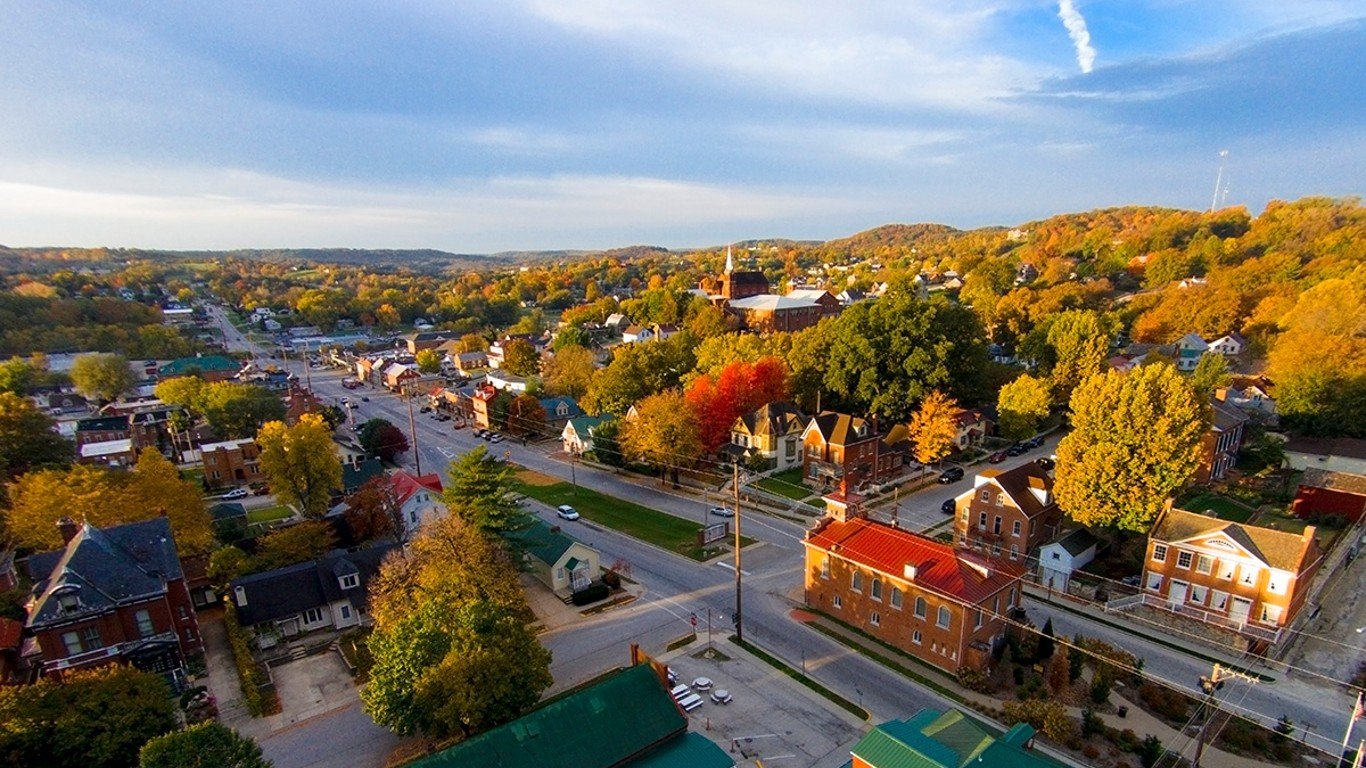
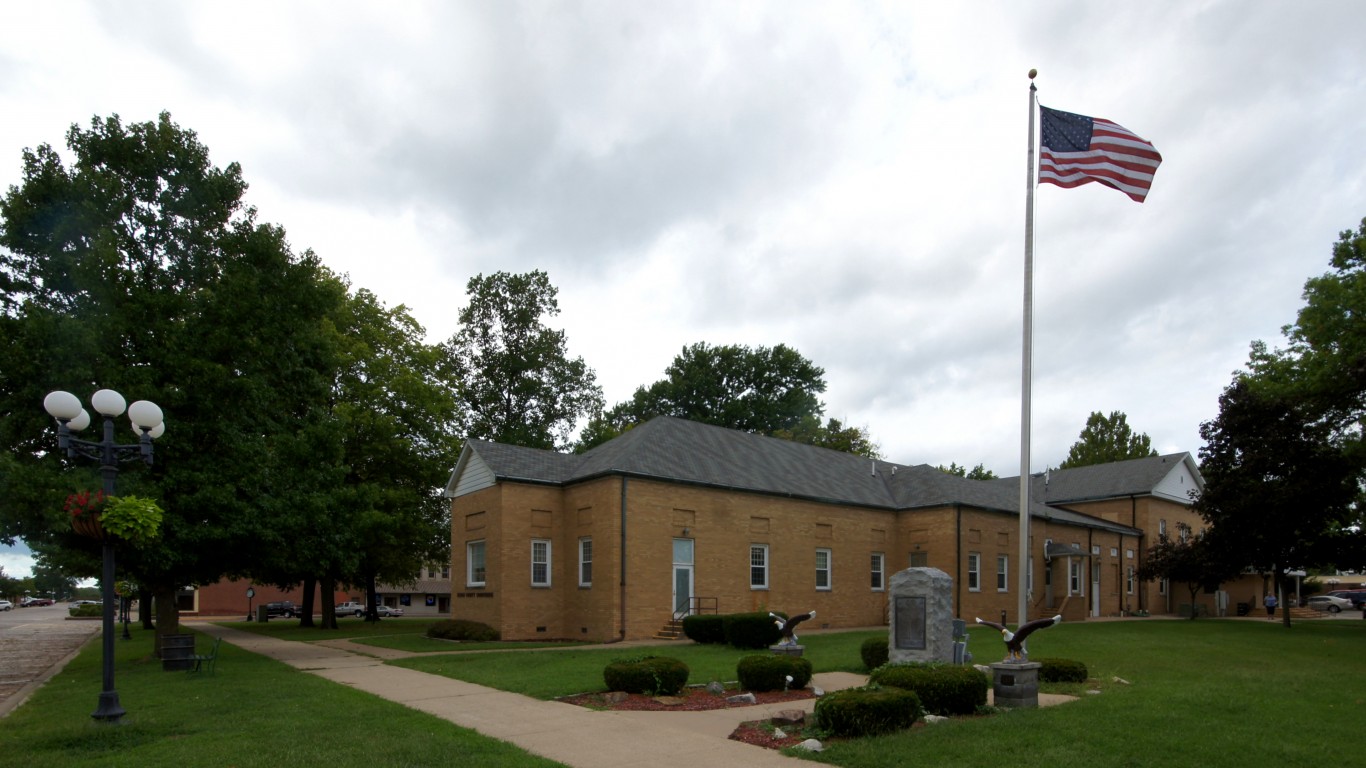
9. Owensville, Missouri
> Change in reported vehicle theft rate, 2019-2020: -466.5
> Vehicle-thefts reported in 2020: 3 — 633rd lowest of 2,899 towns (tied)
> Vehicle-thefts per 100K people in 2020: 116.3 — 1,395th highest of 2,899 towns (tied)
> 1-yr. change in all property crime: -1,560.8 — 52nd lowest of 2,654 towns
> Property crimes per 100K people in 2020: 2,907.0 — 500th highest of 2,663 towns
> Population: 2,599
[recirclink id=1033410]

8. Groveport, Ohio
> Change in reported vehicle theft rate, 2019-2020: -475.3
> Vehicle-thefts reported in 2020: 1 — 182nd lowest of 2,899 towns (tied)
> Vehicle-thefts per 100K people in 2020: 17.7 — 280th lowest of 2,899 towns
> 1-yr. change in all property crime: -149.6 — 1,189th lowest of 2,654 towns
> Property crimes per 100K people in 2020: 1,681.7 — 1,185th highest of 2,663 towns
> Population: 5,617

7. Kotzebue, Alaska
> Change in reported vehicle theft rate, 2019-2020: -488.8
> Vehicle-thefts reported in 2020: 1 — 182nd lowest of 2,899 towns (tied)
> Vehicle-thefts per 100K people in 2020: 30.8 — 462nd lowest of 2,899 towns
> 1-yr. change in all property crime: -2,352.0 — 18th lowest of 2,654 towns
> Property crimes per 100K people in 2020: 184.7 — 38th lowest of 2,663 towns
> Population: 3,287
[in-text-ad-2]

6. Kenai, Alaska
> Change in reported vehicle theft rate, 2019-2020: -521.7
> Vehicle-thefts reported in 2020: 6 — 1,114th lowest of 2,899 towns (tied)
> Vehicle-thefts per 100K people in 2020: 76.1 — 1,093rd lowest of 2,899 towns
> 1-yr. change in all property crime: -3,795.9 — 4th lowest of 2,654 towns
> Property crimes per 100K people in 2020: 1,877.0 — 1,023rd highest of 2,663 towns
> Population: 7,742
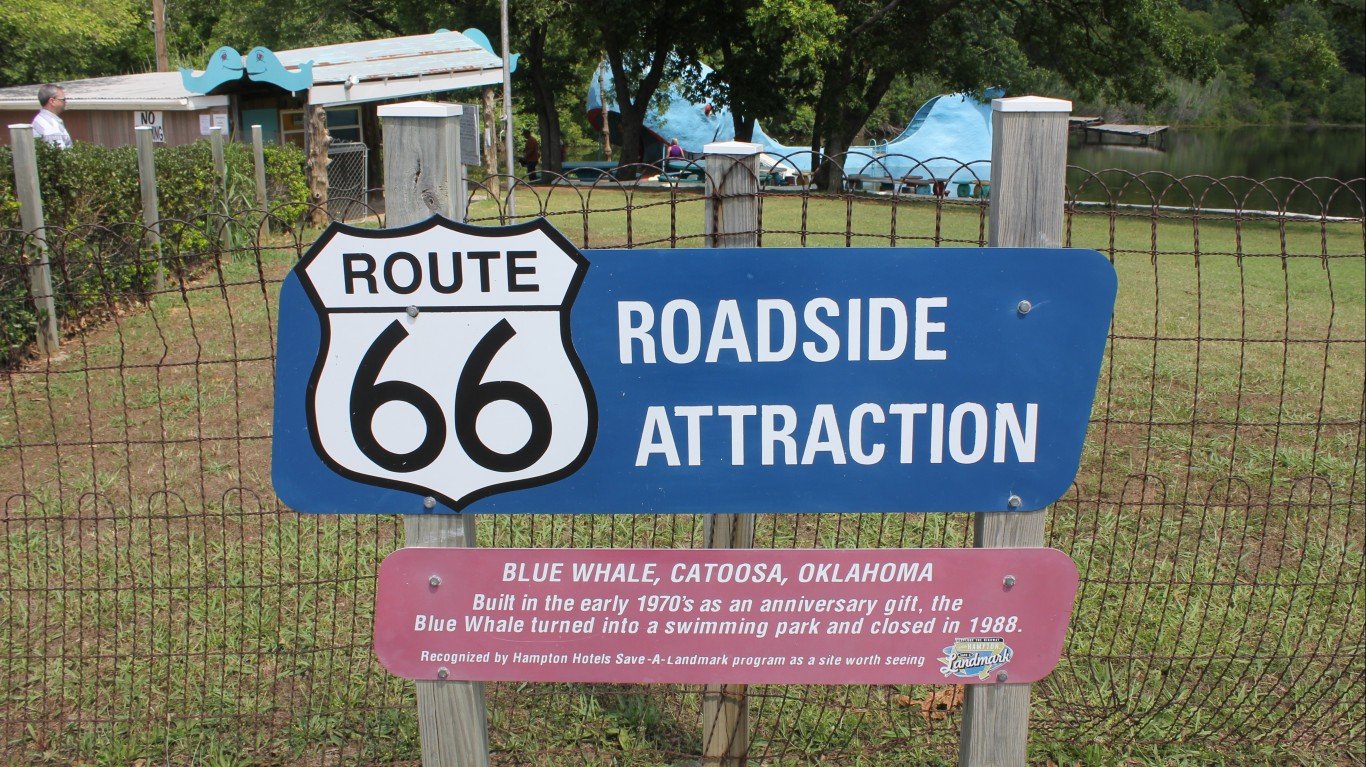
5. Catoosa, Oklahoma
> Change in reported vehicle theft rate, 2019-2020: -555.4
> Vehicle-thefts reported in 2020: 40 — 253rd highest of 2,899 towns (tied)
> Vehicle-thefts per 100K people in 2020: 577.2 — 64th highest of 2,899 towns
> 1-yr. change in all property crime: -2,414.2 — 16th lowest of 2,654 towns
> Property crimes per 100K people in 2020: 3,578.6 — 293rd highest of 2,663 towns
> Population: 7,705
[in-text-ad]

4. Pantego, Texas
> Change in reported vehicle theft rate, 2019-2020: -581.2
> Vehicle-thefts reported in 2020: 16 — 835th highest of 2,899 towns (tied)
> Vehicle-thefts per 100K people in 2020: 631.7 — 47th highest of 2,899 towns
> 1-yr. change in all property crime: -1,610.5 — 48th lowest of 2,654 towns
> Property crimes per 100K people in 2020: 3,632.1 — 279th highest of 2,663 towns
> Population: 2,531
[recirclink id=1026293]

3. South Padre Island, Texas
> Change in reported vehicle theft rate, 2019-2020: -601.0
> Vehicle-thefts reported in 2020: 12 — 1,055th highest of 2,899 towns (tied)
> Vehicle-thefts per 100K people in 2020: 432.9 — 152nd highest of 2,899 towns
> 1-yr. change in all property crime: +479.6 — 261st highest of 2,654 towns
> Property crimes per 100K people in 2020: 13,492.1 — 4th highest of 2,663 towns
> Population: 2,818
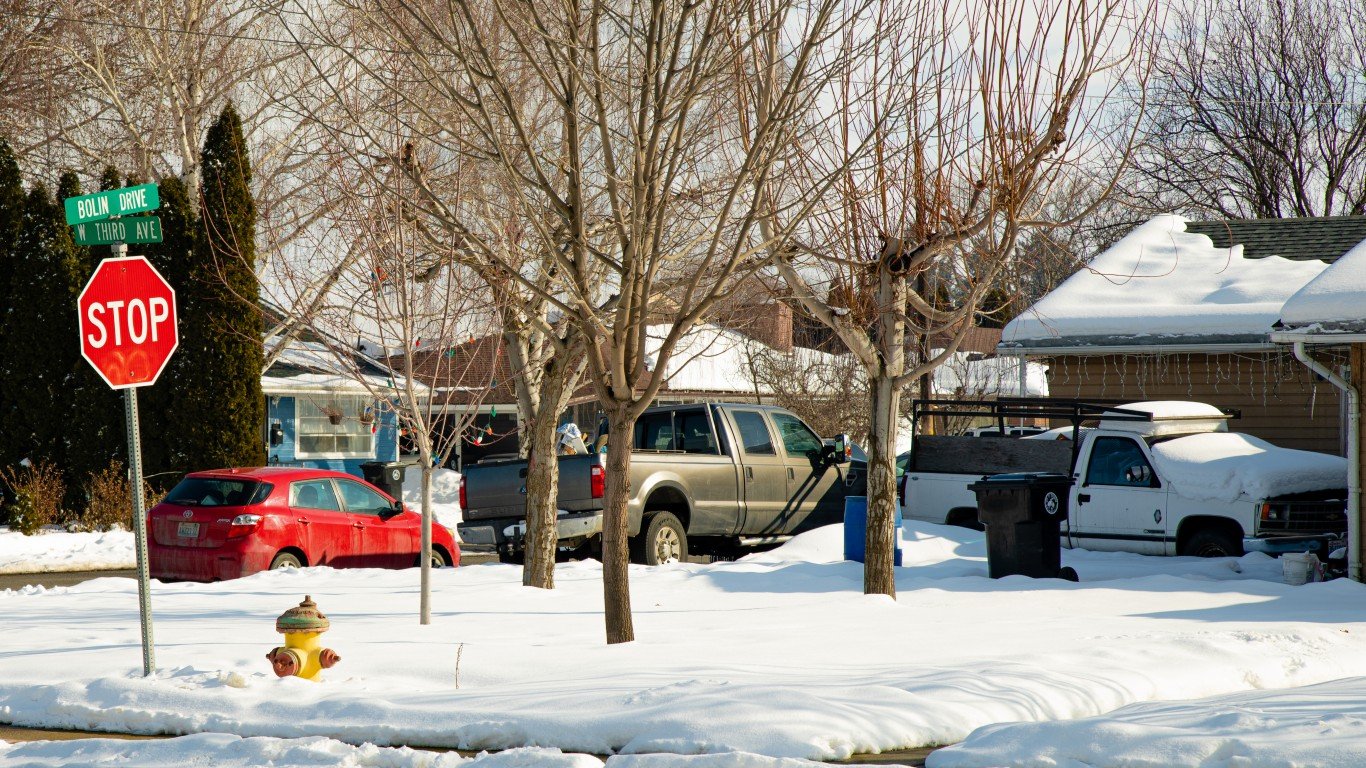
2. Toppenish, Washington
> Change in reported vehicle theft rate, 2019-2020: -689.5
> Vehicle-thefts reported in 2020: 68 — 88th highest of 2,899 towns (tied)
> Vehicle-thefts per 100K people in 2020: 773.4 — 28th highest of 2,899 towns
> 1-yr. change in all property crime: -571.9 — 427th lowest of 2,654 towns
> Property crimes per 100K people in 2020: 5,516.4 — 78th highest of 2,663 towns
> Population: 8,873
[in-text-ad-2]
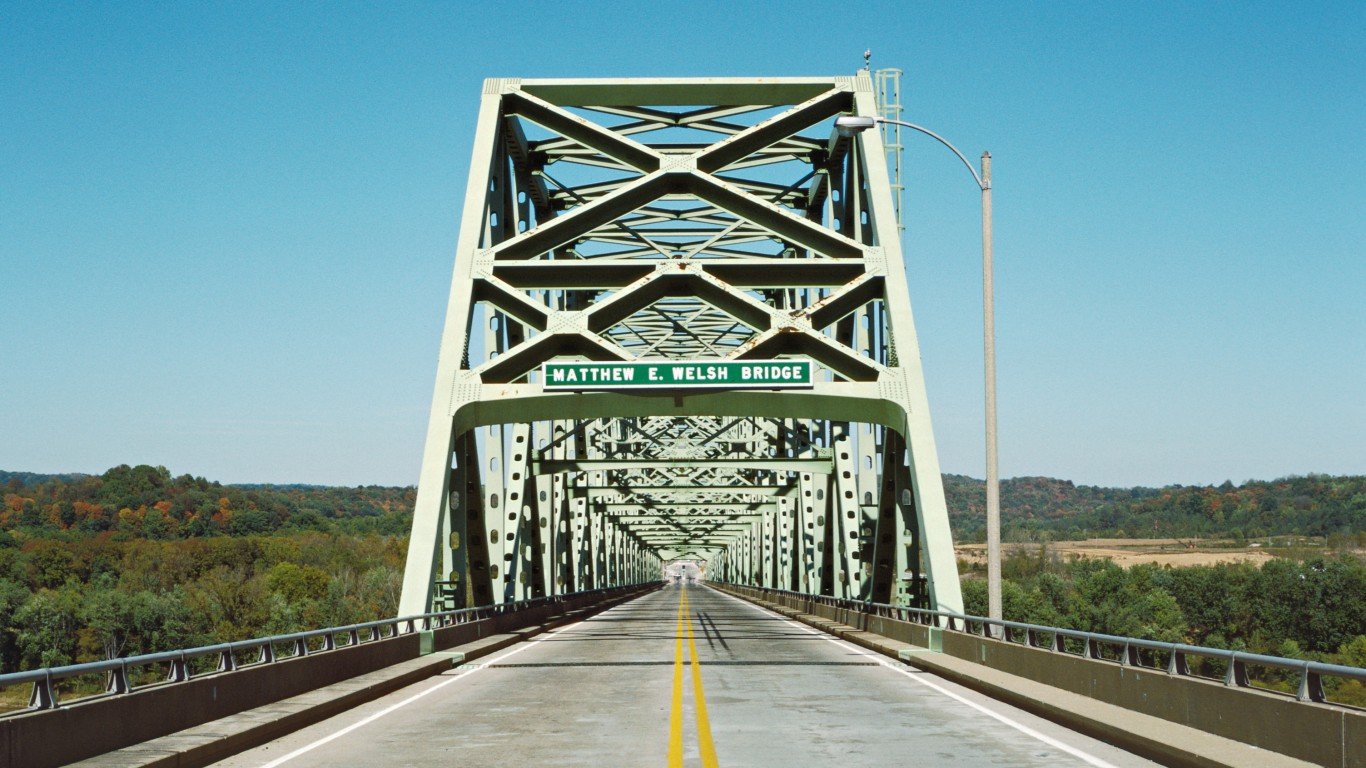
1. Brandenburg, Kentucky
> Change in reported vehicle theft rate, 2019-2020: -826.9
> Vehicle-thefts reported in 2020: 2 — 409th lowest of 2,899 towns (tied)
> Vehicle-thefts per 100K people in 2020: 69.0 — 1,004th lowest of 2,899 towns
> 1-yr. change in all property crime: -1,653.4 — 43rd lowest of 2,654 towns
> Property crimes per 100K people in 2020: 483.1 — 253rd lowest of 2,663 towns
> Population: 2,842
Methodology
To determine the towns where the motor vehicle theft rate is falling fastest, 24/7 Wall St. reviewed the change in motor vehicle theft rate per 100,000 people from the FBI’s 2019 and 2020 Uniform Crime Reports. Crime rates were calculated using population figures provided by the FBI in the 2020 and 2019 UCR.
We defined towns based on population thresholds — having at least 2,500 people and less than 25,000 people — using five-year estimates from the U.S. Census Bureau’s 2019 American Community Survey. Limited data was available in the 2020 UCR for areas in Alabama, Maryland, Pennsylvania, and Illinois, though towns in these states were not excluded from analysis. Because some state and local agencies changed reporting practices between 2019 and 2020, the figures are not comparable, and the areas were excluded.
Population figures are five-year estimates from the U.S. Census Bureau’s 2019 American Community Survey.
Contact [email protected] for any questions or corrections.