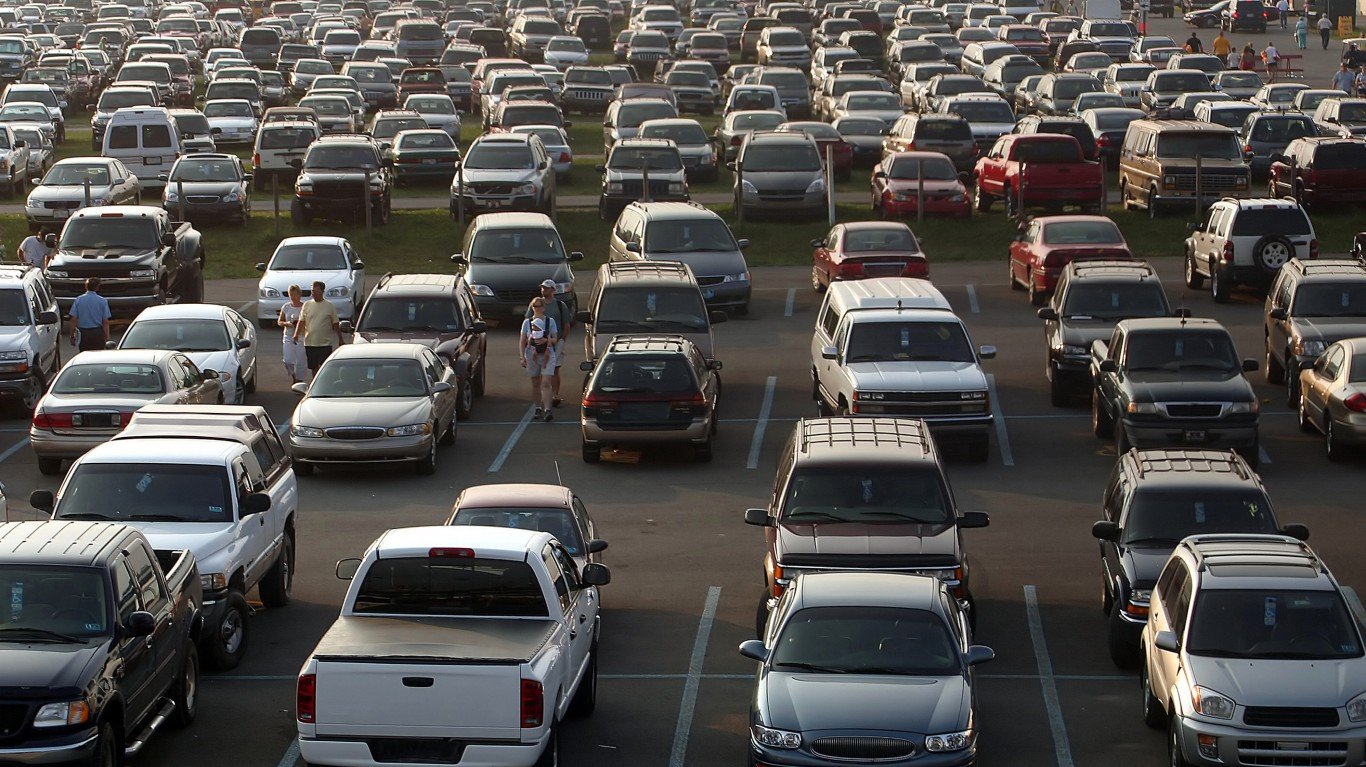
Of all the most serious crimes tracked by the FBI – known as Part I offenses – larceny is by far the most common. There were 4.6 million cases of larceny-theft reported in the United States in 2020, accounting for nearly 60% of all Part I offenses, which also include murder, assault, robbery, vehicle theft, and burglary.
Larceny is a classification of crime that includes all nonviolent theft, with the exception of motor-vehicle theft. Common examples of larceny include purse snatching, pick pocketing, shoplifting, and bicycle theft. According to the FBI, larceny-thefts result in billions of dollars in losses annually.
Though larceny-theft is relatively widespread in the United States, reported incidents of larceny have been declining for years. Between 2019 and 2020 alone, the number of reported larceny cases fell by 11%, or, adjusting for population, 171 incidents for every 100,000 people. The national decline is being led by steep reductions in larceny offenses in some U.S. cities.
Using data from the FBI’s 2020 Uniform Crime Report, 24/7 Wall St. determined the 50 cities where the larceny-theft rate is falling fastest. Cities – defined as places with populations over 25,000 – are ranked by the change in the number of larcenies reported for every 100,000 people between 2019 and 2020. Among the cities on this list, the larceny rate fell anywhere from 723 to 2,368 incidents per 100,000 people.
Larceny – along with motor vehicle theft and burglary – is one component of the overall property crime category. Partially due to a falling larceny rate, the overall property crime rate also declined in every city on this list. Here is a look at the metro areas where property crime is falling fastest.
The largest share of cities on this list are in the South, including 15 in Florida alone. Despite declining larceny rates, the larceny-theft rate remains higher than the national rate of 1,398 per 100,000 people in nearly every city on this list. Here is a look at the city with the most larceny thefts in every state.
Click here to see the cities where thefts are dropping
Click here to see our detailed methodology

50. Pompano Beach, Florida
> Change in reported larceny-theft rate, 2019-2020: -723.3
> Larceny-thefts reported in 2020: 2,237 — 188th highest of 1,046 cities
> Larceny-thefts per 100K people in 2020: 1,970.1 — 313th highest of 1,046 cities
> 1-yr. change in all property crime: -999.9 — 34th lowest of 1,037 cities
> Property crimes per 100K people in 2020: 2,767.2 — 293rd highest of 1,042 cities
> Population: 110,062
[in-text-ad]

49. Walla Walla, Washington
> Change in reported larceny-theft rate, 2019-2020: -723.8
> Larceny-thefts reported in 2020: 573 — 334th lowest of 1,046 cities (tied)
> Larceny-thefts per 100K people in 2020: 1,739.3 — 410th highest of 1,046 cities
> 1-yr. change in all property crime: -909.8 — 44th lowest of 1,037 cities
> Property crimes per 100K people in 2020: 2,273.6 — 434th highest of 1,042 cities
> Population: 32,793
[recirclink id=1059954]
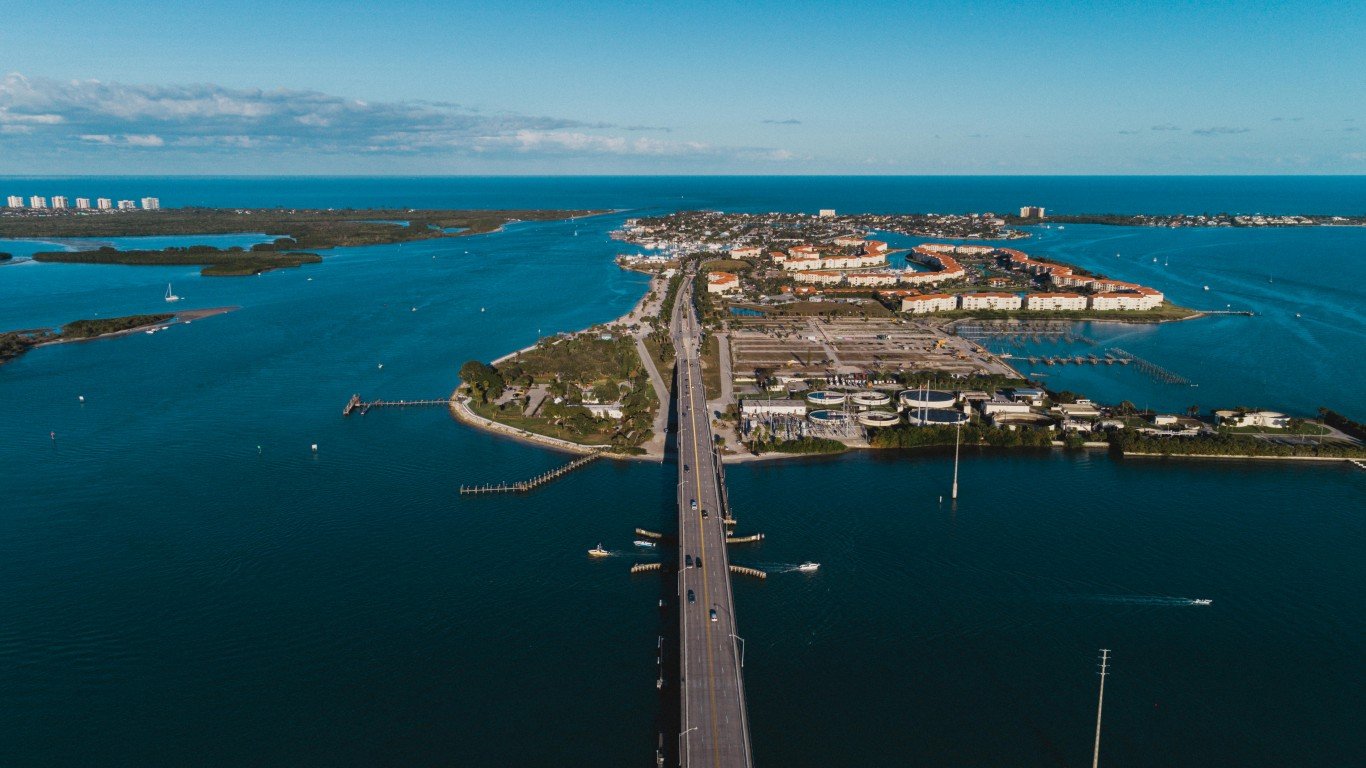
48. Fort Pierce, Florida
> Change in reported larceny-theft rate, 2019-2020: -724.6
> Larceny-thefts reported in 2020: 713 — 434th lowest of 1,046 cities
> Larceny-thefts per 100K people in 2020: 1,530.9 — 500th highest of 1,046 cities
> 1-yr. change in all property crime: -866.0 — 48th lowest of 1,037 cities
> Property crimes per 100K people in 2020: 2,014.0 — 511th lowest of 1,042 cities
> Population: 45,329

47. Fairfield, California
> Change in reported larceny-theft rate, 2019-2020: -727.9
> Larceny-thefts reported in 2020: 1,920 — 223rd highest of 1,046 cities
> Larceny-thefts per 100K people in 2020: 1,620.4 — 460th highest of 1,046 cities
> 1-yr. change in all property crime: -671.3 — 91st lowest of 1,037 cities
> Property crimes per 100K people in 2020: 2,523.4 — 355th highest of 1,042 cities
> Population: 115,282
[in-text-ad-2]

46. Lawton, Oklahoma
> Change in reported larceny-theft rate, 2019-2020: -729.7
> Larceny-thefts reported in 2020: 1,166 — 380th highest of 1,046 cities (tied)
> Larceny-thefts per 100K people in 2020: 1,260.4 — 411th lowest of 1,046 cities
> 1-yr. change in all property crime: -982.7 — 36th lowest of 1,037 cities
> Property crimes per 100K people in 2020: 2,238.7 — 454th highest of 1,042 cities
> Population: 94,017

45. Zanesville, Ohio
> Change in reported larceny-theft rate, 2019-2020: -729.8
> Larceny-thefts reported in 2020: 721 — 437th lowest of 1,046 cities
> Larceny-thefts per 100K people in 2020: 2,868.4 — 95th highest of 1,046 cities
> 1-yr. change in all property crime: -748.4 — 71st lowest of 1,037 cities
> Property crimes per 100K people in 2020: 3,477.1 — 146th highest of 1,042 cities
> Population: 25,200
[in-text-ad]

44. Pleasant Hill, California
> Change in reported larceny-theft rate, 2019-2020: -738.2
> Larceny-thefts reported in 2020: 1,014 — 442nd highest of 1,046 cities (tied)
> Larceny-thefts per 100K people in 2020: 2,894.5 — 90th highest of 1,046 cities
> 1-yr. change in all property crime: -359.9 — 270th lowest of 1,037 cities
> Property crimes per 100K people in 2020: 3,865.0 — 100th highest of 1,042 cities
> Population: 34,840
[recirclink id=1017922]
43. Southgate, Michigan
> Change in reported larceny-theft rate, 2019-2020: -745.8
> Larceny-thefts reported in 2020: 410 — 200th lowest of 1,046 cities (tied)
> Larceny-thefts per 100K people in 2020: 1,421.2 — 485th lowest of 1,046 cities
> 1-yr. change in all property crime: -772.0 — 65th lowest of 1,037 cities
> Property crimes per 100K people in 2020: 1,750.6 — 417th lowest of 1,042 cities
> Population: 29,165
42. Lynnwood, Washington
> Change in reported larceny-theft rate, 2019-2020: -746.1
> Larceny-thefts reported in 2020: 1,230 — 355th highest of 1,046 cities
> Larceny-thefts per 100K people in 2020: 3,112.6 — 69th highest of 1,046 cities
> 1-yr. change in all property crime: -632.6 — 102nd lowest of 1,037 cities
> Property crimes per 100K people in 2020: 4,142.5 — 80th highest of 1,042 cities
> Population: 38,143
[in-text-ad-2]

41. Helena, Montana
> Change in reported larceny-theft rate, 2019-2020: -764.6
> Larceny-thefts reported in 2020: 974 — 461st highest of 1,046 cities (tied)
> Larceny-thefts per 100K people in 2020: 2,896.3 — 89th highest of 1,046 cities
> 1-yr. change in all property crime: -618.9 — 111th lowest of 1,037 cities
> Property crimes per 100K people in 2020: 3,648.6 — 124th highest of 1,042 cities
> Population: 32,024
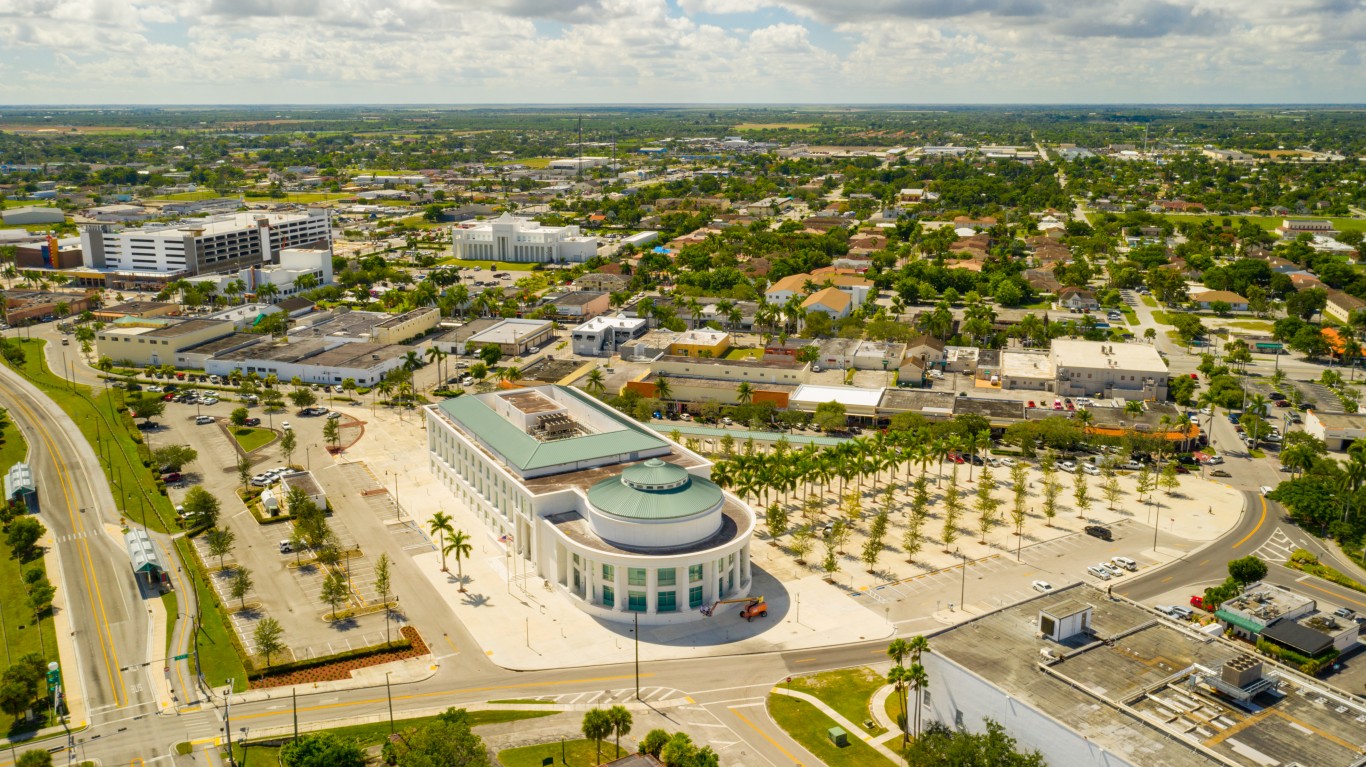
40. Homestead, Florida
> Change in reported larceny-theft rate, 2019-2020: -776.5
> Larceny-thefts reported in 2020: 1,376 — 316th highest of 1,046 cities
> Larceny-thefts per 100K people in 2020: 1,950.7 — 319th highest of 1,046 cities
> 1-yr. change in all property crime: -750.5 — 70th lowest of 1,037 cities
> Property crimes per 100K people in 2020: 2,415.7 — 385th highest of 1,042 cities
> Population: 68,438
[in-text-ad]
39. Ocala, Florida
> Change in reported larceny-theft rate, 2019-2020: -783.3
> Larceny-thefts reported in 2020: 1,663 — 266th highest of 1,046 cities
> Larceny-thefts per 100K people in 2020: 2,714.0 — 122nd highest of 1,046 cities
> 1-yr. change in all property crime: -1,022.2 — 32nd lowest of 1,037 cities
> Property crimes per 100K people in 2020: 3,159.5 — 208th highest of 1,042 cities
> Population: 59,267
[recirclink id=1039645]

38. Altamonte Springs, Florida
> Change in reported larceny-theft rate, 2019-2020: -787.9
> Larceny-thefts reported in 2020: 858 — 515th lowest of 1,046 cities
> Larceny-thefts per 100K people in 2020: 1,930.7 — 330th highest of 1,046 cities
> 1-yr. change in all property crime: -910.3 — 43rd lowest of 1,037 cities
> Property crimes per 100K people in 2020: 2,248.0 — 446th highest of 1,042 cities
> Population: 43,810
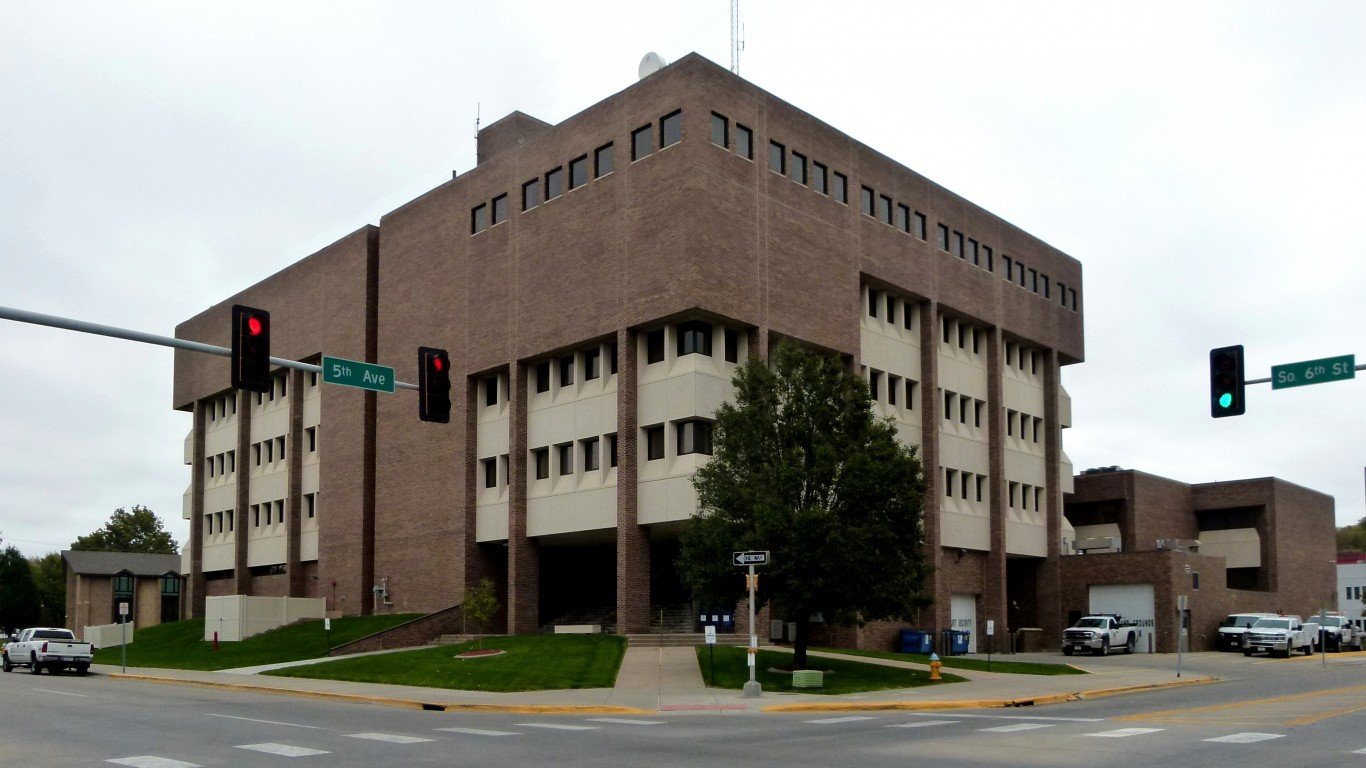
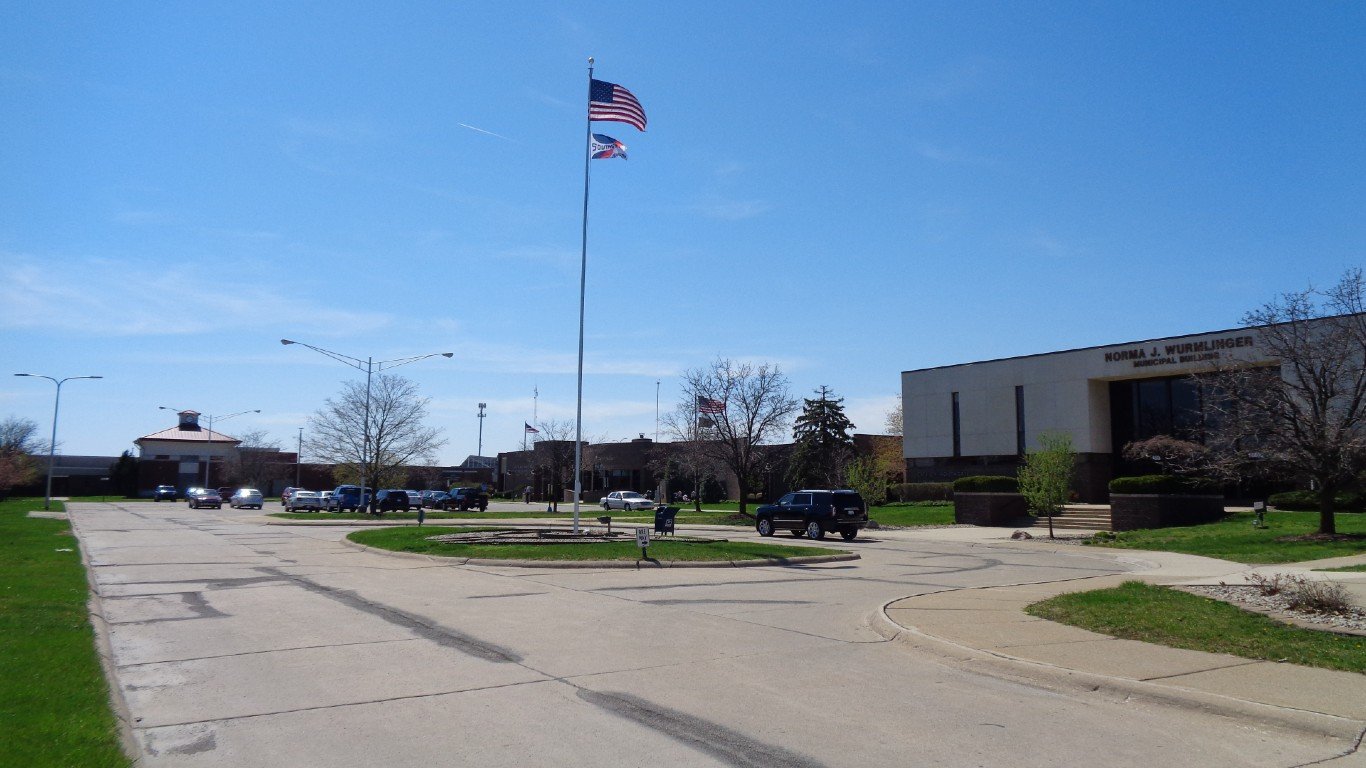
37. Council Bluffs, Iowa
> Change in reported larceny-theft rate, 2019-2020: -788.6
> Larceny-thefts reported in 2020: 2,127 — 194th highest of 1,046 cities
> Larceny-thefts per 100K people in 2020: 3,422.7 — 44th highest of 1,046 cities
> 1-yr. change in all property crime: -1,056.3 — 26th lowest of 1,037 cities
> Property crimes per 100K people in 2020: 4,788.9 — 42nd highest of 1,042 cities
> Population: 62,355
[in-text-ad-2]

36. Daytona Beach, Florida
> Change in reported larceny-theft rate, 2019-2020: -788.9
> Larceny-thefts reported in 2020: 1,668 — 265th highest of 1,046 cities
> Larceny-thefts per 100K people in 2020: 2,380.0 — 182nd highest of 1,046 cities
> 1-yr. change in all property crime: -996.2 — 35th lowest of 1,037 cities
> Property crimes per 100K people in 2020: 3,060.6 — 227th highest of 1,042 cities
> Population: 67,604

35. Juneau, Alaska
> Change in reported larceny-theft rate, 2019-2020: -838.4
> Larceny-thefts reported in 2020: 748 — 454th lowest of 1,046 cities
> Larceny-thefts per 100K people in 2020: 2,343.0 — 198th highest of 1,046 cities
> 1-yr. change in all property crime: -1,098.4 — 22nd lowest of 1,037 cities
> Property crimes per 100K people in 2020: 2,963.2 — 248th highest of 1,042 cities
> Population: 32,227
[in-text-ad]

34. San Bernardino, California
> Change in reported larceny-theft rate, 2019-2020: -839.8
> Larceny-thefts reported in 2020: 3,149 — 111th highest of 1,046 cities
> Larceny-thefts per 100K people in 2020: 1,455.4 — 506th lowest of 1,046 cities
> 1-yr. change in all property crime: -1,389.9 — 10th lowest of 1,037 cities
> Property crimes per 100K people in 2020: 2,800.4 — 283rd highest of 1,042 cities
> Population: 216,089
[recirclink id=1066891]

33. Berkeley, California
> Change in reported larceny-theft rate, 2019-2020: -851.7
> Larceny-thefts reported in 2020: 3,933 — 89th highest of 1,046 cities
> Larceny-thefts per 100K people in 2020: 3,214.7 — 61st highest of 1,046 cities
> 1-yr. change in all property crime: -570.9 — 130th lowest of 1,037 cities
> Property crimes per 100K people in 2020: 4,524.1 — 57th highest of 1,042 cities
> Population: 121,485

32. Miami, Florida
> Change in reported larceny-theft rate, 2019-2020: -855.2
> Larceny-thefts reported in 2020: 10,017 — 33rd highest of 1,046 cities
> Larceny-thefts per 100K people in 2020: 2,104.0 — 268th highest of 1,046 cities
> 1-yr. change in all property crime: -918.0 — 41st lowest of 1,037 cities
> Property crimes per 100K people in 2020: 2,749.8 — 300th highest of 1,042 cities
> Population: 454,279
[in-text-ad-2]

31. Mankato, Minnesota
> Change in reported larceny-theft rate, 2019-2020: -857.5
> Larceny-thefts reported in 2020: 855 — 513th lowest of 1,046 cities
> Larceny-thefts per 100K people in 2020: 1,975.7 — 312th highest of 1,046 cities
> 1-yr. change in all property crime: -1,016.6 — 33rd lowest of 1,037 cities
> Property crimes per 100K people in 2020: 2,387.0 — 396th highest of 1,042 cities
> Population: 42,093

30. Beverly Hills, California
> Change in reported larceny-theft rate, 2019-2020: -857.9
> Larceny-thefts reported in 2020: 892 — 509th highest of 1,046 cities
> Larceny-thefts per 100K people in 2020: 2,640.9 — 131st highest of 1,046 cities
> 1-yr. change in all property crime: -698.5 — 82nd lowest of 1,037 cities
> Property crimes per 100K people in 2020: 3,683.1 — 119th highest of 1,042 cities
> Population: 34,186
[in-text-ad]

29. New Orleans, Louisiana
> Change in reported larceny-theft rate, 2019-2020: -863.0
> Larceny-thefts reported in 2020: 12,358 — 25th highest of 1,046 cities
> Larceny-thefts per 100K people in 2020: 3,138.3 — 65th highest of 1,046 cities
> 1-yr. change in all property crime: -752.9 — 69th lowest of 1,037 cities
> Property crimes per 100K people in 2020: 4,539.6 — 55th highest of 1,042 cities
> Population: 390,845
[recirclink id=1025193]

28. Boynton Beach, Florida
> Change in reported larceny-theft rate, 2019-2020: -868.4
> Larceny-thefts reported in 2020: 1,468 — 298th highest of 1,046 cities (tied)
> Larceny-thefts per 100K people in 2020: 1,837.0 — 365th highest of 1,046 cities
> 1-yr. change in all property crime: -1,053.9 — 28th lowest of 1,037 cities
> Property crimes per 100K people in 2020: 2,244.9 — 449th highest of 1,042 cities
> Population: 76,832

27. Orlando, Florida
> Change in reported larceny-theft rate, 2019-2020: -885.7
> Larceny-thefts reported in 2020: 8,812 — 35th highest of 1,046 cities
> Larceny-thefts per 100K people in 2020: 3,003.8 — 81st highest of 1,046 cities
> 1-yr. change in all property crime: -1,023.3 — 31st lowest of 1,037 cities
> Property crimes per 100K people in 2020: 3,803.5 — 105th highest of 1,042 cities
> Population: 280,832
[in-text-ad-2]

26. Tallahassee, Florida
> Change in reported larceny-theft rate, 2019-2020: -900.7
> Larceny-thefts reported in 2020: 4,159 — 83rd highest of 1,046 cities
> Larceny-thefts per 100K people in 2020: 2,121.8 — 263rd highest of 1,046 cities
> 1-yr. change in all property crime: -1,027.0 — 30th lowest of 1,037 cities
> Property crimes per 100K people in 2020: 2,951.9 — 249th highest of 1,042 cities
> Population: 191,279

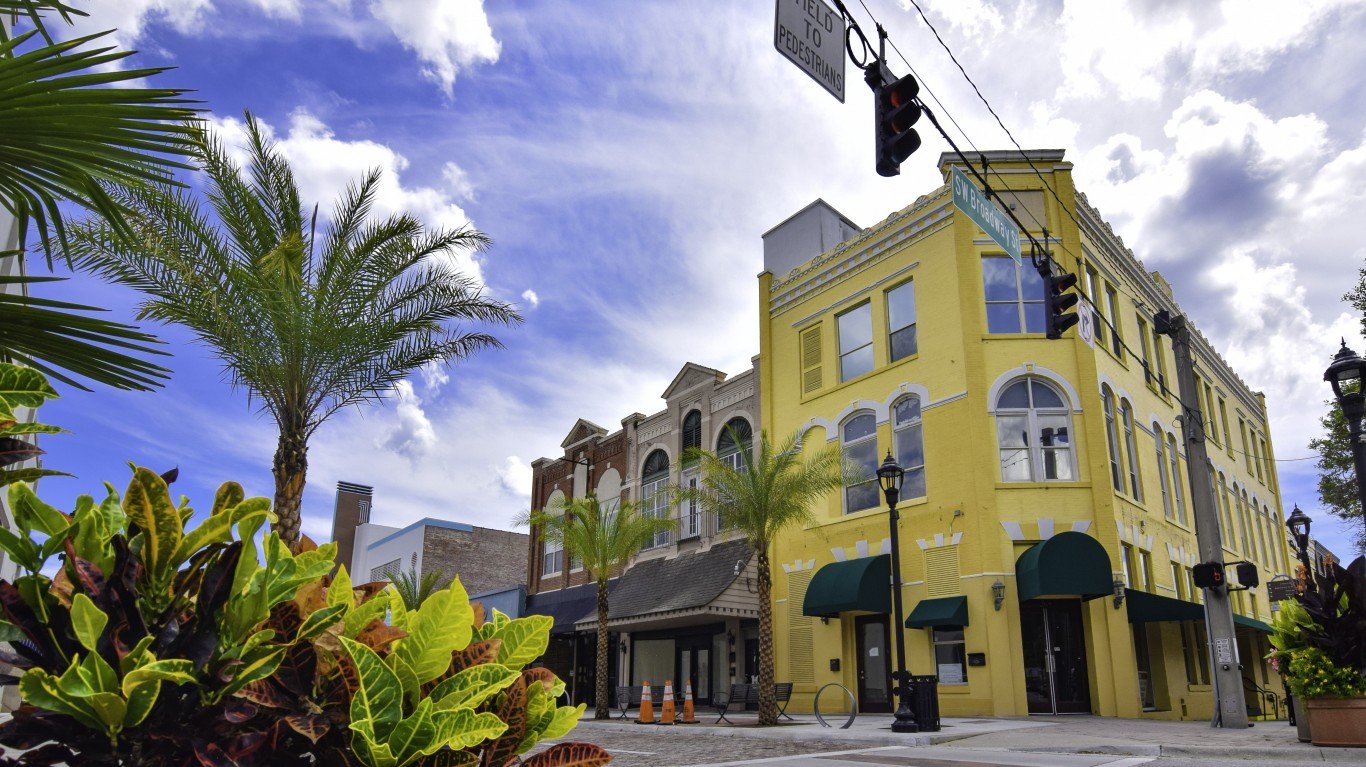
25. Hot Springs, Arkansas
> Change in reported larceny-theft rate, 2019-2020: -909.7
> Larceny-thefts reported in 2020: 1,431 — 304th highest of 1,046 cities
> Larceny-thefts per 100K people in 2020: 3,679.3 — 30th highest of 1,046 cities
> 1-yr. change in all property crime: -1,324.1 — 12th lowest of 1,037 cities
> Property crimes per 100K people in 2020: 5,852.0 — 13th highest of 1,042 cities
> Population: 38,559
[in-text-ad]
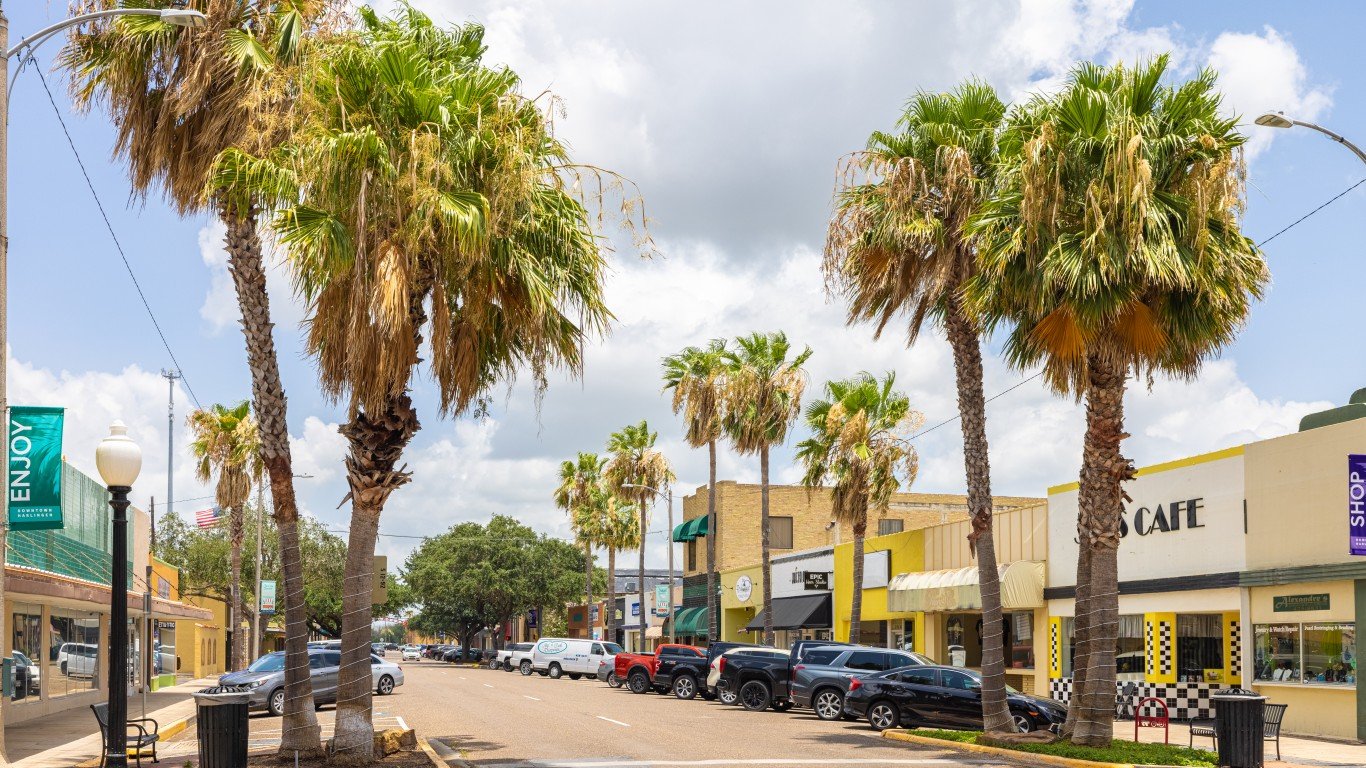
24. Harlingen, Texas
> Change in reported larceny-theft rate, 2019-2020: -915.7
> Larceny-thefts reported in 2020: 1,999 — 210th highest of 1,046 cities
> Larceny-thefts per 100K people in 2020: 3,074.7 — 73rd highest of 1,046 cities
> 1-yr. change in all property crime: -1,065.2 — 25th lowest of 1,037 cities
> Property crimes per 100K people in 2020: 3,748.4 — 111th highest of 1,042 cities
> Population: 65,129
[recirclink id=1059954]

23. Jackson, Michigan
> Change in reported larceny-theft rate, 2019-2020: -920.5
> Larceny-thefts reported in 2020: 722 — 438th lowest of 1,046 cities
> Larceny-thefts per 100K people in 2020: 2,233.1 — 227th highest of 1,046 cities
> 1-yr. change in all property crime: -1,039.0 — 29th lowest of 1,037 cities
> Property crimes per 100K people in 2020: 3,096.0 — 220th highest of 1,042 cities
> Population: 32,673

22. Portsmouth, Virginia
> Change in reported larceny-theft rate, 2019-2020: -938.9
> Larceny-thefts reported in 2020: 3,314 — 106th highest of 1,046 cities
> Larceny-thefts per 100K people in 2020: 3,517.9 — 41st highest of 1,046 cities
> 1-yr. change in all property crime: -1,321.1 — 13th lowest of 1,037 cities
> Property crimes per 100K people in 2020: 4,540.1 — 54th highest of 1,042 cities
> Population: 95,097
[in-text-ad-2]

21. Santa Cruz, California
> Change in reported larceny-theft rate, 2019-2020: -956.0
> Larceny-thefts reported in 2020: 1,734 — 253rd highest of 1,046 cities (tied)
> Larceny-thefts per 100K people in 2020: 2,664.7 — 129th highest of 1,046 cities
> 1-yr. change in all property crime: -1,054.9 — 27th lowest of 1,037 cities
> Property crimes per 100K people in 2020: 3,437.7 — 153rd highest of 1,042 cities
> Population: 64,522

20. Washington, District of Columbia
> Change in reported larceny-theft rate, 2019-2020: -976.4
> Larceny-thefts reported in 2020: 19,126 — 17th highest of 1,046 cities
> Larceny-thefts per 100K people in 2020: 2,683.2 — 127th highest of 1,046 cities
> 1-yr. change in all property crime: -814.5 — 57th lowest of 1,037 cities
> Property crimes per 100K people in 2020: 3,431.3 — 154th highest of 1,042 cities
> Population: 692,683
[in-text-ad]

19. Cutler Bay, Florida
> Change in reported larceny-theft rate, 2019-2020: -991.2
> Larceny-thefts reported in 2020: 700 — 423rd lowest of 1,046 cities
> Larceny-thefts per 100K people in 2020: 1,587.4 — 475th highest of 1,046 cities
> 1-yr. change in all property crime: -1,075.9 — 24th lowest of 1,037 cities
> Property crimes per 100K people in 2020: 1,845.9 — 453rd lowest of 1,042 cities
> Population: 44,222
[recirclink id=1017922]

18. Eureka, California
> Change in reported larceny-theft rate, 2019-2020: -1,033.6
> Larceny-thefts reported in 2020: 690 — 413th lowest of 1,046 cities
> Larceny-thefts per 100K people in 2020: 2,588.5 — 139th highest of 1,046 cities
> 1-yr. change in all property crime: -1,099.7 — 20th lowest of 1,037 cities
> Property crimes per 100K people in 2020: 3,905.3 — 97th highest of 1,042 cities
> Population: 26,966

17. San Leandro, California
> Change in reported larceny-theft rate, 2019-2020: -1,037.1
> Larceny-thefts reported in 2020: 1,981 — 213th highest of 1,046 cities
> Larceny-thefts per 100K people in 2020: 2,219.9 — 233rd highest of 1,046 cities
> 1-yr. change in all property crime: -718.2 — 79th lowest of 1,037 cities
> Property crimes per 100K people in 2020: 3,827.9 — 104th highest of 1,042 cities
> Population: 90,025
[in-text-ad-2]

16. Sanford, Florida
> Change in reported larceny-theft rate, 2019-2020: -1,037.2
> Larceny-thefts reported in 2020: 1,084 — 405th highest of 1,046 cities
> Larceny-thefts per 100K people in 2020: 1,738.8 — 411th highest of 1,046 cities
> 1-yr. change in all property crime: -1,256.6 — 16th lowest of 1,037 cities
> Property crimes per 100K people in 2020: 2,239.3 — 453rd highest of 1,042 cities
> Population: 59,700

15. Miami Gardens, Florida
> Change in reported larceny-theft rate, 2019-2020: -1,114.7
> Larceny-thefts reported in 2020: 2,131 — 193rd highest of 1,046 cities
> Larceny-thefts per 100K people in 2020: 1,932.3 — 328th highest of 1,046 cities
> 1-yr. change in all property crime: -1,272.5 — 14th lowest of 1,037 cities
> Property crimes per 100K people in 2020: 2,516.2 — 358th highest of 1,042 cities
> Population: 111,363
[in-text-ad]

14. Little Rock, Arkansas
> Change in reported larceny-theft rate, 2019-2020: -1,123.7
> Larceny-thefts reported in 2020: 7,062 — 52nd highest of 1,046 cities
> Larceny-thefts per 100K people in 2020: 3,572.3 — 38th highest of 1,046 cities
> 1-yr. change in all property crime: -1,264.9 — 15th lowest of 1,037 cities
> Property crimes per 100K people in 2020: 4,857.1 — 36th highest of 1,042 cities
> Population: 197,958
[recirclink id=1039645]

13. Dover, Delaware
> Change in reported larceny-theft rate, 2019-2020: -1,242.0
> Larceny-thefts reported in 2020: 1,412 — 309th highest of 1,046 cities (tied)
> Larceny-thefts per 100K people in 2020: 3,674.4 — 31st highest of 1,046 cities
> 1-yr. change in all property crime: -1,331.3 — 11th lowest of 1,037 cities
> Property crimes per 100K people in 2020: 4,030.9 — 90th highest of 1,042 cities
> Population: 37,523

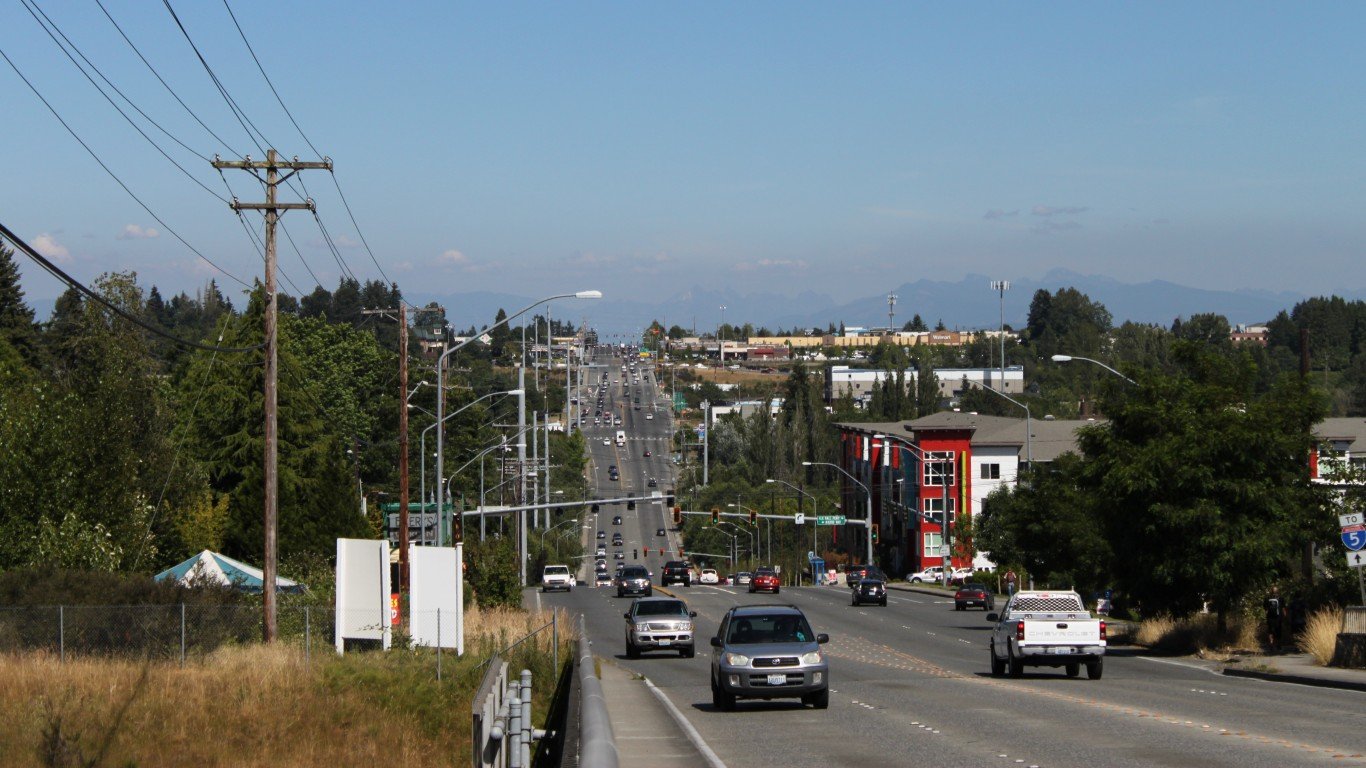
12. Federal Way, Washington
> Change in reported larceny-theft rate, 2019-2020: -1,304.6
> Larceny-thefts reported in 2020: 1,745 — 252nd highest of 1,046 cities
> Larceny-thefts per 100K people in 2020: 1,797.7 — 383rd highest of 1,046 cities
> 1-yr. change in all property crime: -1,629.2 — 7th lowest of 1,037 cities
> Property crimes per 100K people in 2020: 2,618.7 — 329th highest of 1,042 cities
> Population: 96,526
[in-text-ad-2]

11. Santa Clara, California
> Change in reported larceny-theft rate, 2019-2020: -1,306.0
> Larceny-thefts reported in 2020: 2,314 — 178th highest of 1,046 cities
> Larceny-thefts per 100K people in 2020: 1,753.3 — 404th highest of 1,046 cities
> 1-yr. change in all property crime: -1,118.4 — 18th lowest of 1,037 cities
> Property crimes per 100K people in 2020: 2,501.2 — 362nd highest of 1,042 cities
> Population: 127,721

10. El Cerrito, California
> Change in reported larceny-theft rate, 2019-2020: -1,366.8
> Larceny-thefts reported in 2020: 697 — 419th lowest of 1,046 cities (tied)
> Larceny-thefts per 100K people in 2020: 2,709.4 — 124th highest of 1,046 cities
> 1-yr. change in all property crime: -1,408.6 — 9th lowest of 1,037 cities
> Property crimes per 100K people in 2020: 3,619.0 — 127th highest of 1,042 cities
> Population: 25,398
[in-text-ad]

9. Aventura, Florida
> Change in reported larceny-theft rate, 2019-2020: -1,376.3
> Larceny-thefts reported in 2020: 1,116 — 393rd highest of 1,046 cities
> Larceny-thefts per 100K people in 2020: 3,007.0 — 80th highest of 1,046 cities
> 1-yr. change in all property crime: -1,424.5 — 8th lowest of 1,037 cities
> Property crimes per 100K people in 2020: 3,319.5 — 173rd highest of 1,042 cities
> Population: 37,303
[recirclink id=1066891]
8. Alexandria, Louisiana
> Change in reported larceny-theft rate, 2019-2020: -1,552.2
> Larceny-thefts reported in 2020: 2,300 — 179th highest of 1,046 cities
> Larceny-thefts per 100K people in 2020: 5,001.5 — 5th highest of 1,046 cities
> 1-yr. change in all property crime: -1,751.1 — 5th lowest of 1,037 cities
> Property crimes per 100K people in 2020: 7,213.1 — 4th highest of 1,042 cities
> Population: 47,012

7. Oakland, California
> Change in reported larceny-theft rate, 2019-2020: -1,606.7
> Larceny-thefts reported in 2020: 13,373 — 22nd highest of 1,046 cities
> Larceny-thefts per 100K people in 2020: 3,053.7 — 77th highest of 1,046 cities
> 1-yr. change in all property crime: -1,254.9 — 17th lowest of 1,037 cities
> Property crimes per 100K people in 2020: 5,165.7 — 23rd highest of 1,042 cities
> Population: 425,097
[in-text-ad-2]

6. Miami Beach, Florida
> Change in reported larceny-theft rate, 2019-2020: -1,626.0
> Larceny-thefts reported in 2020: 4,244 — 82nd highest of 1,046 cities
> Larceny-thefts per 100K people in 2020: 4,767.6 — 7th highest of 1,046 cities
> 1-yr. change in all property crime: -1,829.1 — 3rd lowest of 1,037 cities
> Property crimes per 100K people in 2020: 5,739.4 — 16th highest of 1,042 cities
> Population: 90,108

5. San Francisco, California
> Change in reported larceny-theft rate, 2019-2020: -1,629.7
> Larceny-thefts reported in 2020: 25,319 — 8th highest of 1,046 cities
> Larceny-thefts per 100K people in 2020: 2,872.2 — 94th highest of 1,046 cities
> 1-yr. change in all property crime: -1,111.2 — 19th lowest of 1,037 cities
> Property crimes per 100K people in 2020: 4,394.4 — 63rd highest of 1,042 cities
> Population: 874,961
[in-text-ad]
4. Paramus, New Jersey
> Change in reported larceny-theft rate, 2019-2020: -1,690.1
> Larceny-thefts reported in 2020: 420 — 208th lowest of 1,046 cities (tied)
> Larceny-thefts per 100K people in 2020: 1,601.7 — 464th highest of 1,046 cities
> 1-yr. change in all property crime: -1,738.0 — 6th lowest of 1,037 cities
> Property crimes per 100K people in 2020: 1,735.2 — 410th lowest of 1,042 cities
> Population: 26,503
[recirclink id=1025193]

3. Atlantic City, New Jersey
> Change in reported larceny-theft rate, 2019-2020: -1,950.1
> Larceny-thefts reported in 2020: 785 — 479th lowest of 1,046 cities (tied)
> Larceny-thefts per 100K people in 2020: 2,090.5 — 273rd highest of 1,046 cities
> 1-yr. change in all property crime: -1,925.5 — 2nd lowest of 1,037 cities
> Property crimes per 100K people in 2020: 2,697.7 — 314th highest of 1,042 cities
> Population: 37,999

2. West Hollywood, California
> Change in reported larceny-theft rate, 2019-2020: -1,974.1
> Larceny-thefts reported in 2020: 822 — 493rd lowest of 1,046 cities (tied)
> Larceny-thefts per 100K people in 2020: 2,238.6 — 225th highest of 1,046 cities
> 1-yr. change in all property crime: -1,824.2 — 4th lowest of 1,037 cities
> Property crimes per 100K people in 2020: 3,281.7 — 182nd highest of 1,042 cities
> Population: 36,450
[in-text-ad-2]

1. Myrtle Beach, South Carolina
> Change in reported larceny-theft rate, 2019-2020: -2,368.2
> Larceny-thefts reported in 2020: 2,617 — 143rd highest of 1,046 cities
> Larceny-thefts per 100K people in 2020: 7,339.2 — the highest of 1,046 cities
> 1-yr. change in all property crime: -2,517.4 — the lowest of 1,037 cities
> Property crimes per 100K people in 2020: 8,716.1 — 2nd highest of 1,042 cities
> Population: 32,700
Methodology
To determine the cities where the larceny-theft rate is falling fastest, 24/7 Wall St. reviewed the change in larceny-thefts per 100,000 people from the FBI’s 2019 and 2020 Uniform Crime Reports. Crime rates were calculated using population figures provided by the FBI in the 2020 and 2019 UCR.
Limited data was available in the 2020 UCR for areas in Alabama, Maryland, Pennsylvania, and Illinois, though cities in these states were not excluded from analysis. Because some state and local agencies changed reporting practices between 2019 and 2020, the figures are not comparable, and the areas were excluded.
To concentrate on urban areas, we excluded places with fewer than 25,000 people based on five-year estimates from the U.S. Census Bureau’s 2019 American Community Survey.
Contact [email protected] for any questions or corrections.