
Of all the most serious crimes tracked by the FBI – known as Part I offenses – larceny is by far the most common. There were 4.6 million cases of larceny-theft reported in the United States in 2020, accounting for nearly 60% of all Part I offenses, which also include murder, assault, robbery, vehicle theft, and burglary.
Larceny is a classification of crime that includes all nonviolent theft, with the exception of motor-vehicle theft. Common examples of larceny include purse snatching, pick pocketing, shoplifting, and bicycle theft. According to the FBI, larceny-thefts result in billions of dollars in losses annually.
Though larceny-theft is relatively widespread in the United States, reported incidents of larceny have been declining for years. Between 2019 and 2020 alone, the number of reported larceny cases fell by 11%, or, adjusting for population, 171 incidents for every 100,000 people. The national decline is being driven by steep reductions in larceny offenses in some major metropolitan areas.
Using data from the FBI’s 2020 Uniform Crime Report, 24/7 Wall St. determined the 50 metro areas where the larceny-theft rate is falling fastest. Metro areas are ranked by the change in the number of larcenies reported for every 100,000 people between 2019 and 2020. Among the metro areas on this list, the larceny rate fell anywhere from 261 to 734 incidents per 100,000 people.
Larceny – along with motor vehicle theft and burglary – is one component of the property crime category. Partially due to a falling larceny rate, the overall property crime rate also declined in every metro area on this list with available data. Here is a look at the metro areas where property crime is falling fastest.
The metro areas on this list span the country, though Florida alone is home to eight, the most of any state. Despite declining larceny rates, the larceny-theft rate remains higher than the national rate of 1,398 per 100,000 people in most of the metro areas on this list. Here is a look at the city with the most larceny thefts in every state.
Click here to see the cities where petty crime is falling the fastest
Click here to read our detailed methodology

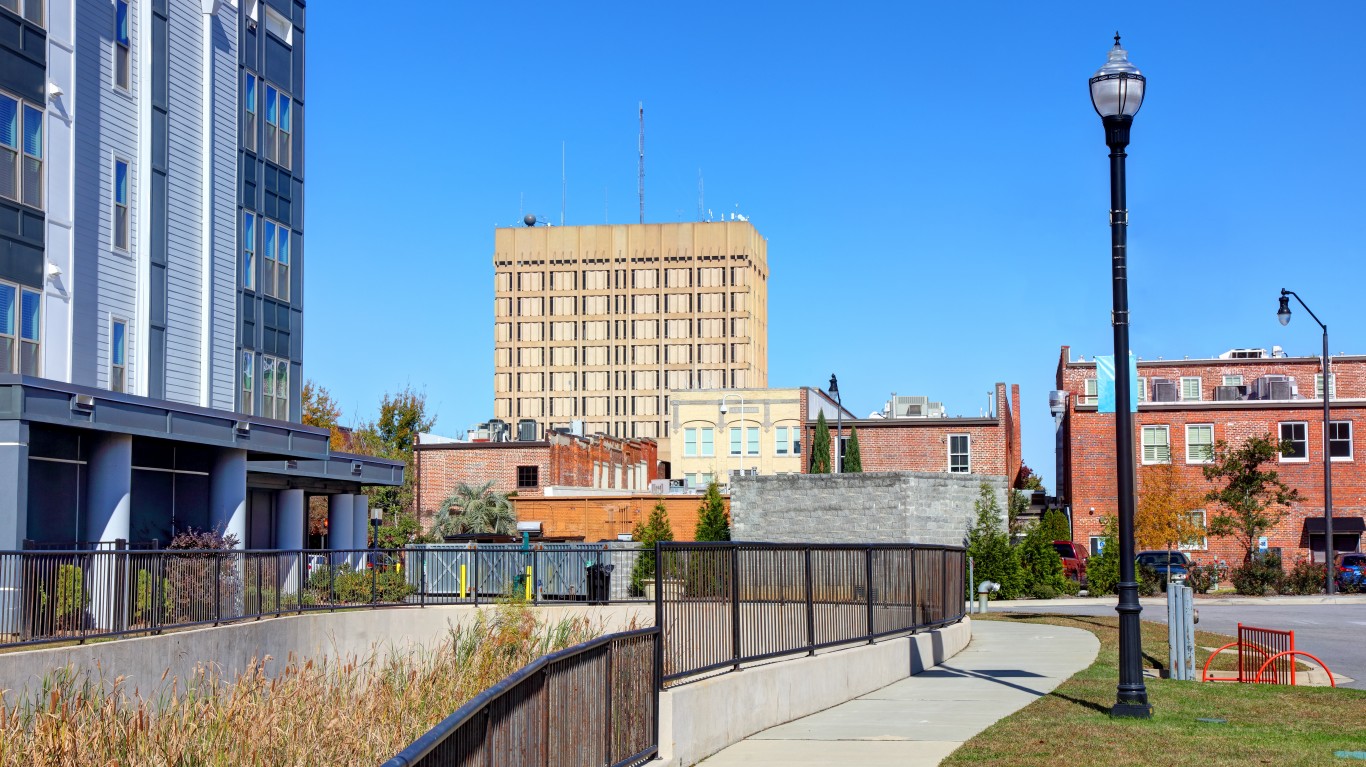
50. Cincinnati, OH-KY-IN
> Change in reported larceny-theft rate, 2019-2020: -261.2
> Larceny-thefts reported in 2020: 27,573 — 17th highest of 203 metros
> Larceny-thefts per 100K people in 2020: 1,237.7 — 74th lowest of 203 metros
> 1-yr. change in all property crime: -318.2 — 45th lowest of 188 metros
> Property crimes per 100K people in 2020: 1,658.8 — 66th lowest of 199 metros
> Population: 2,219,750
[in-text-ad]

49. Jacksonville, FL
> Change in reported larceny-theft rate, 2019-2020: -262.9
> Larceny-thefts reported in 2020: 25,414 — 19th highest of 203 metros
> Larceny-thefts per 100K people in 2020: 1,607.7 — 64th highest of 203 metros
> 1-yr. change in all property crime: -352.3 — 36th lowest of 188 metros
> Property crimes per 100K people in 2020: 2,153.1 — 72nd highest of 199 metros
> Population: 1,559,514
[recirclink id=1059954]

48. Richmond, VA
> Change in reported larceny-theft rate, 2019-2020: -263.1
> Larceny-thefts reported in 2020: 19,789 — 23rd highest of 203 metros
> Larceny-thefts per 100K people in 2020: 1,518.7 — 86th highest of 203 metros
> 1-yr. change in all property crime: -326.6 — 43rd lowest of 188 metros
> Property crimes per 100K people in 2020: 1,834.5 — 85th lowest of 199 metros
> Population: 1,290,866
47. Florence, SC
> Change in reported larceny-theft rate, 2019-2020: -269.7
> Larceny-thefts reported in 2020: 5,177 — 74th highest of 203 metros
> Larceny-thefts per 100K people in 2020: 2,524.5 — 7th highest of 203 metros
> 1-yr. change in all property crime: -458.4 — 20th lowest of 188 metros
> Property crimes per 100K people in 2020: 3,600.8 — 6th highest of 199 metros
> Population: 204,911
[in-text-ad-2]

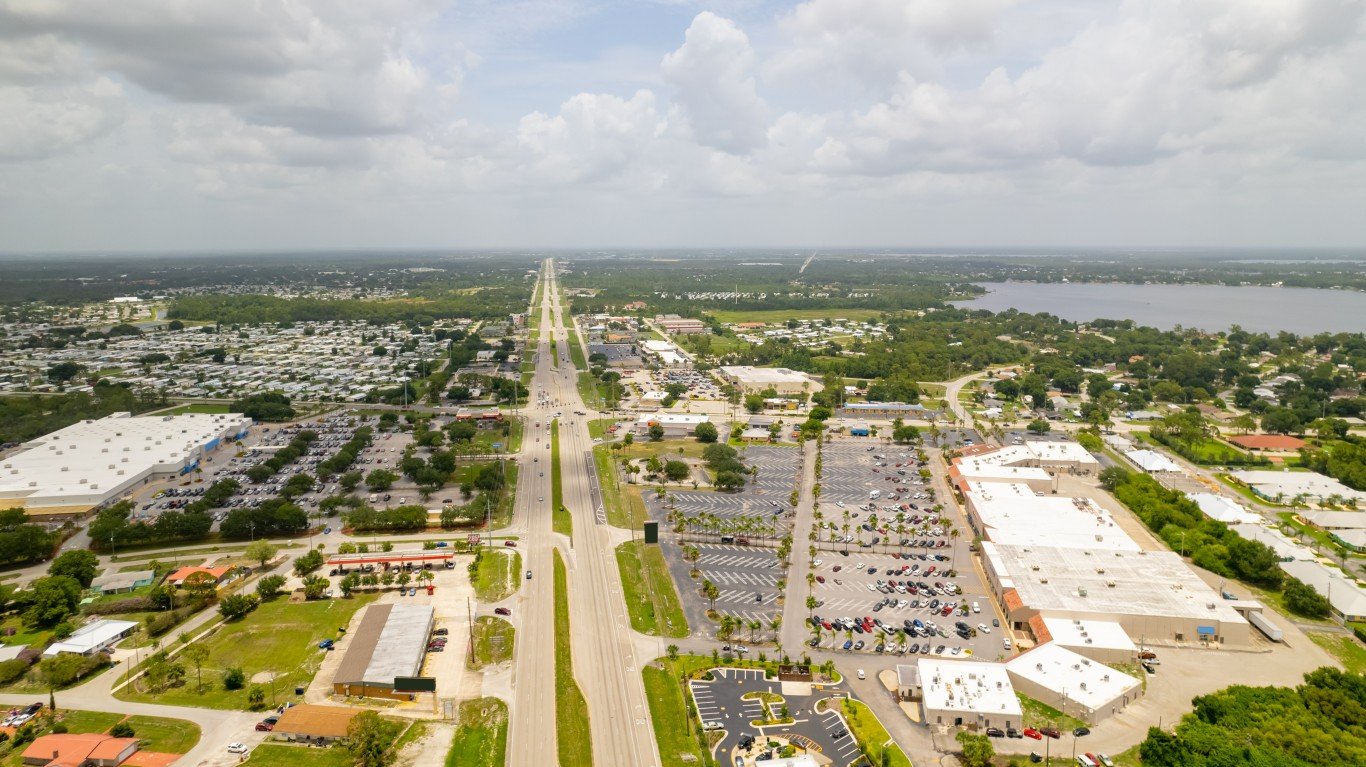
46. Deltona-Daytona Beach-Ormond Beach, FL
> Change in reported larceny-theft rate, 2019-2020: -279.5
> Larceny-thefts reported in 2020: 7,452 — 55th highest of 203 metros
> Larceny-thefts per 100K people in 2020: 1,102.9 — 56th lowest of 203 metros
> 1-yr. change in all property crime: -352.7 — 35th lowest of 188 metros
> Property crimes per 100K people in 2020: 1,452.7 — 47th lowest of 199 metros
> Population: 668,365

45. Greenville, NC
> Change in reported larceny-theft rate, 2019-2020: -280.7
> Larceny-thefts reported in 2020: 2,840 — 86th lowest of 203 metros
> Larceny-thefts per 100K people in 2020: 1,559.3 — 75th highest of 203 metros
> 1-yr. change in all property crime: -406.0 — 26th lowest of 188 metros
> Property crimes per 100K people in 2020: 2,012.3 — 95th highest of 199 metros
> Population: 180,742
[in-text-ad]

44. Walla Walla, WA
> Change in reported larceny-theft rate, 2019-2020: -282.2
> Larceny-thefts reported in 2020: 920 — 6th lowest of 203 metros
> Larceny-thefts per 100K people in 2020: 1,514.0 — 88th highest of 203 metros
> 1-yr. change in all property crime: -341.1 — 40th lowest of 188 metros
> Property crimes per 100K people in 2020: 2,085.0 — 85th highest of 199 metros
> Population: 60,760
[recirclink id=1017922]

43. Tampa-St. Petersburg-Clearwater, FL
> Change in reported larceny-theft rate, 2019-2020: -284.3
> Larceny-thefts reported in 2020: 34,203 — 13th highest of 203 metros
> Larceny-thefts per 100K people in 2020: 1,057.5 — 51st lowest of 203 metros
> 1-yr. change in all property crime: -321.7 — 44th lowest of 188 metros
> Property crimes per 100K people in 2020: 1,363.9 — 43rd lowest of 199 metros
> Population: 3,194,831

42. Merced, CA
> Change in reported larceny-theft rate, 2019-2020: -290.9
> Larceny-thefts reported in 2020: 3,320 — 96th lowest of 203 metros
> Larceny-thefts per 100K people in 2020: 1,197.2 — 69th lowest of 203 metros
> 1-yr. change in all property crime: -364.4 — 34th lowest of 188 metros
> Property crimes per 100K people in 2020: 2,146.0 — 76th highest of 199 metros
> Population: 277,680
[in-text-ad-2]

41. Las Vegas-Henderson-Paradise, NV
> Change in reported larceny-theft rate, 2019-2020: -291.0
> Larceny-thefts reported in 2020: 30,109 — 16th highest of 203 metros
> Larceny-thefts per 100K people in 2020: 1,301.2 — 85th lowest of 203 metros
> 1-yr. change in all property crime: -517.5 — 11th lowest of 188 metros
> Property crimes per 100K people in 2020: 2,046.5 — 90th highest of 199 metros
> Population: 2,266,715

40. Crestview-Fort Walton Beach-Destin, FL
> Change in reported larceny-theft rate, 2019-2020: -291.4
> Larceny-thefts reported in 2020: 2,947 — 90th lowest of 203 metros
> Larceny-thefts per 100K people in 2020: 1,016.1 — 46th lowest of 203 metros
> 1-yr. change in all property crime: -316.0 — 46th lowest of 188 metros
> Property crimes per 100K people in 2020: 1,354.0 — 40th lowest of 199 metros
> Population: 284,809
[in-text-ad]

39. Lake Havasu City-Kingman, AZ
> Change in reported larceny-theft rate, 2019-2020: -294.7
> Larceny-thefts reported in 2020: 3,324 — 97th lowest of 203 metros
> Larceny-thefts per 100K people in 2020: 1,548.7 — 78th highest of 203 metros
> 1-yr. change in all property crime: -475.5 — 18th lowest of 188 metros
> Property crimes per 100K people in 2020: 2,163.3 — 68th highest of 199 metros
> Population: 212,181
[recirclink id=1039645]

38. St. Joseph, MO-KS
> Change in reported larceny-theft rate, 2019-2020: -295.1
> Larceny-thefts reported in 2020: 3,063 — 93rd lowest of 203 metros
> Larceny-thefts per 100K people in 2020: 2,451.8 — 10th highest of 203 metros
> 1-yr. change in all property crime: -331.2 — 42nd lowest of 188 metros
> Property crimes per 100K people in 2020: 3,541.3 — 9th highest of 199 metros
> Population: 125,411

37. San Jose-Sunnyvale-Santa Clara, CA
> Change in reported larceny-theft rate, 2019-2020: -295.1
> Larceny-thefts reported in 2020: 26,867 — 18th highest of 203 metros
> Larceny-thefts per 100K people in 2020: 1,351.5 — 94th lowest of 203 metros
> 1-yr. change in all property crime: -174.0 — 94th highest of 188 metros
> Property crimes per 100K people in 2020: 2,226.6 — 62nd highest of 199 metros
> Population: 1,990,660
[in-text-ad-2]

36. Battle Creek, MI
> Change in reported larceny-theft rate, 2019-2020: -297.9
> Larceny-thefts reported in 2020: 2,326 — 65th lowest of 203 metros
> Larceny-thefts per 100K people in 2020: 1,742.2 — 44th highest of 203 metros
> 1-yr. change in all property crime: N/A
> Property crimes per 100K people in 2020: 2,374.4 — 48th highest of 199 metros
> Population: 134,159
35. Omaha-Council Bluffs, NE-IA
> Change in reported larceny-theft rate, 2019-2020: -302.7
> Larceny-thefts reported in 2020: 15,337 — 28th highest of 203 metros
> Larceny-thefts per 100K people in 2020: 1,606.2 — 65th highest of 203 metros
> 1-yr. change in all property crime: -365.7 — 32nd lowest of 188 metros
> Property crimes per 100K people in 2020: 2,280.9 — 57th highest of 199 metros
> Population: 949,726
[in-text-ad]
34. Sebring-Avon Park, FL
> Change in reported larceny-theft rate, 2019-2020: -303.4
> Larceny-thefts reported in 2020: 1,405 — 30th lowest of 203 metros
> Larceny-thefts per 100K people in 2020: 1,315.7 — 89th lowest of 203 metros
> 1-yr. change in all property crime: -449.0 — 21st lowest of 188 metros
> Property crimes per 100K people in 2020: 1,769.0 — 76th lowest of 199 metros
> Population: 106,221
[recirclink id=1066891]
33. Clarksville, TN-KY
> Change in reported larceny-theft rate, 2019-2020: -306.1
> Larceny-thefts reported in 2020: 4,254 — 90th highest of 203 metros
> Larceny-thefts per 100K people in 2020: 1,364.1 — 97th lowest of 203 metros
> 1-yr. change in all property crime: -407.9 — 24th lowest of 188 metros
> Property crimes per 100K people in 2020: 1,852.5 — 86th lowest of 199 metros
> Population: 311,073

32. Santa Cruz-Watsonville, CA
> Change in reported larceny-theft rate, 2019-2020: -314.1
> Larceny-thefts reported in 2020: 4,252 — 91st highest of 203 metros
> Larceny-thefts per 100K people in 2020: 1,565.5 — 72nd highest of 203 metros
> 1-yr. change in all property crime: -296.5 — 54th lowest of 188 metros
> Property crimes per 100K people in 2020: 2,266.1 — 58th highest of 199 metros
> Population: 273,213
[in-text-ad-2]

31. Ann Arbor, MI
> Change in reported larceny-theft rate, 2019-2020: -320.8
> Larceny-thefts reported in 2020: 3,698 — 99th highest of 203 metros
> Larceny-thefts per 100K people in 2020: 1,002.5 — 43rd lowest of 203 metros
> 1-yr. change in all property crime: -383.8 — 29th lowest of 188 metros
> Property crimes per 100K people in 2020: 1,266.0 — 29th lowest of 199 metros
> Population: 367,601
30. Niles, MI
> Change in reported larceny-theft rate, 2019-2020: -324.5
> Larceny-thefts reported in 2020: 2,030 — 54th lowest of 203 metros
> Larceny-thefts per 100K people in 2020: 1,331.0 — 92nd lowest of 203 metros
> 1-yr. change in all property crime: -287.3 — 58th lowest of 188 metros
> Property crimes per 100K people in 2020: 1,889.6 — 91st lowest of 199 metros
> Population: 153,401
[in-text-ad]

29. Great Falls, MT
> Change in reported larceny-theft rate, 2019-2020: -328.8
> Larceny-thefts reported in 2020: 2,719 — 79th lowest of 203 metros (tied)
> Larceny-thefts per 100K people in 2020: 3,335.0 — the highest of 203 metros
> 1-yr. change in all property crime: -486.9 — 17th lowest of 188 metros
> Property crimes per 100K people in 2020: 3,999.8 — 3rd highest of 199 metros
> Population: 81,366
[recirclink id=1025193]

28. Lafayette, LA
> Change in reported larceny-theft rate, 2019-2020: -329.6
> Larceny-thefts reported in 2020: 8,644 — 47th highest of 203 metros
> Larceny-thefts per 100K people in 2020: 1,764.1 — 41st highest of 203 metros
> 1-yr. change in all property crime: -395.5 — 28th lowest of 188 metros
> Property crimes per 100K people in 2020: 2,487.4 — 42nd highest of 199 metros
> Population: 489,207

27. Albuquerque, NM
> Change in reported larceny-theft rate, 2019-2020: -330.2
> Larceny-thefts reported in 2020: 21,278 — 21st highest of 203 metros
> Larceny-thefts per 100K people in 2020: 2,303.5 — 13th highest of 203 metros
> 1-yr. change in all property crime: N/A
> Property crimes per 100K people in 2020: 3,654.1 — 5th highest of 199 metros
> Population: 914,480
[in-text-ad-2]

26. Dover, DE
> Change in reported larceny-theft rate, 2019-2020: -335.8
> Larceny-thefts reported in 2020: 2,829 — 84th lowest of 203 metros
> Larceny-thefts per 100K people in 2020: 1,540.2 — 81st highest of 203 metros
> 1-yr. change in all property crime: -377.4 — 30th lowest of 188 metros
> Property crimes per 100K people in 2020: 1,853.3 — 87th lowest of 199 metros
> Population: 180,786

25. Sioux City, IA-NE-SD
> Change in reported larceny-theft rate, 2019-2020: -337.6
> Larceny-thefts reported in 2020: 2,409 — 67th lowest of 203 metros
> Larceny-thefts per 100K people in 2020: 1,666.9 — 52nd highest of 203 metros
> 1-yr. change in all property crime: -500.3 — 15th lowest of 188 metros
> Property crimes per 100K people in 2020: 2,301.4 — 55th highest of 199 metros
> Population: 144,670
[in-text-ad]

24. Jackson, MI
> Change in reported larceny-theft rate, 2019-2020: -340.1
> Larceny-thefts reported in 2020: 1,984 — 52nd lowest of 203 metros
> Larceny-thefts per 100K people in 2020: 1,257.3 — 77th lowest of 203 metros
> 1-yr. change in all property crime: -331.3 — 41st lowest of 188 metros
> Property crimes per 100K people in 2020: 1,673.7 — 68th lowest of 199 metros
> Population: 158,510
[recirclink id=1059954]

23. Muskegon, MI
> Change in reported larceny-theft rate, 2019-2020: -340.2
> Larceny-thefts reported in 2020: 2,841 — 87th lowest of 203 metros
> Larceny-thefts per 100K people in 2020: 1,640.6 — 57th highest of 203 metros
> 1-yr. change in all property crime: N/A
> Property crimes per 100K people in 2020: 2,068.0 — 86th highest of 199 metros
> Population: 173,566

22. Stockton, CA
> Change in reported larceny-theft rate, 2019-2020: -344.7
> Larceny-thefts reported in 2020: 12,091 — 34th highest of 203 metros
> Larceny-thefts per 100K people in 2020: 1,584.1 — 67th highest of 203 metros
> 1-yr. change in all property crime: -503.4 — 14th lowest of 188 metros
> Property crimes per 100K people in 2020: 2,332.8 — 53rd highest of 199 metros
> Population: 762,148
[in-text-ad-2]

21. Hot Springs, AR
> Change in reported larceny-theft rate, 2019-2020: -346.4
> Larceny-thefts reported in 2020: 2,052 — 56th lowest of 203 metros
> Larceny-thefts per 100K people in 2020: 2,056.9 — 19th highest of 203 metros
> 1-yr. change in all property crime: N/A
> Property crimes per 100K people in 2020: 3,583.5 — 8th highest of 199 metros
> Population: 99,386

20. Spokane-Spokane Valley, WA
> Change in reported larceny-theft rate, 2019-2020: -355.1
> Larceny-thefts reported in 2020: 14,863 — 29th highest of 203 metros
> Larceny-thefts per 100K people in 2020: 2,594.6 — 5th highest of 203 metros
> 1-yr. change in all property crime: -367.6 — 31st lowest of 188 metros
> Property crimes per 100K people in 2020: 3,478.6 — 10th highest of 199 metros
> Population: 568,521
[in-text-ad]

19. Toledo, OH
> Change in reported larceny-theft rate, 2019-2020: -355.3
> Larceny-thefts reported in 2020: 9,383 — 44th highest of 203 metros
> Larceny-thefts per 100K people in 2020: 1,466.1 — 93rd highest of 203 metros
> 1-yr. change in all property crime: -428.4 — 22nd lowest of 188 metros
> Property crimes per 100K people in 2020: 2,024.4 — 93rd highest of 199 metros
> Population: 641,816
[recirclink id=1017922]

18. Fairbanks, AK
> Change in reported larceny-theft rate, 2019-2020: -362.5
> Larceny-thefts reported in 2020: 975 — 8th lowest of 203 metros
> Larceny-thefts per 100K people in 2020: 2,961.5 — 2nd highest of 203 metros
> 1-yr. change in all property crime: -284.7 — 59th lowest of 188 metros
> Property crimes per 100K people in 2020: 4,152.2 — the highest of 199 metros
> Population: 96,849

17. Vallejo, CA
> Change in reported larceny-theft rate, 2019-2020: -374.3
> Larceny-thefts reported in 2020: 5,695 — 69th highest of 203 metros
> Larceny-thefts per 100K people in 2020: 1,274.0 — 80th lowest of 203 metros
> 1-yr. change in all property crime: -552.7 — 8th lowest of 188 metros
> Property crimes per 100K people in 2020: 2,391.1 — 47th highest of 199 metros
> Population: 447,643
[in-text-ad-2]

16. Lewiston, ID-WA
> Change in reported larceny-theft rate, 2019-2020: -378.7
> Larceny-thefts reported in 2020: 968 — 7th lowest of 203 metros
> Larceny-thefts per 100K people in 2020: 1,525.9 — 84th highest of 203 metros
> 1-yr. change in all property crime: -346.2 — 39th lowest of 188 metros
> Property crimes per 100K people in 2020: 2,060.3 — 88th highest of 199 metros
> Population: 62,990
15. Enid, OK
> Change in reported larceny-theft rate, 2019-2020: -397.3
> Larceny-thefts reported in 2020: 1,039 — 13th lowest of 203 metros
> Larceny-thefts per 100K people in 2020: 1,700.7 — 49th highest of 203 metros
> 1-yr. change in all property crime: -401.9 — 27th lowest of 188 metros
> Property crimes per 100K people in 2020: 2,579.7 — 35th highest of 199 metros
> Population: 61,056
[in-text-ad]

14. Modesto, CA
> Change in reported larceny-theft rate, 2019-2020: -404.4
> Larceny-thefts reported in 2020: 6,927 — 57th highest of 203 metros
> Larceny-thefts per 100K people in 2020: 1,261.3 — 78th lowest of 203 metros
> 1-yr. change in all property crime: -622.7 — 5th lowest of 188 metros
> Property crimes per 100K people in 2020: 1,974.3 — 100th highest of 199 metros
> Population: 550,660
[recirclink id=1039645]
13. Pocatello, ID
> Change in reported larceny-theft rate, 2019-2020: -409.2
> Larceny-thefts reported in 2020: 1,233 — 20th lowest of 203 metros
> Larceny-thefts per 100K people in 2020: 1,274.7 — 81st lowest of 203 metros
> 1-yr. change in all property crime: -299.3 — 51st lowest of 188 metros
> Property crimes per 100K people in 2020: 1,806.1 — 82nd lowest of 199 metros
> Population: 94,588

12. Orlando-Kissimmee-Sanford, FL
> Change in reported larceny-theft rate, 2019-2020: -417.6
> Larceny-thefts reported in 2020: 37,606 — 10th highest of 203 metros
> Larceny-thefts per 100K people in 2020: 1,414.3 — 97th highest of 203 metros
> 1-yr. change in all property crime: -537.9 — 9th lowest of 188 metros
> Property crimes per 100K people in 2020: 1,862.1 — 89th lowest of 199 metros
> Population: 2,608,147
[in-text-ad-2]

11. Monroe, LA
> Change in reported larceny-theft rate, 2019-2020: -426.9
> Larceny-thefts reported in 2020: 5,049 — 78th highest of 203 metros
> Larceny-thefts per 100K people in 2020: 2,536.2 — 6th highest of 203 metros
> 1-yr. change in all property crime: -506.8 — 13th lowest of 188 metros
> Property crimes per 100K people in 2020: 3,654.3 — 4th highest of 199 metros
> Population: 200,261

10. Vineland-Bridgeton, NJ
> Change in reported larceny-theft rate, 2019-2020: -428.2
> Larceny-thefts reported in 2020: 2,446 — 71st lowest of 203 metros (tied)
> Larceny-thefts per 100K people in 2020: 1,646.1 — 56th highest of 203 metros
> 1-yr. change in all property crime: -557.2 — 7th lowest of 188 metros
> Property crimes per 100K people in 2020: 2,148.1 — 75th highest of 199 metros
> Population: 149,527
[in-text-ad]

9. Miami-Fort Lauderdale-Pompano Beach, FL
> Change in reported larceny-theft rate, 2019-2020: -445.5
> Larceny-thefts reported in 2020: 106,985 — 2nd highest of 203 metros
> Larceny-thefts per 100K people in 2020: 1,721.0 — 46th highest of 203 metros
> 1-yr. change in all property crime: -493.8 — 16th lowest of 188 metros
> Property crimes per 100K people in 2020: 2,192.4 — 66th highest of 199 metros
> Population: 6,166,488
[recirclink id=1066891]

8. Atlantic City-Hammonton, NJ
> Change in reported larceny-theft rate, 2019-2020: -449.4
> Larceny-thefts reported in 2020: 3,978 — 95th highest of 203 metros
> Larceny-thefts per 100K people in 2020: 1,517.2 — 87th highest of 203 metros
> 1-yr. change in all property crime: -472.3 — 19th lowest of 188 metros
> Property crimes per 100K people in 2020: 1,927.5 — 95th lowest of 199 metros
> Population: 263,670
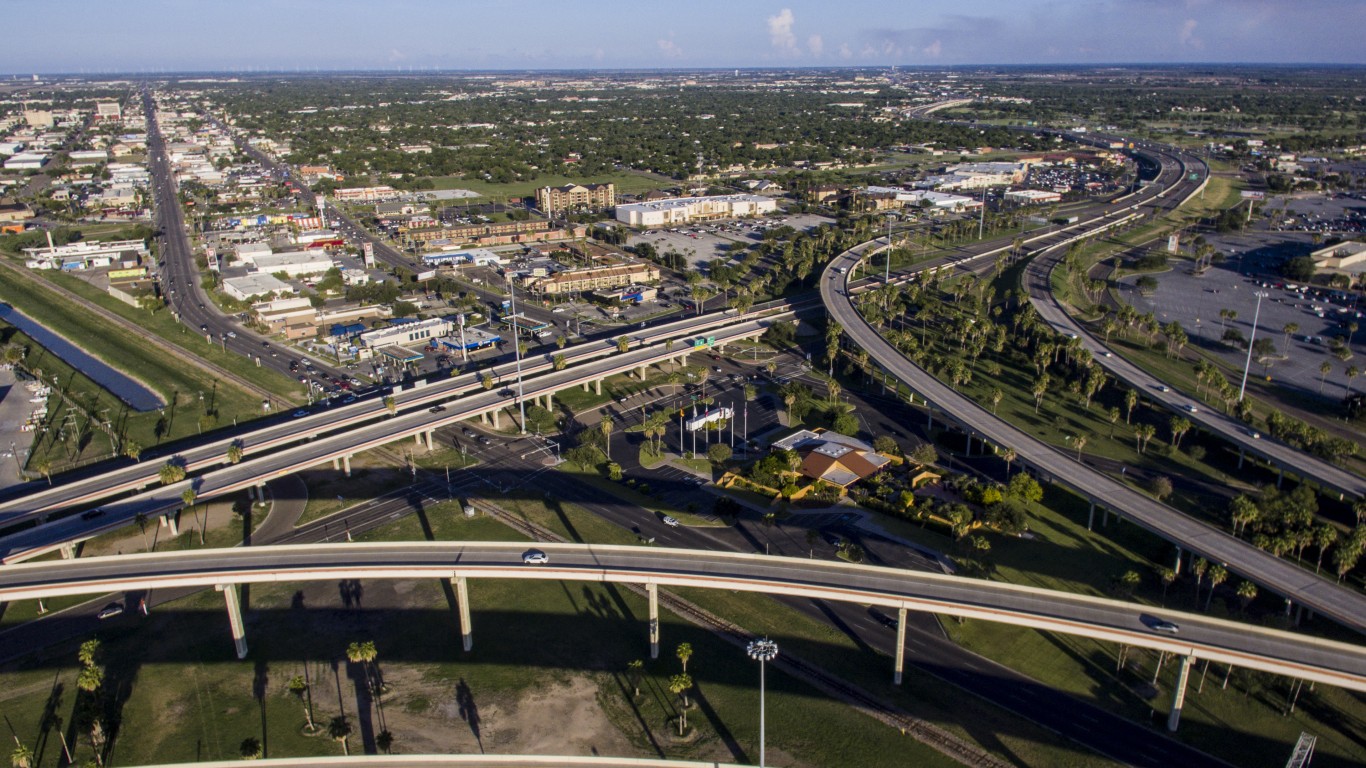
7. Brownsville-Harlingen, TX
> Change in reported larceny-theft rate, 2019-2020: -467.7
> Larceny-thefts reported in 2020: 6,705 — 59th highest of 203 metros
> Larceny-thefts per 100K people in 2020: 1,583.3 — 68th highest of 203 metros
> 1-yr. change in all property crime: -578.1 — 6th lowest of 188 metros
> Property crimes per 100K people in 2020: 1,950.8 — 98th lowest of 199 metros
> Population: 423,163
[in-text-ad-2]
6. Alexandria, LA
> Change in reported larceny-theft rate, 2019-2020: -513.7
> Larceny-thefts reported in 2020: 4,004 — 94th highest of 203 metros
> Larceny-thefts per 100K people in 2020: 2,647.0 — 4th highest of 203 metros
> 1-yr. change in all property crime: -520.0 — 10th lowest of 188 metros
> Property crimes per 100K people in 2020: 4,018.7 — 2nd highest of 199 metros
> Population: 152,037

5. Tallahassee, FL
> Change in reported larceny-theft rate, 2019-2020: -559.3
> Larceny-thefts reported in 2020: 6,075 — 66th highest of 203 metros
> Larceny-thefts per 100K people in 2020: 1,565.1 — 73rd highest of 203 metros
> 1-yr. change in all property crime: -703.9 — 4th lowest of 188 metros
> Property crimes per 100K people in 2020: 2,226.7 — 61st highest of 199 metros
> Population: 386,454
[in-text-ad]

4. Lawton, OK
> Change in reported larceny-theft rate, 2019-2020: -573.3
> Larceny-thefts reported in 2020: 1,305 — 24th lowest of 203 metros
> Larceny-thefts per 100K people in 2020: 1,036.8 — 48th lowest of 203 metros
> 1-yr. change in all property crime: -804.5 — 3rd lowest of 188 metros
> Property crimes per 100K people in 2020: 1,861.6 — 88th lowest of 199 metros
> Population: 126,043
[recirclink id=1025193]

3. Anchorage, AK
> Change in reported larceny-theft rate, 2019-2020: -666.6
> Larceny-thefts reported in 2020: 7,703 — 53rd highest of 203 metros
> Larceny-thefts per 100K people in 2020: 2,523.4 — 8th highest of 203 metros
> 1-yr. change in all property crime: -914.3 — the lowest of 188 metros
> Property crimes per 100K people in 2020: 3,404.7 — 12th highest of 199 metros
> Population: 396,317

2. Kahului-Wailuku-Lahaina, HI
> Change in reported larceny-theft rate, 2019-2020: -674.3
> Larceny-thefts reported in 2020: 2,612 — 77th lowest of 203 metros
> Larceny-thefts per 100K people in 2020: 1,562.4 — 74th highest of 203 metros
> 1-yr. change in all property crime: -860.3 — 2nd lowest of 188 metros
> Property crimes per 100K people in 2020: 2,115.7 — 79th highest of 199 metros
> Population: 167,488
[in-text-ad-2]

1. San Francisco-Oakland-Berkeley, CA
> Change in reported larceny-theft rate, 2019-2020: -733.7
> Larceny-thefts reported in 2020: 92,931 — 3rd highest of 203 metros
> Larceny-thefts per 100K people in 2020: 1,965.0 — 25th highest of 203 metros
> 1-yr. change in all property crime: -515.4 — 12th lowest of 188 metros
> Property crimes per 100K people in 2020: 3,008.2 — 17th highest of 199 metros
> Population: 4,731,803
Methodology
To determine the metro areas where the larceny-theft rate is falling fastest, 24/7 Wall St. reviewed the change in larceny-thefts per 100,000 people from the FBI’s 2019 and 2020 Uniform Crime Reports. Crime rates were calculated using population figures provided by the FBI in the 2020 and 2019 UCR.
Limited data was available in the 2020 UCR for areas in Alabama, Maryland, Pennsylvania, and Illinois, though metro areas in these states were not excluded from analysis. Only metro areas for which the boundaries defined by the FBI match the boundaries as defined by the U.S. Census Bureau were considered. Because some state and local agencies changed reporting practices between 2019 and 2020, the figures are not comparable, and the areas were excluded.
Population figures are five-year estimates from the U.S. Census Bureau’s 2019 American Community Survey.
Contact [email protected] for any questions or corrections.