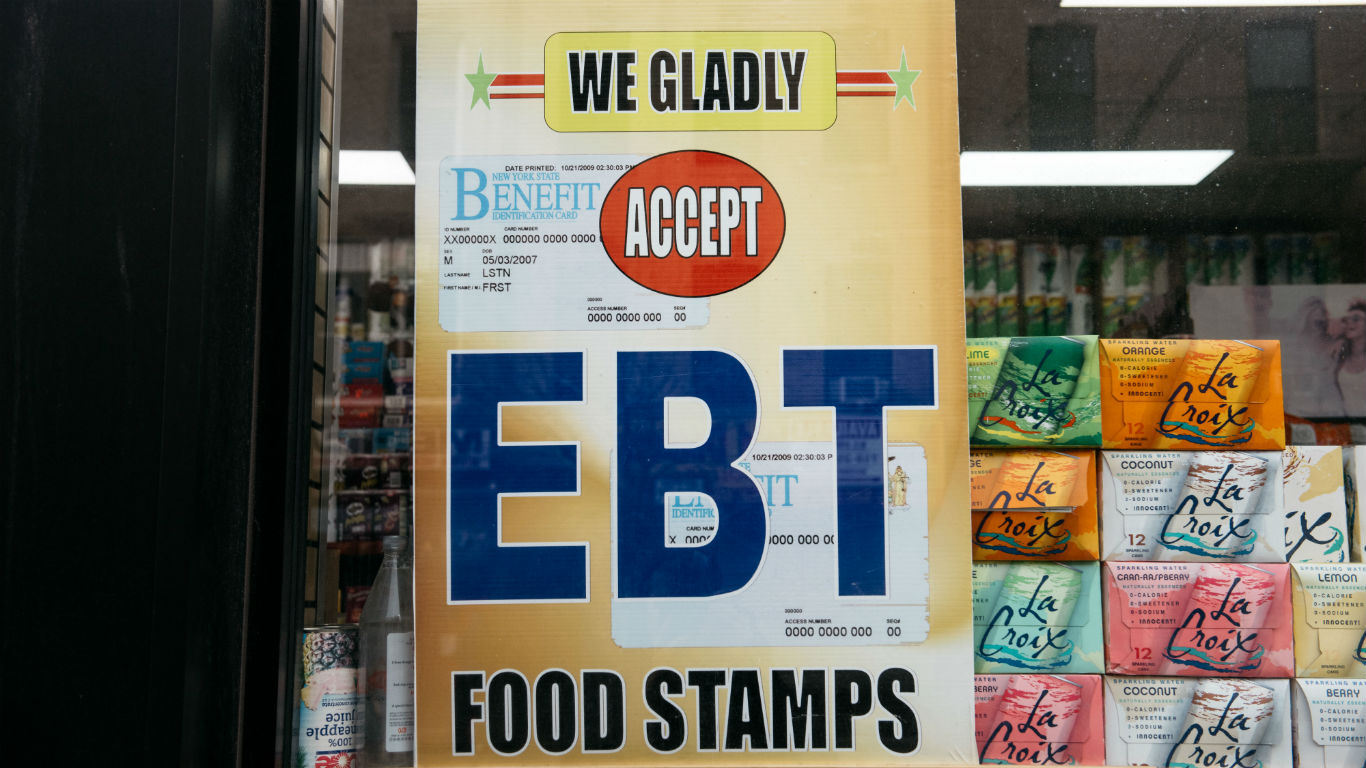
Inflation has driven up the prices of nearly all goods and services, with prices of necessary items, including groceries, up significantly. The cost of a gallon of milk is up 25% compared to pre-pandemic prices. According to a report by Moody’s Analytics, American families pay $311 more each month, on average, for essential goods compared to one year ago. To survive the price hikes, millions of Americans will rely on the government’s food assistance benefits, the Supplemental Nutrition Assistance Program.
As of 2020, roughly 13.8 million American households, about one in 10, received SNAP benefits, formerly known as food stamps. At the more local level, SNAP recipiency is much higher.
To rank the states with the highest SNAP recipiency rates, 24/7 Wall St. reviewed five-year estimates of the share of households that received SNAP benefits in the past 12 months from the U.S. Census Bureau’s 2020 American Community Survey.
SNAP recipiency is primarily determined by income, so as might be expected, states with higher poverty rates also tend to have more households receiving benefits. However, other factors such as assets and household composition impact whether a household qualifies, so there are exceptions to the rule. For example, while Oregon has the fourth highest SNAP recipiency rate, at 15% of households, the state’s poverty rate of 12.4% is slightly lower than the national poverty rate of 12.8%. These are the states where the most children live in Poverty.
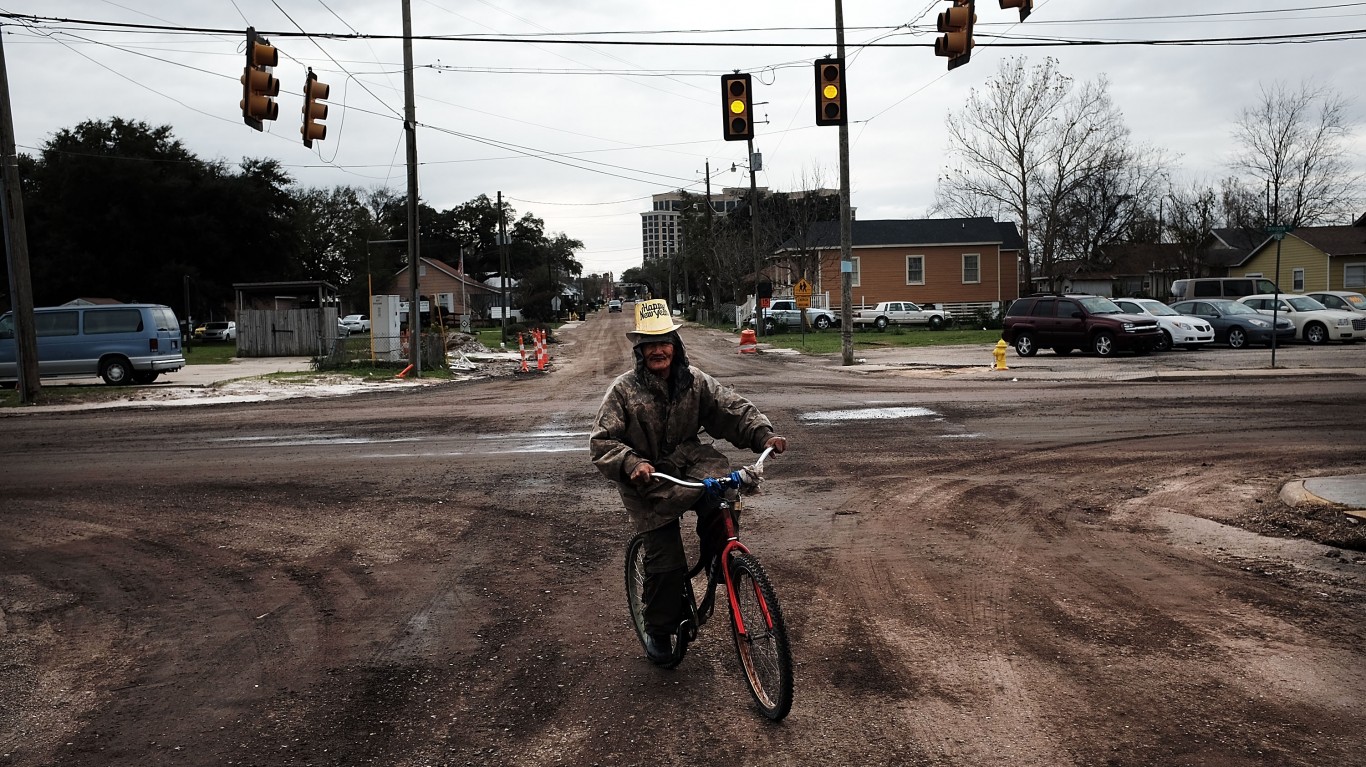
Since income is the primary determinant for SNAP recipiency, unemployment is a major determinant of how many people receive benefits, since those Americans who are out of a job are likely to have little to no income. The three states with the highest SNAP recipiency rates — Louisiana, West Virginia, and New Mexico — all have five-year average unemployment rates of 6.5%, compared to the U.S. five year average unemployment rate of 5.3%. These are the states with the worst spikes in unemployment since the pandemic began.
Click here to see states where the most families need food stamps
Click here to see our detailed methodology
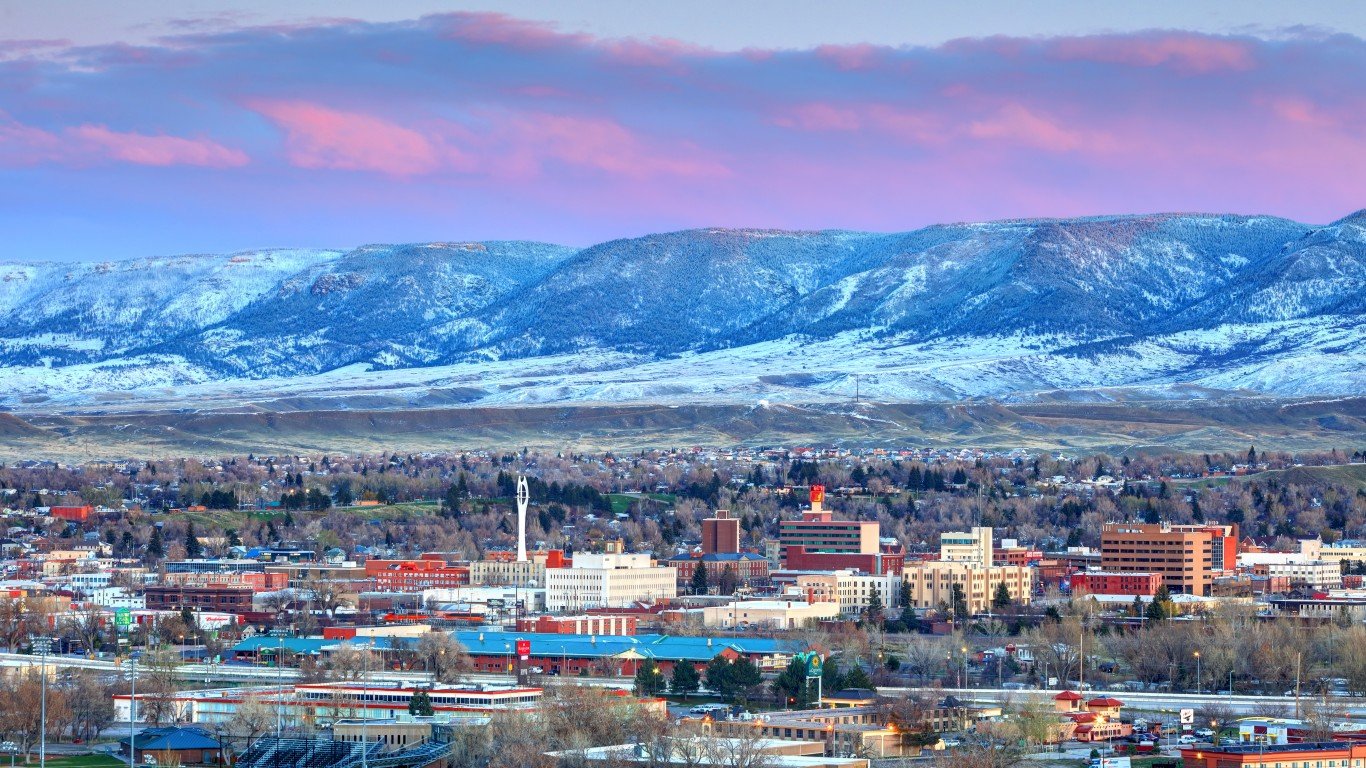
50. Wyoming
> Households receiving SNAP benefits: 5.3%
> Poverty rate: 10.8% (15th lowest)
> Median household income: $65,304 (20th highest)
> Unemployment rate: 4.3% (15th lowest)
[in-text-ad]

49. Utah
> Households receiving SNAP benefits: 6.2%
> Poverty rate: 9.1% (3rd lowest)
> Median household income: $74,197 (12th highest)
> Unemployment rate: 3.6% (5th lowest)
[recirclink id=1112369]

48. New Hampshire
> Households receiving SNAP benefits: 6.4%
> Poverty rate: 7.4% (the lowest)
> Median household income: $77,923 (7th highest)
> Unemployment rate: 3.7% (6th lowest)

47. North Dakota
> Households receiving SNAP benefits: 6.6%
> Poverty rate: 10.5% (14th lowest)
> Median household income: $65,315 (19th highest)
> Unemployment rate: 3.0% (the lowest)
[in-text-ad-2]

46. Kansas
> Households receiving SNAP benefits: 7.2%
> Poverty rate: 11.4% (21st lowest)
> Median household income: $61,091 (21st lowest)
> Unemployment rate: 4.0% (11th lowest)

45. Colorado
> Households receiving SNAP benefits: 7.2%
> Poverty rate: 9.8% (7th lowest)
> Median household income: $75,231 (11th highest)
> Unemployment rate: 4.6% (18th lowest)
[in-text-ad]

44. Minnesota
> Households receiving SNAP benefits: 7.5%
> Poverty rate: 9.3% (5th lowest)
> Median household income: $73,382 (13th highest)
> Unemployment rate: 3.8% (8th lowest)
[recirclink id=1111559]

43. Virginia
> Households receiving SNAP benefits: 7.9%
> Poverty rate: 10.0% (10th lowest)
> Median household income: $76,398 (10th highest)
> Unemployment rate: 4.5% (17th lowest)

42. Nebraska
> Households receiving SNAP benefits: 8.1%
> Poverty rate: 10.4% (13th lowest)
> Median household income: $63,015 (25th highest)
> Unemployment rate: 3.4% (2nd lowest)
[in-text-ad-2]

41. New Jersey
> Households receiving SNAP benefits: 8.4%
> Poverty rate: 9.7% (6th lowest)
> Median household income: $85,245 (2nd highest)
> Unemployment rate: 5.8% (13th highest)

40. South Dakota
> Households receiving SNAP benefits: 8.7%
> Poverty rate: 12.8% (21st highest)
> Median household income: $59,896 (20th lowest)
> Unemployment rate: 3.5% (3rd lowest)
[in-text-ad]

39. Idaho
> Households receiving SNAP benefits: 9.0%
> Poverty rate: 11.9% (23rd lowest)
> Median household income: $58,915 (17th lowest)
> Unemployment rate: 4.2% (13th lowest)
[recirclink id=1047662]

38. California
> Households receiving SNAP benefits: 9.0%
> Poverty rate: 12.6% (24th highest)
> Median household income: $78,672 (6th highest)
> Unemployment rate: 6.1% (7th highest)

37. Indiana
> Households receiving SNAP benefits: 9.3%
> Poverty rate: 12.9% (20th highest)
> Median household income: $58,235 (16th lowest)
> Unemployment rate: 4.7% (19th lowest)
[in-text-ad-2]

36. Montana
> Households receiving SNAP benefits: 9.3%
> Poverty rate: 12.8% (22nd highest)
> Median household income: $56,539 (11th lowest)
> Unemployment rate: 4.1% (12th lowest)

35. Iowa
> Households receiving SNAP benefits: 9.8%
> Poverty rate: 11.1% (19th lowest)
> Median household income: $61,836 (24th lowest)
> Unemployment rate: 3.9% (9th lowest)
[in-text-ad]

34. Maryland
> Households receiving SNAP benefits: 10.1%
> Poverty rate: 9.0% (2nd lowest)
> Median household income: $87,063 (the highest)
> Unemployment rate: 5.1% (23rd lowest)
[recirclink id=1104870]

33. Wisconsin
> Households receiving SNAP benefits: 10.2%
> Poverty rate: 11.0% (17th lowest)
> Median household income: $63,293 (24th highest)
> Unemployment rate: 3.5% (4th lowest)

32. Alaska
> Households receiving SNAP benefits: 10.3%
> Poverty rate: 10.3% (12th lowest)
> Median household income: $77,790 (8th highest)
> Unemployment rate: 6.8% (2nd highest)
[in-text-ad-2]

31. Missouri
> Households receiving SNAP benefits: 10.5%
> Poverty rate: 13.0% (19th highest)
> Median household income: $57,290 (13th lowest)
> Unemployment rate: 4.5% (16th lowest)

30. Arizona
> Households receiving SNAP benefits: 10.5%
> Poverty rate: 14.1% (13th highest)
> Median household income: $61,529 (23rd lowest)
> Unemployment rate: 5.8% (11th highest)
[in-text-ad]

29. Vermont
> Households receiving SNAP benefits: 10.6%
> Poverty rate: 10.8% (16th lowest)
> Median household income: $63,477 (23rd highest)
> Unemployment rate: 3.8% (7th lowest)
[recirclink id=1100321]

28. Delaware
> Households receiving SNAP benefits: 10.6%
> Poverty rate: 11.4% (20th lowest)
> Median household income: $69,110 (16th highest)
> Unemployment rate: 5.8% (12th highest)

27. Hawaii
> Households receiving SNAP benefits: 10.7%
> Poverty rate: 9.3% (4th lowest)
> Median household income: $83,173 (4th highest)
> Unemployment rate: 4.3% (14th lowest)
[in-text-ad-2]

26. Washington
> Households receiving SNAP benefits: 11.1%
> Poverty rate: 10.2% (11th lowest)
> Median household income: $77,006 (9th highest)
> Unemployment rate: 4.8% (20th lowest)

25. South Carolina
> Households receiving SNAP benefits: 11.2%
> Poverty rate: 14.7% (9th highest)
> Median household income: $54,864 (10th lowest)
> Unemployment rate: 5.5% (18th highest)
[in-text-ad]

24. Texas
> Households receiving SNAP benefits: 11.5%
> Poverty rate: 14.2% (12th highest)
> Median household income: $63,826 (21st highest)
> Unemployment rate: 5.3% (25th lowest)
[recirclink id=1112369]

23. Massachusetts
> Households receiving SNAP benefits: 11.6%
> Poverty rate: 9.8% (9th lowest)
> Median household income: $84,385 (3rd highest)
> Unemployment rate: 5.1% (22nd lowest)

22. Connecticut
> Households receiving SNAP benefits: 11.6%
> Poverty rate: 9.8% (8th lowest)
> Median household income: $79,855 (5th highest)
> Unemployment rate: 6.0% (8th highest)
[in-text-ad-2]

21. Nevada
> Households receiving SNAP benefits: 11.6%
> Poverty rate: 12.8% (23rd highest)
> Median household income: $62,043 (25th lowest)
> Unemployment rate: 6.5% (3rd highest)

20. Arkansas
> Households receiving SNAP benefits: 11.7%
> Poverty rate: 16.1% (6th highest)
> Median household income: $49,475 (3rd lowest)
> Unemployment rate: 5.2% (24th lowest)
[in-text-ad]

19. North Carolina
> Households receiving SNAP benefits: 12.0%
> Poverty rate: 14.0% (14th highest)
> Median household income: $56,642 (12th lowest)
> Unemployment rate: 5.3% (22nd highest)
[recirclink id=1111559]

18. Georgia
> Households receiving SNAP benefits: 12.2%
> Poverty rate: 14.3% (11th highest)
> Median household income: $61,224 (22nd lowest)
> Unemployment rate: 5.5% (15th highest)

17. Illinois
> Households receiving SNAP benefits: 12.4%
> Poverty rate: 12.0% (25th lowest)
> Median household income: $68,428 (17th highest)
> Unemployment rate: 5.9% (10th highest)
[in-text-ad-2]

16. Ohio
> Households receiving SNAP benefits: 12.6%
> Poverty rate: 13.6% (16th highest)
> Median household income: $58,116 (15th lowest)
> Unemployment rate: 5.3% (25th highest)

15. Tennessee
> Households receiving SNAP benefits: 12.6%
> Poverty rate: 14.6% (10th highest)
> Median household income: $54,833 (9th lowest)
> Unemployment rate: 5.3% (24th highest)
[in-text-ad]

14. Maine
> Households receiving SNAP benefits: 12.6%
> Poverty rate: 11.1% (18th lowest)
> Median household income: $59,489 (19th lowest)
> Unemployment rate: 4.0% (10th lowest)
[recirclink id=1047662]

13. Oklahoma
> Households receiving SNAP benefits: 12.6%
> Poverty rate: 15.3% (8th highest)
> Median household income: $53,840 (8th lowest)
> Unemployment rate: 5.0% (21st lowest)

12. Michigan
> Households receiving SNAP benefits: 12.7%
> Poverty rate: 13.7% (15th highest)
> Median household income: $59,234 (18th lowest)
> Unemployment rate: 6.0% (9th highest)
[in-text-ad-2]

11. Kentucky
> Households receiving SNAP benefits: 13.0%
> Poverty rate: 16.6% (5th highest)
> Median household income: $52,238 (7th lowest)
> Unemployment rate: 5.3% (23rd highest)

10. Pennsylvania
> Households receiving SNAP benefits: 13.1%
> Poverty rate: 12.0% (24th lowest)
> Median household income: $63,627 (22nd highest)
> Unemployment rate: 5.3% (21st highest)
[in-text-ad]

9. Florida
> Households receiving SNAP benefits: 13.2%
> Poverty rate: 13.3% (18th highest)
> Median household income: $57,703 (14th lowest)
> Unemployment rate: 5.4% (20th highest)
[recirclink id=1104870]

8. Alabama
> Households receiving SNAP benefits: 13.4%
> Poverty rate: 16.0% (7th highest)
> Median household income: $52,035 (6th lowest)
> Unemployment rate: 5.5% (16th highest)

7. New York
> Households receiving SNAP benefits: 14.3%
> Poverty rate: 13.6% (17th highest)
> Median household income: $71,117 (14th highest)
> Unemployment rate: 5.7% (14th highest)
[in-text-ad-2]

6. Mississippi
> Households receiving SNAP benefits: 14.6%
> Poverty rate: 19.6% (the highest)
> Median household income: $46,511 (the lowest)
> Unemployment rate: 7.1% (the highest)

5. Rhode Island
> Households receiving SNAP benefits: 14.8%
> Poverty rate: 11.6% (22nd lowest)
> Median household income: $70,305 (15th highest)
> Unemployment rate: 5.5% (17th highest)
[in-text-ad]

4. Oregon
> Households receiving SNAP benefits: 15.0%
> Poverty rate: 12.4% (25th highest)
> Median household income: $65,667 (18th highest)
> Unemployment rate: 5.4% (19th highest)
[recirclink id=1100321]

3. Louisiana
> Households receiving SNAP benefits: 15.3%
> Poverty rate: 18.6% (2nd highest)
> Median household income: $50,800 (4th lowest)
> Unemployment rate: 6.5% (5th highest)

2. West Virginia
> Households receiving SNAP benefits: 16.5%
> Poverty rate: 17.1% (4th highest)
> Median household income: $48,037 (2nd lowest)
> Unemployment rate: 6.5% (4th highest)
[in-text-ad-2]

1. New Mexico
> Households receiving SNAP benefits: 17.0%
> Poverty rate: 18.6% (3rd highest)
> Median household income: $51,243 (5th lowest)
> Unemployment rate: 6.5% (6th highest)
Methodology
To determine the states with the highest SNAP recipiency rates, 24/7 Wall St. reviewed five-year estimates of the share of households that received SNAP benefits, formerly food stamps, in the past 12 months from the U.S. Census Bureau’s 2020 American Community Survey.
States were ranked based on the share of households receiving SNAP benefits. To break ties, we used the number of households that received SNAP benefits in the past 12 months.
Additional information on poverty rate, median household income, and unemployment rate are also five-year estimates from the 2020 ACS. Because the Census Bureau didn’t release one-year estimates for 2020 due to data collection issues caused by the COVID-19 pandemic, all ACS data are five-year estimates.
Contact [email protected] for any questions or corrections.