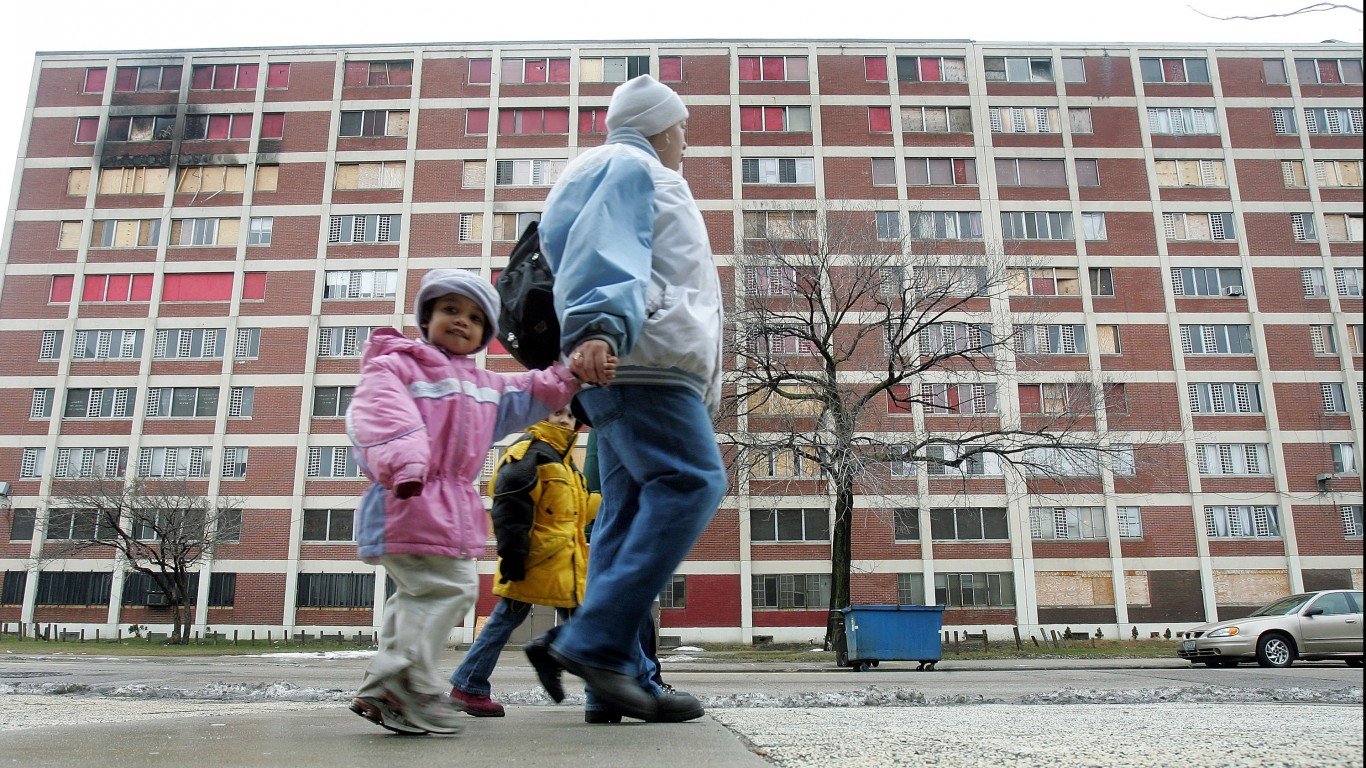
More than 40 million Americans live below the poverty line – an income threshold of about $35 per day, or $1,073 a month. Of those facing such extreme financial hardship, children are disproportionately affected.
The United States has one of the worst child poverty rates among wealthy, developed countries – and nearly 12.6 million children and youth under age 18 live in households with poverty level income. Not only are children at higher risk of poverty, they are also especially vulnerable to poverty’s harmful effects, both in the immediate and long-term.
Childhood poverty can negatively impact brain development and has been linked with a greater likelihood of chronic illness, shorter life expectancy, and poor emotional and behavioral health. Those who spend some or all of their childhood in poverty are also less likely to succeed in school or be financially secure later in life.
Nationwide, an estimated 17.5% of children under age 18 live below the poverty line. This share varies from place to place, however, and in some parts of the country, child poverty is far more common than average. Using data from the U.S. Census Bureau, 24/7 Wall St. identified the 50 metropolitan areas with the highest child poverty rates.
Among the places on this list, child poverty rates range from 25.3% to nearly 40%. The metro areas on the list are disproportionately concentrated in the South, including seven in Georgia alone. Here is a look at the income a family needs to cover normal living expenses in every state.
Children raised in mother-only households are far more likely to live in poverty than those in two-adult households, and in nearly every metro area on this list, the share of households headed by single mothers exceeds the 11.7% share nationwide. Additionally, in nearly every metro area on this list, families are more likely to depend on government assistance to afford basic necessities. In all but one of these metro areas, the share of households with children receiving SNAP benefits, or food stamps, exceeds the 18.2% national share. Here is a look at the cities with the most people on food stamps.
Click here to see the metro areas with the highest child poverty rates
Click here to read our detailed methodology

50. Kingsport-Bristol, TN-VA
> Child poverty rate: 25.3%
> Median family income, households with children: $56,622 — 60th lowest of 378 metros
> Share of households with children receiving SNAP benefits: 24.5% — 86th highest of 378 metros
> Households headed by single mothers: 10.9% — 146th lowest of 378 metros
[in-text-ad]

49. Saginaw, MI
> Child poverty rate: 25.4%
> Median family income, households with children: $56,107 — 53rd lowest of 378 metros
> Share of households with children receiving SNAP benefits: 28.3% — 42nd highest of 378 metros
> Households headed by single mothers: 14.5% — 70th highest of 378 metros
[recirclink id=1106510]

48. Dalton, GA
> Child poverty rate: 25.5%
> Median family income, households with children: $53,096 — 32nd lowest of 378 metros
> Share of households with children receiving SNAP benefits: 16.8% — 132nd lowest of 378 metros
> Households headed by single mothers: 11.8% — 184th highest of 378 metros

47. Greenville, NC
> Child poverty rate: 25.6%
> Median family income, households with children: $60,668 — 91st lowest of 378 metros
> Share of households with children receiving SNAP benefits: 24.5% — 88th highest of 378 metros
> Households headed by single mothers: 18.2% — 9th highest of 378 metros
[in-text-ad-2]

46. Charleston, WV
> Child poverty rate: 25.7%
> Median family income, households with children: $59,145 — 79th lowest of 378 metros
> Share of households with children receiving SNAP benefits: 30.5% — 19th highest of 378 metros
> Households headed by single mothers: 11.1% — 156th lowest of 378 metros

45. Lafayette, LA
> Child poverty rate: 25.9%
> Median family income, households with children: $65,506 — 151st lowest of 378 metros
> Share of households with children receiving SNAP benefits: 24.1% — 93rd highest of 378 metros
> Households headed by single mothers: 13.9% — 82nd highest of 378 metros
[in-text-ad]
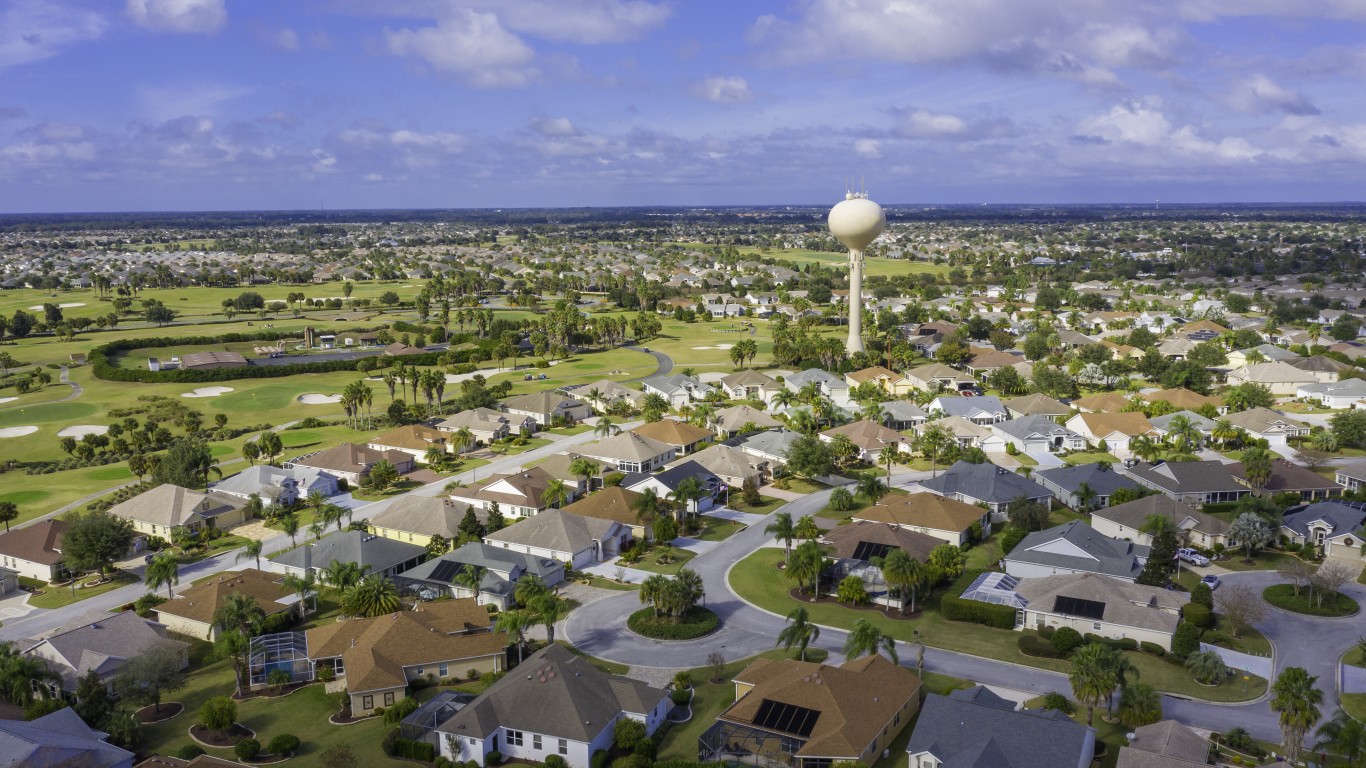
44. The Villages, FL
> Child poverty rate: 25.9%
> Median family income, households with children: $51,181 — 20th lowest of 378 metros
> Share of households with children receiving SNAP benefits: 28.0% — 44th highest of 378 metros
> Households headed by single mothers: 3.2% — the lowest of 378 metros
[recirclink id=1047662]

43. Ocala, FL
> Child poverty rate: 26.1%
> Median family income, households with children: $49,422 — 13th lowest of 378 metros
> Share of households with children receiving SNAP benefits: 30.0% — 21st highest of 378 metros
> Households headed by single mothers: 10.7% — 138th lowest of 378 metros

42. Jackson, TN
> Child poverty rate: 26.1%
> Median family income, households with children: $52,374 — 26th lowest of 378 metros
> Share of households with children receiving SNAP benefits: 26.0% — 64th highest of 378 metros
> Households headed by single mothers: 15.3% — 47th highest of 378 metros
[in-text-ad-2]

41. Merced, CA
> Child poverty rate: 26.2%
> Median family income, households with children: $52,907 — 31st lowest of 378 metros
> Share of households with children receiving SNAP benefits: 30.6% — 18th highest of 378 metros
> Households headed by single mothers: 16.1% — 34th highest of 378 metros

40. Niles, MI
> Child poverty rate: 26.2%
> Median family income, households with children: $62,868 — 119th lowest of 378 metros
> Share of households with children receiving SNAP benefits: 24.5% — 87th highest of 378 metros
> Households headed by single mothers: 13.2% — 107th highest of 378 metros
[in-text-ad]
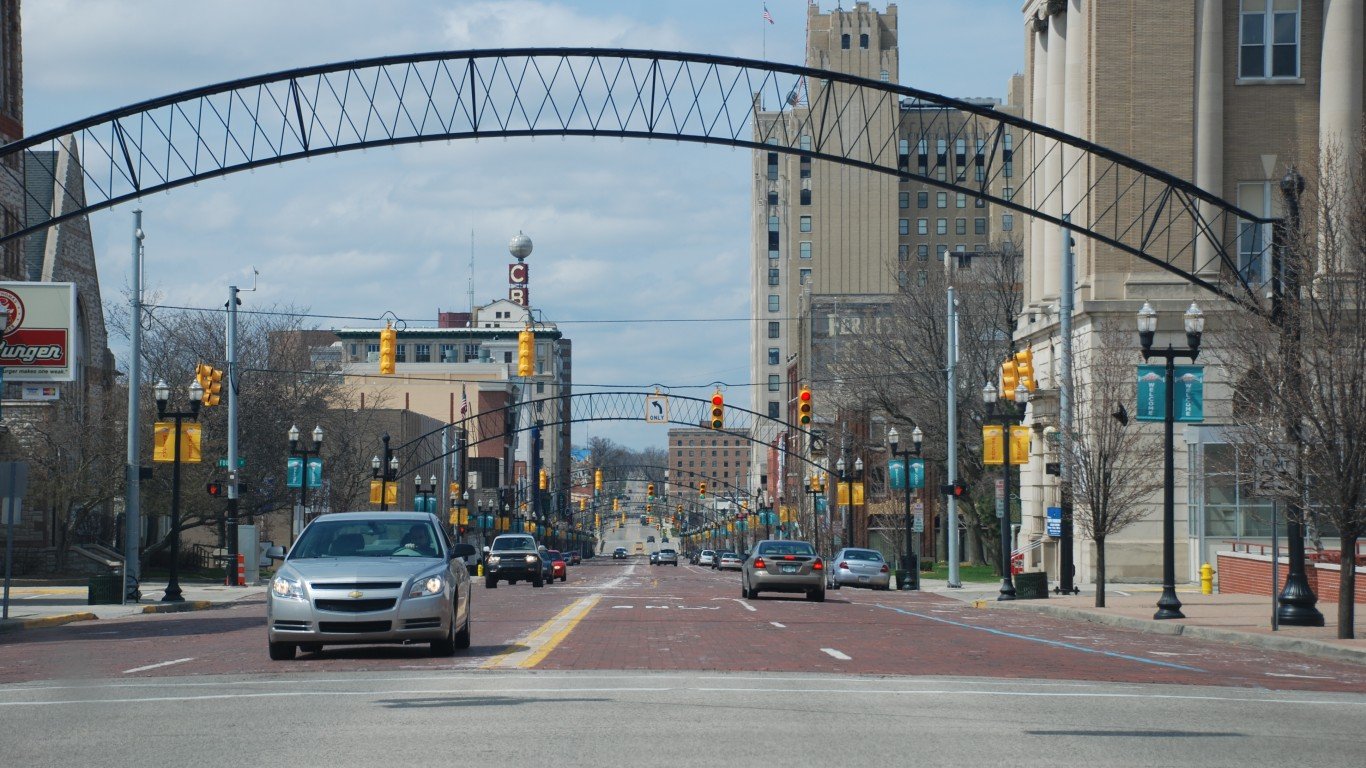
39. Flint, MI
> Child poverty rate: 26.3%
> Median family income, households with children: $53,444 — 33rd lowest of 378 metros
> Share of households with children receiving SNAP benefits: 31.1% — 15th highest of 378 metros
> Households headed by single mothers: 15.8% — 37th highest of 378 metros
[recirclink id=1092222]

38. Yuma, AZ
> Child poverty rate: 26.4%
> Median family income, households with children: $51,799 — 21st lowest of 378 metros
> Share of households with children receiving SNAP benefits: 28.3% — 40th highest of 378 metros
> Households headed by single mothers: 13.9% — 85th highest of 378 metros

37. El Paso, TX
> Child poverty rate: 26.4%
> Median family income, households with children: $50,894 — 17th lowest of 378 metros
> Share of households with children receiving SNAP benefits: 31.3% — 13th highest of 378 metros
> Households headed by single mothers: 16.8% — 23rd highest of 378 metros
[in-text-ad-2]

36. Florence, SC
> Child poverty rate: 26.5%
> Median family income, households with children: $57,018 — 69th lowest of 378 metros
> Share of households with children receiving SNAP benefits: 28.5% — 38th highest of 378 metros
> Households headed by single mothers: 18.2% — 8th highest of 378 metros

35. Battle Creek, MI
> Child poverty rate: 26.6%
> Median family income, households with children: $58,354 — 74th lowest of 378 metros
> Share of households with children receiving SNAP benefits: 18.9% — 181st lowest of 378 metros
> Households headed by single mothers: 14.9% — 62nd highest of 378 metros
[in-text-ad]

34. Columbus, GA-AL
> Child poverty rate: 27.1%
> Median family income, households with children: $56,806 — 64th lowest of 378 metros
> Share of households with children receiving SNAP benefits: 25.6% — 69th highest of 378 metros
> Households headed by single mothers: 17.7% — 14th highest of 378 metros
[recirclink id=1097516]

33. Fort Smith, AR-OK
> Child poverty rate: 27.1%
> Median family income, households with children: $52,779 — 30th lowest of 378 metros
> Share of households with children receiving SNAP benefits: 21.5% — 141st highest of 378 metros
> Households headed by single mothers: 12.5% — 144th highest of 378 metros

32. Memphis, TN-MS-AR
> Child poverty rate: 27.2%
> Median family income, households with children: $59,762 — 82nd lowest of 378 metros
> Share of households with children receiving SNAP benefits: 24.4% — 89th highest of 378 metros
> Households headed by single mothers: 18.5% — 7th highest of 378 metros
[in-text-ad-2]

31. Rocky Mount, NC
> Child poverty rate: 27.4%
> Median family income, households with children: $44,629 — 4th lowest of 378 metros
> Share of households with children receiving SNAP benefits: 33.3% — 9th highest of 378 metros
> Households headed by single mothers: 19.5% — 3rd highest of 378 metros

30. Mobile, AL
> Child poverty rate: 27.4%
> Median family income, households with children: $56,503 — 58th lowest of 378 metros
> Share of households with children receiving SNAP benefits: 26.5% — 54th highest of 378 metros
> Households headed by single mothers: 15.2% — 51st highest of 378 metros
[in-text-ad]

29. Sumter, SC
> Child poverty rate: 27.5%
> Median family income, households with children: $48,688 — 12th lowest of 378 metros
> Share of households with children receiving SNAP benefits: 28.0% — 45th highest of 378 metros
> Households headed by single mothers: 16.7% — 24th highest of 378 metros
[recirclink id=1012509]
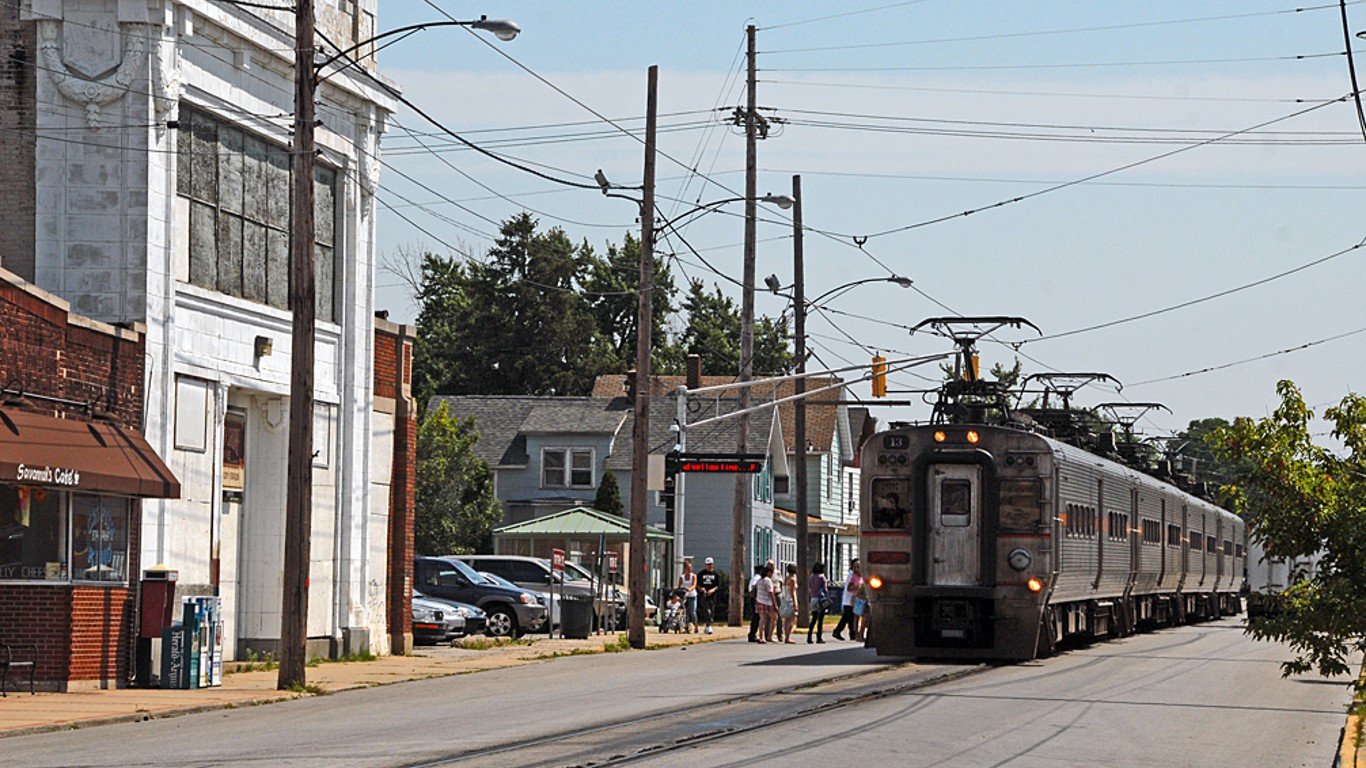
28. Michigan City-La Porte, IN
> Child poverty rate: 27.5%
> Median family income, households with children: $63,318 — 124th lowest of 378 metros
> Share of households with children receiving SNAP benefits: 22.3% — 119th highest of 378 metros
> Households headed by single mothers: 13.6% — 95th highest of 378 metros

27. Dothan, AL
> Child poverty rate: 27.6%
> Median family income, households with children: $57,611 — 73rd lowest of 378 metros
> Share of households with children receiving SNAP benefits: 26.4% — 58th highest of 378 metros
> Households headed by single mothers: 12.5% — 141st highest of 378 metros
[in-text-ad-2]

26. Brunswick, GA
> Child poverty rate: 27.7%
> Median family income, households with children: $56,222 — 54th lowest of 378 metros
> Share of households with children receiving SNAP benefits: 24.8% — 81st highest of 378 metros
> Households headed by single mothers: 13.3% — 103rd highest of 378 metros

25. Youngstown-Warren-Boardman, OH-PA
> Child poverty rate: 27.7%
> Median family income, households with children: $57,485 — 71st lowest of 378 metros
> Share of households with children receiving SNAP benefits: 28.9% — 32nd highest of 378 metros
> Households headed by single mothers: 13.5% — 100th highest of 378 metros
[in-text-ad]

24. Madera, CA
> Child poverty rate: 27.7%
> Median family income, households with children: $55,887 — 49th lowest of 378 metros
> Share of households with children receiving SNAP benefits: 31.3% — 14th highest of 378 metros
> Households headed by single mothers: 12.1% — 170th highest of 378 metros
[recirclink id=1106510]

23. Bakersfield, CA
> Child poverty rate: 27.7%
> Median family income, households with children: $54,299 — 43rd lowest of 378 metros
> Share of households with children receiving SNAP benefits: 26.4% — 57th highest of 378 metros
> Households headed by single mothers: 14.7% — 67th highest of 378 metros
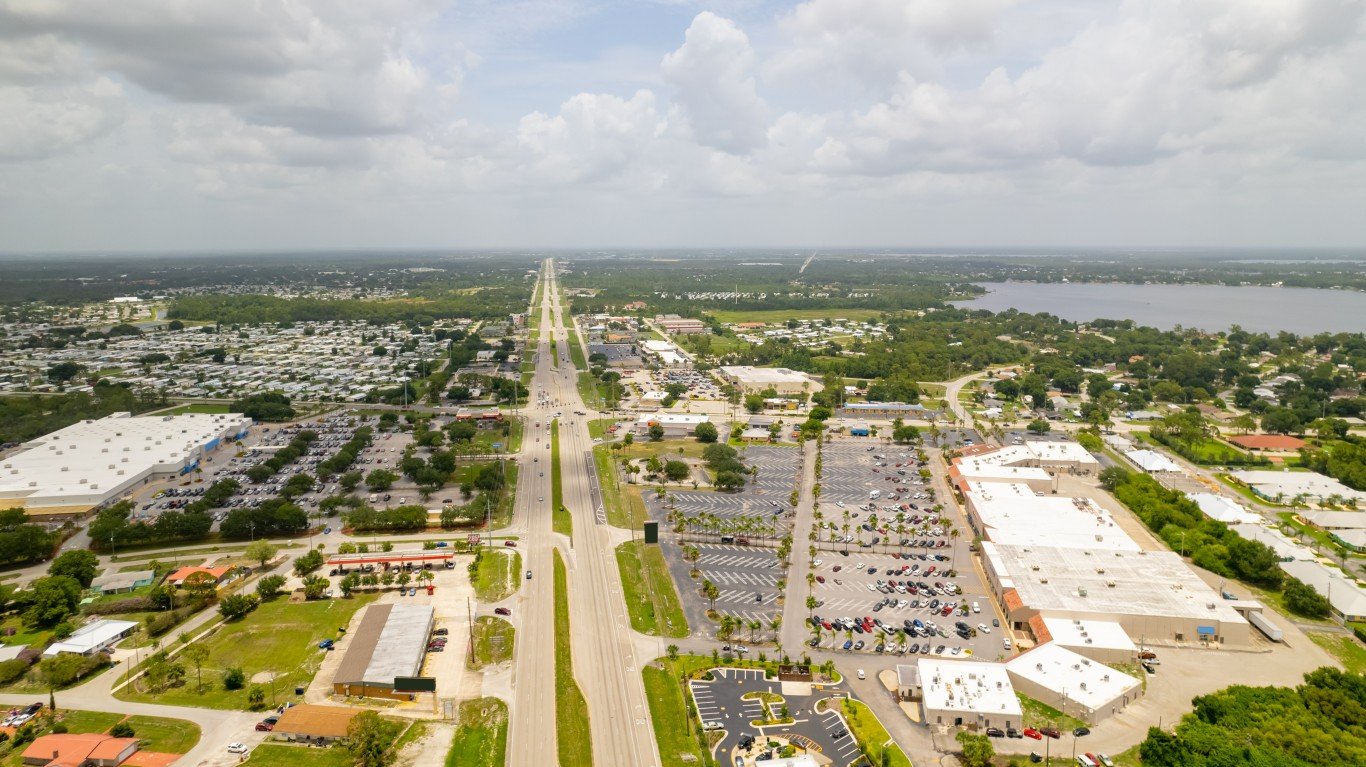
22. Sebring-Avon Park, FL
> Child poverty rate: 27.7%
> Median family income, households with children: $50,391 — 16th lowest of 378 metros
> Share of households with children receiving SNAP benefits: 27.5% — 48th highest of 378 metros
> Households headed by single mothers: 8.9% — 51st lowest of 378 metros
[in-text-ad-2]

21. Pine Bluff, AR
> Child poverty rate: 28.6%
> Median family income, households with children: $44,893 — 5th lowest of 378 metros
> Share of households with children receiving SNAP benefits: 26.4% — 60th highest of 378 metros
> Households headed by single mothers: 17.4% — 18th highest of 378 metros

20. Hot Springs, AR
> Child poverty rate: 28.6%
> Median family income, households with children: $51,803 — 22nd lowest of 378 metros
> Share of households with children receiving SNAP benefits: 24.2% — 92nd highest of 378 metros
> Households headed by single mothers: 13.5% — 101st highest of 378 metros
[in-text-ad]

19. Rome, GA
> Child poverty rate: 28.7%
> Median family income, households with children: $53,986 — 38th lowest of 378 metros
> Share of households with children receiving SNAP benefits: 21.8% — 134th highest of 378 metros
> Households headed by single mothers: 15.0% — 59th highest of 378 metros
[recirclink id=1047662]
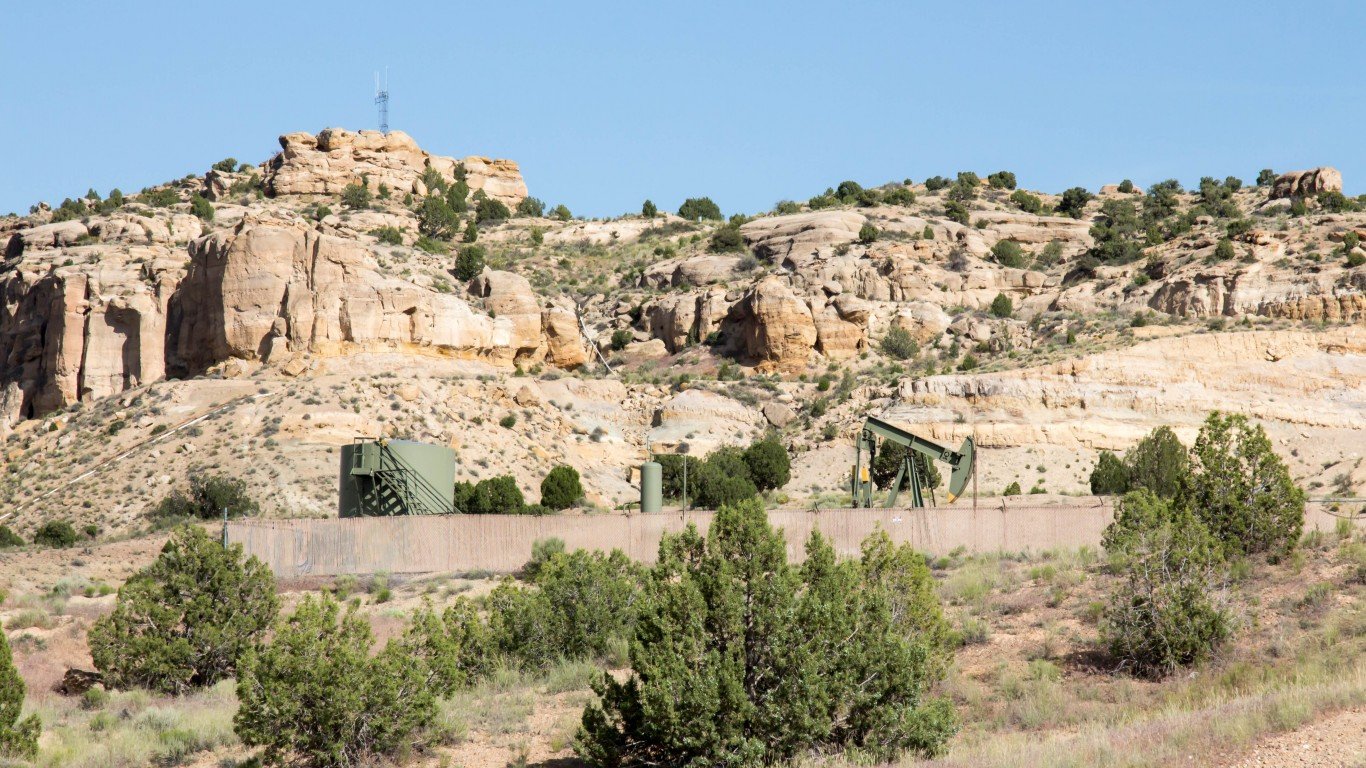
18. Farmington, NM
> Child poverty rate: 28.8%
> Median family income, households with children: $51,100 — 19th lowest of 378 metros
> Share of households with children receiving SNAP benefits: 31.4% — 12th highest of 378 metros
> Households headed by single mothers: 14.0% — 81st highest of 378 metros

17. Hammond, LA
> Child poverty rate: 29.0%
> Median family income, households with children: $61,506 — 102nd lowest of 378 metros
> Share of households with children receiving SNAP benefits: 29.1% — 29th highest of 378 metros
> Households headed by single mothers: 17.5% — 17th highest of 378 metros
[in-text-ad-2]

16. Visalia, CA
> Child poverty rate: 29.3%
> Median family income, households with children: $48,294 — 10th lowest of 378 metros
> Share of households with children receiving SNAP benefits: 34.6% — 6th highest of 378 metros
> Households headed by single mothers: 15.4% — 46th highest of 378 metros

15. Fresno, CA
> Child poverty rate: 29.5%
> Median family income, households with children: $54,188 — 42nd lowest of 378 metros
> Share of households with children receiving SNAP benefits: 31.8% — 11th highest of 378 metros
> Households headed by single mothers: 16.1% — 33rd highest of 378 metros
[in-text-ad]

14. Valdosta, GA
> Child poverty rate: 30.0%
> Median family income, households with children: $52,477 — 27th lowest of 378 metros
> Share of households with children receiving SNAP benefits: 28.5% — 36th highest of 378 metros
> Households headed by single mothers: 16.3% — 27th highest of 378 metros
[recirclink id=1092222]
13. Goldsboro, NC
> Child poverty rate: 30.3%
> Median family income, households with children: $48,333 — 11th lowest of 378 metros
> Share of households with children receiving SNAP benefits: 28.5% — 37th highest of 378 metros
> Households headed by single mothers: 15.7% — 39th highest of 378 metros

12. Hattiesburg, MS
> Child poverty rate: 30.3%
> Median family income, households with children: $56,265 — 55th lowest of 378 metros
> Share of households with children receiving SNAP benefits: 26.6% — 53rd highest of 378 metros
> Households headed by single mothers: 16.4% — 26th highest of 378 metros
[in-text-ad-2]

11. El Centro, CA
> Child poverty rate: 30.3%
> Median family income, households with children: $53,566 — 35th lowest of 378 metros
> Share of households with children receiving SNAP benefits: 37.3% — 3rd highest of 378 metros
> Households headed by single mothers: 15.7% — 38th highest of 378 metros

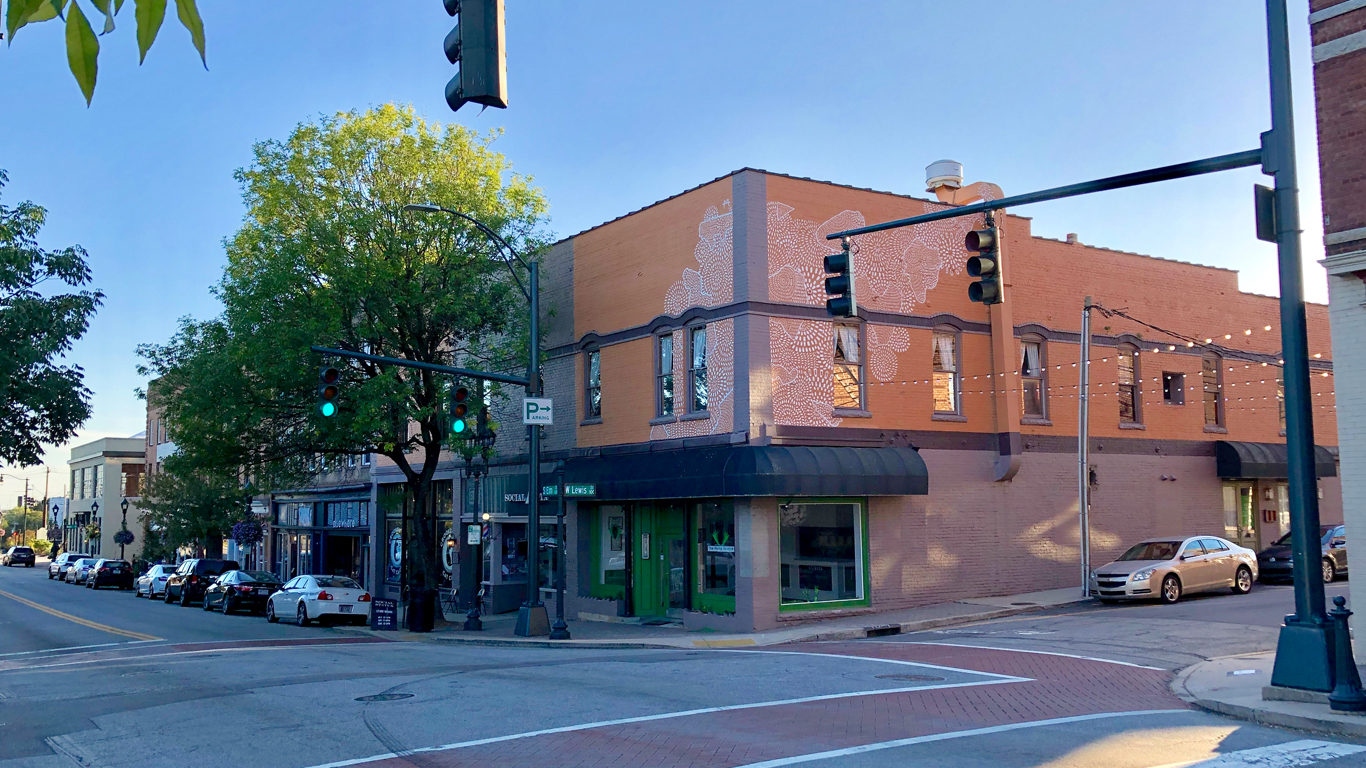
10. Danville, IL
> Child poverty rate: 30.5%
> Median family income, households with children: $46,539 — 7th lowest of 378 metros
> Share of households with children receiving SNAP benefits: 30.7% — 17th highest of 378 metros
> Households headed by single mothers: 16.3% — 30th highest of 378 metros
[in-text-ad]

9. Beckley, WV
> Child poverty rate: 30.6%
> Median family income, households with children: $52,536 — 28th lowest of 378 metros
> Share of households with children receiving SNAP benefits: 31.0% — 16th highest of 378 metros
> Households headed by single mothers: 11.4% — 168th lowest of 378 metros
[recirclink id=1097516]

8. Shreveport-Bossier City, LA
> Child poverty rate: 30.6%
> Median family income, households with children: $52,063 — 25th lowest of 378 metros
> Share of households with children receiving SNAP benefits: 25.9% — 65th highest of 378 metros
> Households headed by single mothers: 18.2% — 10th highest of 378 metros

7. Macon-Bibb County, GA
> Child poverty rate: 30.7%
> Median family income, households with children: $56,887 — 67th lowest of 378 metros
> Share of households with children receiving SNAP benefits: 26.6% — 52nd highest of 378 metros
> Households headed by single mothers: 17.8% — 12th highest of 378 metros
[in-text-ad-2]

6. Laredo, TX
> Child poverty rate: 34.0%
> Median family income, households with children: $49,653 — 15th lowest of 378 metros
> Share of households with children receiving SNAP benefits: 34.5% — 8th highest of 378 metros
> Households headed by single mothers: 19.7% — 2nd highest of 378 metros

5. Albany, GA
> Child poverty rate: 34.2%
> Median family income, households with children: $45,841 — 6th lowest of 378 metros
> Share of households with children receiving SNAP benefits: 35.5% — 4th highest of 378 metros
> Households headed by single mothers: 21.8% — the highest of 378 metros
[in-text-ad]

4. Las Cruces, NM
> Child poverty rate: 34.7%
> Median family income, households with children: $43,555 — 3rd lowest of 378 metros
> Share of households with children receiving SNAP benefits: 37.3% — 2nd highest of 378 metros
> Households headed by single mothers: 14.9% — 63rd highest of 378 metros
[recirclink id=1012509]

3. Monroe, LA
> Child poverty rate: 35.4%
> Median family income, households with children: $49,579 — 14th lowest of 378 metros
> Share of households with children receiving SNAP benefits: 29.4% — 25th highest of 378 metros
> Households headed by single mothers: 17.7% — 13th highest of 378 metros
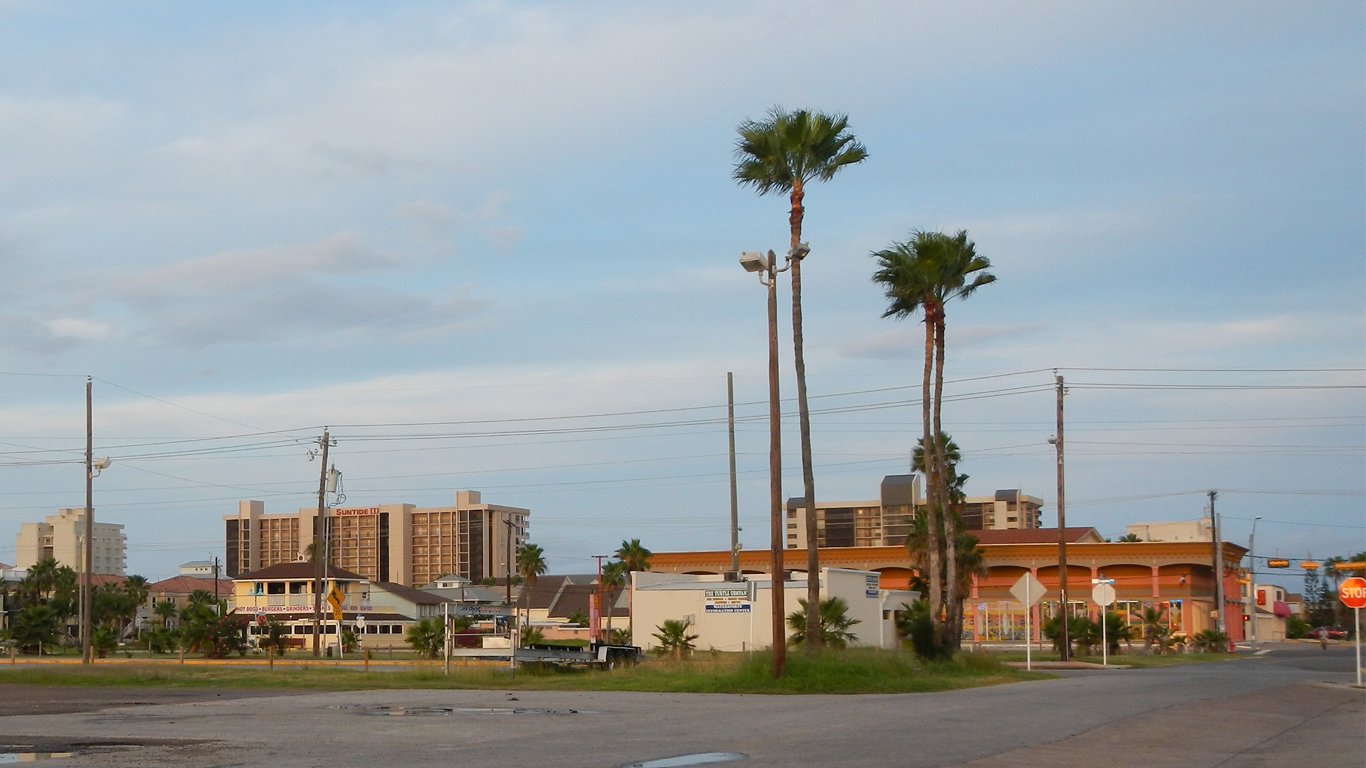
2. Brownsville-Harlingen, TX
> Child poverty rate: 38.3%
> Median family income, households with children: $41,057 — the lowest of 378 metros
> Share of households with children receiving SNAP benefits: 35.1% — 5th highest of 378 metros
> Households headed by single mothers: 18.0% — 11th highest of 378 metros
[in-text-ad-2]
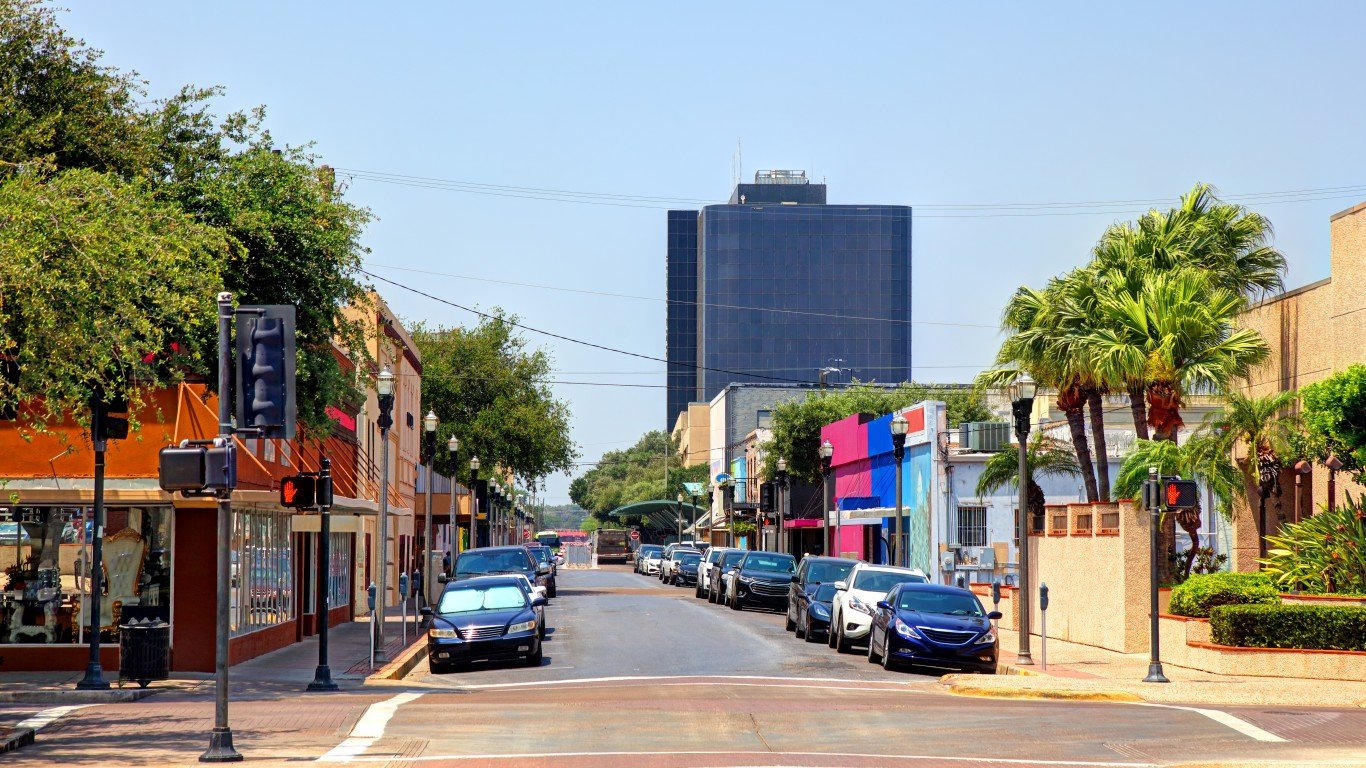
1. McAllen-Edinburg-Mission, TX
> Child poverty rate: 39.6%
> Median family income, households with children: $41,938 — 2nd lowest of 378 metros
> Share of households with children receiving SNAP benefits: 39.3% — the highest of 378 metros
> Households headed by single mothers: 18.6% — 5th highest of 378 metros
Methodology
To determine the metro areas where the most children live in poverty, 24/7 Wall St. reviewed five-year estimates of child poverty rates from the U.S. Census Bureau’s 2020 American Community Survey.
We used the 384 metropolitan statistical areas as delineated by the United States Office of Management and Budget and used by the Census Bureau as our definition of metros.
Metro areas were ranked based on the share of children living in poverty. To break ties, we used the number of children living in poverty.
Additional information on median income for families with children, the share of households with children receiving benefits from the Supplemental Nutrition Assistance Program, and the share of households headed by single mothers are also five-year estimates from the 2020 ACS. Because the Census Bureau didn’t release one-year estimates for 2020 due to data collection issues caused by the COVID-19 pandemic, all ACS data are five-year estimates.
Contact [email protected] for any questions or corrections.