
Driven by a surge in homicides and an increase in cases of aggravated assault, the U.S. violent crime rate rose in 2020, according to data from the FBI. One bright spot in the latest data was a decline in reported robberies. In a continuation of a multi-decade trend, the number of robberies committed in the U.S. fell by 9%, from about 268,500 in 2019 to 243,600 in 2020.
According to the FBI, robbery is a crime in which force or the threat of force or violence is used to take, or attempt to take, anything of value from another person. The largest share of robberies in the United States are committed on streets or sidewalks. Handguns are the most commonly used weapon in robberies, and more often than not, among the cases where a suspect can be identified, the offender and victim are strangers to one another.
The decline in the national robbery rate is being led by particularly steep drops in certain U.S. cities.
Using data from the FBI, 24/7 Wall St. identified the 50 U.S. cities where the robbery rate is falling fastest. Cities – defined as places home to 25,000 people or more – are ranked by the year-over-year change in the number of robberies per 100,000 people. Among the cities on this list, robbery rates have fallen by as much as 175 incidents per 100,000 people. For context, the U.S. robbery rate fell by 8 incidents per 100,000 in 2020.
Robbery – along with rаpe, aggravated assault, and homicide – is one component of the overall violent crime category. Even though robbery accounts for only a small percentage of all violent crimes, most of the cities on this list also reported a decline in violent crime overall in 2020. Here is a look at the states where crime is soaring.
California alone is home to nearly half of the cities on this list. It is important to note that despite falling robbery rates, in all but a handful of cities on this list, the overall robbery rate remains higher than the national rate of 74 incidents per 100,000 people. Here is a look at the states with the highest robbery rates.
Click here to see the U.S. cities where the robbery rate is falling
Click here to read our detailed methodology

50. Huntington Park, California
> 1-yr. change in reported robberies per 100K: -64.1
> Robberies reported in 2020: 209 — 111th highest of 1,122 cities (tied)
> Robberies per 100K people in 2020: 363.8 — 7th highest of 1,122 cities
> 1-yr. change in all violent crime per 100k people: -54.3 — 130th lowest of 1,119 cities
> Violent crimes per 100K people in 2020: 732.9 — 145th highest of 1,121 cities
> Population: 58,353
[in-text-ad]

49. Pompano Beach, Florida
> 1-yr. change in reported robberies per 100K: -64.3
> Robberies reported in 2020: 244 — 98th highest of 1,122 cities
> Robberies per 100K people in 2020: 214.9 — 58th highest of 1,122 cities
> 1-yr. change in all violent crime per 100k people: -55.5 — 125th lowest of 1,119 cities
> Violent crimes per 100K people in 2020: 737.2 — 141st highest of 1,121 cities
> Population: 110,062
[recirclink id=1055273]

48. Turlock, California
> 1-yr. change in reported robberies per 100K: -64.9
> Robberies reported in 2020: 90 — 228th highest of 1,122 cities (tied)
> Robberies per 100K people in 2020: 121.3 — 210th highest of 1,122 cities
> 1-yr. change in all violent crime per 100k people: -24.8 — 255th lowest of 1,119 cities
> Violent crimes per 100K people in 2020: 550.0 — 240th highest of 1,121 cities
> Population: 72,904

47. Schenectady, New York
> 1-yr. change in reported robberies per 100K: -65.0
> Robberies reported in 2020: 90 — 228th highest of 1,122 cities (tied)
> Robberies per 100K people in 2020: 138.1 — 162nd highest of 1,122 cities
> 1-yr. change in all violent crime per 100k people: -88.0 — 61st lowest of 1,119 cities
> Violent crimes per 100K people in 2020: 718.1 — 147th highest of 1,121 cities
> Population: 65,334
[in-text-ad-2]
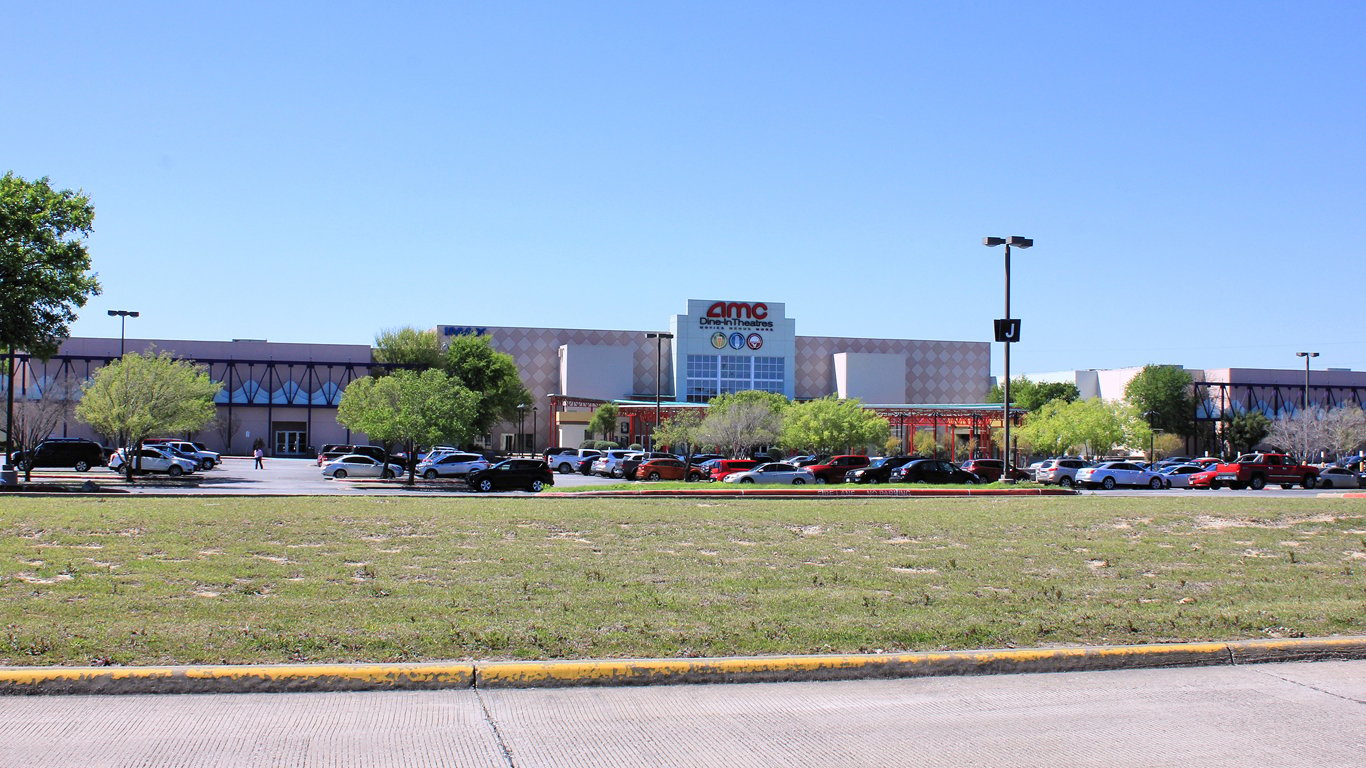
46. Mesquite, Texas
> 1-yr. change in reported robberies per 100K: -65.1
> Robberies reported in 2020: 149 — 146th highest of 1,122 cities
> Robberies per 100K people in 2020: 105.4 — 267th highest of 1,122 cities
> 1-yr. change in all violent crime per 100k people: -40.8 — 188th lowest of 1,119 cities
> Violent crimes per 100K people in 2020: 438.0 — 363rd highest of 1,121 cities
> Population: 143,456

45. Dover, Delaware
> 1-yr. change in reported robberies per 100K: -65.3
> Robberies reported in 2020: 24 — 499th lowest of 1,122 cities (tied)
> Robberies per 100K people in 2020: 62.5 — 486th highest of 1,122 cities
> 1-yr. change in all violent crime per 100k people: -14.5 — 332nd lowest of 1,119 cities
> Violent crimes per 100K people in 2020: 856.1 — 96th highest of 1,121 cities
> Population: 37,523
[in-text-ad]

44. West Palm Beach, Florida
> 1-yr. change in reported robberies per 100K: -65.6
> Robberies reported in 2020: 231 — 106th highest of 1,122 cities
> Robberies per 100K people in 2020: 203.9 — 64th highest of 1,122 cities
> 1-yr. change in all violent crime per 100k people: +0.4 — 480th lowest of 1,119 cities
> Violent crimes per 100K people in 2020: 761.9 — 128th highest of 1,121 cities
> Population: 109,767
[recirclink id=850453]
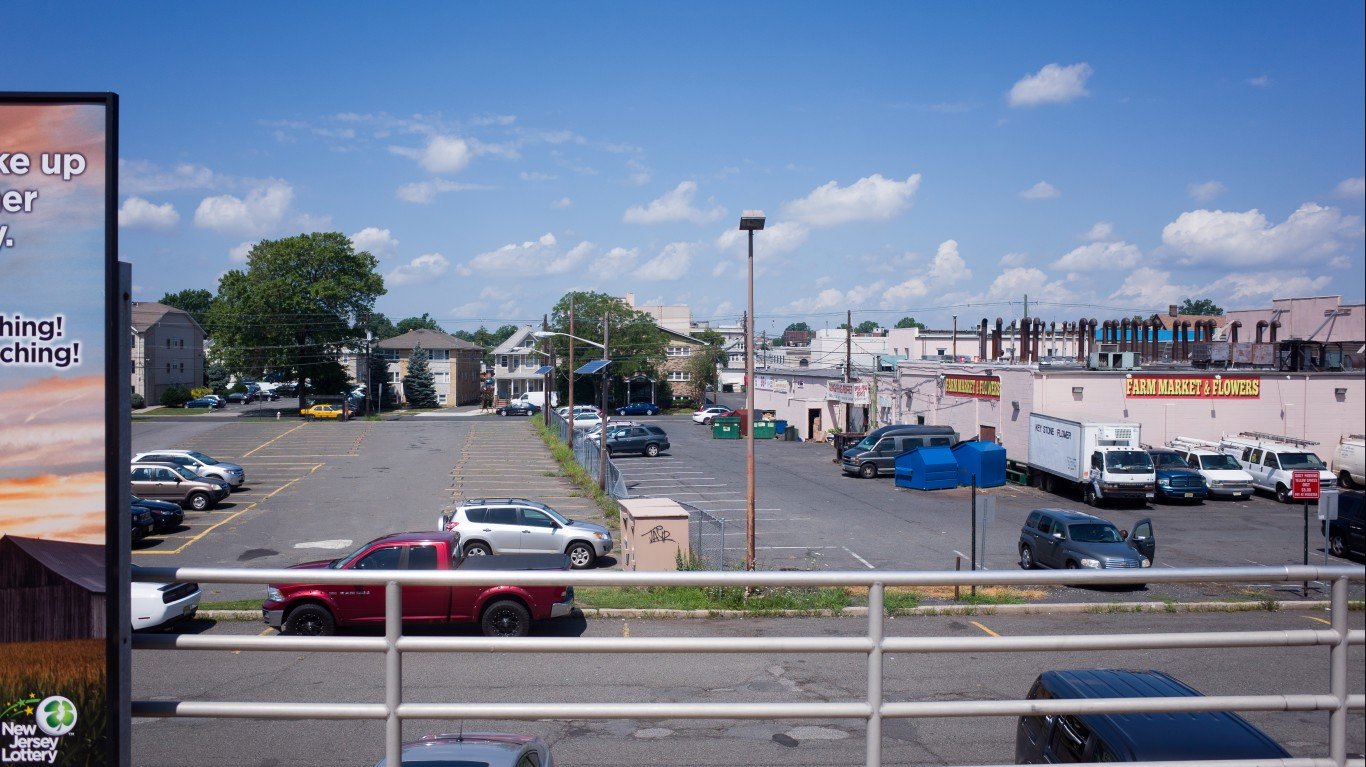
43. Linden, New Jersey
> 1-yr. change in reported robberies per 100K: -65.7
> Robberies reported in 2020: 16 — 374th lowest of 1,122 cities (tied)
> Robberies per 100K people in 2020: 37.6 — 427th lowest of 1,122 cities
> 1-yr. change in all violent crime per 100k people: -39.3 — 194th lowest of 1,119 cities
> Violent crimes per 100K people in 2020: 334.0 — 495th highest of 1,121 cities
> Population: 42,222

42. Pittsburg, California
> 1-yr. change in reported robberies per 100K: -66.6
> Robberies reported in 2020: 108 — 188th highest of 1,122 cities (tied)
> Robberies per 100K people in 2020: 146.6 — 148th highest of 1,122 cities
> 1-yr. change in all violent crime per 100k people: +41.8 — 293rd highest of 1,119 cities
> Violent crimes per 100K people in 2020: 647.5 — 173rd highest of 1,121 cities
> Population: 71,422
[in-text-ad-2]

41. Desert Hot Springs, California
> 1-yr. change in reported robberies per 100K: -68.6
> Robberies reported in 2020: 39 — 473rd highest of 1,122 cities (tied)
> Robberies per 100K people in 2020: 134.1 — 170th highest of 1,122 cities
> 1-yr. change in all violent crime per 100k people: -126.3 — 25th lowest of 1,119 cities
> Violent crimes per 100K people in 2020: 749.8 — 135th highest of 1,121 cities
> Population: 28,585

40. Salisbury, North Carolina
> 1-yr. change in reported robberies per 100K: -68.6
> Robberies reported in 2020: 46 — 411th highest of 1,122 cities (tied)
> Robberies per 100K people in 2020: 135.1 — 166th highest of 1,122 cities
> 1-yr. change in all violent crime per 100k people: +2.2 — 509th lowest of 1,119 cities
> Violent crimes per 100K people in 2020: 737.3 — 140th highest of 1,121 cities
> Population: 33,727
[in-text-ad]

39. Muskegon, Michigan
> 1-yr. change in reported robberies per 100K: -68.8
> Robberies reported in 2020: 20 — 437th lowest of 1,122 cities (tied)
> Robberies per 100K people in 2020: 55.0 — 548th highest of 1,122 cities
> 1-yr. change in all violent crime per 100k people: -130.5 — 22nd lowest of 1,119 cities
> Violent crimes per 100K people in 2020: 698.0 — 155th highest of 1,121 cities
> Population: 37,633
[recirclink id=990213]

38. Warren, Ohio
> 1-yr. change in reported robberies per 100K: -69.7
> Robberies reported in 2020: 42 — 446th highest of 1,122 cities (tied)
> Robberies per 100K people in 2020: 109.2 — 254th highest of 1,122 cities
> 1-yr. change in all violent crime per 100k people: -107.9 — 41st lowest of 1,119 cities
> Violent crimes per 100K people in 2020: 449.8 — 348th highest of 1,121 cities
> Population: 39,307

37. Lancaster, California
> 1-yr. change in reported robberies per 100K: -71.7
> Robberies reported in 2020: 257 — 91st highest of 1,122 cities
> Robberies per 100K people in 2020: 163.0 — 113th highest of 1,122 cities
> 1-yr. change in all violent crime per 100k people: -93.2 — 48th lowest of 1,119 cities
> Violent crimes per 100K people in 2020: 759.7 — 129th highest of 1,121 cities
> Population: 159,028
[in-text-ad-2]

36. Detroit, Michigan
> 1-yr. change in reported robberies per 100K: -73.4
> Robberies reported in 2020: 1,848 — 12th highest of 1,122 cities
> Robberies per 100K people in 2020: 280.2 — 25th highest of 1,122 cities
> 1-yr. change in all violent crime per 100k people: +213.2 — 23rd highest of 1,119 cities
> Violent crimes per 100K people in 2020: 2,178.5 — 3rd highest of 1,121 cities
> Population: 674,841

35. San Francisco, California
> 1-yr. change in reported robberies per 100K: -73.9
> Robberies reported in 2020: 2,388 — 8th highest of 1,122 cities
> Robberies per 100K people in 2020: 270.9 — 26th highest of 1,122 cities
> 1-yr. change in all violent crime per 100k people: -125.6 — 26th lowest of 1,119 cities
> Violent crimes per 100K people in 2020: 544.1 — 244th highest of 1,121 cities
> Population: 874,961
[in-text-ad]

34. New Bedford, Massachusetts
> 1-yr. change in reported robberies per 100K: -74.3
> Robberies reported in 2020: 106 — 195th highest of 1,122 cities (tied)
> Robberies per 100K people in 2020: 111.7 — 242nd highest of 1,122 cities
> 1-yr. change in all violent crime per 100k people: -35.6 — 213th lowest of 1,119 cities
> Violent crimes per 100K people in 2020: 628.1 — 190th highest of 1,121 cities
> Population: 95,239
[recirclink id=1000581]

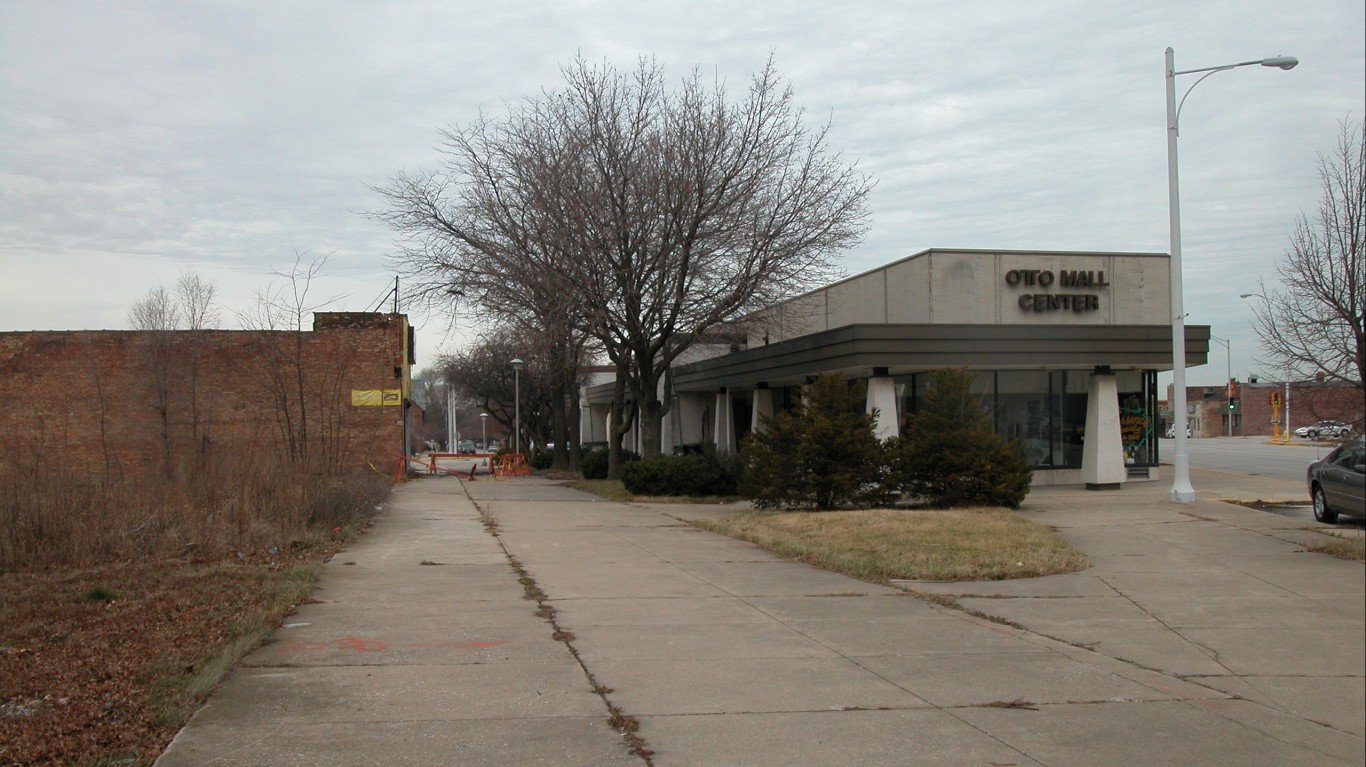
33. St. Louis, Missouri
> 1-yr. change in reported robberies per 100K: -74.6
> Robberies reported in 2020: 1,242 — 22nd highest of 1,122 cities
> Robberies per 100K people in 2020: 416.2 — 3rd highest of 1,122 cities
> 1-yr. change in all violent crime per 100k people: +89.0 — 138th highest of 1,119 cities
> Violent crimes per 100K people in 2020: 2,016.3 — 5th highest of 1,121 cities
> Population: 308,174

32. Cleveland, Ohio
> 1-yr. change in reported robberies per 100K: -76.1
> Robberies reported in 2020: 1,593 — 18th highest of 1,122 cities
> Robberies per 100K people in 2020: 420.2 — 2nd highest of 1,122 cities
> 1-yr. change in all violent crime per 100k people: +140.1 — 72nd highest of 1,119 cities
> Violent crimes per 100K people in 2020: 1,656.7 — 11th highest of 1,121 cities
> Population: 385,282
[in-text-ad-2]

31. Berkeley, California
> 1-yr. change in reported robberies per 100K: -76.6
> Robberies reported in 2020: 274 — 80th highest of 1,122 cities (tied)
> Robberies per 100K people in 2020: 224.0 — 51st highest of 1,122 cities
> 1-yr. change in all violent crime per 100k people: -64.4 — 104th lowest of 1,119 cities
> Violent crimes per 100K people in 2020: 438.9 — 361st highest of 1,121 cities
> Population: 121,485

30. Kankakee, Illinois
> 1-yr. change in reported robberies per 100K: -77.3
> Robberies reported in 2020: 33 — 522nd highest of 1,122 cities (tied)
> Robberies per 100K people in 2020: 127.6 — 191st highest of 1,122 cities
> 1-yr. change in all violent crime per 100k people: +31.2 — 362nd highest of 1,119 cities
> Violent crimes per 100K people in 2020: 943.4 — 70th highest of 1,121 cities
> Population: 25,830
[in-text-ad]

29. Ocala, Florida
> 1-yr. change in reported robberies per 100K: -77.7
> Robberies reported in 2020: 61 — 344th highest of 1,122 cities (tied)
> Robberies per 100K people in 2020: 99.6 — 293rd highest of 1,122 cities
> 1-yr. change in all violent crime per 100k people: -135.1 — 20th lowest of 1,119 cities
> Violent crimes per 100K people in 2020: 674.0 — 168th highest of 1,121 cities
> Population: 59,267
[recirclink id=1001204]

28. Elizabeth, New Jersey
> 1-yr. change in reported robberies per 100K: -80.5
> Robberies reported in 2020: 282 — 74th highest of 1,122 cities
> Robberies per 100K people in 2020: 217.7 — 57th highest of 1,122 cities
> 1-yr. change in all violent crime per 100k people: -121.6 — 28th lowest of 1,119 cities
> Violent crimes per 100K people in 2020: 597.6 — 204th highest of 1,121 cities
> Population: 128,333

27. Stockton, California
> 1-yr. change in reported robberies per 100K: -80.7
> Robberies reported in 2020: 909 — 30th highest of 1,122 cities
> Robberies per 100K people in 2020: 288.6 — 22nd highest of 1,122 cities
> 1-yr. change in all violent crime per 100k people: -119.4 — 32nd lowest of 1,119 cities
> Violent crimes per 100K people in 2020: 1,277.2 — 29th highest of 1,121 cities
> Population: 309,228
[in-text-ad-2]

26. San Bernardino, California
> 1-yr. change in reported robberies per 100K: -80.7
> Robberies reported in 2020: 730 — 37th highest of 1,122 cities
> Robberies per 100K people in 2020: 337.4 — 9th highest of 1,122 cities
> 1-yr. change in all violent crime per 100k people: +83.0 — 150th highest of 1,119 cities
> Violent crimes per 100K people in 2020: 1,401.8 — 22nd highest of 1,121 cities
> Population: 216,089

25. Dallas, Texas
> 1-yr. change in reported robberies per 100K: -81.2
> Robberies reported in 2020: 3,292 — 5th highest of 1,122 cities
> Robberies per 100K people in 2020: 241.5 — 38th highest of 1,122 cities
> 1-yr. change in all violent crime per 100k people: -18.2 — 308th lowest of 1,119 cities
> Violent crimes per 100K people in 2020: 844.7 — 100th highest of 1,121 cities
> Population: 1,330,612
[in-text-ad]

24. San Pablo, California
> 1-yr. change in reported robberies per 100K: -81.6
> Robberies reported in 2020: 76 — 277th highest of 1,122 cities (tied)
> Robberies per 100K people in 2020: 243.9 — 37th highest of 1,122 cities
> 1-yr. change in all violent crime per 100k people: -80.0 — 74th lowest of 1,119 cities
> Violent crimes per 100K people in 2020: 539.1 — 251st highest of 1,121 cities
> Population: 30,967
[recirclink id=1055273]

23. Newburgh, New York
> 1-yr. change in reported robberies per 100K: -82.1
> Robberies reported in 2020: 59 — 351st highest of 1,122 cities (tied)
> Robberies per 100K people in 2020: 210.0 — 60th highest of 1,122 cities
> 1-yr. change in all violent crime per 100k people: -114.9 — 34th lowest of 1,119 cities
> Violent crimes per 100K people in 2020: 1,014.4 — 53rd highest of 1,121 cities
> Population: 28,255

22. Inglewood, California
> 1-yr. change in reported robberies per 100K: -82.8
> Robberies reported in 2020: 264 — 86th highest of 1,122 cities
> Robberies per 100K people in 2020: 244.5 — 35th highest of 1,122 cities
> 1-yr. change in all violent crime per 100k people: +15.4 — 475th highest of 1,119 cities
> Violent crimes per 100K people in 2020: 628.8 — 187th highest of 1,121 cities
> Population: 109,613
[in-text-ad-2]

21. Miami Beach, Florida
> 1-yr. change in reported robberies per 100K: -83.4
> Robberies reported in 2020: 200 — 115th highest of 1,122 cities (tied)
> Robberies per 100K people in 2020: 224.7 — 49th highest of 1,122 cities
> 1-yr. change in all violent crime per 100k people: -173.8 — 9th lowest of 1,119 cities
> Violent crimes per 100K people in 2020: 750.4 — 134th highest of 1,121 cities
> Population: 90,108

20. Baton Rouge, Louisiana
> 1-yr. change in reported robberies per 100K: -83.9
> Robberies reported in 2020: 457 — 50th highest of 1,122 cities
> Robberies per 100K people in 2020: 208.4 — 61st highest of 1,122 cities
> 1-yr. change in all violent crime per 100k people: +15.6 — 474th highest of 1,119 cities
> Violent crimes per 100K people in 2020: 951.9 — 68th highest of 1,121 cities
> Population: 224,149
[in-text-ad]

19. Lynwood, California
> 1-yr. change in reported robberies per 100K: -84.2
> Robberies reported in 2020: 157 — 138th highest of 1,122 cities
> Robberies per 100K people in 2020: 224.5 — 50th highest of 1,122 cities
> 1-yr. change in all violent crime per 100k people: -12.2 — 358th lowest of 1,119 cities
> Violent crimes per 100K people in 2020: 630.7 — 185th highest of 1,121 cities
> Population: 70,635
[recirclink id=850453]

18. El Cajon, California
> 1-yr. change in reported robberies per 100K: -84.2
> Robberies reported in 2020: 113 — 181st highest of 1,122 cities (tied)
> Robberies per 100K people in 2020: 109.7 — 251st highest of 1,122 cities
> 1-yr. change in all violent crime per 100k people: -35.5 — 214th lowest of 1,119 cities
> Violent crimes per 100K people in 2020: 496.9 — 293rd highest of 1,121 cities
> Population: 103,186

17. Santa Monica, California
> 1-yr. change in reported robberies per 100K: -85.0
> Robberies reported in 2020: 167 — 130th highest of 1,122 cities (tied)
> Robberies per 100K people in 2020: 184.6 — 86th highest of 1,122 cities
> 1-yr. change in all violent crime per 100k people: -126.8 — 24th lowest of 1,119 cities
> Violent crimes per 100K people in 2020: 598.0 — 202nd highest of 1,121 cities
> Population: 91,577
[in-text-ad-2]

16. Antioch, California
> 1-yr. change in reported robberies per 100K: -85.0
> Robberies reported in 2020: 142 — 152nd highest of 1,122 cities (tied)
> Robberies per 100K people in 2020: 126.2 — 193rd highest of 1,122 cities
> 1-yr. change in all violent crime per 100k people: -49.9 — 152nd lowest of 1,119 cities
> Violent crimes per 100K people in 2020: 525.4 — 263rd highest of 1,121 cities
> Population: 111,200
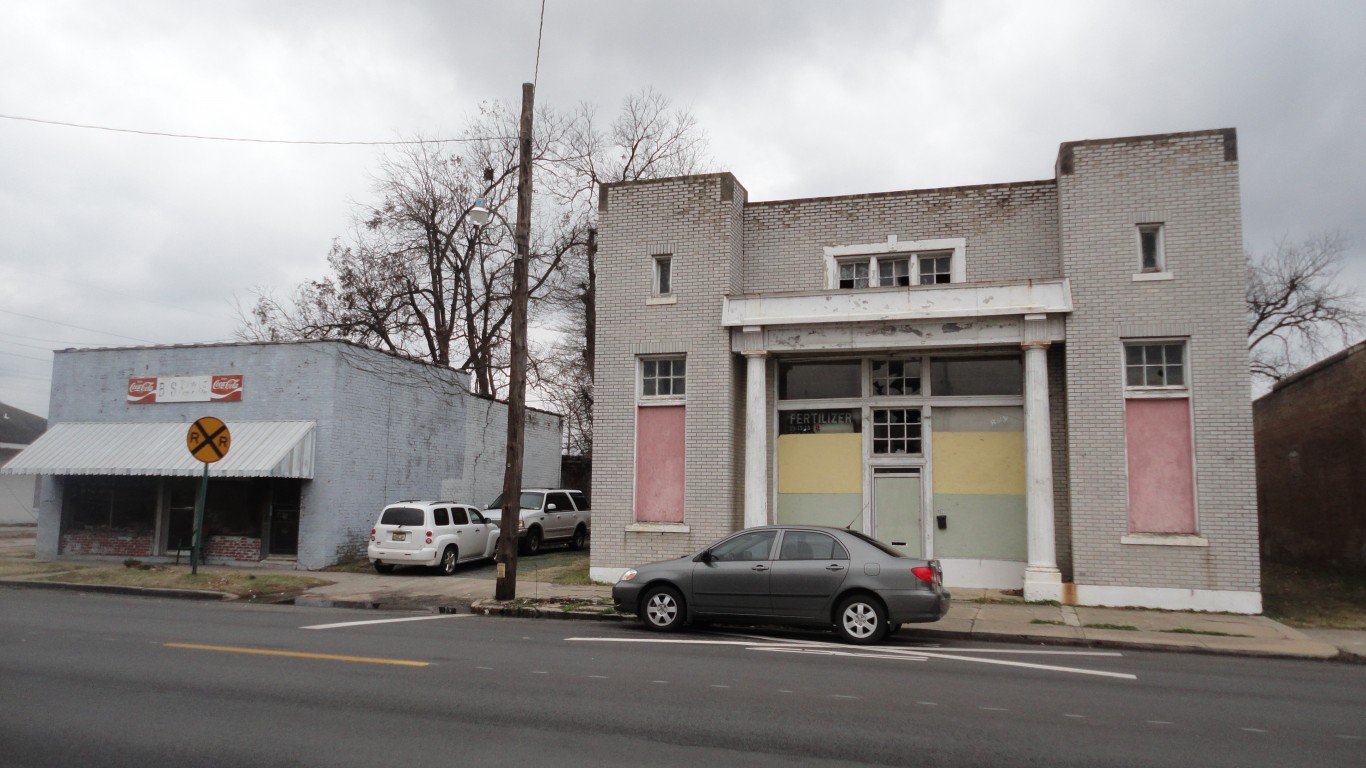
15. Pine Bluff, Arkansas
> 1-yr. change in reported robberies per 100K: -86.4
> Robberies reported in 2020: 59 — 351st highest of 1,122 cities (tied)
> Robberies per 100K people in 2020: 144.9 — 150th highest of 1,122 cities
> 1-yr. change in all violent crime per 100k people: +280.5 — 11th highest of 1,119 cities
> Violent crimes per 100K people in 2020: 1,832.1 — 8th highest of 1,121 cities
> Population: 43,091
[in-text-ad]

14. Culver City, California
> 1-yr. change in reported robberies per 100K: -86.5
> Robberies reported in 2020: 68 — 311th highest of 1,122 cities (tied)
> Robberies per 100K people in 2020: 173.4 — 99th highest of 1,122 cities
> 1-yr. change in all violent crime per 100k people: +36.1 — 322nd highest of 1,119 cities
> Violent crimes per 100K people in 2020: 499.8 — 290th highest of 1,121 cities
> Population: 39,169
[recirclink id=990213]

13. Paramount, California
> 1-yr. change in reported robberies per 100K: -86.5
> Robberies reported in 2020: 103 — 204th highest of 1,122 cities
> Robberies per 100K people in 2020: 191.0 — 77th highest of 1,122 cities
> 1-yr. change in all violent crime per 100k people: -150.0 — 13th lowest of 1,119 cities
> Violent crimes per 100K people in 2020: 487.6 — 301st highest of 1,121 cities
> Population: 54,513

12. San Gabriel, California
> 1-yr. change in reported robberies per 100K: -88.4
> Robberies reported in 2020: 22 — 470th lowest of 1,122 cities (tied)
> Robberies per 100K people in 2020: 55.1 — 544th highest of 1,122 cities
> 1-yr. change in all violent crime per 100k people: -54.6 — 128th lowest of 1,119 cities
> Violent crimes per 100K people in 2020: 187.8 — 364th lowest of 1,121 cities
> Population: 40,143
[in-text-ad-2]

11. Petersburg, Virginia
> 1-yr. change in reported robberies per 100K: -89.4
> Robberies reported in 2020: 20 — 437th lowest of 1,122 cities (tied)
> Robberies per 100K people in 2020: 64.1 — 478th highest of 1,122 cities
> 1-yr. change in all violent crime per 100k people: -116.7 — 33rd lowest of 1,119 cities
> Violent crimes per 100K people in 2020: 631.5 — 183rd highest of 1,121 cities
> Population: 31,362

10. Oakland, California
> 1-yr. change in reported robberies per 100K: -92.6
> Robberies reported in 2020: 2,479 — 7th highest of 1,122 cities
> Robberies per 100K people in 2020: 566.1 — the highest of 1,122 cities
> 1-yr. change in all violent crime per 100k people: +19.1 — 450th highest of 1,119 cities
> Violent crimes per 100K people in 2020: 1,290.9 — 27th highest of 1,121 cities
> Population: 425,097
[in-text-ad]

9. Newark, New Jersey
> 1-yr. change in reported robberies per 100K: -96.0
> Robberies reported in 2020: 367 — 60th highest of 1,122 cities
> Robberies per 100K people in 2020: 130.0 — 179th highest of 1,122 cities
> 1-yr. change in all violent crime per 100k people: -90.4 — 53rd lowest of 1,119 cities
> Violent crimes per 100K people in 2020: 528.6 — 256th highest of 1,121 cities
> Population: 281,054
[recirclink id=1000581]
8. Chicago Heights, Illinois
> 1-yr. change in reported robberies per 100K: -110.6
> Robberies reported in 2020: 45 — 420th highest of 1,122 cities (tied)
> Robberies per 100K people in 2020: 154.1 — 136th highest of 1,122 cities
> 1-yr. change in all violent crime per 100k people: -71.8 — 88th lowest of 1,119 cities
> Violent crimes per 100K people in 2020: 701.9 — 153rd highest of 1,121 cities
> Population: 29,856

7. Passaic, New Jersey
> 1-yr. change in reported robberies per 100K: -116.3
> Robberies reported in 2020: 85 — 245th highest of 1,122 cities (tied)
> Robberies per 100K people in 2020: 122.1 — 206th highest of 1,122 cities
> 1-yr. change in all violent crime per 100k people: -129.1 — 23rd lowest of 1,119 cities
> Violent crimes per 100K people in 2020: 400.8 — 403rd highest of 1,121 cities
> Population: 70,019
[in-text-ad-2]

6. Harrisburg, Pennsylvania
> 1-yr. change in reported robberies per 100K: -118.1
> Robberies reported in 2020: 102 — 205th highest of 1,122 cities (tied)
> Robberies per 100K people in 2020: 207.1 — 62nd highest of 1,122 cities
> 1-yr. change in all violent crime per 100k people: -43.5 — 176th lowest of 1,119 cities
> Violent crimes per 100K people in 2020: 857.0 — 95th highest of 1,121 cities
> Population: 49,209
5. Homestead, Florida
> 1-yr. change in reported robberies per 100K: -118.9
> Robberies reported in 2020: 214 — 109th highest of 1,122 cities
> Robberies per 100K people in 2020: 303.4 — 17th highest of 1,122 cities
> 1-yr. change in all violent crime per 100k people: -88.4 — 59th lowest of 1,119 cities
> Violent crimes per 100K people in 2020: 864.8 — 90th highest of 1,121 cities
> Population: 68,438
[in-text-ad]

4. El Cerrito, California
> 1-yr. change in reported robberies per 100K: -130.4
> Robberies reported in 2020: 57 — 363rd highest of 1,122 cities (tied)
> Robberies per 100K people in 2020: 221.6 — 54th highest of 1,122 cities
> 1-yr. change in all violent crime per 100k people: -144.7 — 15th lowest of 1,119 cities
> Violent crimes per 100K people in 2020: 443.1 — 354th highest of 1,121 cities
> Population: 25,398
[recirclink id=1001204]

3. Compton, California
> 1-yr. change in reported robberies per 100K: -144.5
> Robberies reported in 2020: 284 — 73rd highest of 1,122 cities
> Robberies per 100K people in 2020: 297.3 — 18th highest of 1,122 cities
> 1-yr. change in all violent crime per 100k people: +35.4 — 327th highest of 1,119 cities
> Violent crimes per 100K people in 2020: 1,177.9 — 35th highest of 1,121 cities
> Population: 96,803

2. West Hollywood, California
> 1-yr. change in reported robberies per 100K: -150.6
> Robberies reported in 2020: 82 — 257th highest of 1,122 cities (tied)
> Robberies per 100K people in 2020: 223.3 — 53rd highest of 1,122 cities
> 1-yr. change in all violent crime per 100k people: -232.6 — 2nd lowest of 1,119 cities
> Violent crimes per 100K people in 2020: 558.3 — 230th highest of 1,121 cities
> Population: 36,450
[in-text-ad-2]

1. Atlantic City, New Jersey
> 1-yr. change in reported robberies per 100K: -175.2
> Robberies reported in 2020: 116 — 177th highest of 1,122 cities (tied)
> Robberies per 100K people in 2020: 308.9 — 16th highest of 1,122 cities
> 1-yr. change in all violent crime per 100k people: -36.3 — 208th lowest of 1,119 cities
> Violent crimes per 100K people in 2020: 822.9 — 108th highest of 1,121 cities
> Population: 37,999
Methodology
To determine the cities where the robbery rate is falling fastest, 24/7 Wall St. reviewed the change in robberies per 100,000 people from the FBI’s 2019 and 2020 Uniform Crime Reports.
We included cities that have more than 25,000 people based on five-year estimates from the U.S. Census Bureau’s 2019 American Community Survey. Limited data was available in the 2020 UCR for areas in Alabama, Maryland, Pennsylvania, and Illinois, though cities in these states were not excluded from analysis. Because some state and local agencies changed reporting practices between 2019 and 2020, the figures are not comparable, and the areas were excluded.
Population figures are five-year estimates from the U.S. Census Bureau’s 2019 American Community Survey. However, these estimates were not used to calculate crime rates. Crime rates per 100,000 people were calculated using population figures provided by the FBI in the 2020 and 2019 UCR.
Contact [email protected] for any questions or corrections.