I bought more Apple (NASDAQ:AAPL | AAPL Price Prediction) last week, and I will probably buy more next month. That has been the rhythm of my portfolio for years now, and the receipts keep telling me to stay the course.
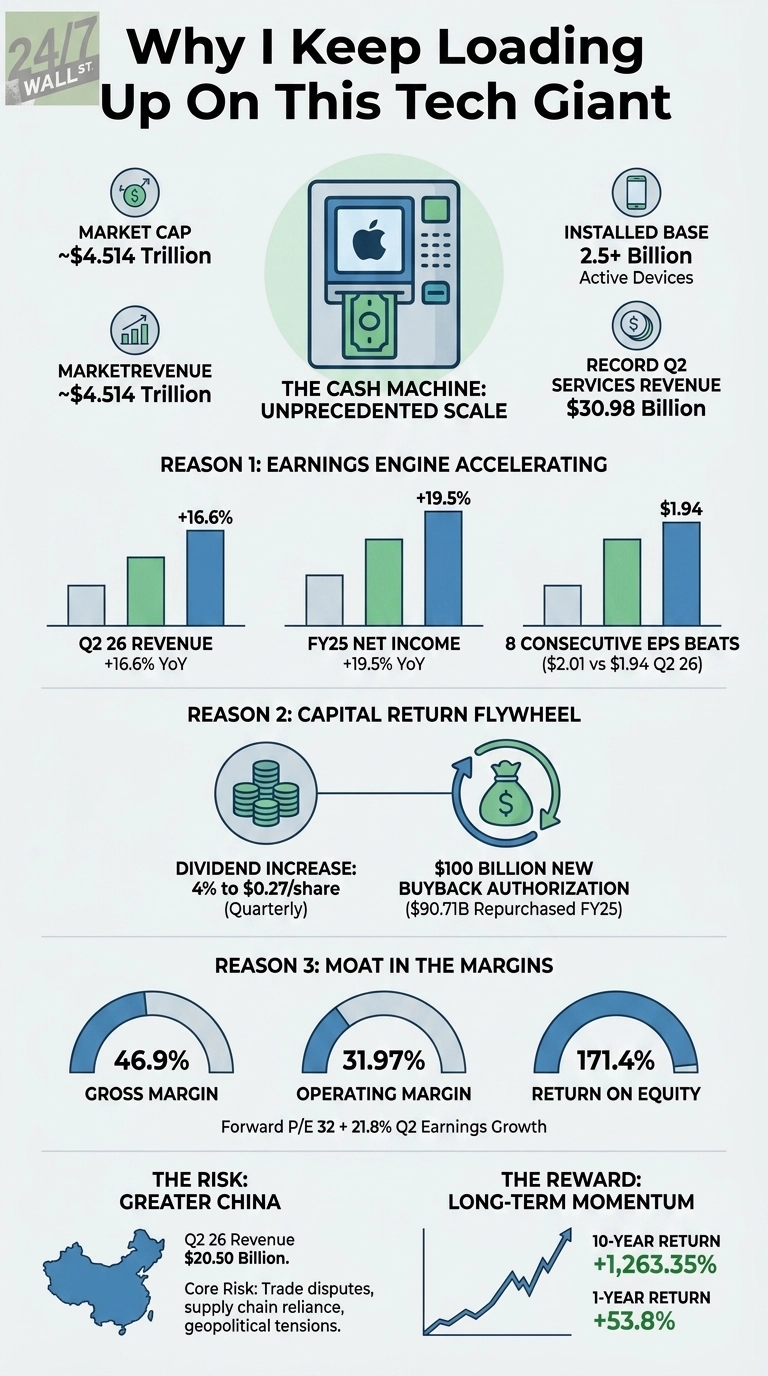
When friends ask why I keep adding to a company already worth $4.514 trillion, my answer is short: the cash machine inside Apple keeps getting bigger, and management keeps handing it back to me.
The thesis I keep coming back to
What pulls me to the buy button is the boring part of the story. Roughly 2.5 billion active devices are now plugged into Apple’s ecosystem, and every one of them is a recurring relationship with a customer who pays for storage, music, video, payments, and apps.
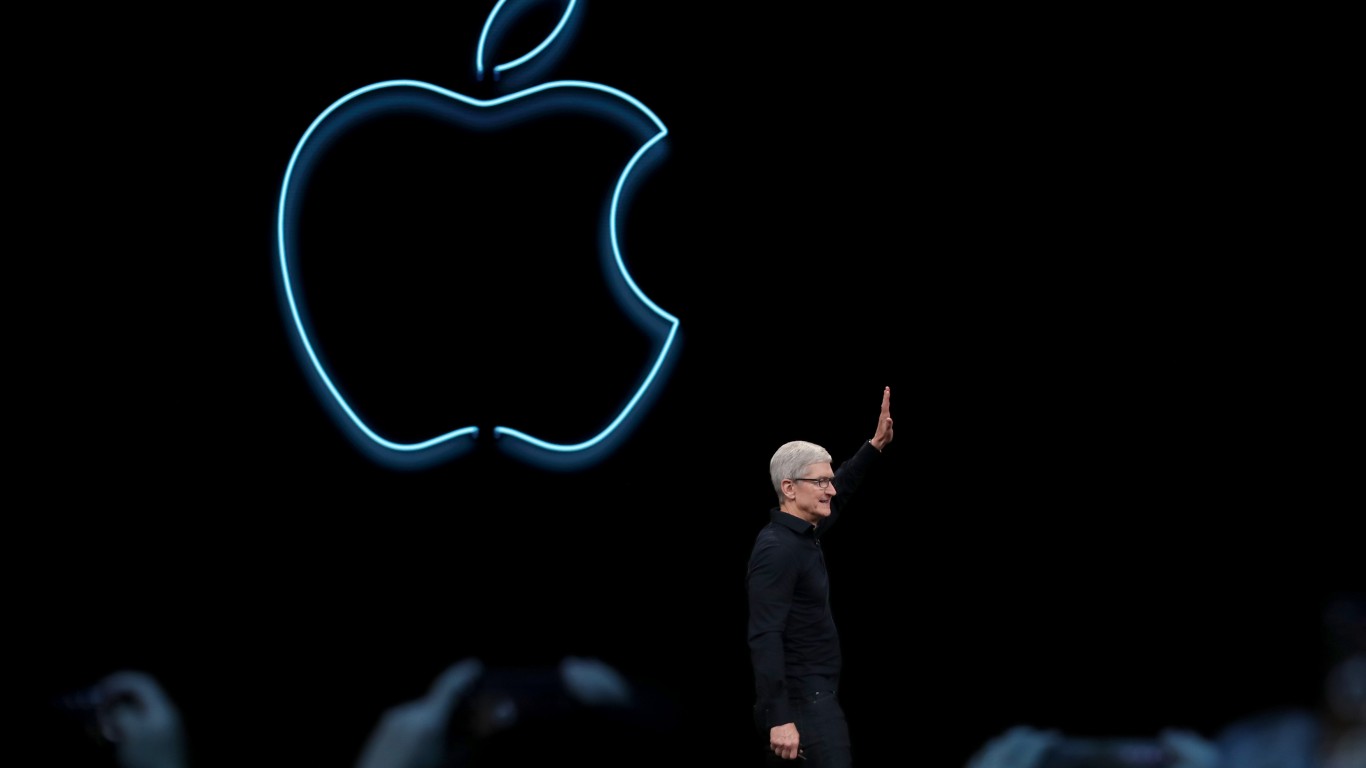
The March quarter showed me exactly why that flywheel matters. Services revenue hit an all-time record of $30.976 billion, sitting next to an iPhone March quarter record of $56.994 billion on the back of the iPhone 17 lineup. Tim Cook called it Apple’s “best March quarter ever, with revenue of $111.2 billion and double-digit growth across every geographic segment.” I keep buying because that sentence keeps being true.
Three reasons the data still says yes
First, the earnings engine is accelerating. Q2 26 revenue grew 16.6% year over year, net income climbed 19.36%, and diluted EPS of $2.01 beat the $1.94 consensus, the 8th consecutive quarter of beating Wall Street. Fiscal 2025 closed with revenue of $416.16 billion and net income of $112.01 billion, up 19.5%. Those are the kind of numbers I want compounding inside a retirement account.
Second, the capital return program is a buy-side flywheel of its own. The board raised the quarterly dividend 4% to $0.27 per share and authorized a fresh $100 billion buyback. Apple repurchased $90.71 billion of stock in fiscal 2025 alone. Every dollar of buyback shrinks my denominator and lifts my per-share claim on future profits.
Third, the moat shows up in the margins. Gross margin sits at 46.9%, operating margin at 31.97%, and return on equity at 171.4%. Companies that earn returns like that on capital tend to keep earning them. The forward P/E of 32 is not cheap, but pair it with 21.8% quarterly earnings growth and I am not waiting for a sale.
The risk I refuse to wave away
Greater China is the part of the story that can actually bite. The region delivered $20.497 billion in Q2 26, and Apple’s filings name trade disputes, geopolitical tensions, and reliance on third-party manufacturing concentrated in China and Asia as core risks.
China softened in Q4 25 at $14.49 billion before rebounding. A serious tariff shock or supply disruption would hurt. What keeps the thesis intact is the installed base. People who already own iPhones rarely leave, and Services revenue rides on that loyalty regardless of which factory ships the next handset.
Why the buy button stays active
The stock has returned 1,263.35% over the past ten years and 53.8% over the past year, and I still own less of it than I want to. With record Services revenue, a rising dividend, a refilled buyback, and an ecosystem that is wider and stickier than anything else in consumer tech, I am trying to own more of it.
Contact [email protected] for any questions or corrections.