Political polarization is one of the main concerns of Americans today. In a recent survey by FiveThirtyEight, 28% of those surveyed claimed that political extremism or polarization was one of the most important issues facing the country — the third largest share of the 20 issues listed on the poll, just behind inflation and gun violence.
According to The Pew Research Center, the percentage of Americans who express consistently conservative or consistently liberal opinions doubled from 10% in 1994 to 21% in 2015. Political polarization is at its highest point in decades, intensified by shifting demographics, social media echo chambers, and partisan polarization in Congress.
These factors, as well as decades-long gerrymandering efforts by state legislatures, have led to cities where extremely Democratic-leaning districts sit alongside extremely Republican-leaning precincts — ideologically and politically segregated precincts.
To determine the most politically polarized cities, 24/7 Wall St. reviewed precinct-level data on 2020 presidential election returns from the MIT Election Lab. We aimed to determine how many voters live in a precinct (a subdivision of an electoral district) where the vast majority of residents (over 80%) hold similar political views — and therefore how ideologically segregated a metropolitan area is.
To estimate the share of voters who live in precincts where their political party enjoys an overwhelming majority, we calculated the percentage of votes for Joe Biden that were cast in the 2020 presidential elections in precincts where he received at least 80% of the vote and similarly the percentage of votes for Donald Trump cast in precincts where he received at least 80% of the vote. Only cities where Biden or Trump won by less than a 15-point margin overall were included.
In the most polarized city, Pine Bluff, Arkansas, for example, 59.9% of Biden voters live in precincts where at least 80% of votes also went to Biden. Similarly, 41.5% of Trump voters live in precincts where at least 80% of voters also voted for Trump. In total, 51.1% of voters live in precincts where at least 80% of fellow voters also voted for their presidential candidate — the most of any metro area.
The large share of voters living in ideologically uniform precincts reflects degrees of partisan segregation and ideological siloing that can result in narrow electoral victories on a metropolitan level. Ideological siloing refers to Americans having friends who share their political views and who perhaps choose to live in proximity to one another.
Most of the ideologically-segregated metro areas are in the South, which also has some of the most racially segregated metros nationwide. (These are the most segregated cities in America.)
Indeed, race and income are two of the most important predictors of voting behavior, and cities like Pine Bluff, Arkansas; Milwaukee, Wisconsin; and Jackson, Mississippi have some of the most extreme racial segregation and income inequality in the country. In Pine Bluff, 80.8% of Black residents live in census tracts where at least 50% of the population is also black — the largest share of any metro area. Many of the most politically polarized cities — Shreveport, Louisiana; Gainesville, Florida; and Macon, Georgia, for example — also have the worst income inequality, as measured by the Gini index of income inequality.
Several of the most politically polarized cities are home to major universities, whose constituents tend to vote Democrat but are situated in otherwise Republican counties. In Blacksburg, Virginia, for example, the most Democratic-leaning precincts are located near Virginia Tech. In Gainesville, Florida, Democratic-leaning precincts are situated around the University of Florida. (On a lighter note, here are the 25 best political comedies in movie history.)
Click here to see America’s most politically divided cities.
Click here to read our detailed methodology.
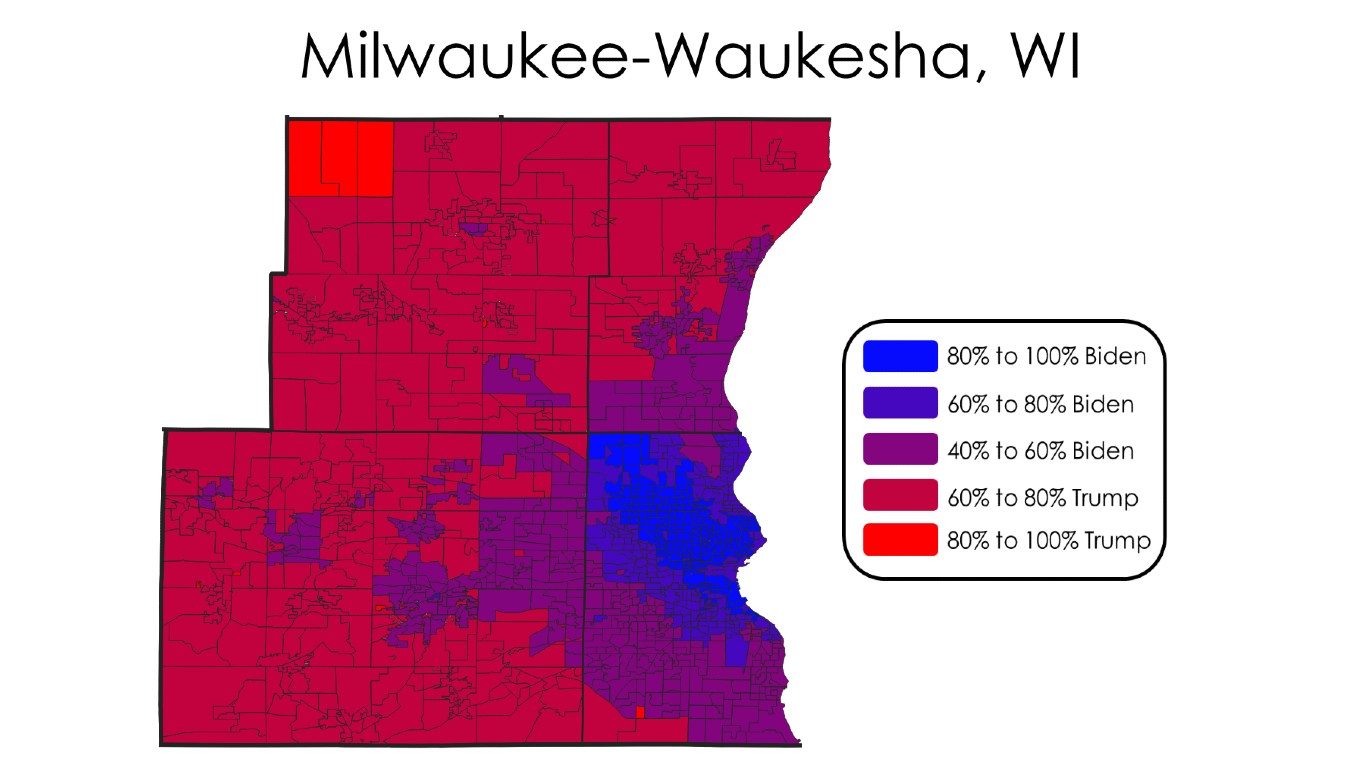
25. Milwaukee-Waukesha, WI
> 2020 presidential results: 55.0.% Biden, 45.0% Trump
> Strong Democratic precincts (80%+ for Biden): 199 of 756
> Strong Republican precincts (80%+ for Trump): 10 of 756
> Biden voters in strong Democratic precincts: 27.8% of Biden voters
> Trump voters in strong Republican precincts: 0.3% of Trump voters
> Median household income: $63,739 (#113 highest of 384 MSAs)
> Total population: 1,576,525 (#39 largest of 384 MSAs)
[in-text-ad]
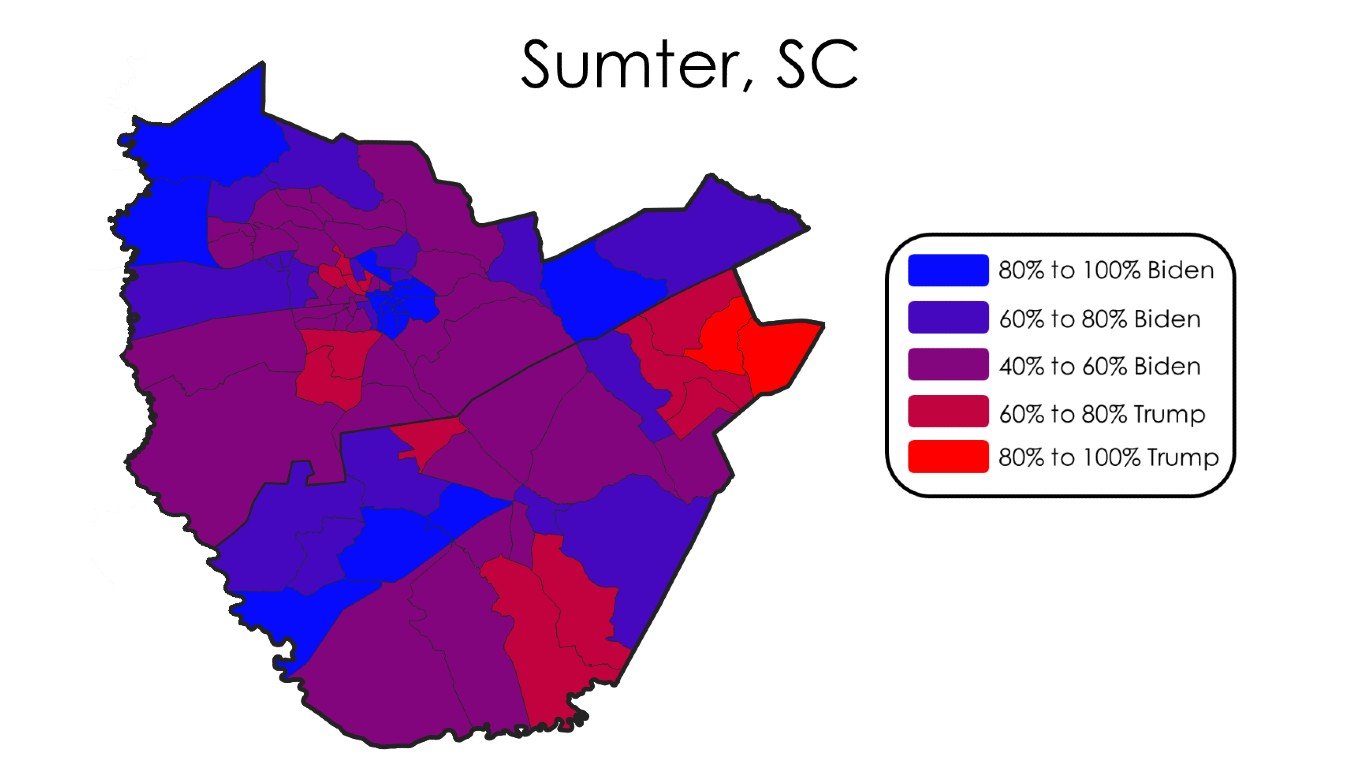
24. Sumter, SC
> 2020 presidential results: 54.8.% Biden, 45.2% Trump
> Strong Democratic precincts (80%+ for Biden): 18 of 85
> Strong Republican precincts (80%+ for Trump): 2 of 85
> Biden voters in strong Democratic precincts: 26.2% of Biden voters
> Trump voters in strong Republican precincts: 2.5% of Trump voters
> Median household income: $45,854 (#373 highest of 384 MSAs)
> Total population: 140,540 (#294 largest of 384 MSAs)
[recirclink id=1166545]
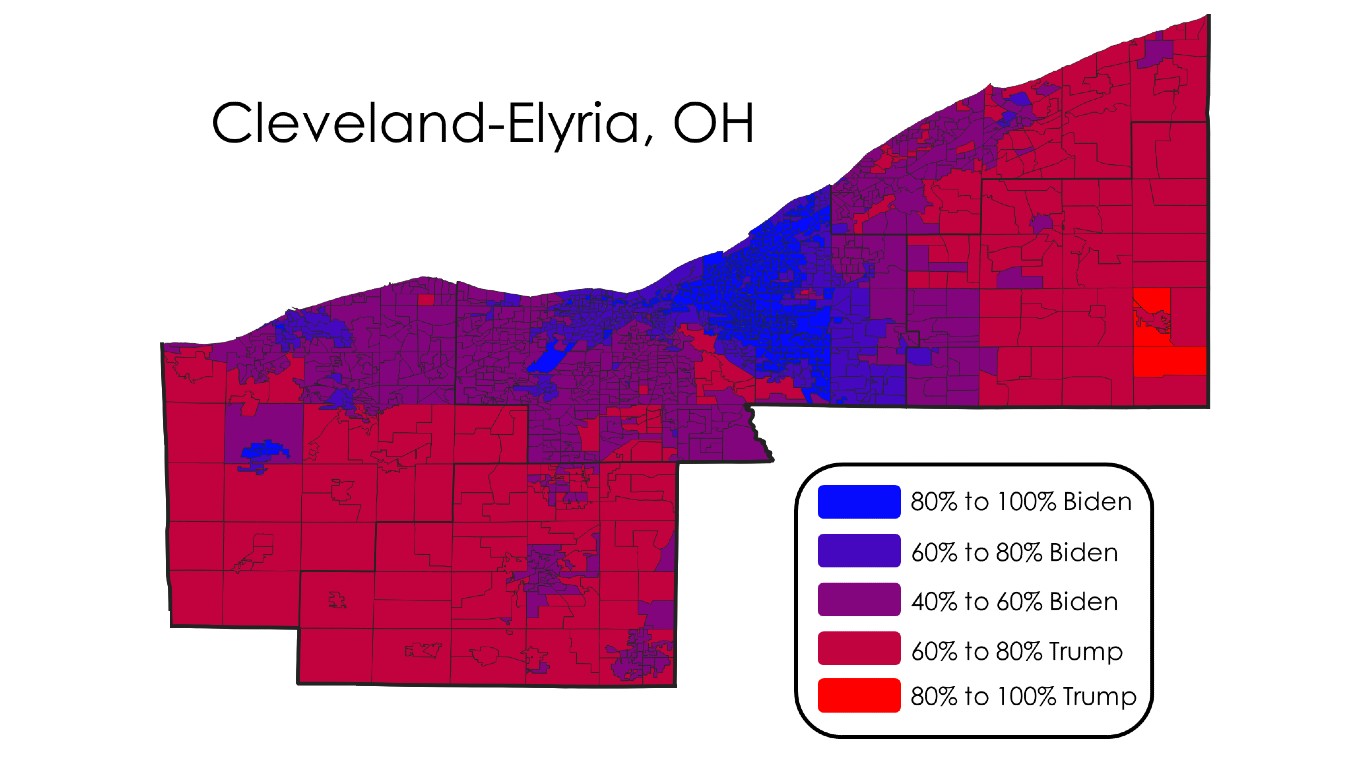
23. Cleveland-Elyria, OH
> 2020 presidential results: 57.3.% Biden, 42.7% Trump
> Strong Democratic precincts (80%+ for Biden): 372 of 1,530
> Strong Republican precincts (80%+ for Trump): 2 of 1,530
> Biden voters in strong Democratic precincts: 27.0% of Biden voters
> Trump voters in strong Republican precincts: 0.2% of Trump voters
> Median household income: $57,263 (#214 highest of 384 MSAs)
> Total population: 2,053,137 (#33 largest of 384 MSAs)
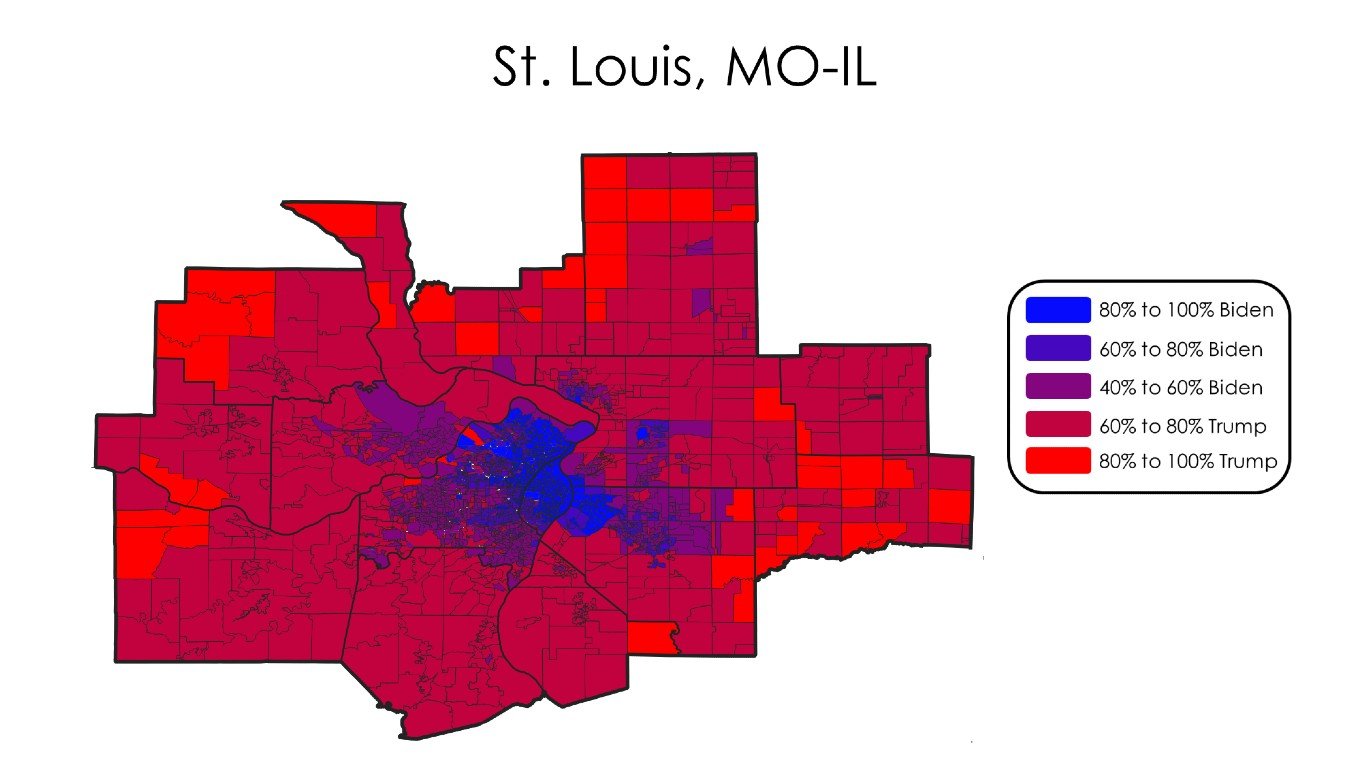
22. St. Louis, MO-IL
> 2020 presidential results: 51.7.% Biden, 48.3% Trump
> Strong Democratic precincts (80%+ for Biden): 518 of 2,354
> Strong Republican precincts (80%+ for Trump): 100 of 2,354
> Biden voters in strong Democratic precincts: 25.2% of Biden voters
> Trump voters in strong Republican precincts: 5.8% of Trump voters
> Median household income: $65,725 (#98 highest of 384 MSAs)
> Total population: 2,806,349 (#20 largest of 384 MSAs)
[in-text-ad-2]
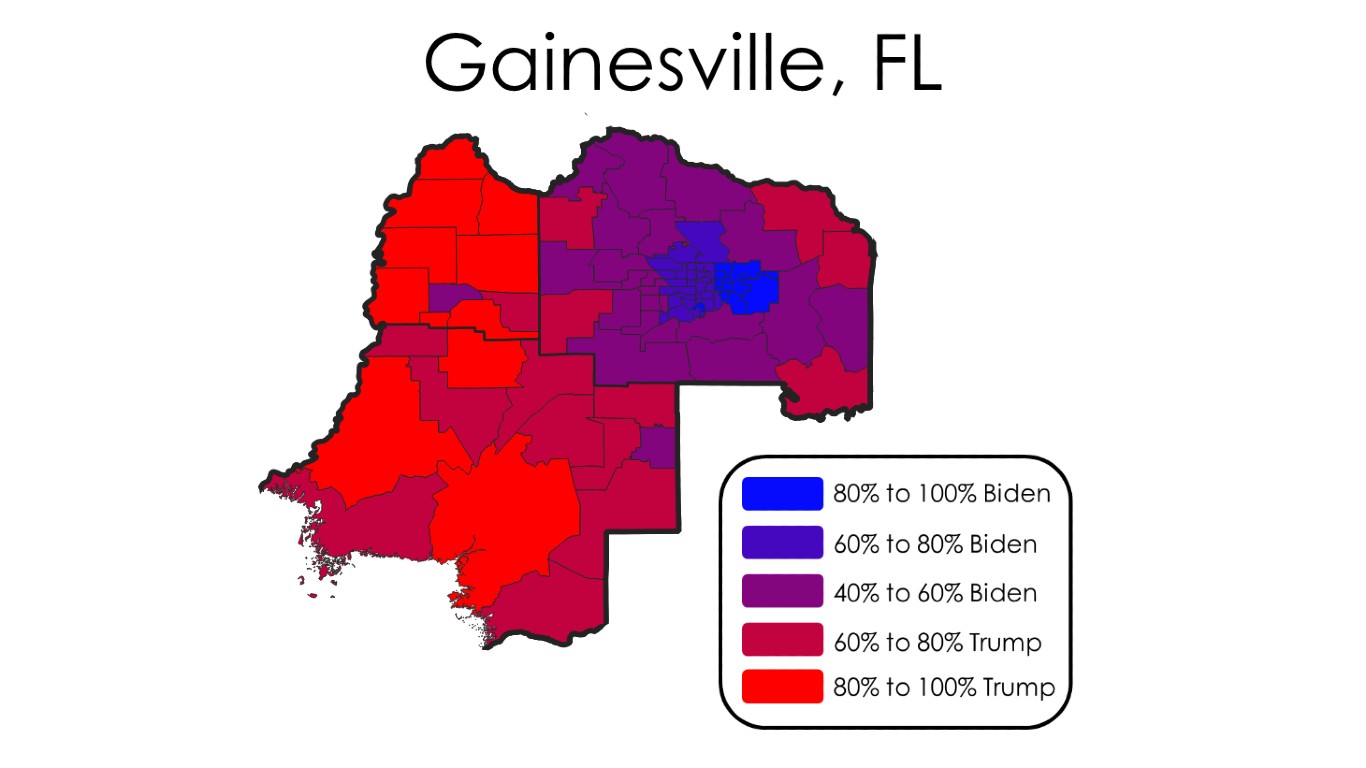
21. Gainesville, FL
> 2020 presidential results: 56.3.% Biden, 43.7% Trump
> Strong Democratic precincts (80%+ for Biden): 11 of 86
> Strong Republican precincts (80%+ for Trump): 11 of 86
> Biden voters in strong Democratic precincts: 19.7% of Biden voters
> Trump voters in strong Republican precincts: 13.4% of Trump voters
> Median household income: $47,848 (#350 highest of 384 MSAs)
> Total population: 327,329 (#154 largest of 384 MSAs)
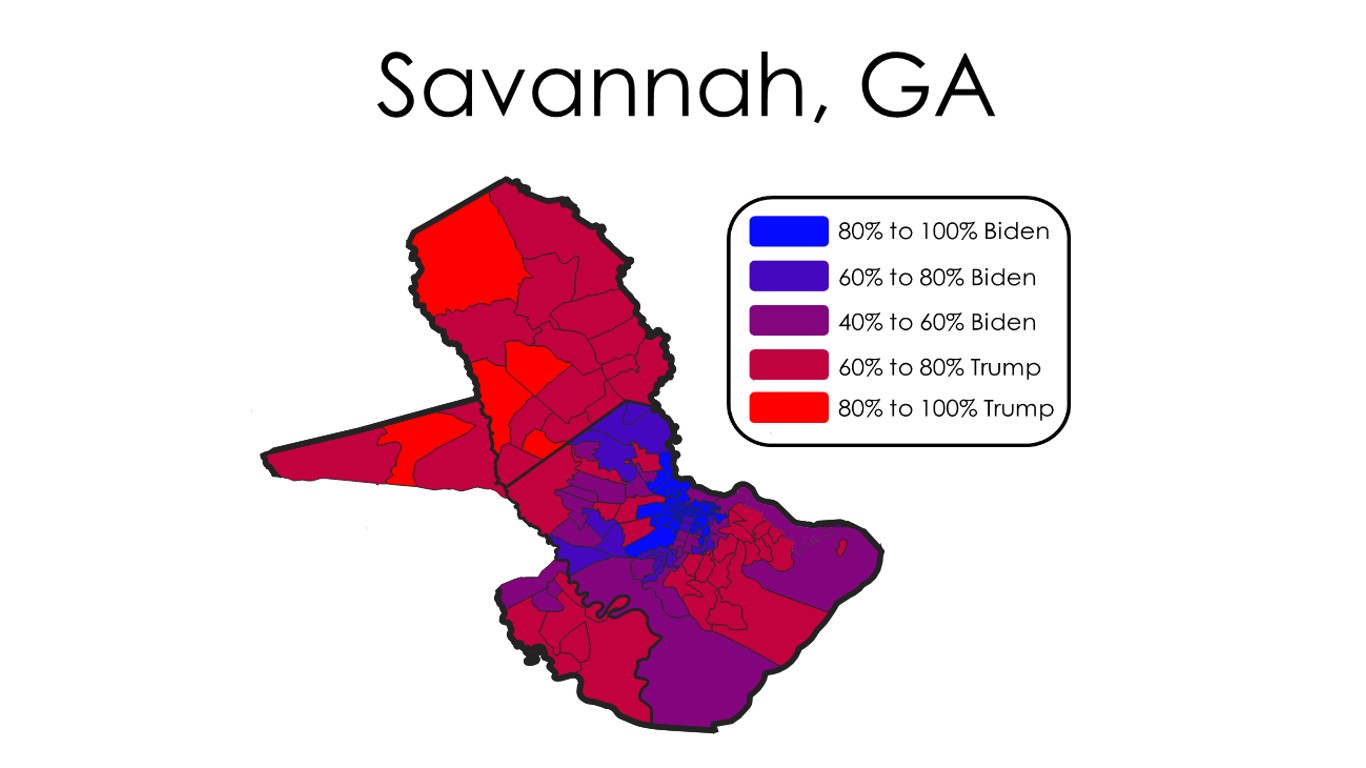
20. Savannah, GA
> 2020 presidential results: 50.5.% Biden, 49.5% Trump
> Strong Democratic precincts (80%+ for Biden): 29 of 119
> Strong Republican precincts (80%+ for Trump): 5 of 119
> Biden voters in strong Democratic precincts: 27.4% of Biden voters
> Trump voters in strong Republican precincts: 7.4% of Trump voters
> Median household income: $60,851 (#160 highest of 384 MSAs)
> Total population: 390,211 (#140 largest of 384 MSAs)
[in-text-ad]
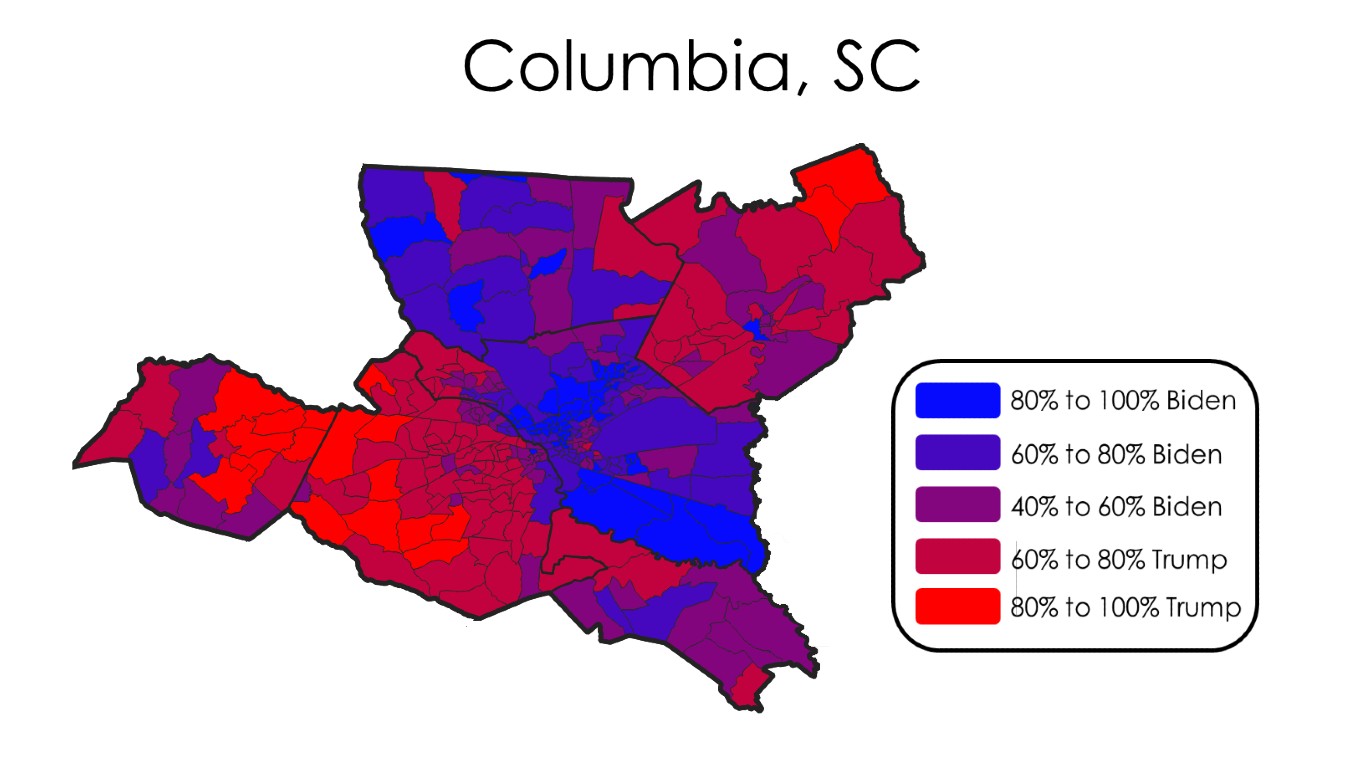
19. Columbia, SC
> 2020 presidential results: 52.8.% Biden, 47.2% Trump
> Strong Democratic precincts (80%+ for Biden): 59 of 337
> Strong Republican precincts (80%+ for Trump): 18 of 337
> Biden voters in strong Democratic precincts: 27.2% of Biden voters
> Trump voters in strong Republican precincts: 7.8% of Trump voters
> Median household income: $56,680 (#224 highest of 384 MSAs)
> Total population: 832,925 (#71 largest of 384 MSAs)
[recirclink id=1161623]
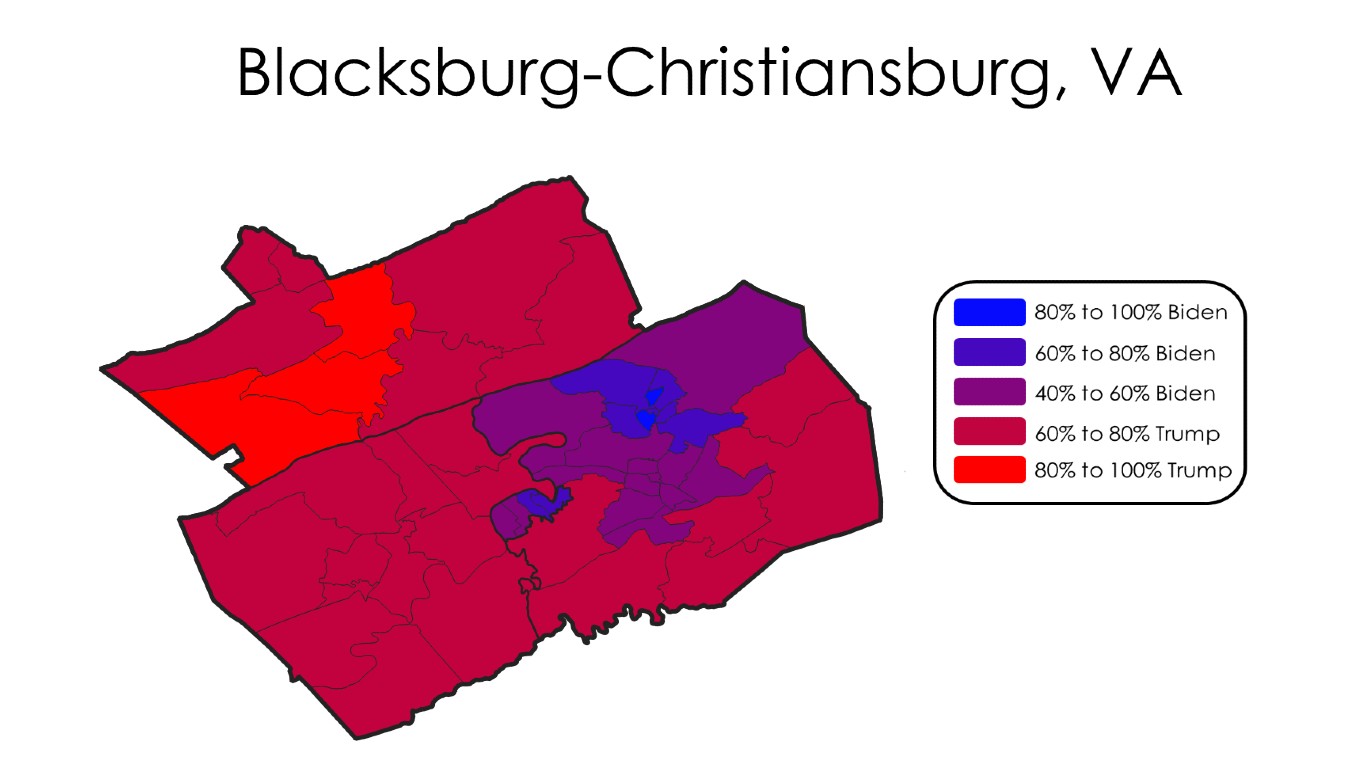
18. Blacksburg-Christiansburg, VA
> 2020 presidential results: 44.2.% Biden, 55.8% Trump
> Strong Democratic precincts (80%+ for Biden): 0 of 56
> Strong Republican precincts (80%+ for Trump): 25 of 56
> Biden voters in strong Democratic precincts: 0.0% of Biden voters
> Trump voters in strong Republican precincts: 32.8% of Trump voters
> Median household income: $55,475 (#236 highest of 384 MSAs)
> Total population: 167,201 (#256 largest of 384 MSAs)
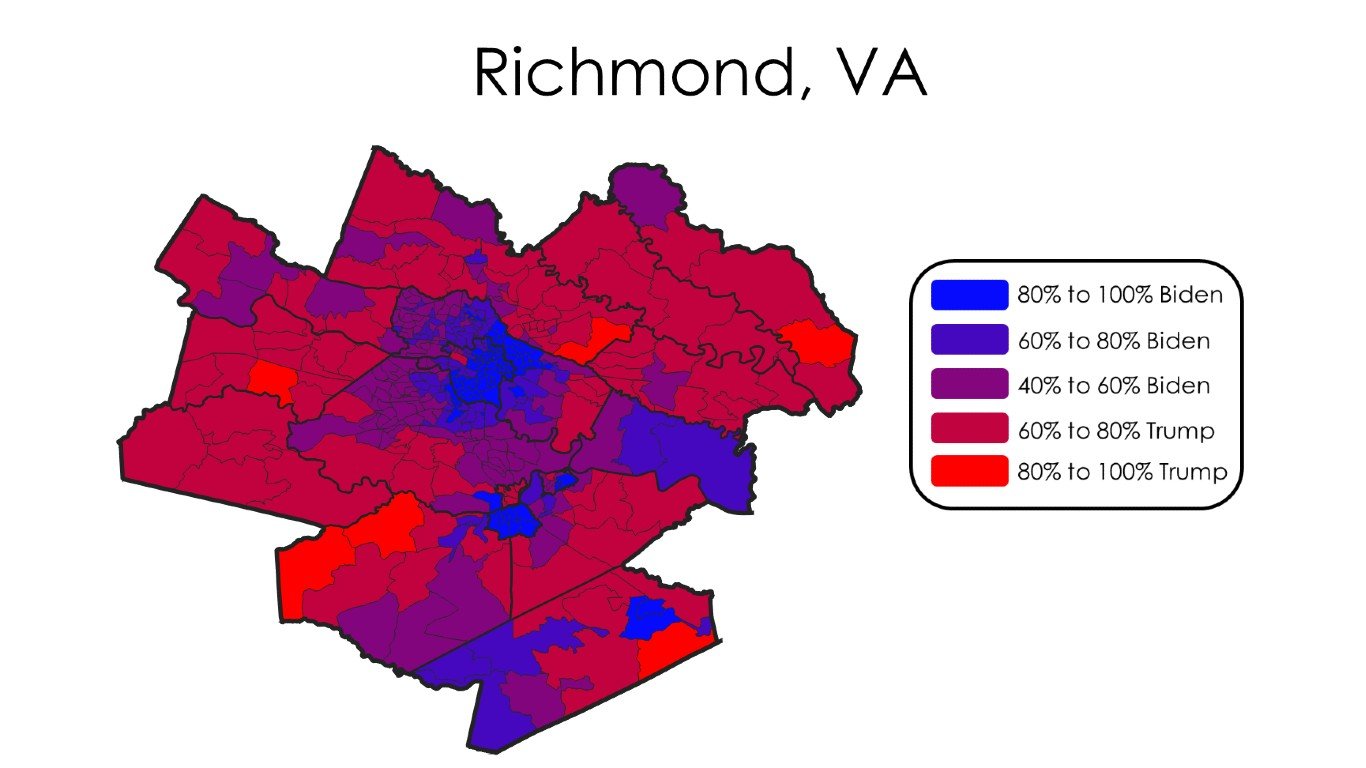
17. Richmond, VA
> 2020 presidential results: 57.3.% Biden, 42.7% Trump
> Strong Democratic precincts (80%+ for Biden): 57 of 412
> Strong Republican precincts (80%+ for Trump): 50 of 412
> Biden voters in strong Democratic precincts: 24.6% of Biden voters
> Trump voters in strong Republican precincts: 10.7% of Trump voters
> Median household income: $71,223 (#60 highest of 384 MSAs)
> Total population: 1,282,067 (#44 largest of 384 MSAs)
[in-text-ad-2]
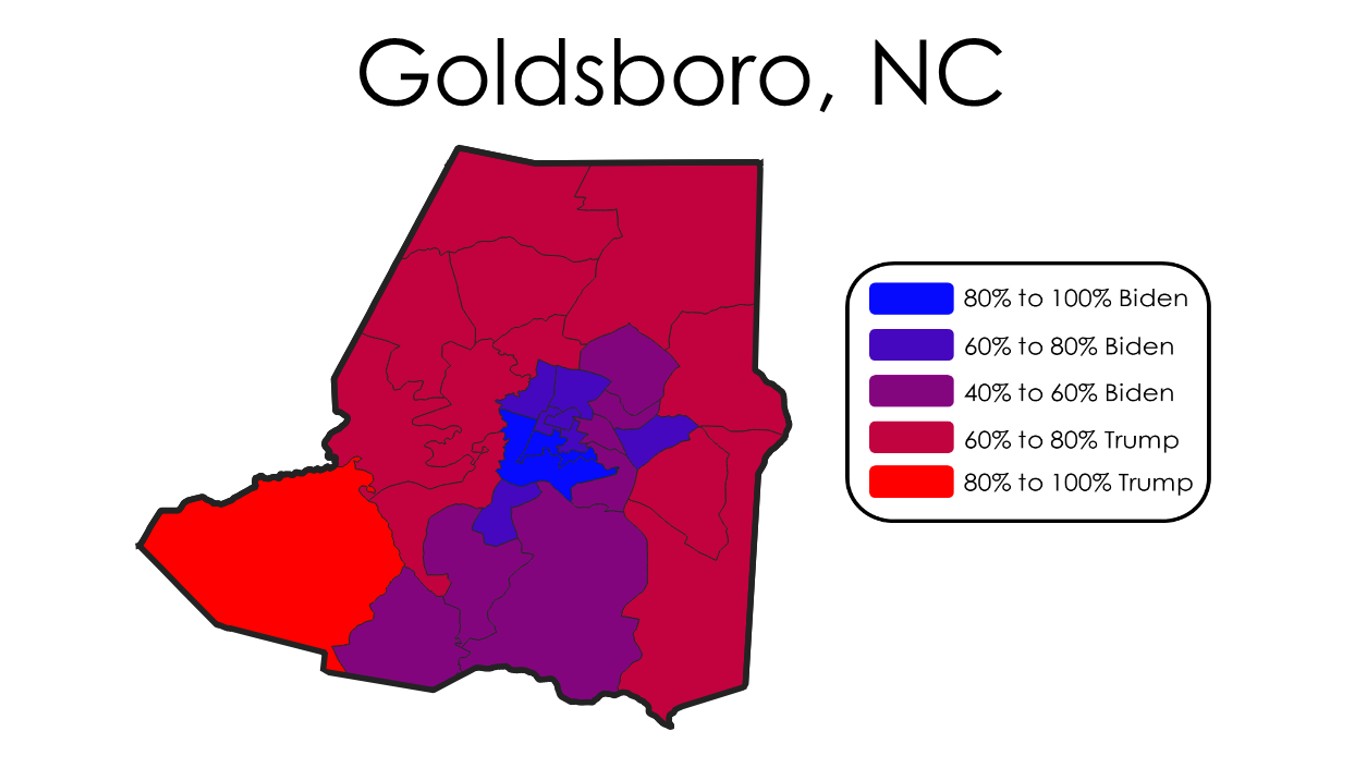
16. Goldsboro, NC
> 2020 presidential results: 44.1.% Biden, 55.9% Trump
> Strong Democratic precincts (80%+ for Biden): 3 of 35
> Strong Republican precincts (80%+ for Trump): 7 of 35
> Biden voters in strong Democratic precincts: 19.0% of Biden voters
> Trump voters in strong Republican precincts: 22.5% of Trump voters
> Median household income: $47,221 (#358 highest of 384 MSAs)
> Total population: 123,785 (#322 largest of 384 MSAs)

15. Little Rock-North Little Rock-Conway, AR
> 2020 presidential results: 46.0.% Biden, 54.0% Trump
> Strong Democratic precincts (80%+ for Biden): 39 of 320
> Strong Republican precincts (80%+ for Trump): 81 of 320
> Biden voters in strong Democratic precincts: 22.9% of Biden voters
> Trump voters in strong Republican precincts: 25.5% of Trump voters
> Median household income: $55,983 (#232 highest of 384 MSAs)
> Total population: 740,602 (#78 largest of 384 MSAs)
[in-text-ad]
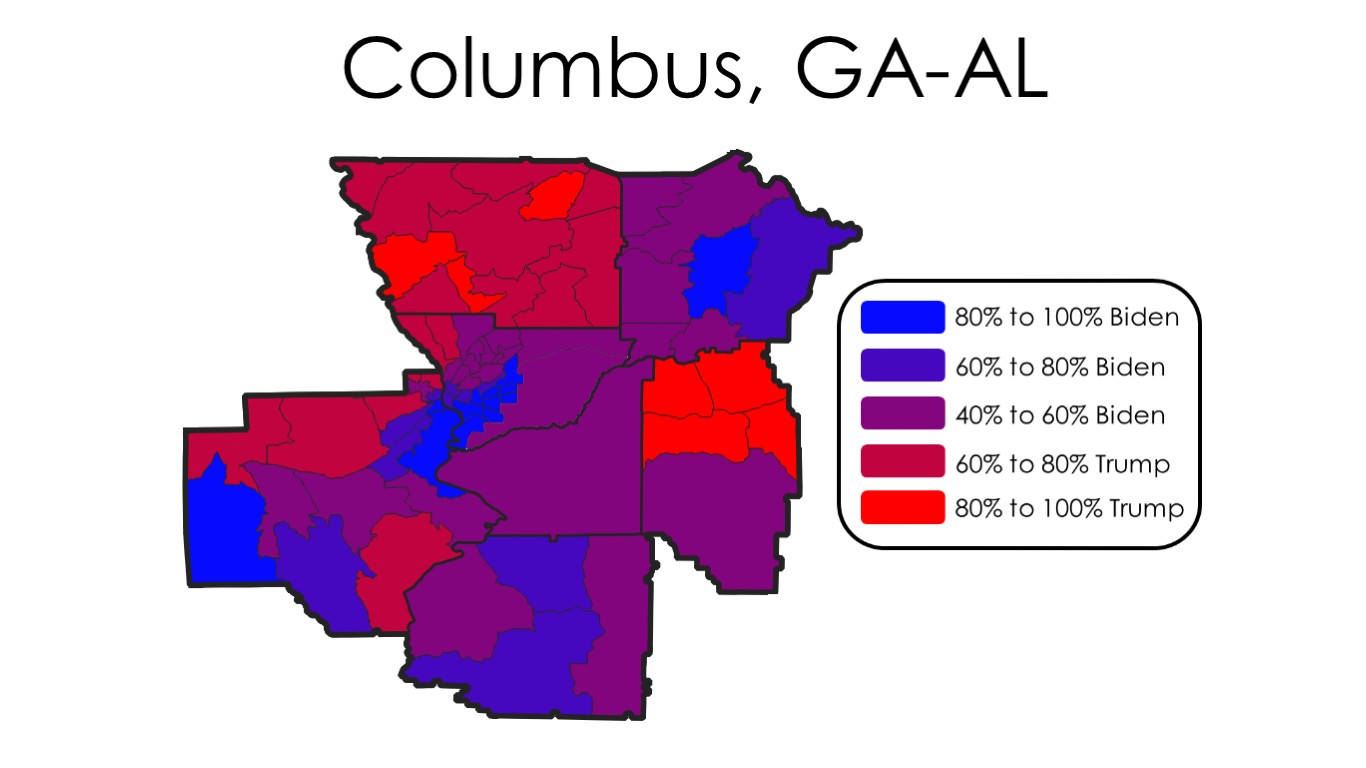
14. Columbus, GA-AL
> 2020 presidential results: 54.5.% Biden, 45.5% Trump
> Strong Democratic precincts (80%+ for Biden): 11 of 72
> Strong Republican precincts (80%+ for Trump): 7 of 72
> Biden voters in strong Democratic precincts: 37.4% of Biden voters
> Trump voters in strong Republican precincts: 8.7% of Trump voters
> Median household income: $48,903 (#337 highest of 384 MSAs)
> Total population: 319,643 (#159 largest of 384 MSAs)
[recirclink id=1150139]
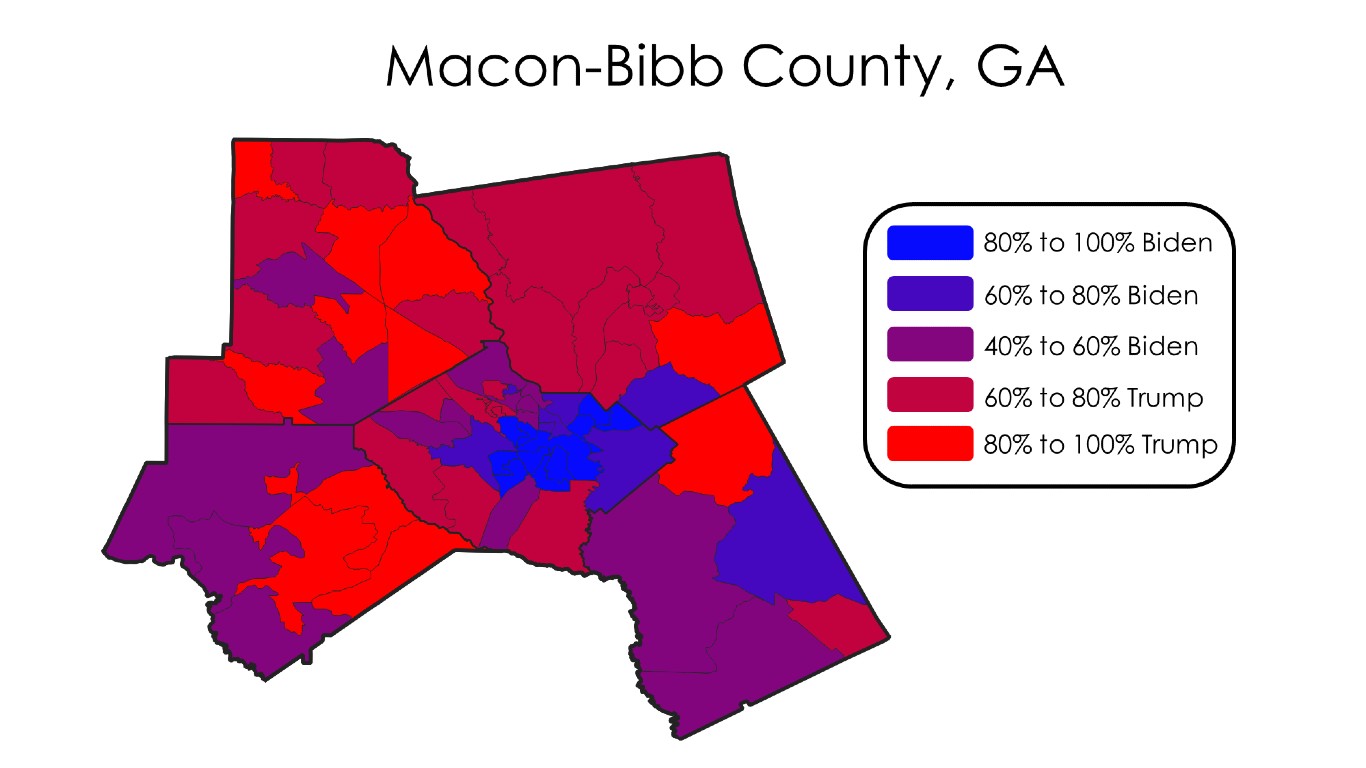
13. Macon-Bibb County, GA
> 2020 presidential results: 50.9.% Biden, 49.1% Trump
> Strong Democratic precincts (80%+ for Biden): 11 of 66
> Strong Republican precincts (80%+ for Trump): 11 of 66
> Biden voters in strong Democratic precincts: 32.3% of Biden voters
> Trump voters in strong Republican precincts: 18.4% of Trump voters
> Median household income: $46,083 (#370 highest of 384 MSAs)
> Total population: 229,565 (#200 largest of 384 MSAs)
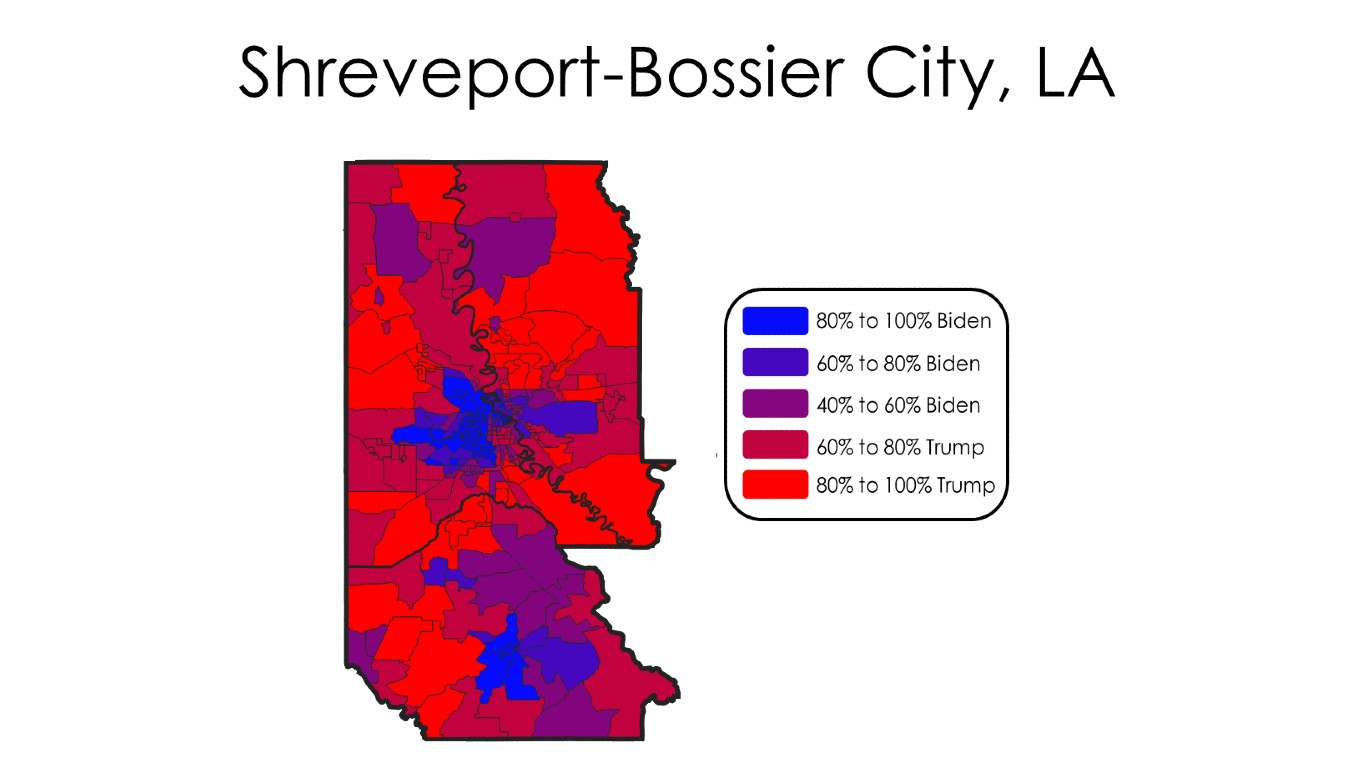
12. Shreveport-Bossier City, LA
> 2020 presidential results: 44.5.% Biden, 55.5% Trump
> Strong Democratic precincts (80%+ for Biden): 57 of 273
> Strong Republican precincts (80%+ for Trump): 68 of 273
> Biden voters in strong Democratic precincts: 25.2% of Biden voters
> Trump voters in strong Republican precincts: 26.1% of Trump voters
> Median household income: $46,610 (#362 highest of 384 MSAs)
> Total population: 397,590 (#138 largest of 384 MSAs)
[in-text-ad-2]
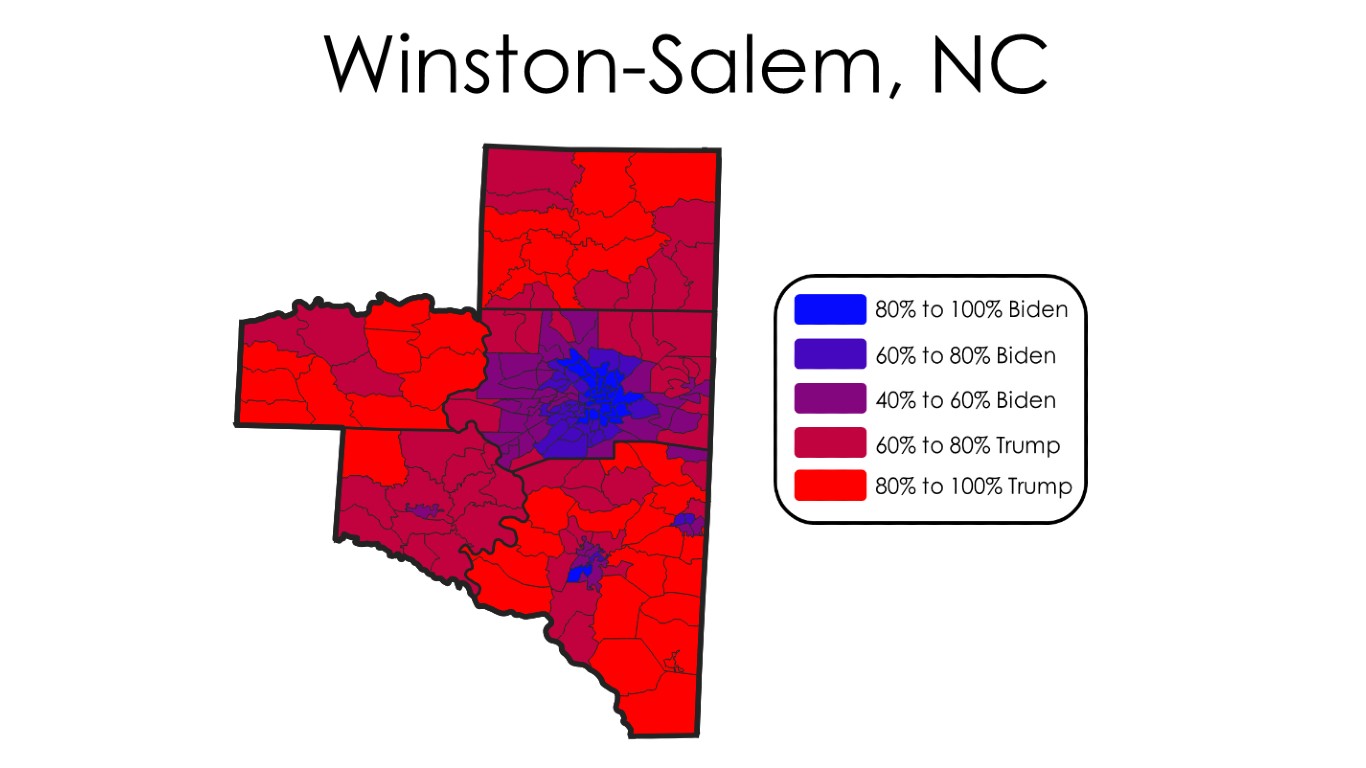
11. Winston-Salem, NC
> 2020 presidential results: 42.6.% Biden, 57.4% Trump
> Strong Democratic precincts (80%+ for Biden): 25 of 201
> Strong Republican precincts (80%+ for Trump): 63 of 201
> Biden voters in strong Democratic precincts: 17.3% of Biden voters
> Trump voters in strong Republican precincts: 35.7% of Trump voters
> Median household income: $52,607 (#290 highest of 384 MSAs)
> Total population: 671,156 (#87 largest of 384 MSAs)
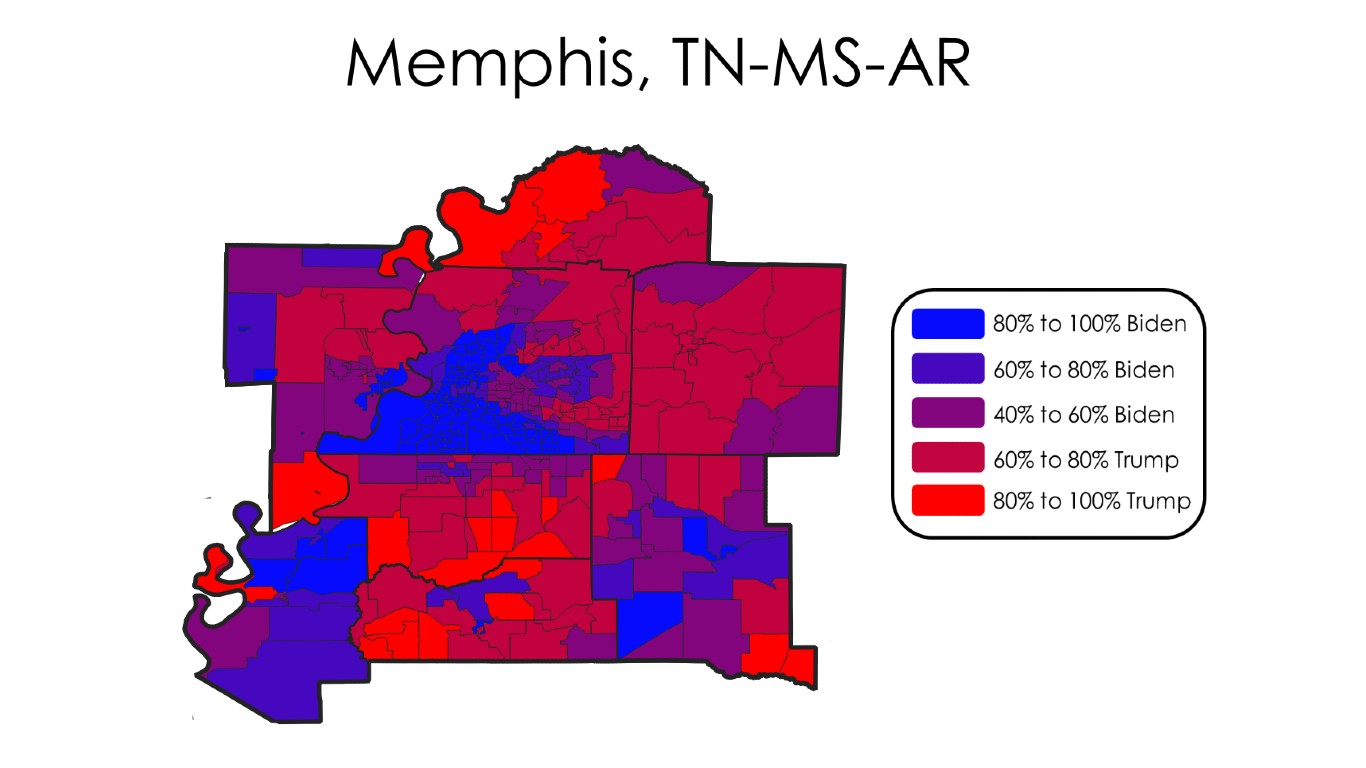
10. Memphis, TN-MS-AR
> 2020 presidential results: 56.8.% Biden, 43.2% Trump
> Strong Democratic precincts (80%+ for Biden): 94 of 309
> Strong Republican precincts (80%+ for Trump): 22 of 309
> Biden voters in strong Democratic precincts: 43.2% of Biden voters
> Trump voters in strong Republican precincts: 8.6% of Trump voters
> Median household income: $53,896 (#266 highest of 384 MSAs)
> Total population: 1,343,150 (#43 largest of 384 MSAs)
[in-text-ad]
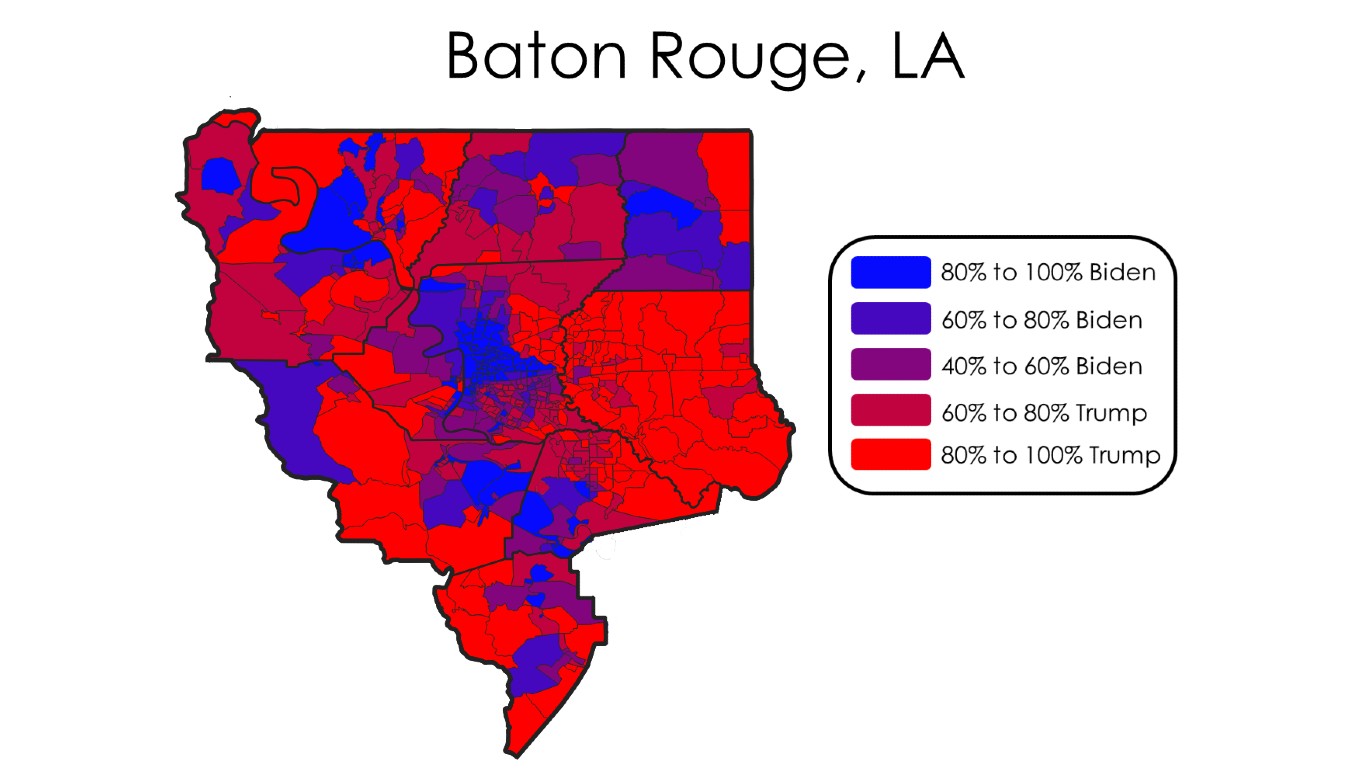
9. Baton Rouge, LA
> 2020 presidential results: 44.0.% Biden, 56.0% Trump
> Strong Democratic precincts (80%+ for Biden): 151 of 685
> Strong Republican precincts (80%+ for Trump): 190 of 685
> Biden voters in strong Democratic precincts: 20.1% of Biden voters
> Trump voters in strong Republican precincts: 37.3% of Trump voters
> Median household income: $60,043 (#172 highest of 384 MSAs)
> Total population: 856,779 (#66 largest of 384 MSAs)
[recirclink id=1142537]
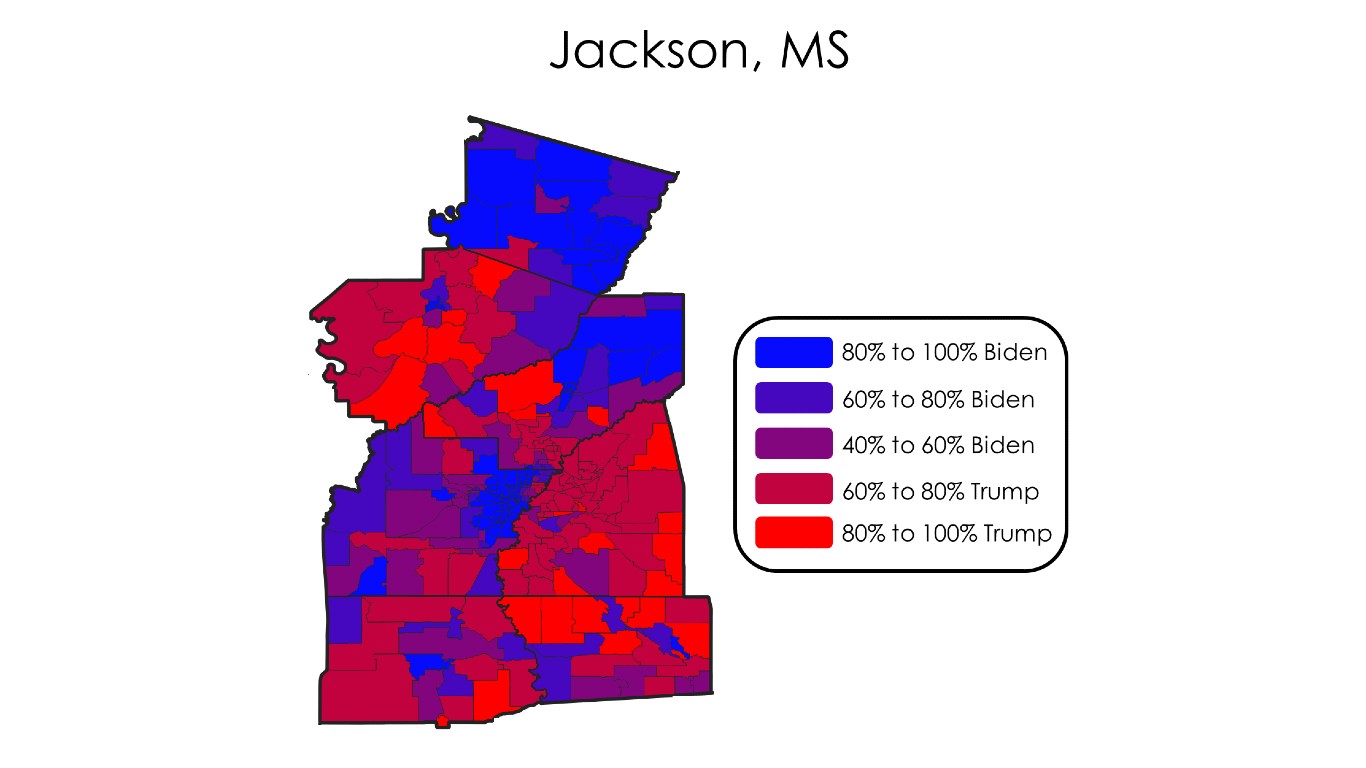
8. Jackson, MS
> 2020 presidential results: 52.3.% Biden, 47.7% Trump
> Strong Democratic precincts (80%+ for Biden): 95 of 280
> Strong Republican precincts (80%+ for Trump): 28 of 280
> Biden voters in strong Democratic precincts: 44.7% of Biden voters
> Trump voters in strong Republican precincts: 13.7% of Trump voters
> Median household income: $53,639 (#272 highest of 384 MSAs)
> Total population: 596,287 (#96 largest of 384 MSAs)
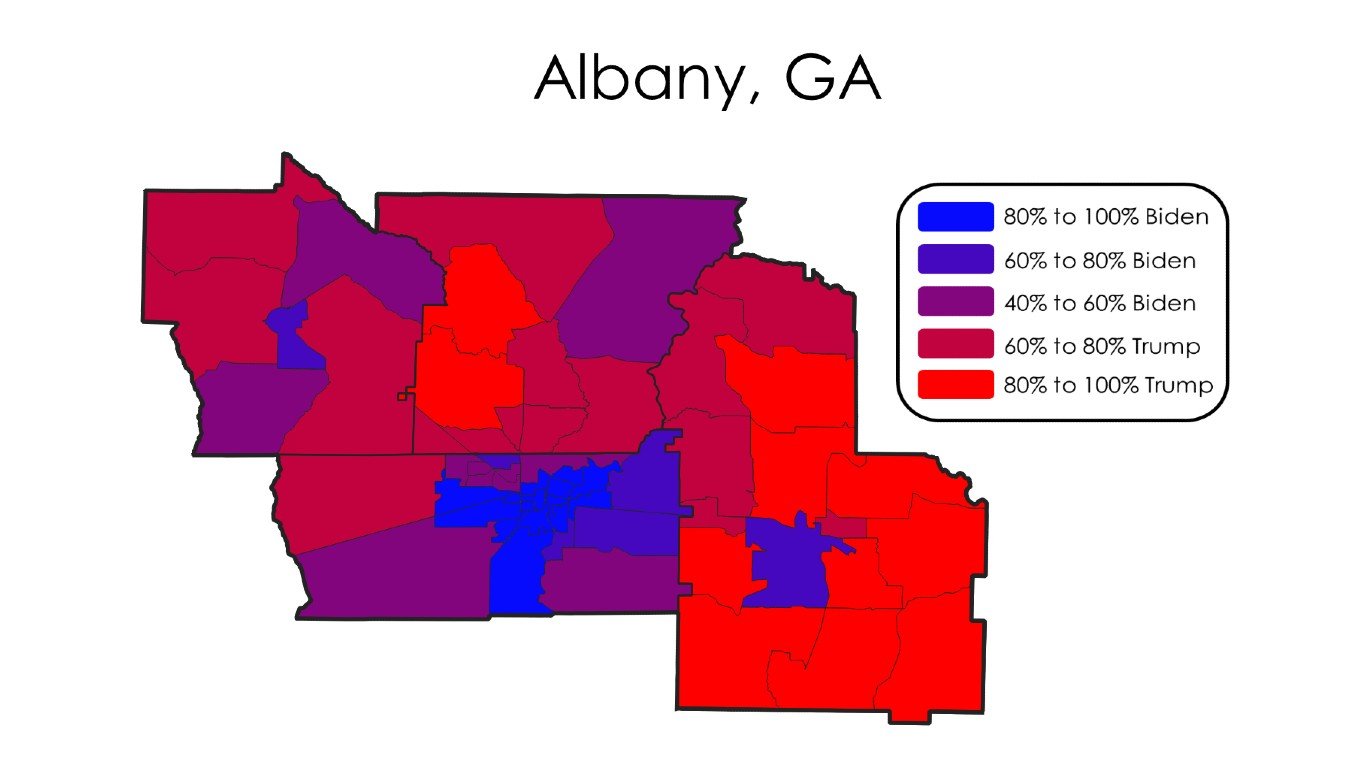
7. Albany, GA
> 2020 presidential results: 52.0.% Biden, 48.0% Trump
> Strong Democratic precincts (80%+ for Biden): 15 of 59
> Strong Republican precincts (80%+ for Trump): 11 of 59
> Biden voters in strong Democratic precincts: 41.4% of Biden voters
> Trump voters in strong Republican precincts: 17.8% of Trump voters
> Median household income: $46,323 (#367 highest of 384 MSAs)
> Total population: 147,431 (#286 largest of 384 MSAs)
[in-text-ad-2]
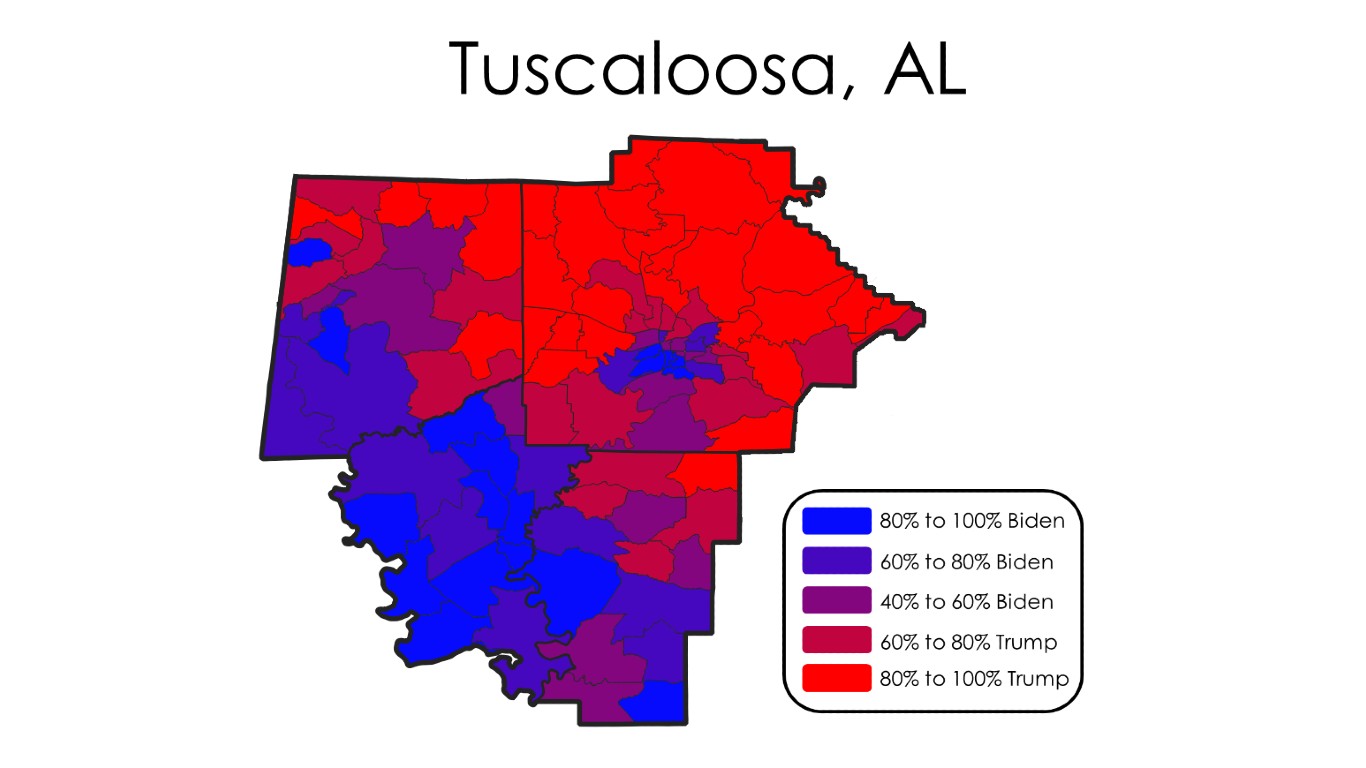
6. Tuscaloosa, AL
> 2020 presidential results: 45.3.% Biden, 54.7% Trump
> Strong Democratic precincts (80%+ for Biden): 18 of 105
> Strong Republican precincts (80%+ for Trump): 33 of 105
> Biden voters in strong Democratic precincts: 21.0% of Biden voters
> Trump voters in strong Republican precincts: 37.7% of Trump voters
> Median household income: $50,871 (#313 highest of 384 MSAs)
> Total population: 251,878 (#190 largest of 384 MSAs)
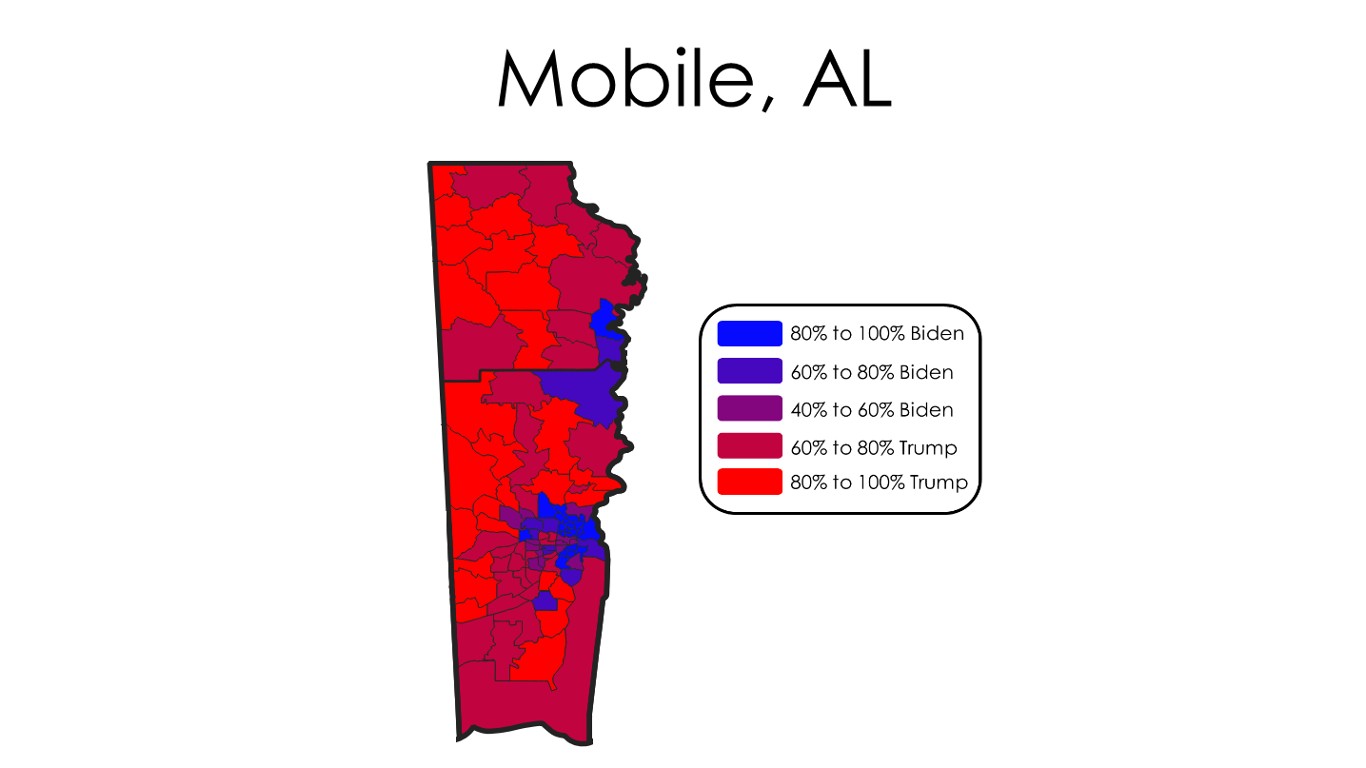
5. Mobile, AL
> 2020 presidential results: 43.1.% Biden, 56.9% Trump
> Strong Democratic precincts (80%+ for Biden): 19 of 106
> Strong Republican precincts (80%+ for Trump): 34 of 106
> Biden voters in strong Democratic precincts: 21.5% of Biden voters
> Trump voters in strong Republican precincts: 39.6% of Trump voters
> Median household income: $49,370 (#334 highest of 384 MSAs)
> Total population: 430,313 (#125 largest of 384 MSAs)
[in-text-ad]
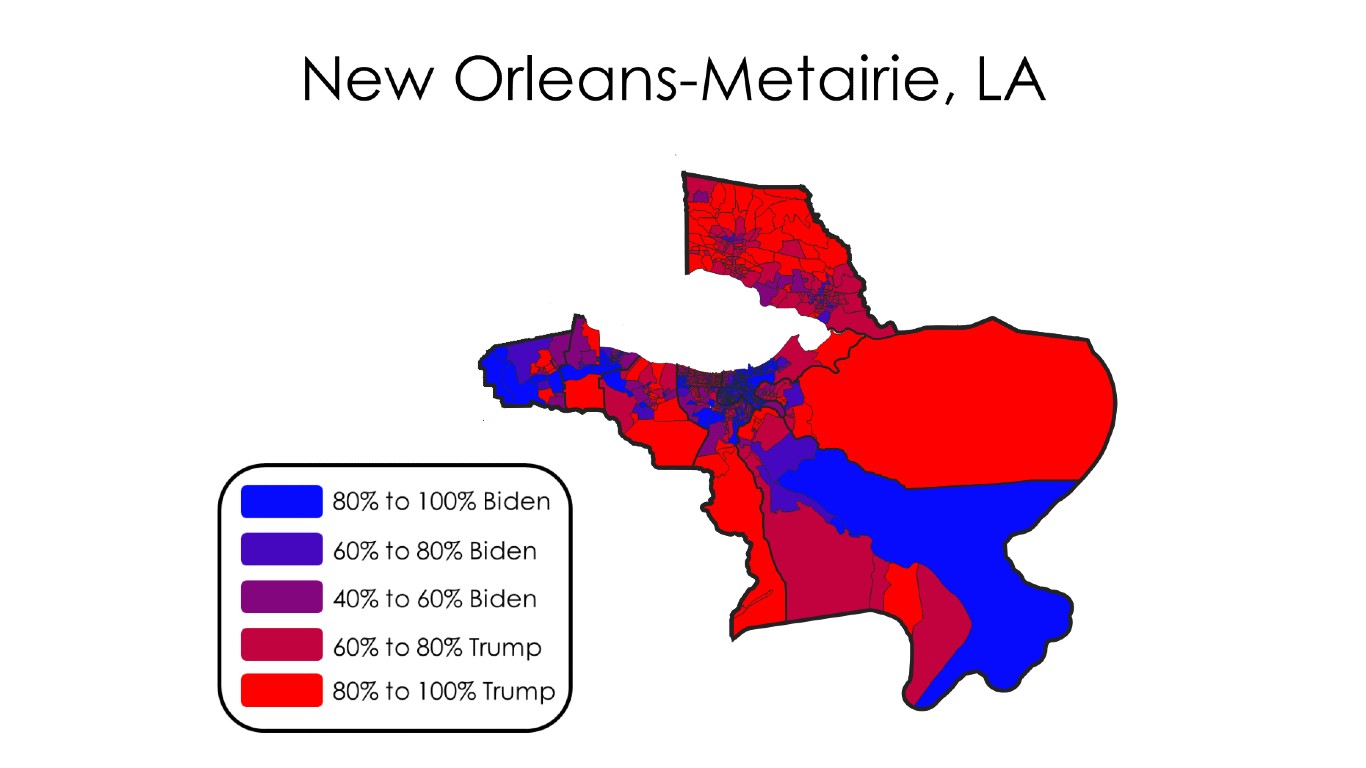
4. New Orleans-Metairie, LA
> 2020 presidential results: 52.3.% Biden, 47.7% Trump
> Strong Democratic precincts (80%+ for Biden): 281 of 960
> Strong Republican precincts (80%+ for Trump): 183 of 960
> Biden voters in strong Democratic precincts: 47.8% of Biden voters
> Trump voters in strong Republican precincts: 21.8% of Trump voters
> Median household income: $54,388 (#262 highest of 384 MSAs)
> Total population: 1,271,651 (#45 largest of 384 MSAs)
[recirclink id=1162834]
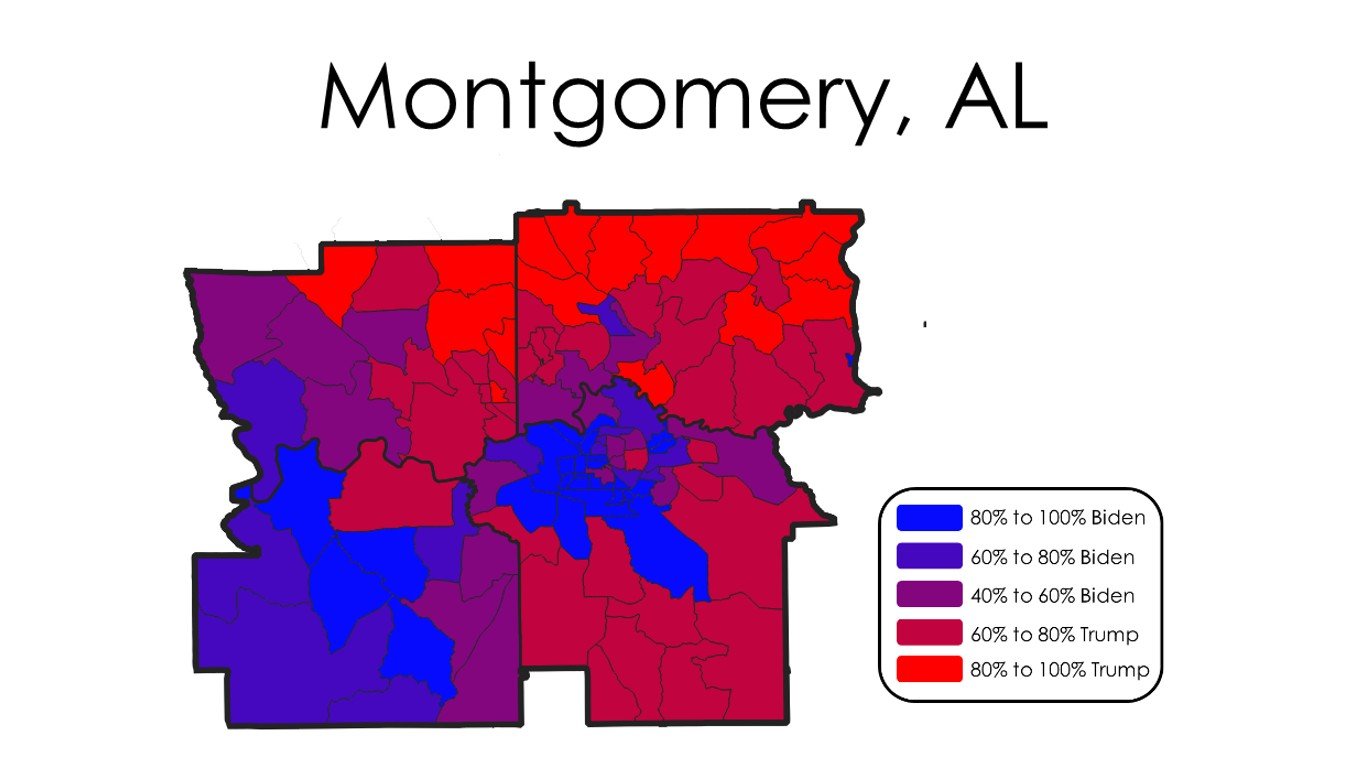
3. Montgomery, AL
> 2020 presidential results: 50.6.% Biden, 49.4% Trump
> Strong Democratic precincts (80%+ for Biden): 23 of 112
> Strong Republican precincts (80%+ for Trump): 22 of 112
> Biden voters in strong Democratic precincts: 50.1% of Biden voters
> Trump voters in strong Republican precincts: 25.2% of Trump voters
> Median household income: $54,250 (#264 highest of 384 MSAs)
> Total population: 373,552 (#145 largest of 384 MSAs)
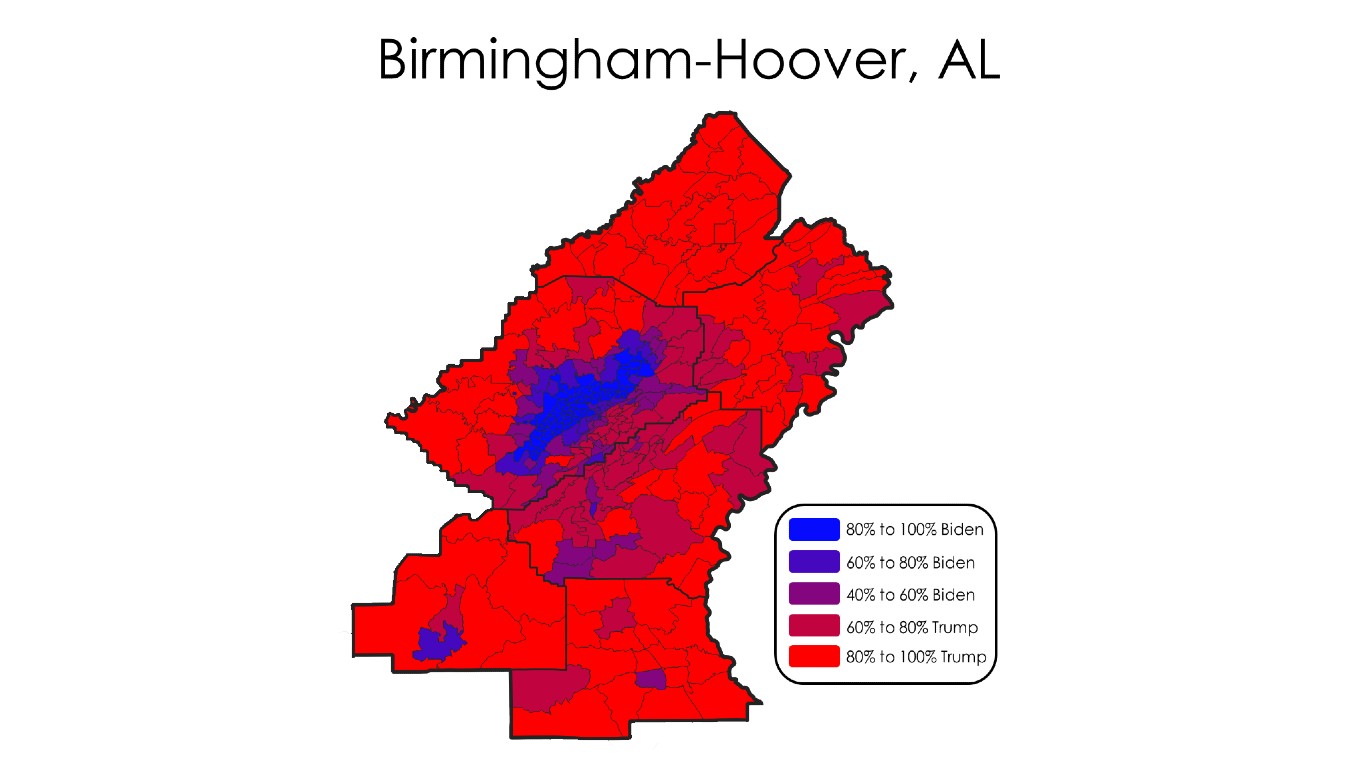
2. Birmingham-Hoover, AL
> 2020 presidential results: 43.2.% Biden, 56.8% Trump
> Strong Democratic precincts (80%+ for Biden): 69 of 303
> Strong Republican precincts (80%+ for Trump): 108 of 303
> Biden voters in strong Democratic precincts: 43.5% of Biden voters
> Trump voters in strong Republican precincts: 41.6% of Trump voters
> Median household income: $59,185 (#186 highest of 384 MSAs)
> Total population: 1,088,170 (#50 largest of 384 MSAs)
[in-text-ad-2]
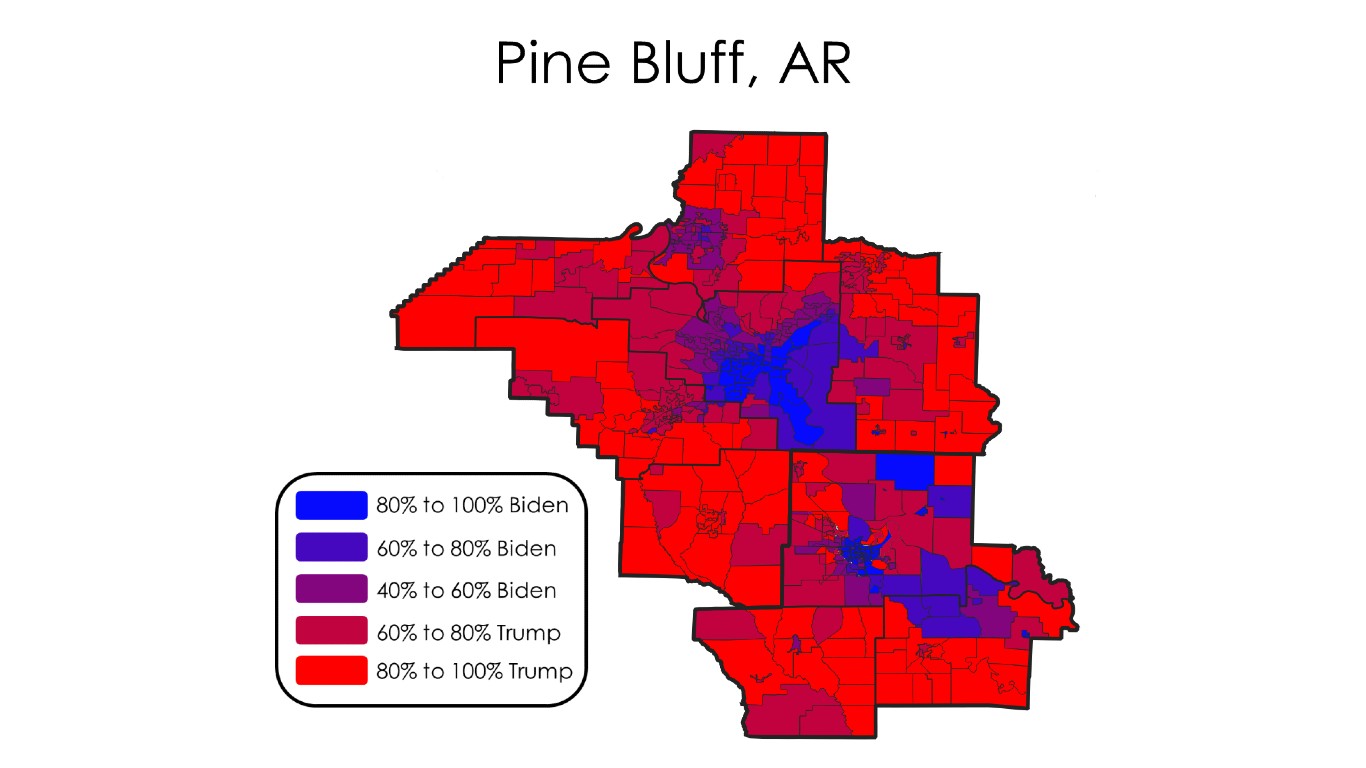
1. Pine Bluff, AR
> 2020 presidential results: 52.4.% Biden, 47.6% Trump
> Strong Democratic precincts (80%+ for Biden): 81 of 210
> Strong Republican precincts (80%+ for Trump): 46 of 210
> Biden voters in strong Democratic precincts: 59.9% of Biden voters
> Trump voters in strong Republican precincts: 41.5% of Trump voters
> Median household income: $41,856 (#382 highest of 384 MSAs)
> Total population: 89,464 (#369 largest of 384 MSAs)
Methodology
To determine the most politically polarized cities, 24/7 Wall St. reviewed precinct-level data on 2020 presidential election returns from the MIT Election Lab. Metropolitan statistical areas were ranked based on the percentage of votes that were cast in precincts where either Joe Biden or Donald Trump had at least 80% of the votes among Democratic and Republican voters. Vote shares were calculated from the total number of votes for either the Democratic or Republican nominee. Only metropolitan statistical areas where the two-party vote margin between Joe Biden and Donald Trump was less than 15 percentage points were considered. Precinct-level data was aggregated to the metropolitan level using boundary definitions from the U.S. Census Bureau. Supplemental data on median household income and total population are from the U.S. Census Bureau’s 2020 American Community Survey and are five-year estimates.
Data used in MSA precinct maps came from the Voting and Election Science Team, composed of researchers from the University of Florida and Wichita State University, and was accessed from the Harvard Dataverse. Precinct-level results are not standardized on a national level and were estimated in certain instances to conform to voting tabulation district spatial boundaries. As a result, precinct-level election results depicted in MSA maps may differ from the data underlying this story’s ranking.
Contact [email protected] for any questions or corrections.