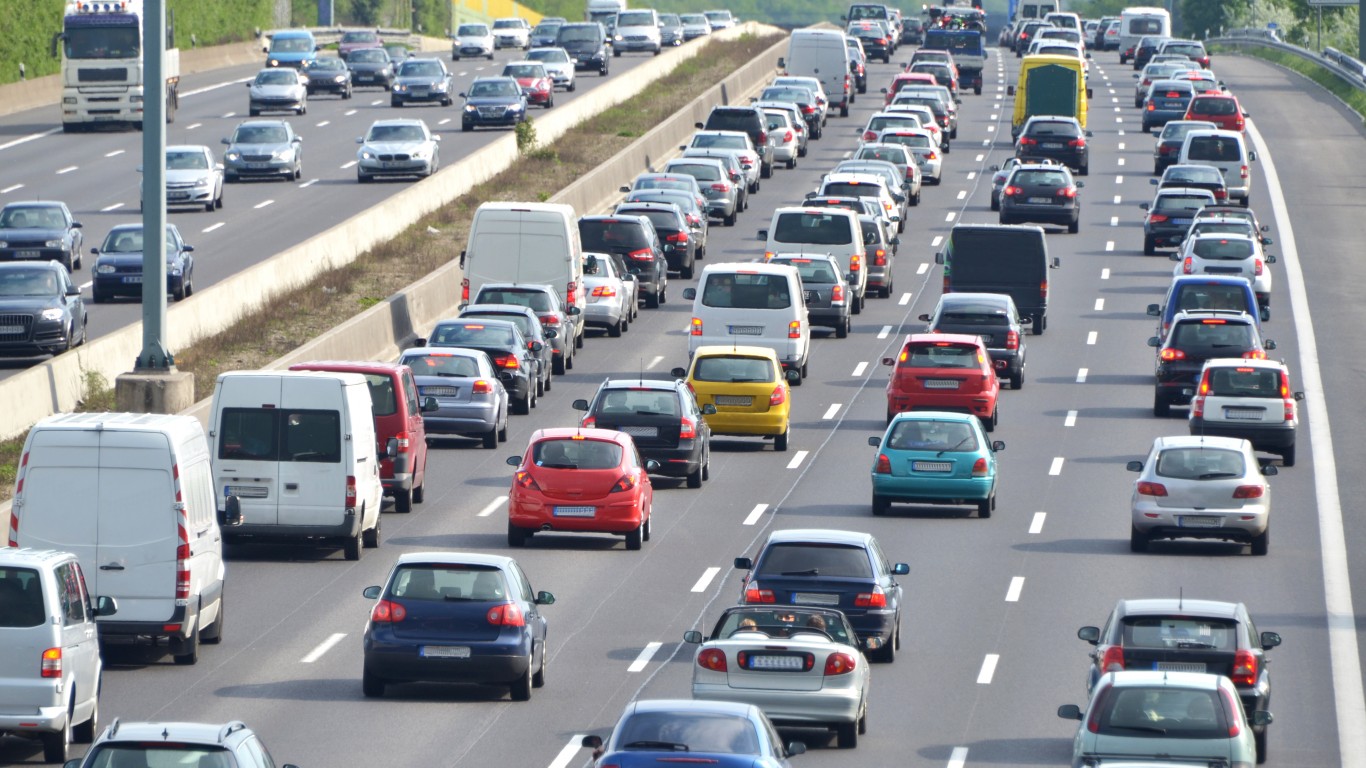
Motor vehicle thefts spiked in the United States during the COVID-19 pandemic, and continued to rise even after lockdown restrictions were lifted. A report from the nonprofit group National Insurance Crime Bureau found that 932,329 cars, trucks, and SUVs were reported stolen to law enforcement in 2021 – a 6% increase from 2020 and a 17% increase from 2019, the year before the pandemic began.
Experts attribute the rise to more vehicles sitting unattended and unused for longer periods of time during the pandemic. Some newer car models with keyless entry and push button ignitions are also increasingly being targeted by criminals who use devices to amplify a key fob’s signal, allowing them to enter and drive off in cars that are parked and locked. Additionally, certain Hyundai and Kia models can be stolen with no more than a screwdriver and USB charger. (Here is a look at the least reliable cars in America.)
The national surge in motor vehicle thefts is being driven by certain cities in particular, where reported cases of automobile theft surged by anywhere from 50% to over 100% since 2019.
Using data from the NICB’s report 2021 Hot Spots Vehicle Theft Report, 24/7 Wall St. identified the U.S. metro areas where motor vehicle theft rose the most during the COVID-19 pandemic. The 384 U.S. metro areas are ranked based on the change in reported thefts from 2019 and 2021. In each of the 40 cities on this list, cases of vehicle theft rose by 50% or more in that period.
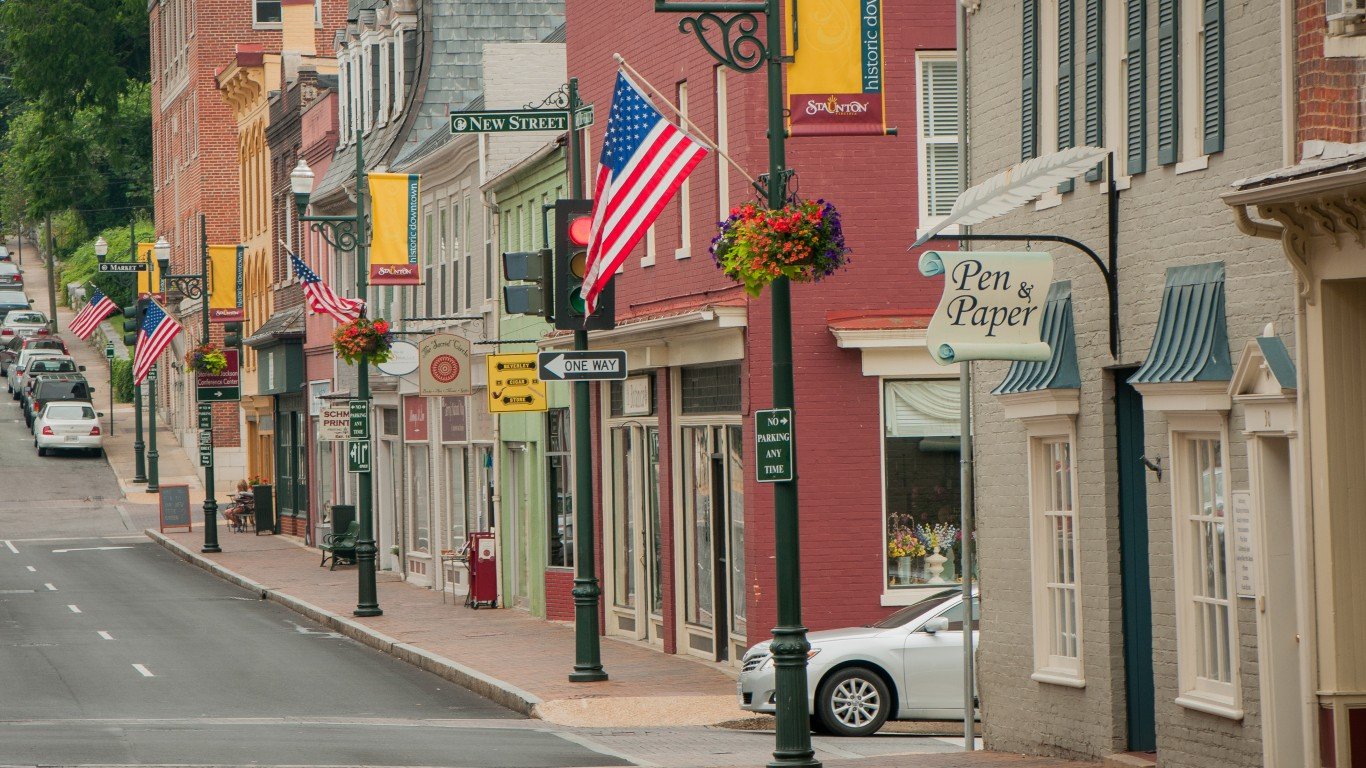
All but nine of the cities on this list are concentrated in the Western and Northeastern United States. The Midwest is home to eight cities on this list, and Charlottesville, Virginia, is the only city in the South to report a more than 50% increase in vehicle thefts from 2019 to 2020.
New York is home to more metro areas on this list than any other state, with nine of its 13 metropolitan areas reporting a 50% or more surge in auto theft.
Notably, there are over a dozen cities on this list where, despite the rise in theft, the motor vehicle theft rate remains below the national average of about 281 incidents per 100,000 people. Still, four of the five metro areas with the nation’s highest automobile theft rate are also on this list. (Here is a look at the worst cities to drive in every state.)
Click here to see cities where motor vehicle theft spiked during the pandemic.

40. Green Bay, WI
> Change in vehicle thefts, 2019-2021: +50.0% (+102 incidents)
> Total vehicle thefts: 306 in 2021; 204 in 2019
> Vehicle theft rate in 2021: 92.9 per 100,000 people (#326 of 384 U.S. metro areas)
> Vehicle theft rate in 2019: 63.2 per 100,000 people (#349 of 384 U.S. metro areas)
[in-text-ad]
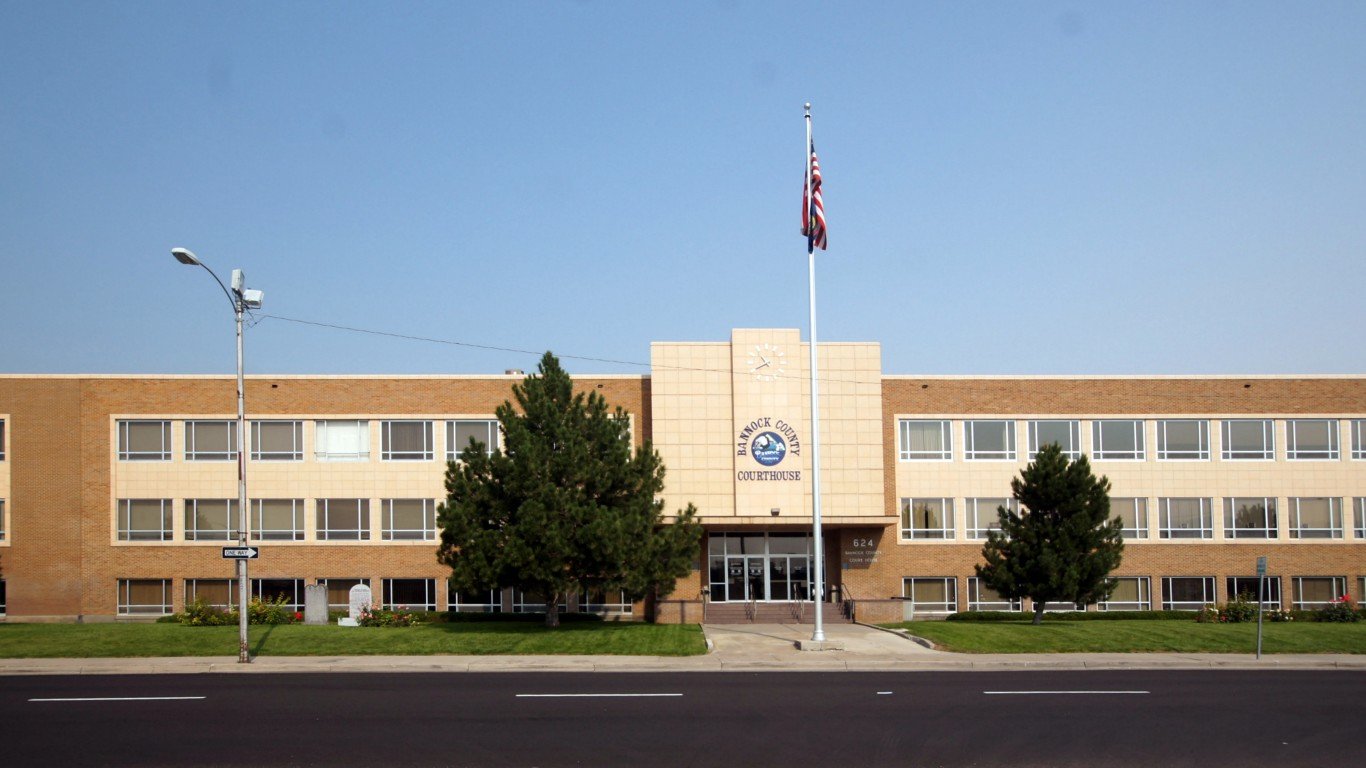
39. Pocatello, ID
> Change in vehicle thefts, 2019-2021: +50.3% (+74 incidents)
> Total vehicle thefts: 221 in 2021; 147 in 2019
> Vehicle theft rate in 2021: 229.7 per 100,000 people (#162 of 384 U.S. metro areas)
> Vehicle theft rate in 2019: 153.9 per 100,000 people (#235 of 384 U.S. metro areas)
[recirclink id=1195058]
38. Janesville-Beloit, WI
> Change in vehicle thefts, 2019-2021: +51.7% (+77 incidents)
> Total vehicle thefts: 226 in 2021; 149 in 2019
> Vehicle theft rate in 2021: 137.5 per 100,000 people (#266 of 384 U.S. metro areas)
> Vehicle theft rate in 2019: 91.2 per 100,000 people (#306 of 384 U.S. metro areas)
37. Kankakee, IL
> Change in vehicle thefts, 2019-2021: +51.7% (+46 incidents)
> Total vehicle thefts: 135 in 2021; 89 in 2019
> Vehicle theft rate in 2021: 126.6 per 100,000 people (#281 of 384 U.S. metro areas)
> Vehicle theft rate in 2019: 81.0 per 100,000 people (#330 of 384 U.S. metro areas)
[in-text-ad-2]
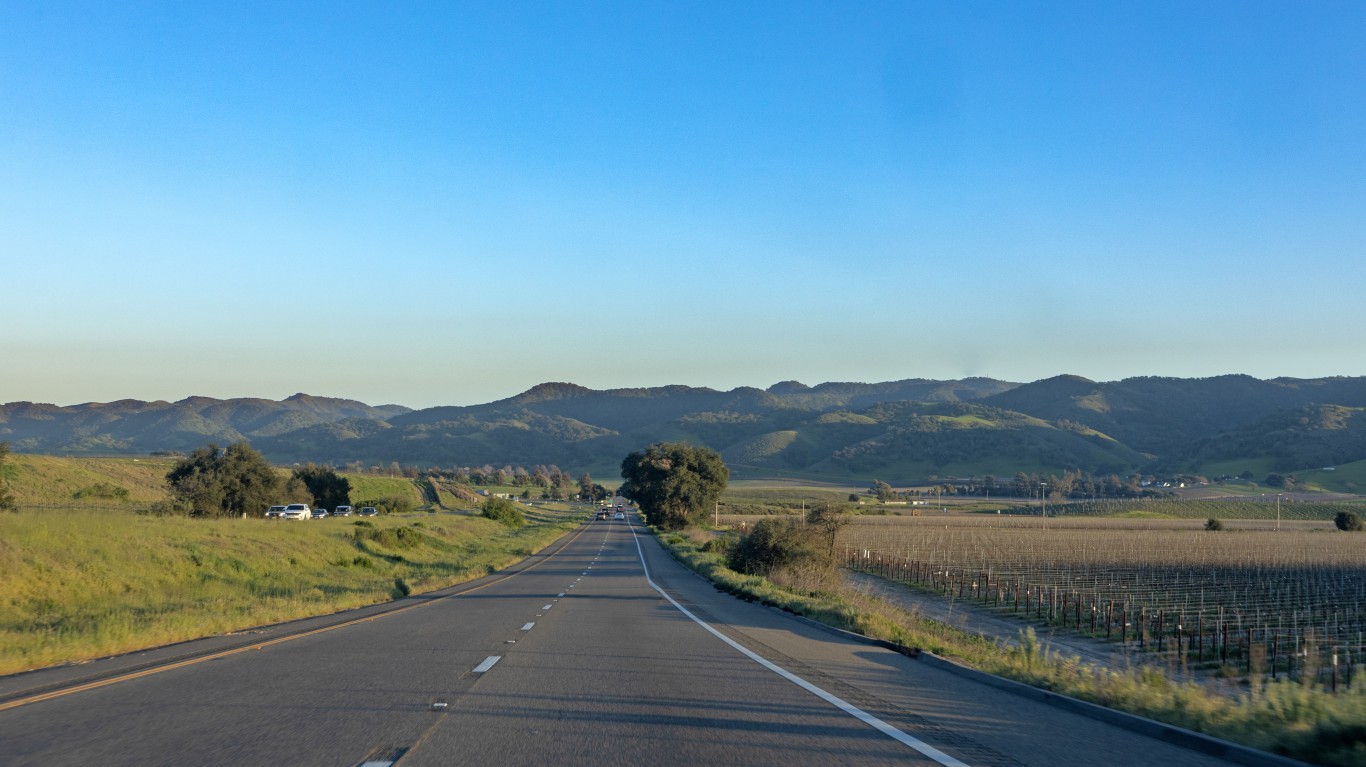
36. Santa Maria-Santa Barbara, CA
> Change in vehicle thefts, 2019-2021: +54.7% (+704 incidents)
> Total vehicle thefts: 1,992 in 2021; 1,288 in 2019
> Vehicle theft rate in 2021: 446.2 per 100,000 people (#31 of 384 U.S. metro areas)
> Vehicle theft rate in 2019: 288.5 per 100,000 people (#82 of 384 U.S. metro areas)

35. Binghamton, NY
> Change in vehicle thefts, 2019-2021: +55.5% (+71 incidents)
> Total vehicle thefts: 199 in 2021; 128 in 2019
> Vehicle theft rate in 2021: 81.2 per 100,000 people (#342 of 384 U.S. metro areas)
> Vehicle theft rate in 2019: 53.6 per 100,000 people (#360 of 384 U.S. metro areas)
[in-text-ad]

34. Boulder, CO
> Change in vehicle thefts, 2019-2021: +55.6% (+380 incidents)
> Total vehicle thefts: 1,064 in 2021; 684 in 2019
> Vehicle theft rate in 2021: 322.9 per 100,000 people (#82 of 384 U.S. metro areas)
> Vehicle theft rate in 2019: 209.7 per 100,000 people (#154 of 384 U.S. metro areas)
[recirclink id=1200476]
33. Bloomsburg-Berwick, PA
> Change in vehicle thefts, 2019-2021: +57.6% (+19 incidents)
> Total vehicle thefts: 52 in 2021; 33 in 2019
> Vehicle theft rate in 2021: 62.7 per 100,000 people (#361 of 384 U.S. metro areas)
> Vehicle theft rate in 2019: 39.7 per 100,000 people (#371 of 384 U.S. metro areas)
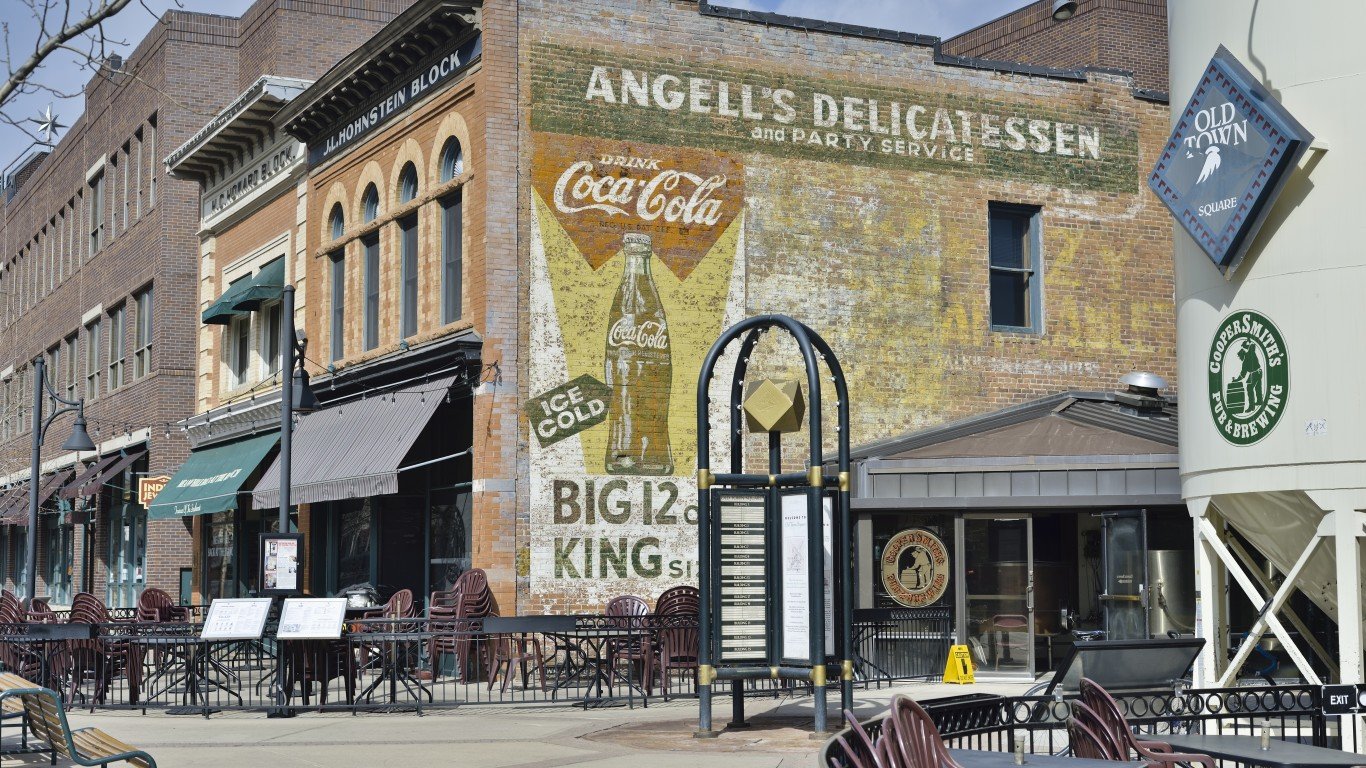
32. Fort Collins, CO
> Change in vehicle thefts, 2019-2021: +59.1% (+308 incidents)
> Total vehicle thefts: 829 in 2021; 521 in 2019
> Vehicle theft rate in 2021: 228.7 per 100,000 people (#164 of 384 U.S. metro areas)
> Vehicle theft rate in 2019: 146.0 per 100,000 people (#246 of 384 U.S. metro areas)
[in-text-ad-2]
31. Kennewick-Richland, WA
> Change in vehicle thefts, 2019-2021: +60.5% (+299 incidents)
> Total vehicle thefts: 793 in 2021; 494 in 2019
> Vehicle theft rate in 2021: 257.2 per 100,000 people (#132 of 384 U.S. metro areas)
> Vehicle theft rate in 2019: 164.9 per 100,000 people (#220 of 384 U.S. metro areas)
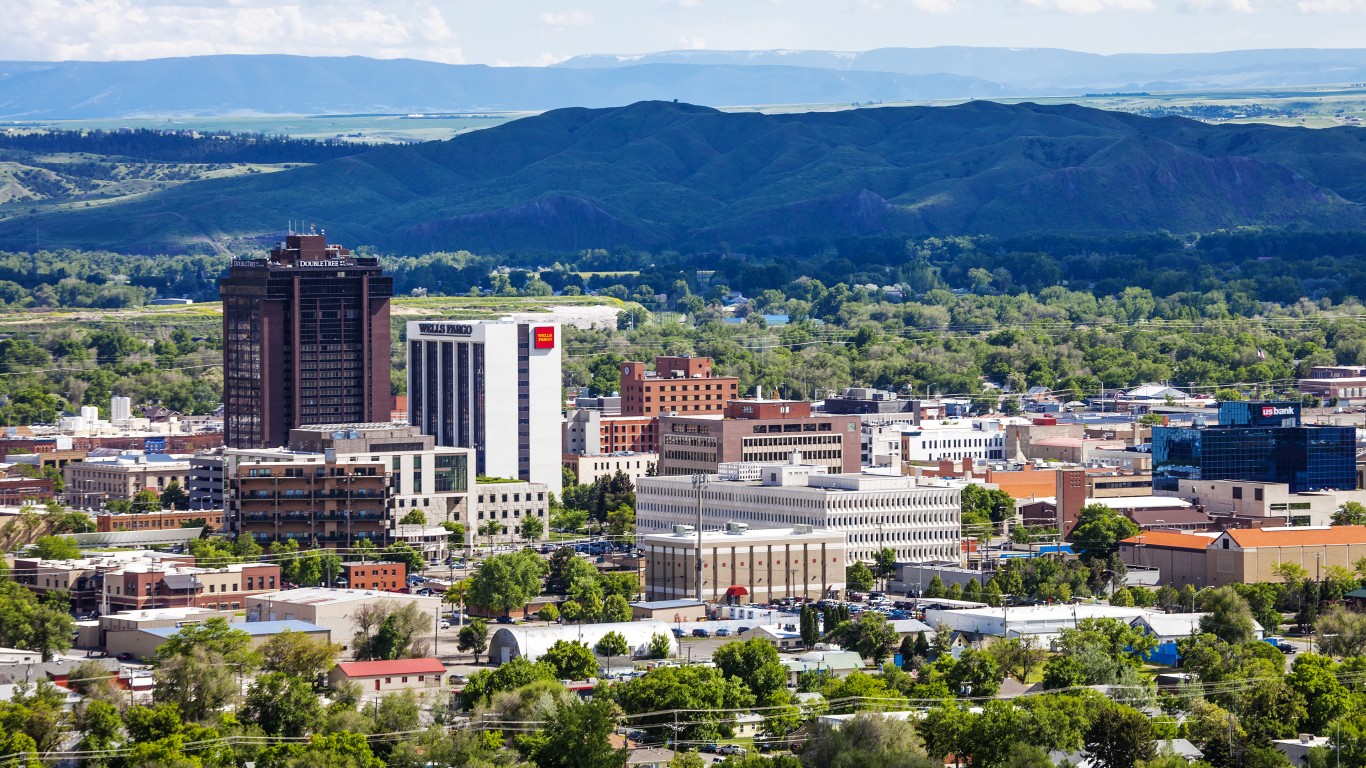
30. Billings, MT
> Change in vehicle thefts, 2019-2021: +63.5% (+444 incidents)
> Total vehicle thefts: 1,143 in 2021; 699 in 2019
> Vehicle theft rate in 2021: 611.1 per 100,000 people (#7 of 384 U.S. metro areas)
> Vehicle theft rate in 2019: 384.8 per 100,000 people (#42 of 384 U.S. metro areas)
[in-text-ad]
29. Midland, MI
> Change in vehicle thefts, 2019-2021: +64.3% (+18 incidents)
> Total vehicle thefts: 46 in 2021; 28 in 2019
> Vehicle theft rate in 2021: 55.1 per 100,000 people (#371 of 384 U.S. metro areas)
> Vehicle theft rate in 2019: 33.7 per 100,000 people (#374 of 384 U.S. metro areas)
[recirclink id=1178730]

28. Pittsfield, MA
> Change in vehicle thefts, 2019-2021: +65.7% (+44 incidents)
> Total vehicle thefts: 111 in 2021; 67 in 2019
> Vehicle theft rate in 2021: 86.3 per 100,000 people (#333 of 384 U.S. metro areas)
> Vehicle theft rate in 2019: 53.6 per 100,000 people (#361 of 384 U.S. metro areas)

27. Sioux Falls, SD
> Change in vehicle thefts, 2019-2021: +66.5% (+482 incidents)
> Total vehicle thefts: 1,207 in 2021; 725 in 2019
> Vehicle theft rate in 2021: 428.1 per 100,000 people (#36 of 384 U.S. metro areas)
> Vehicle theft rate in 2019: 270.3 per 100,000 people (#99 of 384 U.S. metro areas)
[in-text-ad-2]

26. Poughkeepsie-Newburgh-Middletown, NY
> Change in vehicle thefts, 2019-2021: +66.8% (+155 incidents)
> Total vehicle thefts: 387 in 2021; 232 in 2019
> Vehicle theft rate in 2021: 55.2 per 100,000 people (#370 of 384 U.S. metro areas)
> Vehicle theft rate in 2019: 34.2 per 100,000 people (#372 of 384 U.S. metro areas)
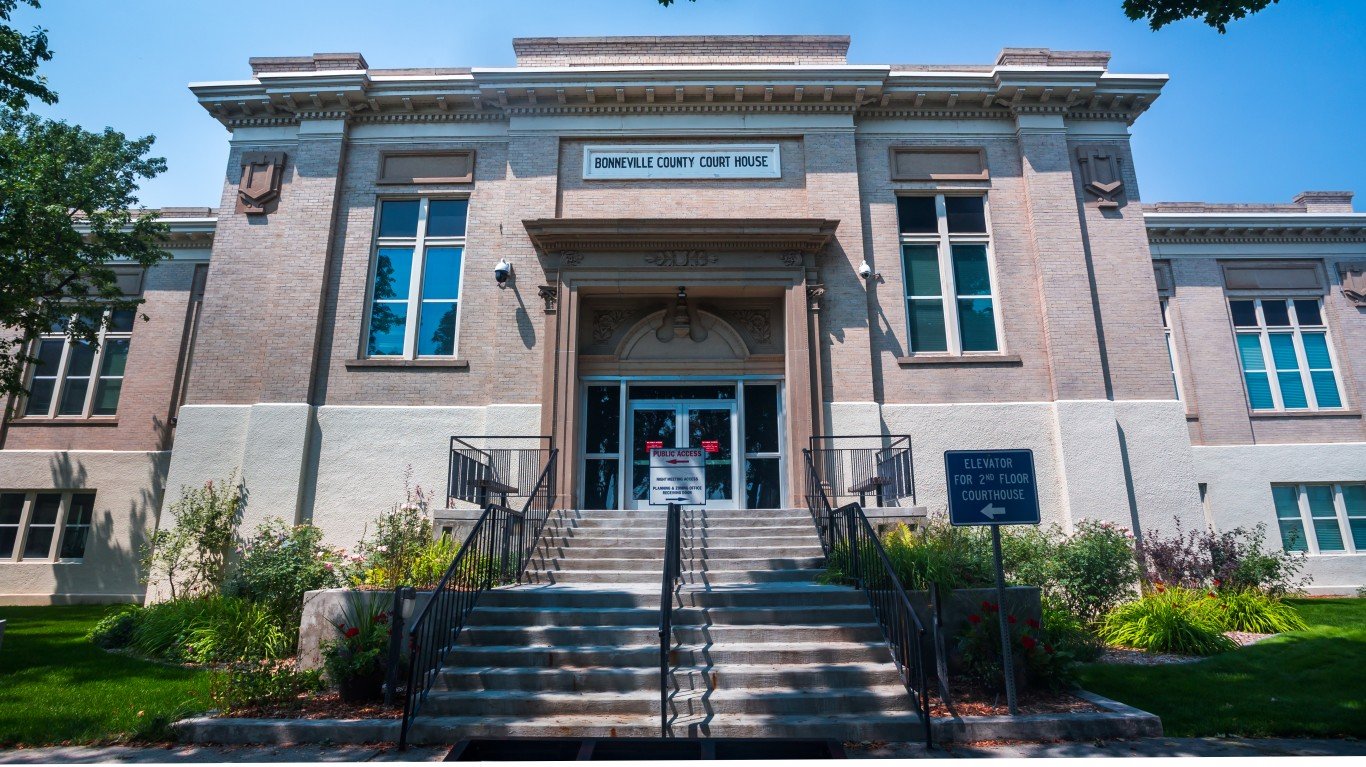
25. Idaho Falls, ID
> Change in vehicle thefts, 2019-2021: +68.1% (+79 incidents)
> Total vehicle thefts: 195 in 2021; 116 in 2019
> Vehicle theft rate in 2021: 119.8 per 100,000 people (#288 of 384 U.S. metro areas)
> Vehicle theft rate in 2019: 76.6 per 100,000 people (#336 of 384 U.S. metro areas)
[in-text-ad]

24. Grand Rapids-Kentwood, MI
> Change in vehicle thefts, 2019-2021: +72.5% (+826 incidents)
> Total vehicle thefts: 1,965 in 2021; 1,139 in 2019
> Vehicle theft rate in 2021: 180.0 per 100,000 people (#223 of 384 U.S. metro areas)
> Vehicle theft rate in 2019: 105.7 per 100,000 people (#290 of 384 U.S. metro areas)
[recirclink id=1209597]

23. Bremerton-Silverdale-Port Orchard, WA
> Change in vehicle thefts, 2019-2021: +75.2% (+360 incidents)
> Total vehicle thefts: 839 in 2021; 479 in 2019
> Vehicle theft rate in 2021: 305.9 per 100,000 people (#95 of 384 U.S. metro areas)
> Vehicle theft rate in 2019: 176.4 per 100,000 people (#202 of 384 U.S. metro areas)
22. Watertown-Fort Drum, NY
> Change in vehicle thefts, 2019-2021: +76.0% (+19 incidents)
> Total vehicle thefts: 44 in 2021; 25 in 2019
> Vehicle theft rate in 2021: 37.8 per 100,000 people (#380 of 384 U.S. metro areas)
> Vehicle theft rate in 2019: 22.8 per 100,000 people (#381 of 384 U.S. metro areas)
[in-text-ad-2]

21. Greeley, CO
> Change in vehicle thefts, 2019-2021: +79.3% (+582 incidents)
> Total vehicle thefts: 1,316 in 2021; 734 in 2019
> Vehicle theft rate in 2021: 387.0 per 100,000 people (#58 of 384 U.S. metro areas)
> Vehicle theft rate in 2019: 226.2 per 100,000 people (#136 of 384 U.S. metro areas)

20. Buffalo-Cheektowaga, NY
> Change in vehicle thefts, 2019-2021: +79.4% (+1,132 incidents)
> Total vehicle thefts: 2,558 in 2021; 1,426 in 2019
> Vehicle theft rate in 2021: 220.1 per 100,000 people (#175 of 384 U.S. metro areas)
> Vehicle theft rate in 2019: 126.4 per 100,000 people (#264 of 384 U.S. metro areas)
[in-text-ad]

19. Bangor, ME
> Change in vehicle thefts, 2019-2021: +80.2% (+65 incidents)
> Total vehicle thefts: 146 in 2021; 81 in 2019
> Vehicle theft rate in 2021: 95.6 per 100,000 people (#321 of 384 U.S. metro areas)
> Vehicle theft rate in 2019: 53.2 per 100,000 people (#362 of 384 U.S. metro areas)
[recirclink id=1210374]

18. Pueblo, CO
> Change in vehicle thefts, 2019-2021: +81.7% (+680 incidents)
> Total vehicle thefts: 1,512 in 2021; 832 in 2019
> Vehicle theft rate in 2021: 891.4 per 100,000 people (#3 of 384 U.S. metro areas)
> Vehicle theft rate in 2019: 494.0 per 100,000 people (#12 of 384 U.S. metro areas)

17. Longview, WA
> Change in vehicle thefts, 2019-2021: +84.1% (+164 incidents)
> Total vehicle thefts: 359 in 2021; 195 in 2019
> Vehicle theft rate in 2021: 321.9 per 100,000 people (#83 of 384 U.S. metro areas)
> Vehicle theft rate in 2019: 176.3 per 100,000 people (#203 of 384 U.S. metro areas)
[in-text-ad-2]

16. Grand Junction, CO
> Change in vehicle thefts, 2019-2021: +84.4% (+221 incidents)
> Total vehicle thefts: 483 in 2021; 262 in 2019
> Vehicle theft rate in 2021: 307.0 per 100,000 people (#94 of 384 U.S. metro areas)
> Vehicle theft rate in 2019: 169.9 per 100,000 people (#211 of 384 U.S. metro areas)

15. Mount Vernon-Anacortes, WA
> Change in vehicle thefts, 2019-2021: +86.8% (+230 incidents)
> Total vehicle thefts: 495 in 2021; 265 in 2019
> Vehicle theft rate in 2021: 378.7 per 100,000 people (#62 of 384 U.S. metro areas)
> Vehicle theft rate in 2019: 205.1 per 100,000 people (#164 of 384 U.S. metro areas)
[in-text-ad]

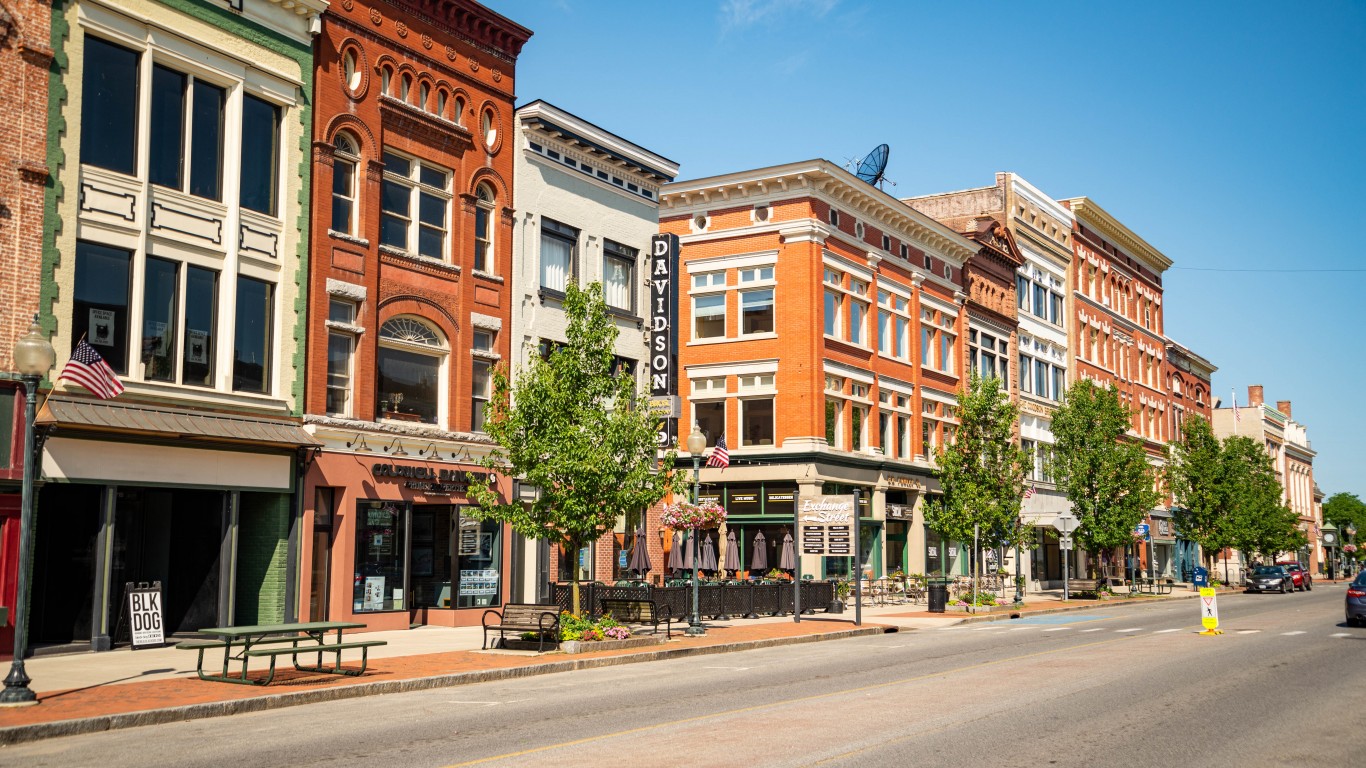
14. Burlington-South Burlington, VT
> Change in vehicle thefts, 2019-2021: +86.8% (+138 incidents)
> Total vehicle thefts: 297 in 2021; 159 in 2019
> Vehicle theft rate in 2021: 131.1 per 100,000 people (#274 of 384 U.S. metro areas)
> Vehicle theft rate in 2019: 72.1 per 100,000 people (#342 of 384 U.S. metro areas)
[recirclink id=1195058]

13. Bellingham, WA
> Change in vehicle thefts, 2019-2021: +86.9% (+258 incidents)
> Total vehicle thefts: 555 in 2021; 297 in 2019
> Vehicle theft rate in 2021: 242.5 per 100,000 people (#150 of 384 U.S. metro areas)
> Vehicle theft rate in 2019: 129.6 per 100,000 people (#260 of 384 U.S. metro areas)

12. Kalamazoo-Portage, MI
> Change in vehicle thefts, 2019-2021: +91.1% (+604 incidents)
> Total vehicle thefts: 1,267 in 2021; 663 in 2019
> Vehicle theft rate in 2021: 485.2 per 100,000 people (#23 of 384 U.S. metro areas)
> Vehicle theft rate in 2019: 250.1 per 100,000 people (#117 of 384 U.S. metro areas)
[in-text-ad-2]
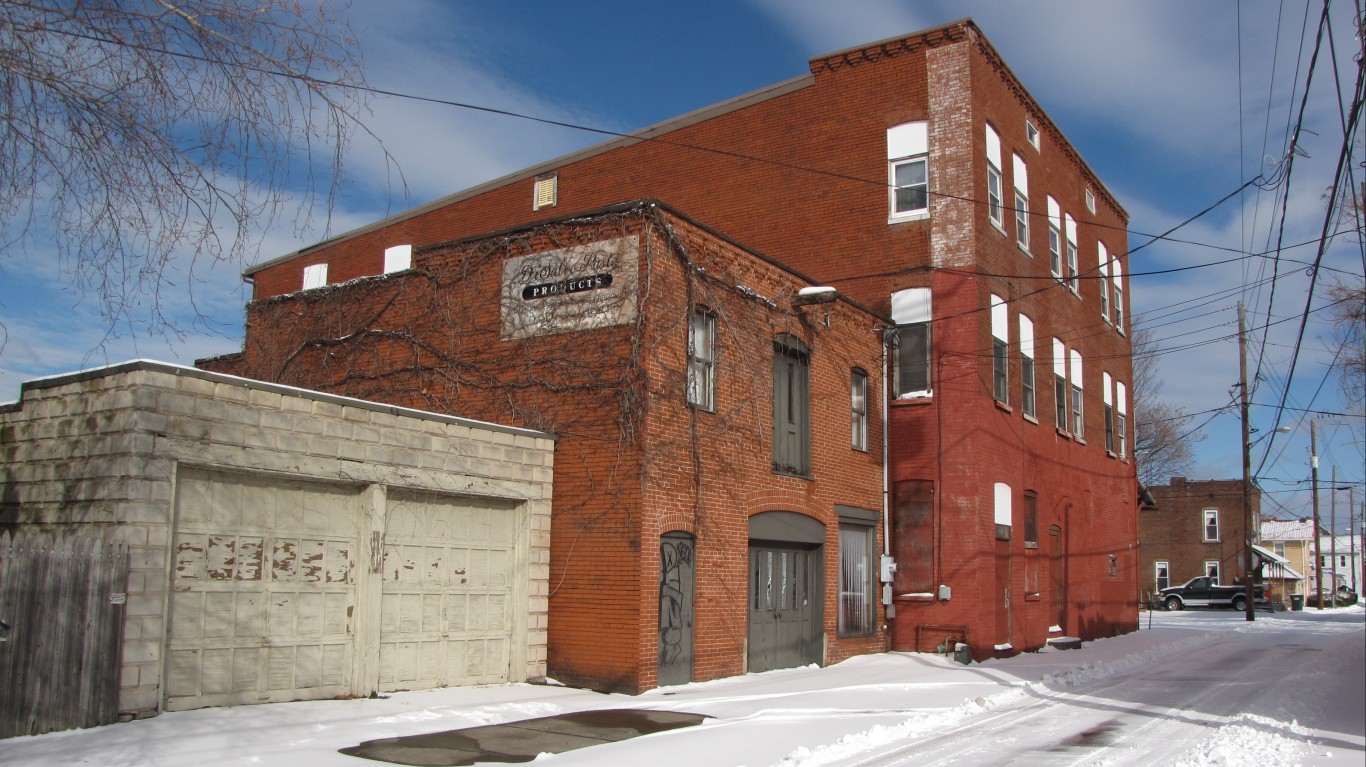
11. Elmira, NY
> Change in vehicle thefts, 2019-2021: +94.1% (+32 incidents)
> Total vehicle thefts: 66 in 2021; 34 in 2019
> Vehicle theft rate in 2021: 79.5 per 100,000 people (#344 of 384 U.S. metro areas)
> Vehicle theft rate in 2019: 40.7 per 100,000 people (#369 of 384 U.S. metro areas)

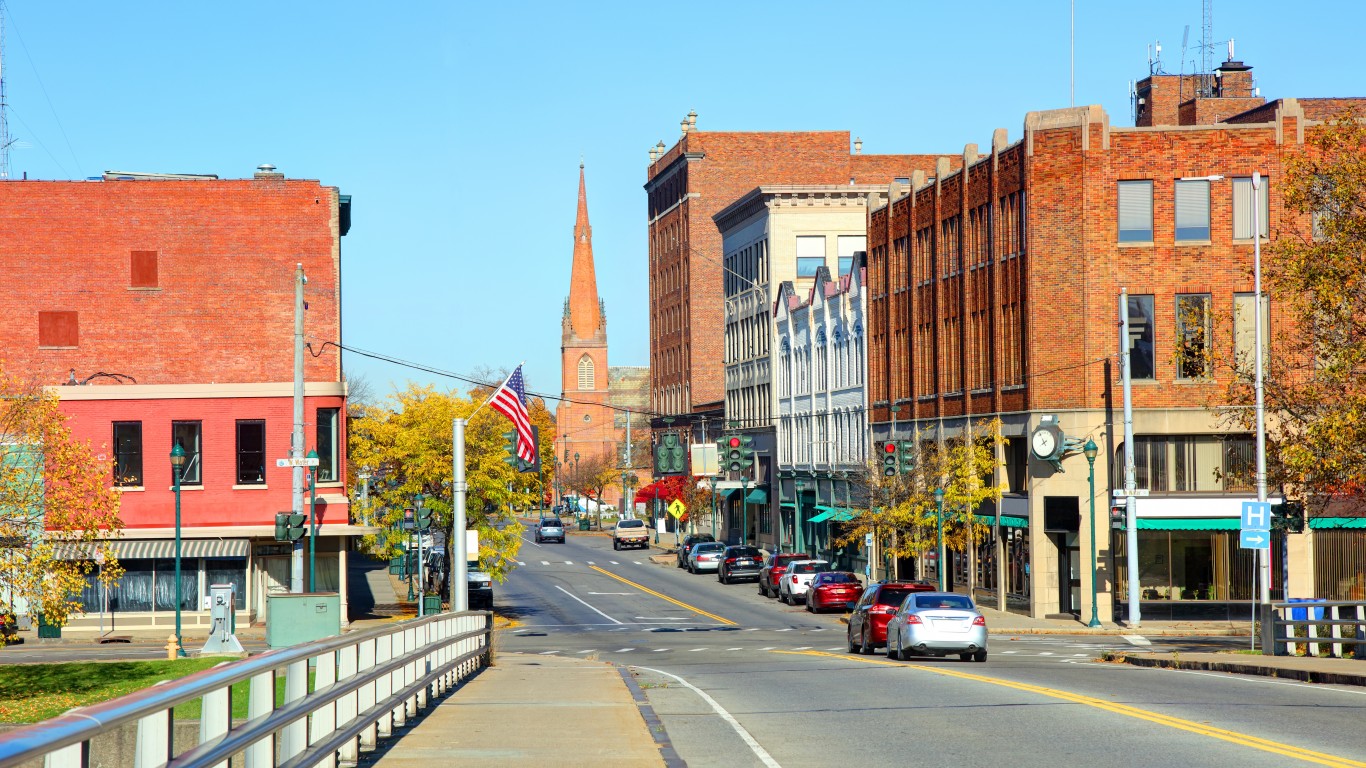
10. Rochester, NY
> Change in vehicle thefts, 2019-2021: +96.3% (+877 incidents)
> Total vehicle thefts: 1,788 in 2021; 911 in 2019
> Vehicle theft rate in 2021: 164.8 per 100,000 people (#241 of 384 U.S. metro areas)
> Vehicle theft rate in 2019: 85.2 per 100,000 people (#322 of 384 U.S. metro areas)
[in-text-ad]
9. Glens Falls, NY
> Change in vehicle thefts, 2019-2021: +100.0% (+22 incidents)
> Total vehicle thefts: 44 in 2021; 22 in 2019
> Vehicle theft rate in 2021: 34.8 per 100,000 people (#383 of 384 U.S. metro areas)
> Vehicle theft rate in 2019: 17.6 per 100,000 people (#383 of 384 U.S. metro areas)
[recirclink id=1200476]

8. Charlottesville, VA
> Change in vehicle thefts, 2019-2021: +100.8% (+134 incidents)
> Total vehicle thefts: 267 in 2021; 133 in 2019
> Vehicle theft rate in 2021: 119.9 per 100,000 people (#287 of 384 U.S. metro areas)
> Vehicle theft rate in 2019: 60.8 per 100,000 people (#351 of 384 U.S. metro areas)
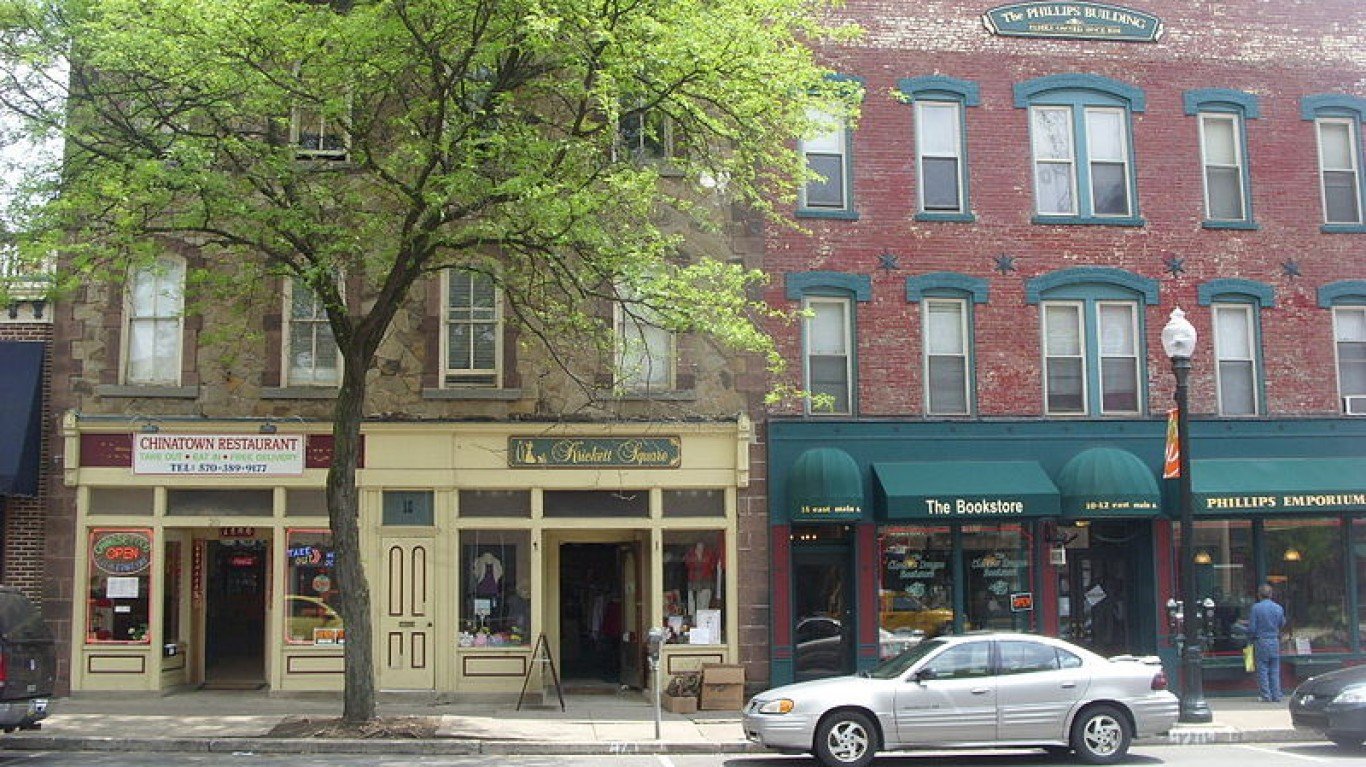
7. Williamsport, PA
> Change in vehicle thefts, 2019-2021: +102.8% (+37 incidents)
> Total vehicle thefts: 73 in 2021; 36 in 2019
> Vehicle theft rate in 2021: 64.3 per 100,000 people (#360 of 384 U.S. metro areas)
> Vehicle theft rate in 2019: 31.8 per 100,000 people (#377 of 384 U.S. metro areas)
[in-text-ad-2]
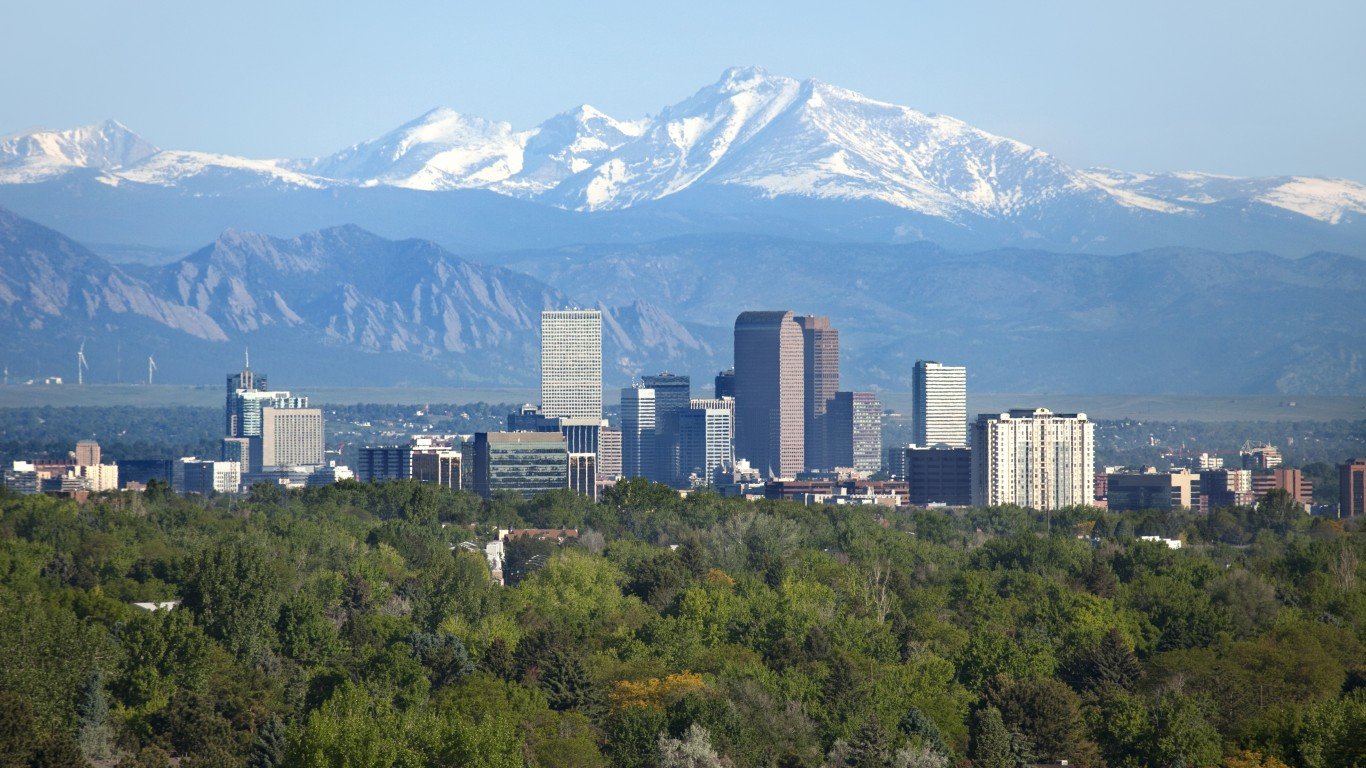
6. Denver-Aurora-Lakewood, CO
> Change in vehicle thefts, 2019-2021: +103.5% (+14,590 incidents)
> Total vehicle thefts: 28,683 in 2021; 14,093 in 2019
> Vehicle theft rate in 2021: 964.9 per 100,000 people (#2 of 384 U.S. metro areas)
> Vehicle theft rate in 2019: 475.0 per 100,000 people (#19 of 384 U.S. metro areas)

5. Wenatchee, WA
> Change in vehicle thefts, 2019-2021: +105.5% (+116 incidents)
> Total vehicle thefts: 226 in 2021; 110 in 2019
> Vehicle theft rate in 2021: 183.2 per 100,000 people (#218 of 384 U.S. metro areas)
> Vehicle theft rate in 2019: 91.2 per 100,000 people (#307 of 384 U.S. metro areas)
[in-text-ad]

4. Cheyenne, WY
> Change in vehicle thefts, 2019-2021: +108.6% (+214 incidents)
> Total vehicle thefts: 411 in 2021; 197 in 2019
> Vehicle theft rate in 2021: 407.5 per 100,000 people (#45 of 384 U.S. metro areas)
> Vehicle theft rate in 2019: 198.0 per 100,000 people (#172 of 384 U.S. metro areas)
[recirclink id=1178730]
3. Ithaca, NY
> Change in vehicle thefts, 2019-2021: +112.0% (+28 incidents)
> Total vehicle thefts: 53 in 2021; 25 in 2019
> Vehicle theft rate in 2021: 50.4 per 100,000 people (#374 of 384 U.S. metro areas)
> Vehicle theft rate in 2019: 24.5 per 100,000 people (#380 of 384 U.S. metro areas)

2. Milwaukee-Waukesha, WI
> Change in vehicle thefts, 2019-2021: +116.6% (+5,042 incidents)
> Total vehicle thefts: 9,365 in 2021; 4,323 in 2019
> Vehicle theft rate in 2021: 597.8 per 100,000 people (#8 of 384 U.S. metro areas)
> Vehicle theft rate in 2019: 274.4 per 100,000 people (#95 of 384 U.S. metro areas)
[in-text-ad-2]

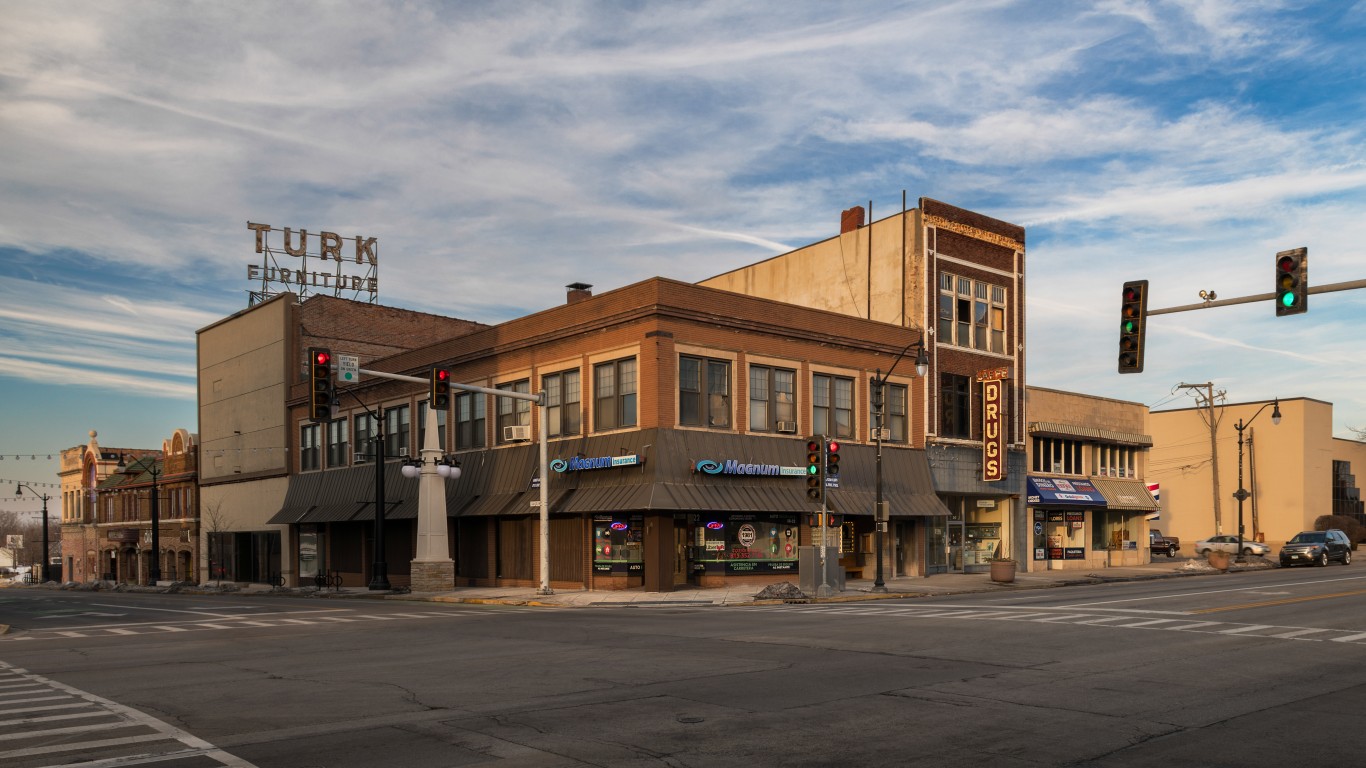
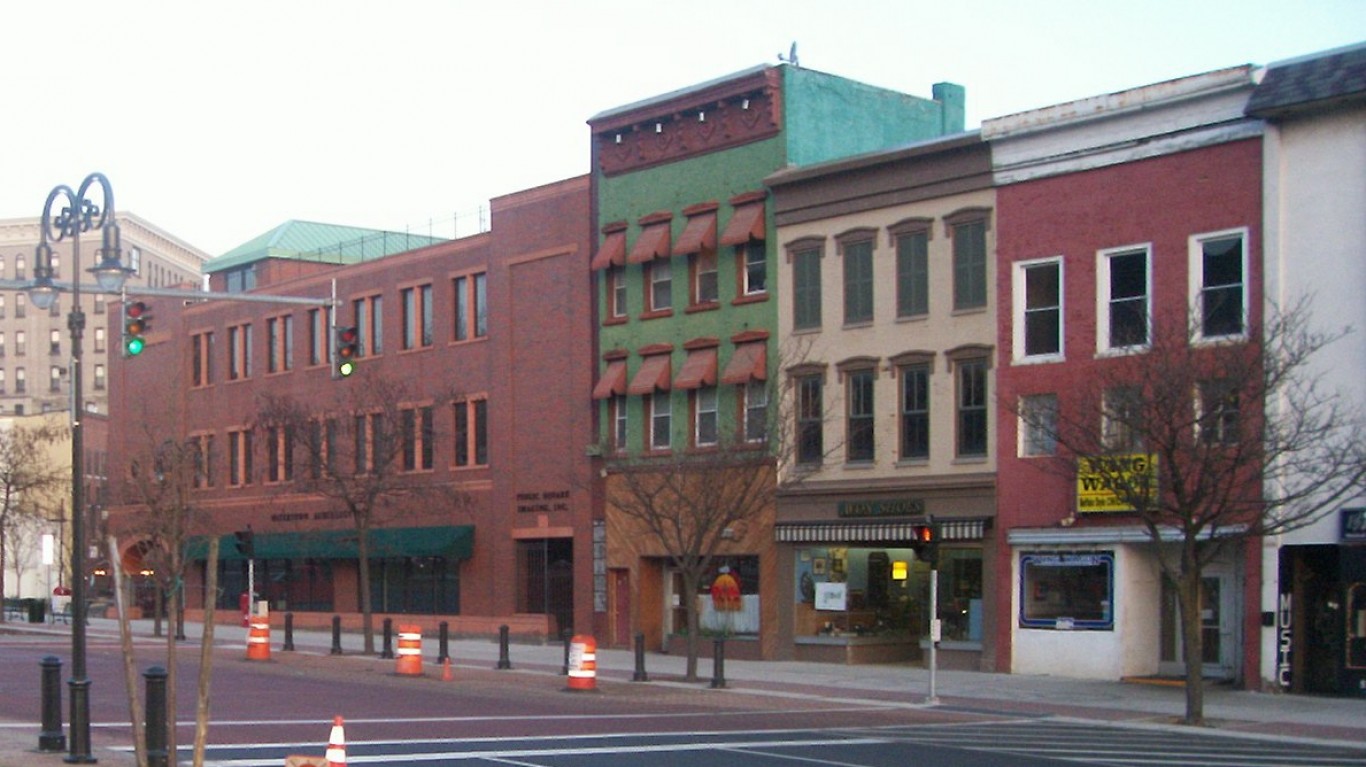
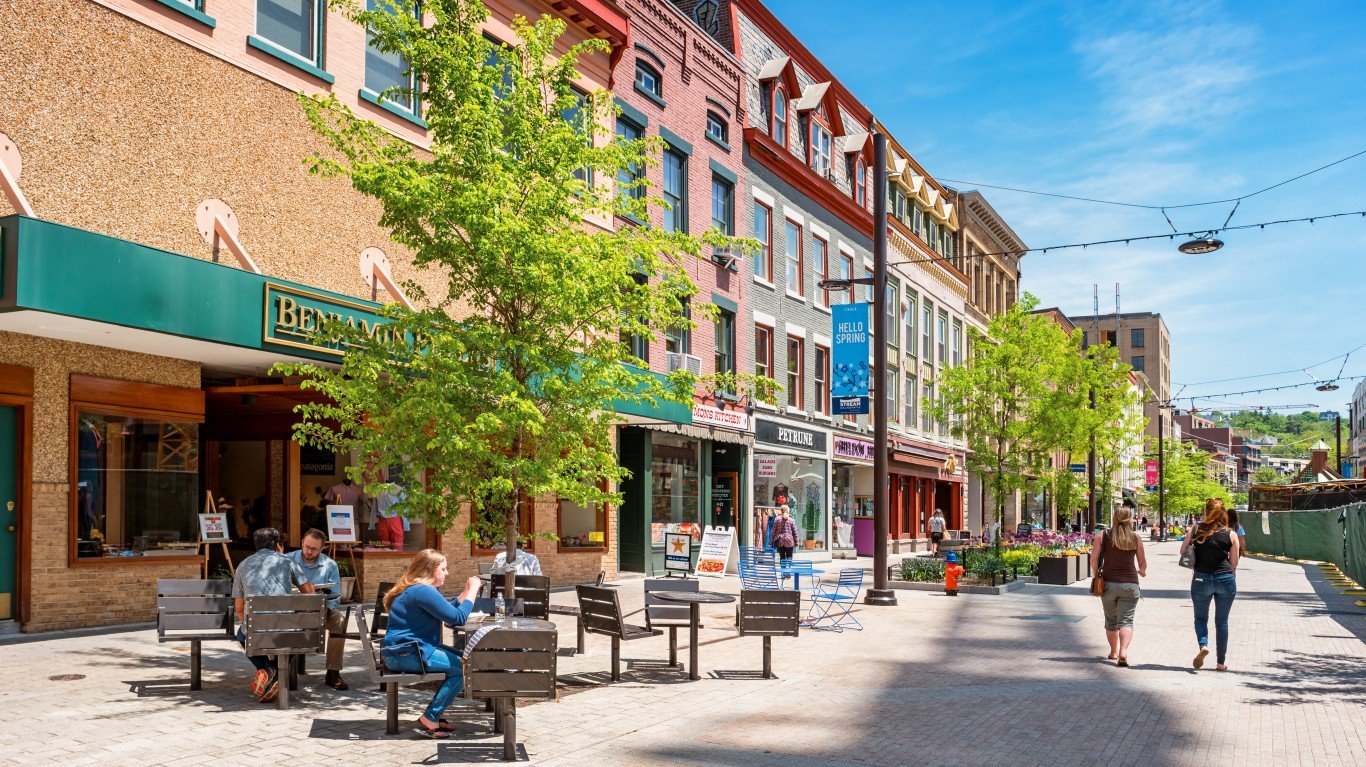
1. Utica-Rome, NY
> Change in vehicle thefts, 2019-2021: +161.5% (+218 incidents)
> Total vehicle thefts: 353 in 2021; 135 in 2019
> Vehicle theft rate in 2021: 121.6 per 100,000 people (#285 of 384 U.S. metro areas)
> Vehicle theft rate in 2019: 46.6 per 100,000 people (#365 of 384 U.S. metro areas)
Contact [email protected] for any questions or corrections.