
Motor vehicle theft is a growing problem in the United States. According to the National Insurance Crime Bureau, or NICB, an anti-crime and insurance fraud nonprofit organization, 932,329 vehicles were reported stolen to law enforcement in 2021 – up 6% from the previous year and up 17% from 2019.
The trend is likely due to several factors. First, during the COVID-19 pandemic, vehicles were more likely to be left sitting unattended and unused for longer than usual. Additionally, newer vehicles that use keyless entry and push-button ignitions can be more susceptible to theft, as criminals can use a tool to amplify a key fob’s signal. This can allow thieves to unlock and start a vehicle without having the key fob on their person. (Here is a look at the least reliable cars in America.)
While motorists nationwide now face a greater risk of vehicle theft than they have in many years, in some parts of the country, car owners are far more likely to be victims of car theft than in others.
Using 2021 data from the NICB, 24/7 Wall St. identified the city in each state with the highest motor vehicle theft rate. Within each state, we ranked metropolitan areas on the number of reported car thefts for every 100,000 people in 2021.
In nearly every metro area on this list, the auto theft rate exceeds the statewide rate. It is important to note, however, that car theft rates vary considerably from one state to the next. Colorado, for example, leads the nation with about 661 reported car thefts for every 100,000 people. Meanwhile, in states like Maine and New Hampshire, car theft rates are less than one-tenth the rate of Colorado’s, at about 61 and 62 thefts per 100,000 people, respectively.
Partly because motor vehicle theft is less common in some parts of the country than others, a city’s ranking on this list does not necessarily mean car theft is a major problem relative to the national average. In 15 metro areas on this list, the auto theft rate is below the national rate of about 281 car thefts per 100,000 people. (Here is a look at the worst cities to drive in every state.)
Click here to see the cities in every state with the most car theft.
Click here to read our detailed methodology.

Alabama: Birmingham-Hoover
> Motor-vehicle thefts in metro area, 2021: 292.2 per 100,000 people (3,256 total)
> Motor-vehicle thefts in state, 2021: 225.9 per 100,000 people (11,384 total)
> Motor-vehicle theft rate national rank: Num. 104 of 384 U.S. metro areas
> Metro area population: 1,114,262
> Metro areas considered in the state: 12
[in-text-ad]

Alaska: Anchorage
> Motor-vehicle thefts in metro area, 2021: 330.7 per 100,000 people (1,319 total)
> Motor-vehicle thefts in state, 2021: 239.7 per 100,000 people (1,756 total)
> Motor-vehicle theft rate national rank: Num. 79 of 384 U.S. metro areas
> Metro area population: 398,807
> Metro areas considered in the state: 2

Arizona: Tucson
> Motor-vehicle thefts in metro area, 2021: 313.7 per 100,000 people (3,300 total)
> Motor-vehicle thefts in state, 2021: 283.6 per 100,000 people (20,637 total)
> Motor-vehicle theft rate national rank: Num. 88 of 384 U.S. metro areas
> Metro area population: 1,052,030
> Metro areas considered in the state: 7

Arkansas: Pine Bluff
> Motor-vehicle thefts in metro area, 2021: 444.4 per 100,000 people (384 total)
> Motor-vehicle thefts in state, 2021: 301.0 per 100,000 people (9,108 total)
> Motor-vehicle theft rate national rank: Num. 33 of 384 U.S. metro areas
> Metro area population: 86,747
> Metro areas considered in the state: 6
[in-text-ad-2]

California: Bakersfield
> Motor-vehicle thefts in metro area, 2021: 1023.7 per 100,000 people (9,394 total)
> Motor-vehicle thefts in state, 2021: 511.1 per 100,000 people (200,524 total)
> Motor-vehicle theft rate national rank: Num. 1 of 384 U.S. metro areas
> Metro area population: 917,673
> Metro areas considered in the state: 26

Colorado: Denver-Aurora-Lakewood
> Motor-vehicle thefts in metro area, 2021: 964.9 per 100,000 people (28,683 total)
> Motor-vehicle thefts in state, 2021: 661.2 per 100,000 people (38,430 total)
> Motor-vehicle theft rate national rank: Num. 2 of 384 U.S. metro areas
> Metro area population: 2,972,567
> Metro areas considered in the state: 7
[in-text-ad]

Connecticut: New Haven-Milford
> Motor-vehicle thefts in metro area, 2021: 311.8 per 100,000 people (2,693 total)
> Motor-vehicle thefts in state, 2021: 215.5 per 100,000 people (7,771 total)
> Motor-vehicle theft rate national rank: Num. 90 of 384 U.S. metro areas
> Metro area population: 863,700
> Metro areas considered in the state: 4

Delaware: Dover
> Motor-vehicle thefts in metro area, 2021: 141.7 per 100,000 people (261 total)
> Motor-vehicle thefts in state, 2021: 186.6 per 100,000 people (1,872 total)
> Motor-vehicle theft rate national rank: Num. 263 of 384 U.S. metro areas
> Metro area population: 184,149
> Metro areas considered in the state: 1
Because Dover is the only metro area with available data in Delaware, it ranks as having the highest motor-vehicle theft rate by default only.

Florida: Miami-Fort Lauderdale-Pompano Beach
> Motor-vehicle thefts in metro area, 2021: 278.8 per 100,000 people (16,984 total)
> Motor-vehicle thefts in state, 2021: 196.5 per 100,000 people (42,808 total)
> Motor-vehicle theft rate national rank: Num. 115 of 384 U.S. metro areas
> Metro area population: 6,091,747
> Metro areas considered in the state: 22
[in-text-ad-2]

Georgia: Columbus
> Motor-vehicle thefts in metro area, 2021: 400.0 per 100,000 people (1,310 total)
> Motor-vehicle thefts in state, 2021: 240.9 per 100,000 people (26,017 total)
> Motor-vehicle theft rate national rank: Num. 50 of 384 U.S. metro areas
> Metro area population: 326,491
> Metro areas considered in the state: 14

Hawaii: Honolulu (Urban)
> Motor-vehicle thefts in metro area, 2021: 330.8 per 100,000 people (3,311 total)
> Motor-vehicle thefts in state, 2021: 229.8 per 100,000 people (3,313 total)
> Motor-vehicle theft rate national rank: Num. 78 of 384 U.S. metro areas
> Metro area population: 1,000,890
> Metro areas considered in the state: 2
[in-text-ad]
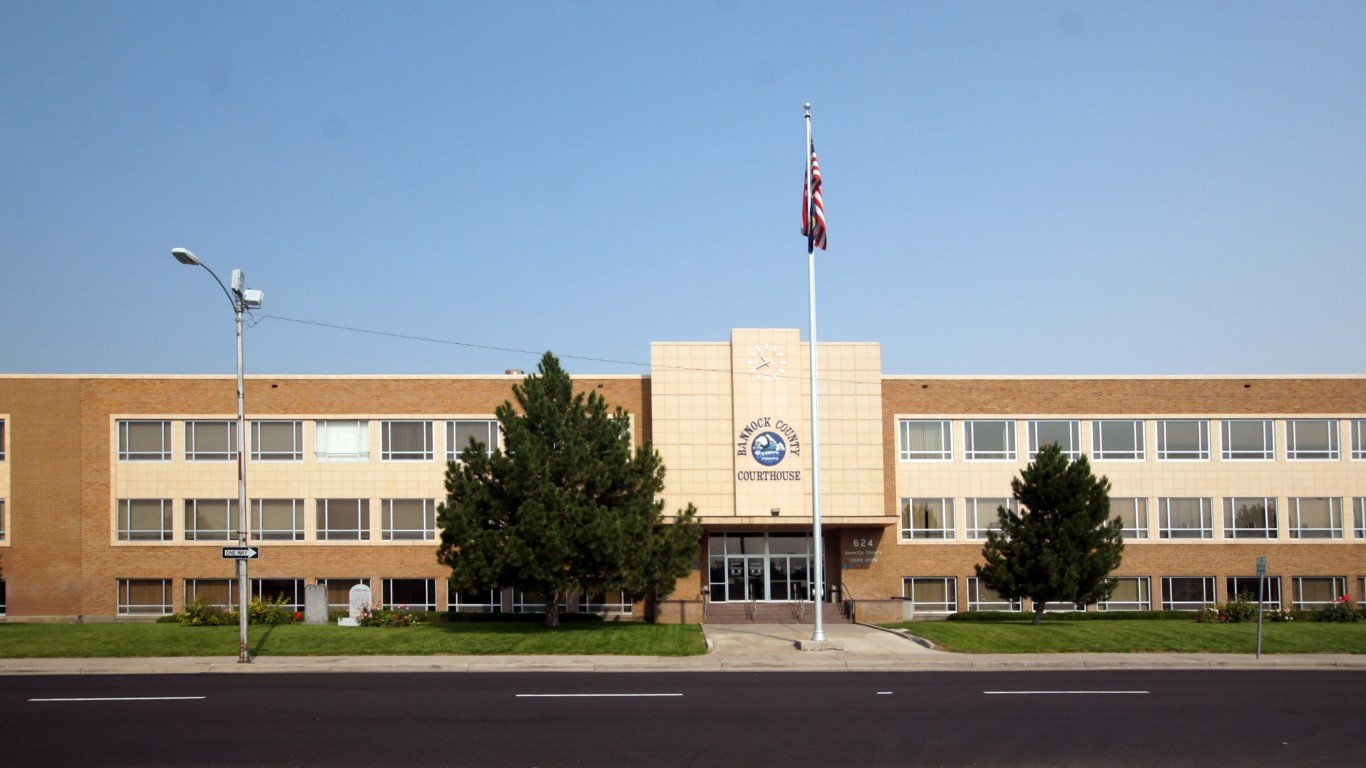
Idaho: Pocatello
> Motor-vehicle thefts in metro area, 2021: 229.7 per 100,000 people (221 total)
> Motor-vehicle thefts in state, 2021: 96.7 per 100,000 people (1,839 total)
> Motor-vehicle theft rate national rank: Num. 162 of 384 U.S. metro areas
> Metro area population: 97,645
> Metro areas considered in the state: 6

Illinois: Springfield
> Motor-vehicle thefts in metro area, 2021: 282.3 per 100,000 people (584 total)
> Motor-vehicle thefts in state, 2021: 225.4 per 100,000 people (28,559 total)
> Motor-vehicle theft rate national rank: Num. 112 of 384 U.S. metro areas
> Metro area population: 207,245
> Metro areas considered in the state: 10

Indiana: Indianapolis-Carmel-Anderson
> Motor-vehicle thefts in metro area, 2021: 360.2 per 100,000 people (7,660 total)
> Motor-vehicle thefts in state, 2021: 236.3 per 100,000 people (16,081 total)
> Motor-vehicle theft rate national rank: Num. 67 of 384 U.S. metro areas
> Metro area population: 2,129,479
> Metro areas considered in the state: 12
[in-text-ad-2]

Iowa: Davenport-Moline-Rock Island
> Motor-vehicle thefts in metro area, 2021: 319.2 per 100,000 people (1,218 total)
> Motor-vehicle thefts in state, 2021: 185.2 per 100,000 people (5,913 total)
> Motor-vehicle theft rate national rank: Num. 85 of 384 U.S. metro areas
> Metro area population: 381,447
> Metro areas considered in the state: 8

Kansas: Wichita
> Motor-vehicle thefts in metro area, 2021: 479.1 per 100,000 people (3,104 total)
> Motor-vehicle thefts in state, 2021: 311.8 per 100,000 people (9,151 total)
> Motor-vehicle theft rate national rank: Num. 26 of 384 U.S. metro areas
> Metro area population: 647,919
> Metro areas considered in the state: 4
[in-text-ad]
Kentucky: Louisville/Jefferson County
> Motor-vehicle thefts in metro area, 2021: 456.9 per 100,000 people (5,869 total)
> Motor-vehicle thefts in state, 2021: 237.4 per 100,000 people (10,707 total)
> Motor-vehicle theft rate national rank: Num. 30 of 384 U.S. metro areas
> Metro area population: 1,284,826
> Metro areas considered in the state: 5

Louisiana: New Orleans-Metairie
> Motor-vehicle thefts in metro area, 2021: 404.7 per 100,000 people (5,106 total)
> Motor-vehicle thefts in state, 2021: 281.4 per 100,000 people (13,010 total)
> Motor-vehicle theft rate national rank: Num. 48 of 384 U.S. metro areas
> Metro area population: 1,261,726
> Metro areas considered in the state: 9

Maine: Bangor
> Motor-vehicle thefts in metro area, 2021: 95.6 per 100,000 people (146 total)
> Motor-vehicle thefts in state, 2021: 60.7 per 100,000 people (833 total)
> Motor-vehicle theft rate national rank: Num. 321 of 384 U.S. metro areas
> Metro area population: 152,765
> Metro areas considered in the state: 3
[in-text-ad-2]
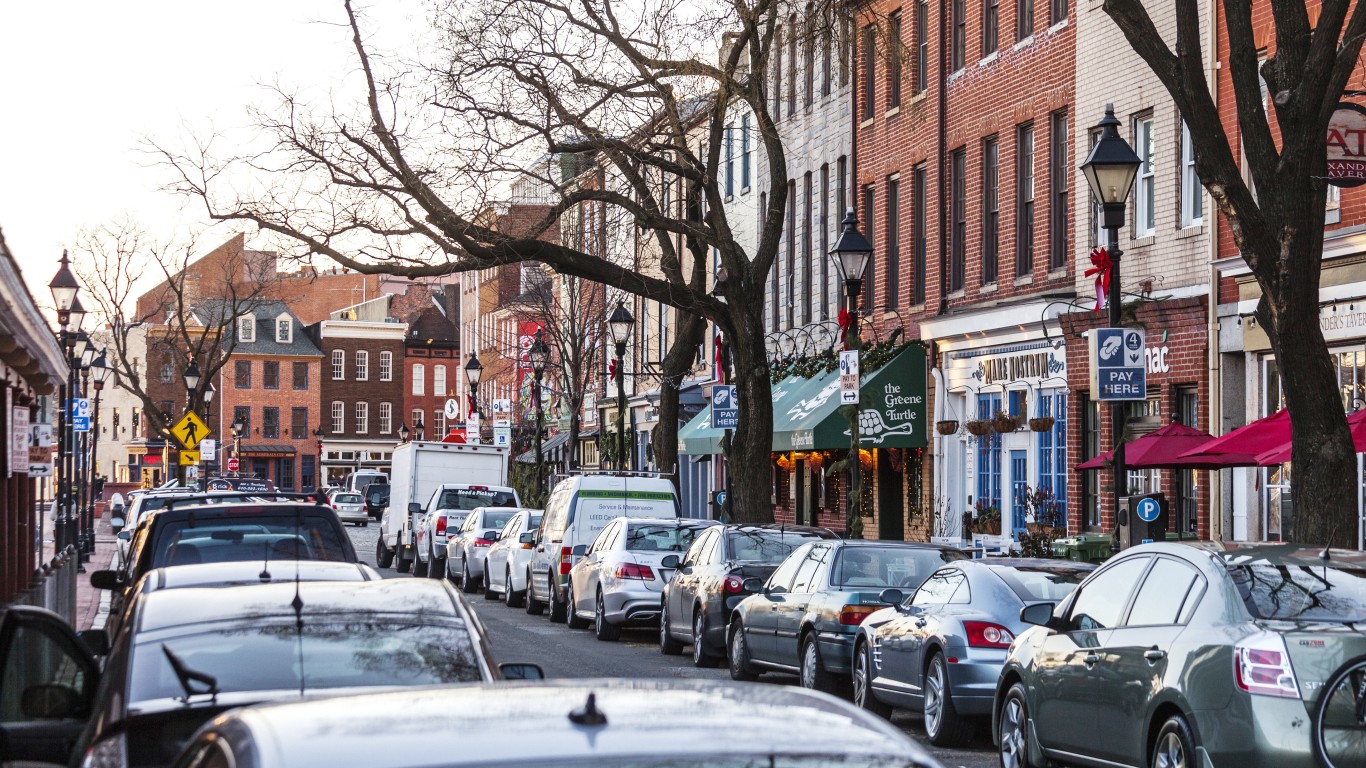
Maryland: Baltimore-Columbia-Towson
> Motor-vehicle thefts in metro area, 2021: 238.2 per 100,000 people (6,760 total)
> Motor-vehicle thefts in state, 2021: 223.1 per 100,000 people (13,756 total)
> Motor-vehicle theft rate national rank: Num. 156 of 384 U.S. metro areas
> Metro area population: 2,838,327
> Metro areas considered in the state: 5

Massachusetts: Springfield
> Motor-vehicle thefts in metro area, 2021: 145.1 per 100,000 people (1,009 total)
> Motor-vehicle thefts in state, 2021: 100.1 per 100,000 people (6,989 total)
> Motor-vehicle theft rate national rank: Num. 256 of 384 U.S. metro areas
> Metro area population: 695,305
> Metro areas considered in the state: 5
[in-text-ad]

Michigan: Kalamazoo-Portage
> Motor-vehicle thefts in metro area, 2021: 485.2 per 100,000 people (1,267 total)
> Motor-vehicle thefts in state, 2021: 211.8 per 100,000 people (21,283 total)
> Motor-vehicle theft rate national rank: Num. 23 of 384 U.S. metro areas
> Metro area population: 261,108
> Metro areas considered in the state: 14
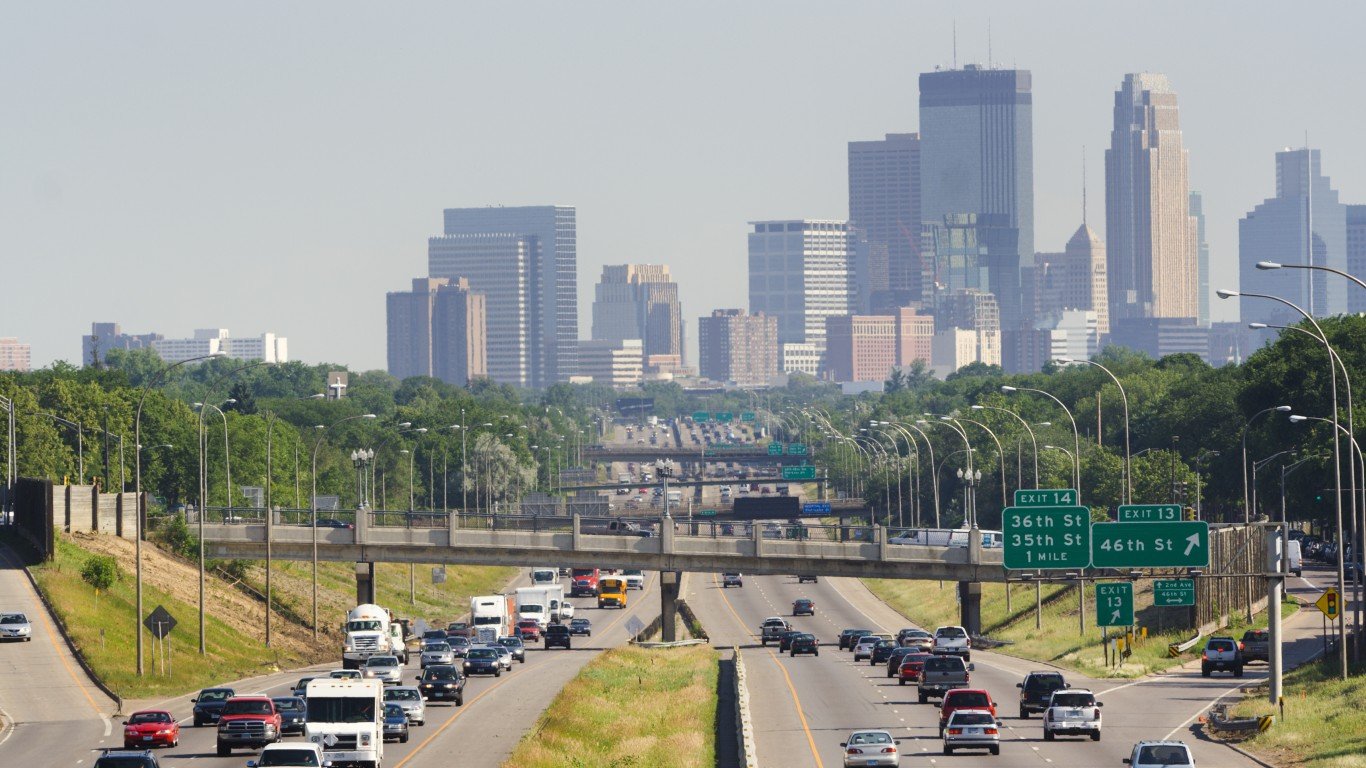
Minnesota: Minneapolis-St. Paul-Bloomington
> Motor-vehicle thefts in metro area, 2021: 380.4 per 100,000 people (14,039 total)
> Motor-vehicle thefts in state, 2021: 297.3 per 100,000 people (16,968 total)
> Motor-vehicle theft rate national rank: Num. 60 of 384 U.S. metro areas
> Metro area population: 3,690,512
> Metro areas considered in the state: 5

Mississippi: Jackson
> Motor-vehicle thefts in metro area, 2021: 295.1 per 100,000 people (1,733 total)
> Motor-vehicle thefts in state, 2021: 216.8 per 100,000 people (6,396 total)
> Motor-vehicle theft rate national rank: Num. 101 of 384 U.S. metro areas
> Metro area population: 586,758
> Metro areas considered in the state: 3
[in-text-ad-2]

Missouri: Kansas City
> Motor-vehicle thefts in metro area, 2021: 529.8 per 100,000 people (11,653 total)
> Motor-vehicle thefts in state, 2021: 428.1 per 100,000 people (26,408 total)
> Motor-vehicle theft rate national rank: Num. 14 of 384 U.S. metro areas
> Metro area population: 2,199,544
> Metro areas considered in the state: 8

Montana: Billings
> Motor-vehicle thefts in metro area, 2021: 611.1 per 100,000 people (1,143 total)
> Motor-vehicle thefts in state, 2021: 264.3 per 100,000 people (2,919 total)
> Motor-vehicle theft rate national rank: Num. 7 of 384 U.S. metro areas
> Metro area population: 187,037
> Metro areas considered in the state: 3
[in-text-ad]

Nebraska: Omaha-Council Bluffs
> Motor-vehicle thefts in metro area, 2021: 393.6 per 100,000 people (3,824 total)
> Motor-vehicle thefts in state, 2021: 237.2 per 100,000 people (4,657 total)
> Motor-vehicle theft rate national rank: Num. 56 of 384 U.S. metro areas
> Metro area population: 972,195
> Metro areas considered in the state: 3

Nevada: Las Vegas-Henderson-Paradise
> Motor-vehicle thefts in metro area, 2021: 475.7 per 100,000 people (10,906 total)
> Motor-vehicle thefts in state, 2021: 426.8 per 100,000 people (13,417 total)
> Motor-vehicle theft rate national rank: Num. 27 of 384 U.S. metro areas
> Metro area population: 2,292,476
> Metro areas considered in the state: 3

New Hampshire: Manchester-Nashua
> Motor-vehicle thefts in metro area, 2021: 82.3 per 100,000 people (349 total)
> Motor-vehicle thefts in state, 2021: 61.8 per 100,000 people (858 total)
> Motor-vehicle theft rate national rank: Num. 339 of 384 U.S. metro areas
> Metro area population: 424,079
> Metro areas considered in the state: 1
Because Manchester-Nashua is the only metro area with available data in New Hampshire, it ranks as having the highest motor-vehicle theft rate by default only.
[in-text-ad-2]

New Jersey: Trenton-Princeton
> Motor-vehicle thefts in metro area, 2021: 178.5 per 100,000 people (689 total)
> Motor-vehicle thefts in state, 2021: 159.9 per 100,000 people (14,818 total)
> Motor-vehicle theft rate national rank: Num. 227 of 384 U.S. metro areas
> Metro area population: 385,898
> Metro areas considered in the state: 4

New Mexico: Albuquerque
> Motor-vehicle thefts in metro area, 2021: 710.6 per 100,000 people (6,525 total)
> Motor-vehicle thefts in state, 2021: 475.5 per 100,000 people (10,061 total)
> Motor-vehicle theft rate national rank: Num. 4 of 384 U.S. metro areas
> Metro area population: 921,311
> Metro areas considered in the state: 4
[in-text-ad]

New York: Buffalo-Cheektowaga
> Motor-vehicle thefts in metro area, 2021: 220.1 per 100,000 people (2,558 total)
> Motor-vehicle thefts in state, 2021: 115.5 per 100,000 people (22,913 total)
> Motor-vehicle theft rate national rank: Num. 175 of 384 U.S. metro areas
> Metro area population: 1,162,336
> Metro areas considered in the state: 13

North Carolina: Greensboro-High Point
> Motor-vehicle thefts in metro area, 2021: 268.6 per 100,000 people (2,092 total)
> Motor-vehicle thefts in state, 2021: 213.1 per 100,000 people (22,487 total)
> Motor-vehicle theft rate national rank: Num. 119 of 384 U.S. metro areas
> Metro area population: 778,848
> Metro areas considered in the state: 15

North Dakota: Fargo
> Motor-vehicle thefts in metro area, 2021: 315.7 per 100,000 people (796 total)
> Motor-vehicle thefts in state, 2021: 223.9 per 100,000 people (1,735 total)
> Motor-vehicle theft rate national rank: Num. 87 of 384 U.S. metro areas
> Metro area population: 252,136
> Metro areas considered in the state: 3
[in-text-ad-2]

Ohio: Columbus
> Motor-vehicle thefts in metro area, 2021: 368.3 per 100,000 people (7,922 total)
> Motor-vehicle thefts in state, 2021: 236.2 per 100,000 people (27,824 total)
> Motor-vehicle theft rate national rank: Num. 65 of 384 U.S. metro areas
> Metro area population: 2,151,017
> Metro areas considered in the state: 11

Oklahoma: Tulsa
> Motor-vehicle thefts in metro area, 2021: 522.6 per 100,000 people (5,351 total)
> Motor-vehicle thefts in state, 2021: 359.3 per 100,000 people (14,325 total)
> Motor-vehicle theft rate national rank: Num. 15 of 384 U.S. metro areas
> Metro area population: 1,024,191
> Metro areas considered in the state: 4
[in-text-ad]

Oregon: Portland-Vancouver-Hillsboro
> Motor-vehicle thefts in metro area, 2021: 680.2 per 100,000 people (17,084 total)
> Motor-vehicle thefts in state, 2021: 471.2 per 100,000 people (20,006 total)
> Motor-vehicle theft rate national rank: Num. 5 of 384 U.S. metro areas
> Metro area population: 2,510,696
> Metro areas considered in the state: 8

Pennsylvania: Philadelphia-Camden-Wilmington
> Motor-vehicle thefts in metro area, 2021: 247.5 per 100,000 people (15,414 total)
> Motor-vehicle thefts in state, 2021: 139.2 per 100,000 people (18,044 total)
> Motor-vehicle theft rate national rank: Num. 143 of 384 U.S. metro areas
> Metro area population: 6,228,601
> Metro areas considered in the state: 18

Rhode Island: Providence-Warwick
> Motor-vehicle thefts in metro area, 2021: 135.1 per 100,000 people (2,264 total)
> Motor-vehicle thefts in state, 2021: 156.3 per 100,000 people (1,712 total)
> Motor-vehicle theft rate national rank: Num. 269 of 384 U.S. metro areas
> Metro area population: 1,675,774
> Metro areas considered in the state: 1
Because Providence-Warwick is the only metro area with available data in Rhode Island, it ranks as having the highest motor-vehicle theft rate by default only.
[in-text-ad-2]

South Carolina: Florence
> Motor-vehicle thefts in metro area, 2021: 398.0 per 100,000 people (793 total)
> Motor-vehicle thefts in state, 2021: 312.3 per 100,000 people (16,209 total)
> Motor-vehicle theft rate national rank: Num. 52 of 384 U.S. metro areas
> Metro area population: 199,259
> Metro areas considered in the state: 8

South Dakota: Sioux Falls
> Motor-vehicle thefts in metro area, 2021: 428.1 per 100,000 people (1,207 total)
> Motor-vehicle thefts in state, 2021: 263.9 per 100,000 people (2,363 total)
> Motor-vehicle theft rate national rank: Num. 36 of 384 U.S. metro areas
> Metro area population: 282,557
> Metro areas considered in the state: 2
[in-text-ad]

Tennessee: Memphis
> Motor-vehicle thefts in metro area, 2021: 512.3 per 100,000 people (6,845 total)
> Motor-vehicle thefts in state, 2021: 297.1 per 100,000 people (20,722 total)
> Motor-vehicle theft rate national rank: Num. 18 of 384 U.S. metro areas
> Metro area population: 1,336,438
> Metro areas considered in the state: 10

Texas: Odessa
> Motor-vehicle thefts in metro area, 2021: 483.0 per 100,000 people (778 total)
> Motor-vehicle thefts in state, 2021: 320.0 per 100,000 people (94,500 total)
> Motor-vehicle theft rate national rank: Num. 24 of 384 U.S. metro areas
> Metro area population: 161,091
> Metro areas considered in the state: 25

Utah: Salt Lake City
> Motor-vehicle thefts in metro area, 2021: 468.9 per 100,000 people (5,922 total)
> Motor-vehicle thefts in state, 2021: 255.8 per 100,000 people (8,538 total)
> Motor-vehicle theft rate national rank: Num. 28 of 384 U.S. metro areas
> Metro area population: 1,263,061
> Metro areas considered in the state: 5
[in-text-ad-2]

Vermont: Burlington-South Burlington
> Motor-vehicle thefts in metro area, 2021: 131.1 per 100,000 people (297 total)
> Motor-vehicle thefts in state, 2021: 96.2 per 100,000 people (621 total)
> Motor-vehicle theft rate national rank: Num. 274 of 384 U.S. metro areas
> Metro area population: 226,715
> Metro areas considered in the state: 1
Because Burlington-South Burlington is the only metro area with available data in Vermont, it ranks as having the highest motor-vehicle theft rate by default only.

Virginia: Virginia Beach-Norfolk-Newport News
> Motor-vehicle thefts in metro area, 2021: 217.9 per 100,000 people (3,930 total)
> Motor-vehicle thefts in state, 2021: 142.6 per 100,000 people (12,320 total)
> Motor-vehicle theft rate national rank: Num. 178 of 384 U.S. metro areas
> Metro area population: 1,806,423
> Metro areas considered in the state: 9
[in-text-ad]

Washington: Seattle-Tacoma-Bellevue
> Motor-vehicle thefts in metro area, 2021: 582.5 per 100,000 people (23,366 total)
> Motor-vehicle thefts in state, 2021: 461.9 per 100,000 people (35,746 total)
> Motor-vehicle theft rate national rank: Num. 9 of 384 U.S. metro areas
> Metro area population: 4,011,553
> Metro areas considered in the state: 11

West Virginia: Charleston
> Motor-vehicle thefts in metro area, 2021: 234.1 per 100,000 people (597 total)
> Motor-vehicle thefts in state, 2021: 128.8 per 100,000 people (2,297 total)
> Motor-vehicle theft rate national rank: Num. 159 of 384 U.S. metro areas
> Metro area population: 252,942
> Metro areas considered in the state: 7

Wisconsin: Milwaukee-Waukesha
> Motor-vehicle thefts in metro area, 2021: 597.8 per 100,000 people (9,365 total)
> Motor-vehicle thefts in state, 2021: 236.7 per 100,000 people (13,957 total)
> Motor-vehicle theft rate national rank: Num. 8 of 384 U.S. metro areas
> Metro area population: 1,566,487
> Metro areas considered in the state: 12
[in-text-ad-2]

Wyoming: Cheyenne
> Motor-vehicle thefts in metro area, 2021: 407.5 per 100,000 people (411 total)
> Motor-vehicle thefts in state, 2021: 161.9 per 100,000 people (937 total)
> Motor-vehicle theft rate national rank: Num. 45 of 384 U.S. metro areas
> Metro area population: 100,863
> Metro areas considered in the state: 2
Methodology
To identify the metro area in each state with the most car thefts, 24/7 Wall St. reviewed data from National Insurance Crime Bureau’s 2021 Hot Spots Vehicle Theft Report. Within each state, metro areas are ranked on the number of motor vehicle thefts reported to local law enforcement in 2021 per 100,000 people.
Four states – Delaware, New Hampshire, Rhode Island, and Vermont – have only one metro area. As a result, the metro area listed in each of those states ranks as the worst by default only.
Metro area population data are from the U.S. Census Bureau’s 2021 American Community Survey. The population noted may not always match the population figures used by the NICB to calculate the motor vehicle theft rate.
Smart Investors Are Quietly Loading Up on These “Dividend Legends” (Sponsored)
If you want your portfolio to pay you cash like clockwork, it’s time to stop blindly following conventional wisdom like relying on Dividend Aristocrats. There’s a better option, and we want to show you. We’re offering a brand-new report on 2 stocks we believe offer the rare combination of a high dividend yield and significant stock appreciation upside. If you’re tired of feeling one step behind in this market, this free report is a must-read for you.
Click here to download your FREE copy of “2 Dividend Legends to Hold Forever” and start improving your portfolio today.
Thank you for reading! Have some feedback for us?
Contact the 24/7 Wall St. editorial team.
 24/7 Wall St.
 24/7 Wall St.
 24/7 Wall St.
 24/7 Wall St.