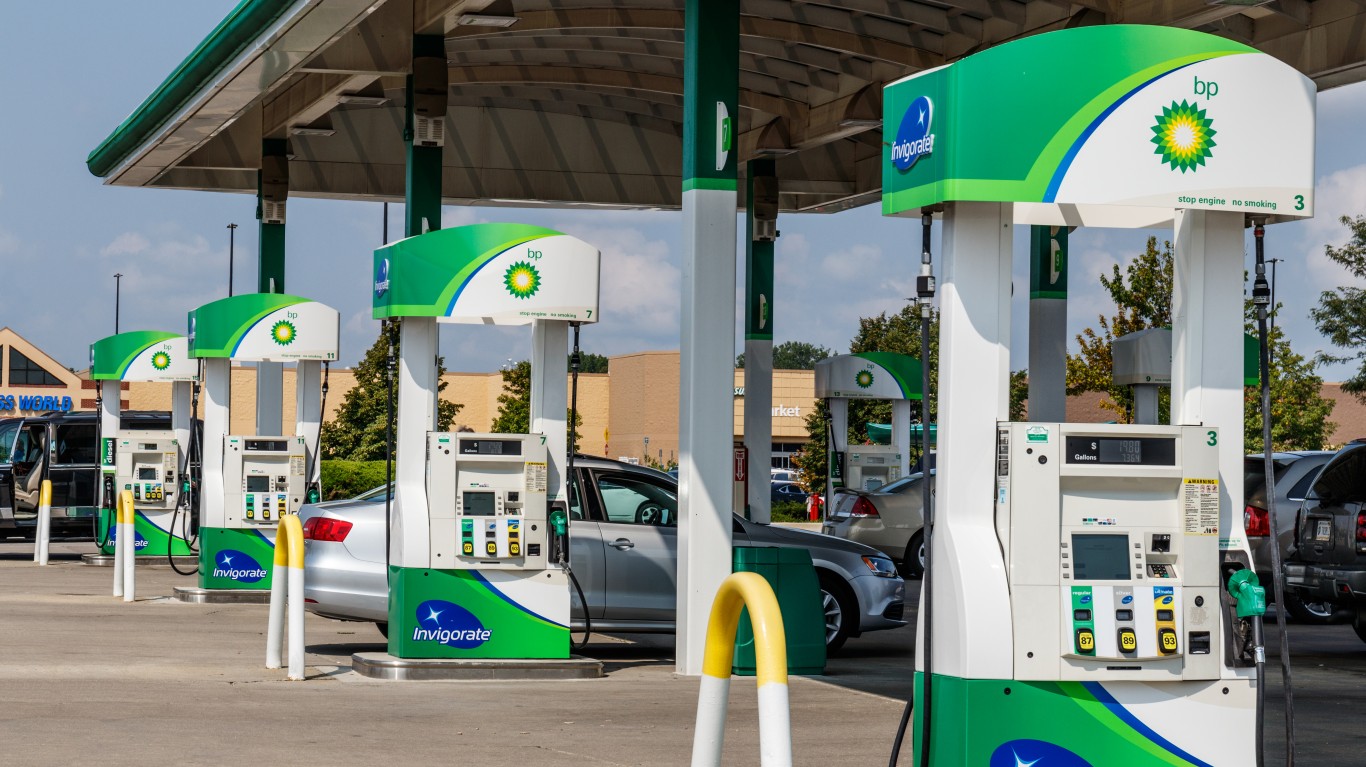
Americans drive an average of 13,476 miles per year, according to the Federal Highway Administration. That is the equivalent of traveling coast to coast twice in one year. Motorists in some states tend to drive more frequently than others – and the more mileage they drive, generally the more gas – or other motor fuel – they use.
To determine the states where drivers use the most gas each year, 24/7 Wall St. reviewed data on annual motor fuel consumption and the number of licensed drivers from the FHWA for 2021, the most recent available year. With these data we calculated the total gas a licensed driver uses on average in each state. Supplemental data on the average price of regular gas by state came from AAA and is current as of Apr. 18, 2023. We also calculated the number of miles driven per licensed driver in 2021 using FHWA data on the total number of miles driven in 2021, and the average fuel cost of driving in each state at current gas prices in each state.
The variations in fuel usage can be dramatically different between states. Motor fuel consumption per licensed driver in Wyoming is 1,712.1 gallons per driver, the most of any state and about three times the total for a driver in Hawaii. Besides Hawaii, drivers in three other states – New York, Rhode Island, and Washington – used less than 600 gallons per driver.
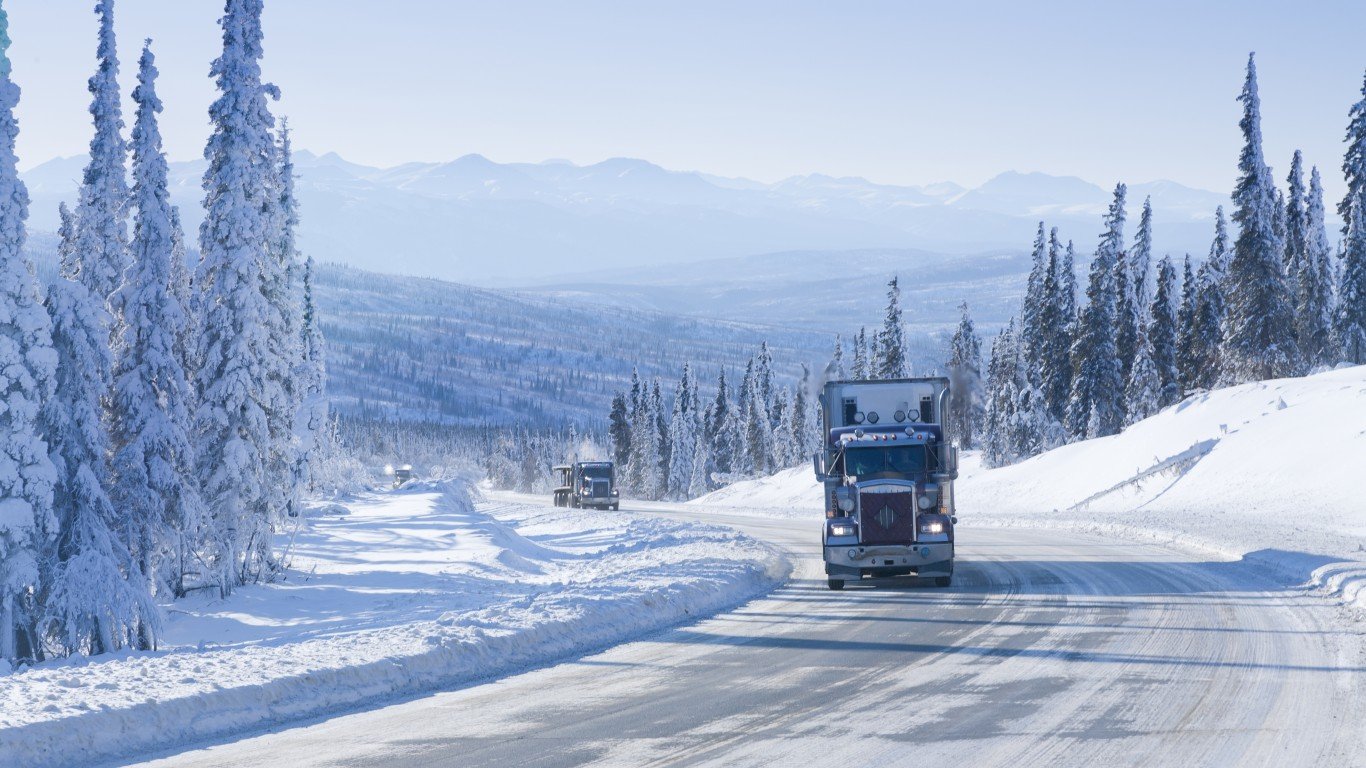
The amount of driving by an average motorist in the United States often correlates with the presence or lack of mass transportation available. The great distances in the West and the South are traversed almost exclusively by car, so it is no surprise that fuel consumption in those regions is the highest in the nation. Wyoming, the country’s least populous state, has the highest estimated annual cost of driving at current gas prices, $5,872.61, and drivers in the Equality State traveled the most in 2021, 25,778 miles. (The price of gas in each state also depends on taxes – here is every state’s tax on gasoline, ranked.)
Northeastern states are among the lowest in terms of motor fuel consumption per licensed driver, 2021 gas consumed, estimated annual cost of driving at current gas prices, average gas prices, and 2021 miles driven per licensed driver. These states tend to have more mass transportation options that take drivers off the road. According to a Census Bureau report from 2021, the Northeast has the highest share of workers who commute by transit, at 14.3%.
Even as climate change has encouraged better fuel efficiency and less fossil fuel consumption to reduce greenhouse gasses, cars are only becoming more important in the nation’s transportation fabric. The percentage of U.S. workers commuting by public transportation fell to around 5.0% in 2019 from 12.1% in 1960, according to Census data. (Here are the worst new cars for humans and the environment.)
Click here to see states where drivers use the most gas each year.

50. Hawaii
> 2021 motor fuel consumption per licensed driver: 511.8 gal/driver
> 2021 gas consumed: 469.6 million gal. — 4th fewest
> 2021 licensed drivers: 917,464 — 9th fewest
> Avg. gas price as of Apr 11, 2023: $4.79 per gal. — 2nd highest
> Est. annual cost of driving at current gas prices: $2,450.68 — 8th lowest
> 2021 miles driven per licensed driver: 10,869 — 4th fewest (82.6% urban, 17.4% rural)
> 2022 population: 1.4 million — 11th smallest
[in-text-ad]
49. New York
> 2021 motor fuel consumption per licensed driver: 573.4 gal/driver
> 2021 gas consumed: 6.8 billion gal. — 4th most
> 2021 licensed drivers: 11.9 million — 4th most
> Avg. gas price as of Apr 11, 2023: $3.63 per gal. — 14th highest
> Est. annual cost of driving at current gas prices: $2,080.46 — 3rd lowest
> 2021 miles driven per licensed driver: 8,996 — the fewest (78.2% urban, 21.8% rural)
> 2022 population: 19.7 million — 4th largest
[recirclink id=1224594]
48. Rhode Island
> 2021 motor fuel consumption per licensed driver: 575.3 gal/driver
> 2021 gas consumed: 434. million gal. — 3rd fewest
> 2021 licensed drivers: 754,507 — 6th fewest
> Avg. gas price as of Apr 11, 2023: $3.42 per gal. — 14th lowest
> Est. annual cost of driving at current gas prices: $1,968.53 — the lowest
> 2021 miles driven per licensed driver: 9,975 — 3rd fewest (86.6% urban, 13.4% rural)
> 2022 population: 1.1 million — 7th smallest
47. Washington
> 2021 motor fuel consumption per licensed driver: 575.9 gal/driver
> 2021 gas consumed: 3.4 billion gal. — 20th most
> 2021 licensed drivers: 5.9 million — 13th most
> Avg. gas price as of Apr 11, 2023: $4.52 per gal. — 4th highest
> Est. annual cost of driving at current gas prices: $2,605.55 — 14th lowest
> 2021 miles driven per licensed driver: 9,849 — 2nd fewest (70.5% urban, 29.5% rural)
> 2022 population: 7.8 million — 13th largest
[in-text-ad-2]

46. Massachusetts
> 2021 motor fuel consumption per licensed driver: 607.9 gal/driver
> 2021 gas consumed: 3.0 billion gal. — 25th fewest
> 2021 licensed drivers: 4.9 million — 16th most
> Avg. gas price as of Apr 11, 2023: $3.40 per gal. — 13th lowest
> Est. annual cost of driving at current gas prices: $2,068.74 — 2nd lowest
> 2021 miles driven per licensed driver: 12,064 — 13th fewest (95.1% urban, 4.9% rural)
> 2022 population: 7.0 million — 16th largest
45. California
> 2021 motor fuel consumption per licensed driver: 634.1 gal/driver
> 2021 gas consumed: 17.2 billion gal. — 2nd most
> 2021 licensed drivers: 27.1 million — the most
> Avg. gas price as of Apr 11, 2023: $4.92 per gal. — the highest
> Est. annual cost of driving at current gas prices: $3,116.84 — 22nd highest
> 2021 miles driven per licensed driver: 11,464 — 10th fewest (81.2% urban, 18.8% rural)
> 2022 population: 39.0 million — the largest
[in-text-ad]
44. Connecticut
> 2021 motor fuel consumption per licensed driver: 653.0 gal/driver
> 2021 gas consumed: 1.7 billion gal. — 16th fewest
> 2021 licensed drivers: 2.6 million — 23rd fewest
> Avg. gas price as of Apr 11, 2023: $3.52 per gal. — 22nd lowest
> Est. annual cost of driving at current gas prices: $2,300.42 — 4th lowest
> 2021 miles driven per licensed driver: 11,122 — 6th fewest (90.1% urban, 9.9% rural)
> 2022 population: 3.6 million — 22nd smallest
[recirclink id=1199450]
43. New Jersey
> 2021 motor fuel consumption per licensed driver: 671.6 gal/driver
> 2021 gas consumed: 4.3 billion gal. — 14th most
> 2021 licensed drivers: 6.5 million — 11th most
> Avg. gas price as of Apr 11, 2023: $3.45 per gal. — 17th lowest
> Est. annual cost of driving at current gas prices: $2,318.51 — 5th lowest
> 2021 miles driven per licensed driver: 11,401 — 9th fewest (93.6% urban, 6.4% rural)
> 2022 population: 9.3 million — 11th largest
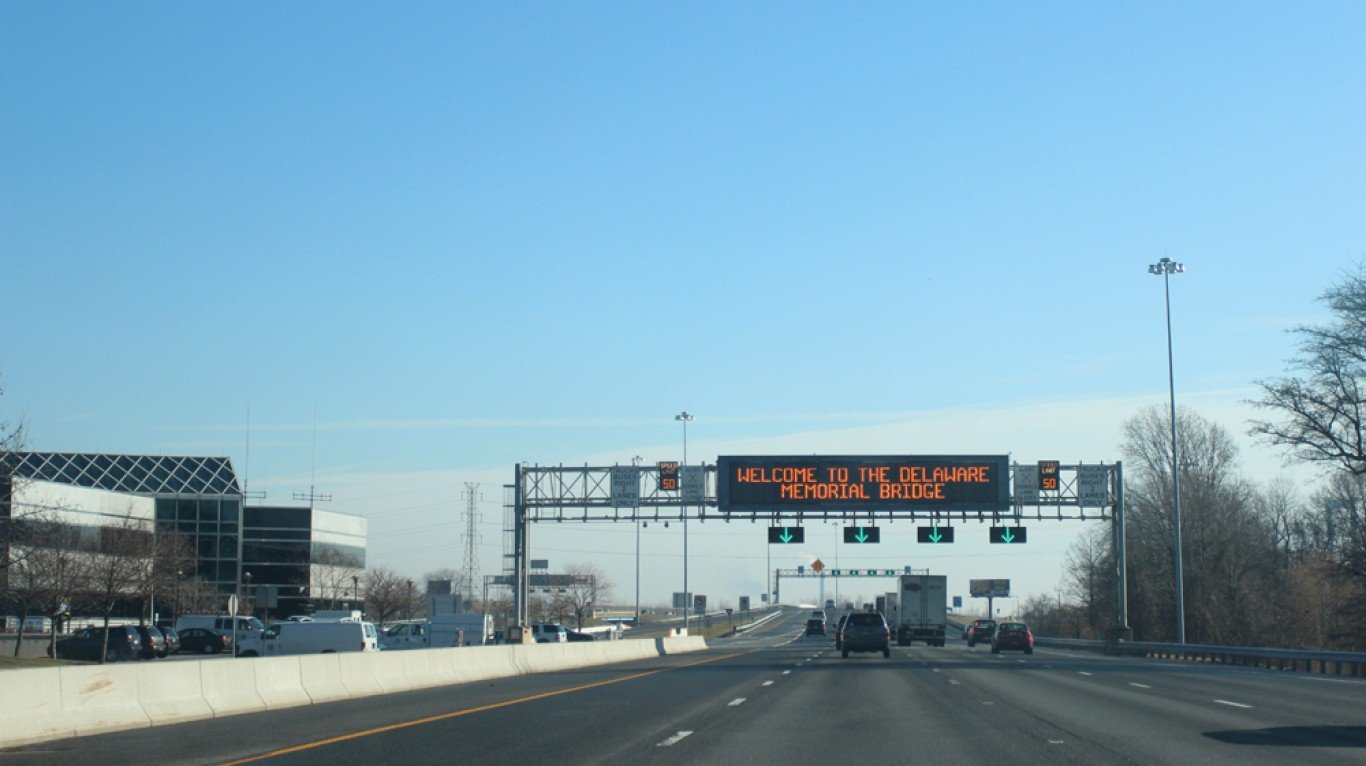
42. Delaware
> 2021 motor fuel consumption per licensed driver: 686.1 gal/driver
> 2021 gas consumed: 582.2 million gal. — 5th fewest
> 2021 licensed drivers: 848,504 — 7th fewest
> Avg. gas price as of Apr 11, 2023: $3.56 per gal. — 22nd highest
> Est. annual cost of driving at current gas prices: $2,440.58 — 7th lowest
> 2021 miles driven per licensed driver: 11,965 — 12th fewest (72.1% urban, 27.9% rural)
> 2022 population: 1.0 million — 6th smallest
[in-text-ad-2]
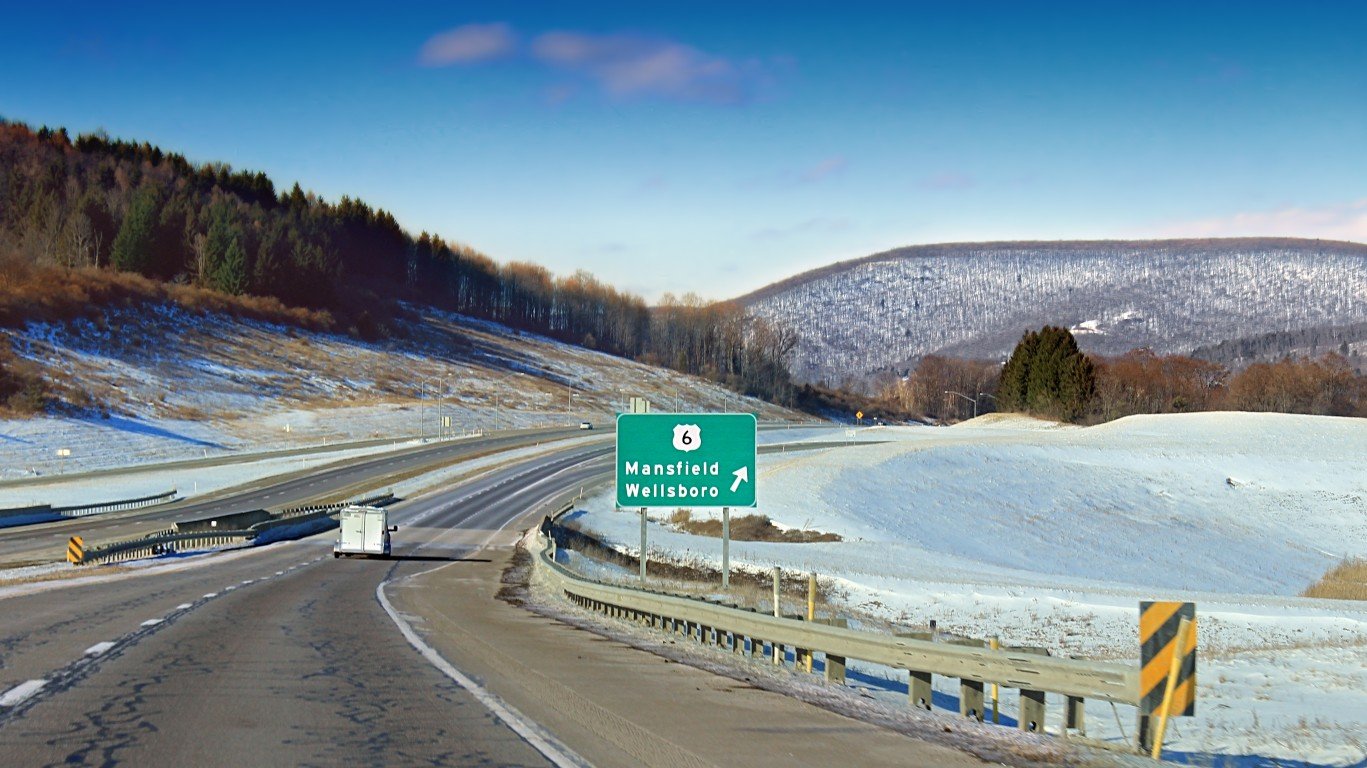
41. Pennsylvania
> 2021 motor fuel consumption per licensed driver: 686.2 gal/driver
> 2021 gas consumed: 6.2 billion gal. — 8th most
> 2021 licensed drivers: 9.1 million — 5th most
> Avg. gas price as of Apr 11, 2023: $3.77 per gal. — 9th highest
> Est. annual cost of driving at current gas prices: $2,586.95 — 13th lowest
> 2021 miles driven per licensed driver: 11,286 — 8th fewest (66.7% urban, 33.3% rural)
> 2022 population: 13. million — 5th largest
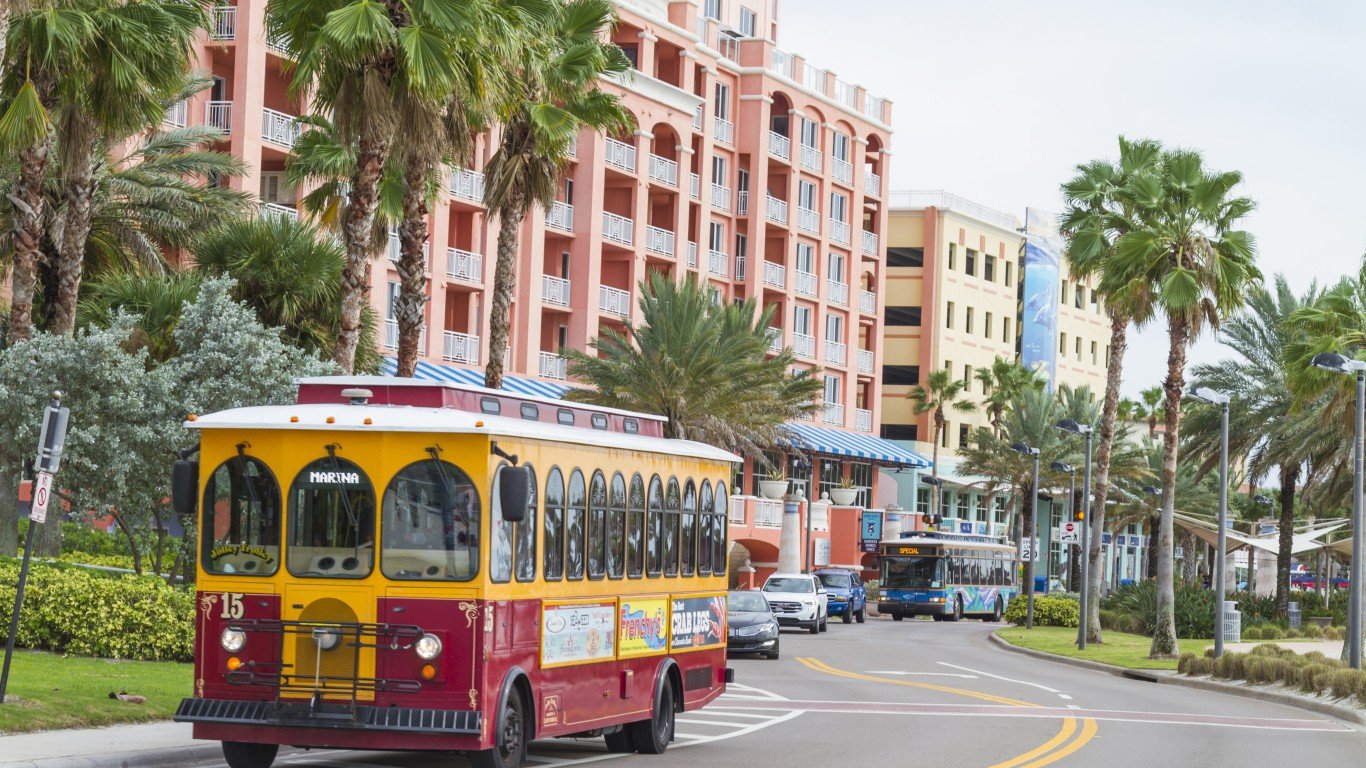
40. Florida
> 2021 motor fuel consumption per licensed driver: 690.9 gal/driver
> 2021 gas consumed: 11.2 billion gal. — 3rd most
> 2021 licensed drivers: 16.1 million — 3rd most
> Avg. gas price as of Apr 11, 2023: $3.62 per gal. — 16th highest
> Est. annual cost of driving at current gas prices: $2,499.65 — 10th lowest
> 2021 miles driven per licensed driver: 13,476 — 20th fewest (82.7% urban, 17.3% rural)
> 2022 population: 22.2 million — 3rd largest
[in-text-ad]
39. Maryland
> 2021 motor fuel consumption per licensed driver: 691.2 gal/driver
> 2021 gas consumed: 3.1 billion gal. — 22nd most
> 2021 licensed drivers: 4.4 million — 18th most
> Avg. gas price as of Apr 11, 2023: $3.62 per gal. — 15th highest
> Est. annual cost of driving at current gas prices: $2,501.55 — 11th lowest
> 2021 miles driven per licensed driver: 12,749 — 19th fewest (81.5% urban, 18.5% rural)
> 2022 population: 6.2 million — 19th largest
[recirclink id=1213143]
38. Colorado
> 2021 motor fuel consumption per licensed driver: 692.1 gal/driver
> 2021 gas consumed: 3.1 billion gal. — 24th most
> 2021 licensed drivers: 4.4 million — 19th most
> Avg. gas price as of Apr 11, 2023: $3.58 per gal. — 20th highest
> Est. annual cost of driving at current gas prices: $2,478.31 — 9th lowest
> 2021 miles driven per licensed driver: 12,204 — 16th fewest (68.9% urban, 31.1% rural)
> 2022 population: 5.8 million — 21st largest
37. Michigan
> 2021 motor fuel consumption per licensed driver: 694.4 gal/driver
> 2021 gas consumed: 5.5 billion gal. — 10th most
> 2021 licensed drivers: 8.0 million — 8th most
> Avg. gas price as of Apr 11, 2023: $3.70 per gal. — 10th highest
> Est. annual cost of driving at current gas prices: $2,567.18 — 12th lowest
> 2021 miles driven per licensed driver: 12,120 — 14th fewest (68.0% urban, 32.0% rural)
> 2022 population: 10.0 million — 10th largest
[in-text-ad-2]
36. New Hampshire
> 2021 motor fuel consumption per licensed driver: 699.2 gal/driver
> 2021 gas consumed: 821.5 million gal. — 9th fewest
> 2021 licensed drivers: 1.2 million — 12th fewest
> Avg. gas price as of Apr 11, 2023: $3.36 per gal. — 7th lowest
> Est. annual cost of driving at current gas prices: $2,349.44 — 6th lowest
> 2021 miles driven per licensed driver: 11,176 — 7th fewest (58.7% urban, 41.3% rural)
> 2022 population: 1.4 million — 10th smallest
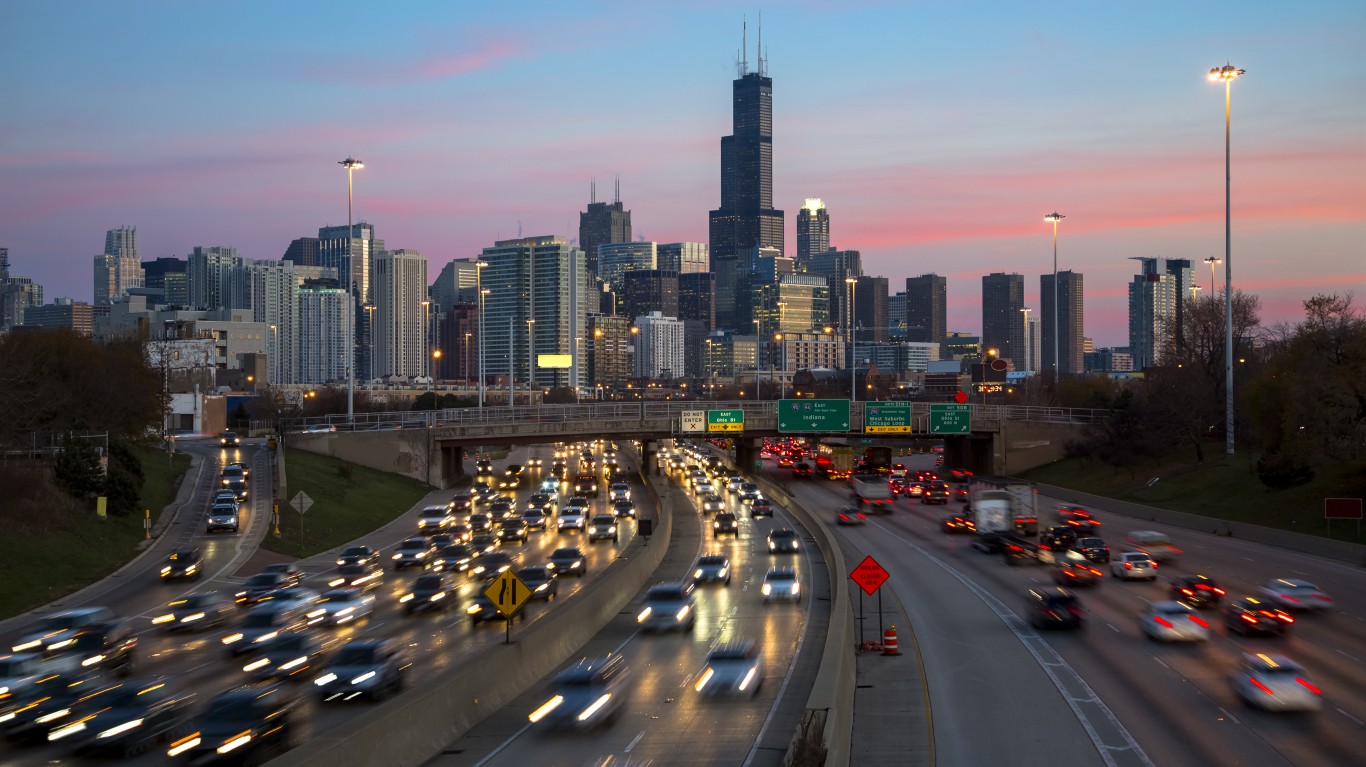
35. Illinois
> 2021 motor fuel consumption per licensed driver: 700.4 gal/driver
> 2021 gas consumed: 5.9 billion gal. — 9th most
> 2021 licensed drivers: 8.4 million — 6th most
> Avg. gas price as of Apr 11, 2023: $4.07 per gal. — 6th highest
> Est. annual cost of driving at current gas prices: $2,847.89 — 19th lowest
> 2021 miles driven per licensed driver: 11,659 — 11th fewest (77.9% urban, 22.1% rural)
> 2022 population: 12.6 million — 6th largest
[in-text-ad]
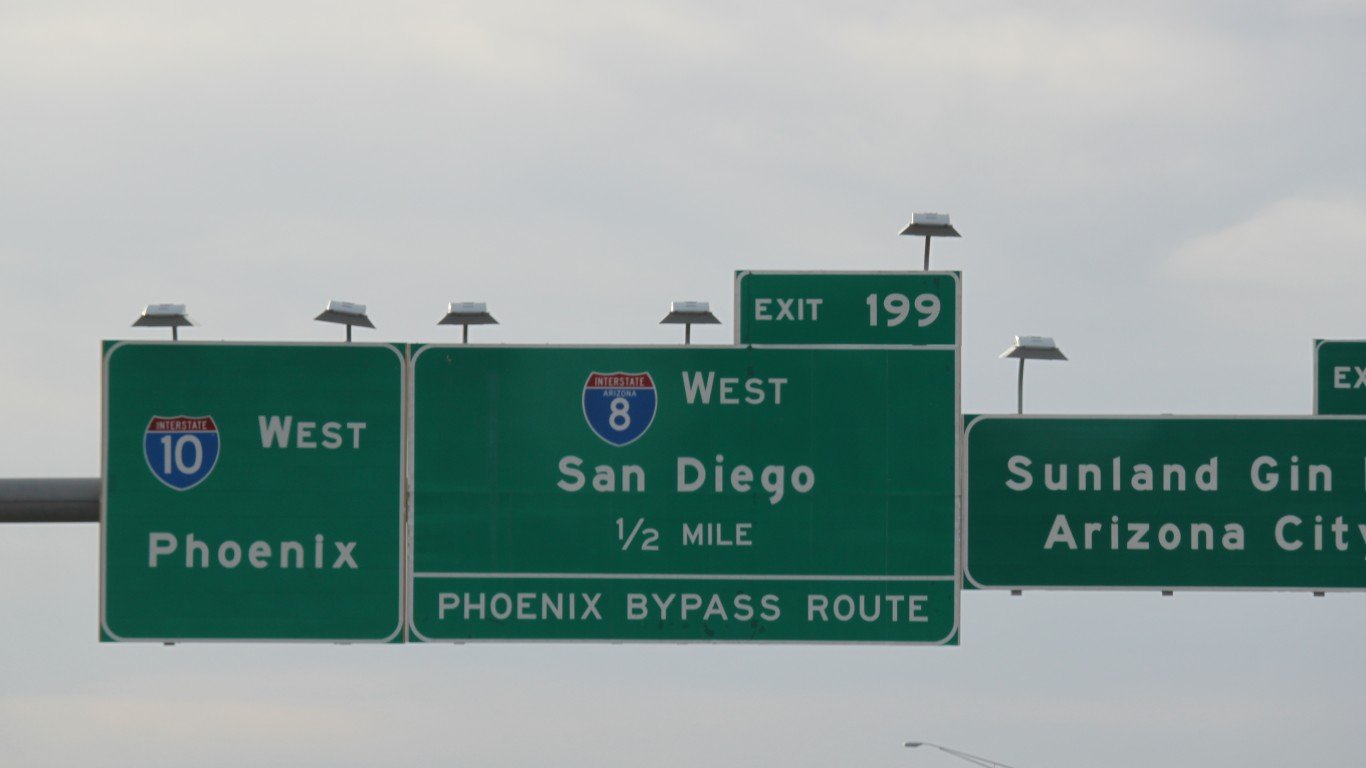
34. Arizona
> 2021 motor fuel consumption per licensed driver: 708.2 gal/driver
> 2021 gas consumed: 4.1 billion gal. — 17th most
> 2021 licensed drivers: 5.8 million — 14th most
> Avg. gas price as of Apr 11, 2023: $4.56 per gal. — 3rd highest
> Est. annual cost of driving at current gas prices: $3,229.50 — 18th highest
> 2021 miles driven per licensed driver: 12,728 — 18th fewest (76.1% urban, 23.9% rural)
> 2022 population: 7.4 million — 14th largest
[recirclink id=1206389]
33. Oregon
> 2021 motor fuel consumption per licensed driver: 723.5 gal/driver
> 2021 gas consumed: 2.2 billion gal. — 20th fewest
> 2021 licensed drivers: 3.0 million — 25th fewest
> Avg. gas price as of Apr 11, 2023: $4.06 per gal. — 7th highest
> Est. annual cost of driving at current gas prices: $2,935.81 — 24th lowest
> 2021 miles driven per licensed driver: 12,159 — 15th fewest (59.6% urban, 40.4% rural)
> 2022 population: 4.2 million — 24th smallest
32. Vermont
> 2021 motor fuel consumption per licensed driver: 743.3 gal/driver
> 2021 gas consumed: 349.1 million gal. — the fewest
> 2021 licensed drivers: 469,624 — 2nd fewest
> Avg. gas price as of Apr 11, 2023: $3.51 per gal. — 20th lowest
> Est. annual cost of driving at current gas prices: $2,609.77 — 15th lowest
> 2021 miles driven per licensed driver: 14,107 — 25th most (29.0% urban, 71.0% rural)
> 2022 population: 647,064 — 2nd smallest
[in-text-ad-2]
31. Alaska
> 2021 motor fuel consumption per licensed driver: 763.8 gal/driver
> 2021 gas consumed: 396.6 million gal. — 2nd fewest
> 2021 licensed drivers: 519,288 — 3rd fewest
> Avg. gas price as of Apr 11, 2023: $3.90 per gal. — 8th highest
> Est. annual cost of driving at current gas prices: $2,976.35 — 25th highest
> 2021 miles driven per licensed driver: 11,077 — 5th fewest (53.4% urban, 46.6% rural)
> 2022 population: 733,583 — 3rd smallest
30. Nevada
> 2021 motor fuel consumption per licensed driver: 764.3 gal/driver
> 2021 gas consumed: 1.6 billion gal. — 15th fewest
> 2021 licensed drivers: 2.2 million — 18th fewest
> Avg. gas price as of Apr 11, 2023: $4.28 per gal. — 5th highest
> Est. annual cost of driving at current gas prices: $3,271.31 — 17th highest
> 2021 miles driven per licensed driver: 12,590 — 17th fewest (78.1% urban, 21.9% rural)
> 2022 population: 3.2 million — 19th smallest
[in-text-ad]
29. Minnesota
> 2021 motor fuel consumption per licensed driver: 786.4 gal/driver
> 2021 gas consumed: 3.3 billion gal. — 21st most
> 2021 licensed drivers: 4.1 million — 22nd most
> Avg. gas price as of Apr 11, 2023: $3.60 per gal. — 19th highest
> Est. annual cost of driving at current gas prices: $2,831.98 — 18th lowest
> 2021 miles driven per licensed driver: 13,799 — 24th fewest (57.1% urban, 42.9% rural)
> 2022 population: 5.7 million — 22nd largest
[recirclink id=1203101]
28. Ohio
> 2021 motor fuel consumption per licensed driver: 788.2 gal/driver
> 2021 gas consumed: 6.5 billion gal. — 5th most
> 2021 licensed drivers: 8.3 million — 7th most
> Avg. gas price as of Apr 11, 2023: $3.62 per gal. — 17th highest
> Est. annual cost of driving at current gas prices: $2,850.88 — 20th lowest
> 2021 miles driven per licensed driver: 13,632 — 22nd fewest (69.9% urban, 30.1% rural)
> 2022 population: 11.8 million — 7th largest
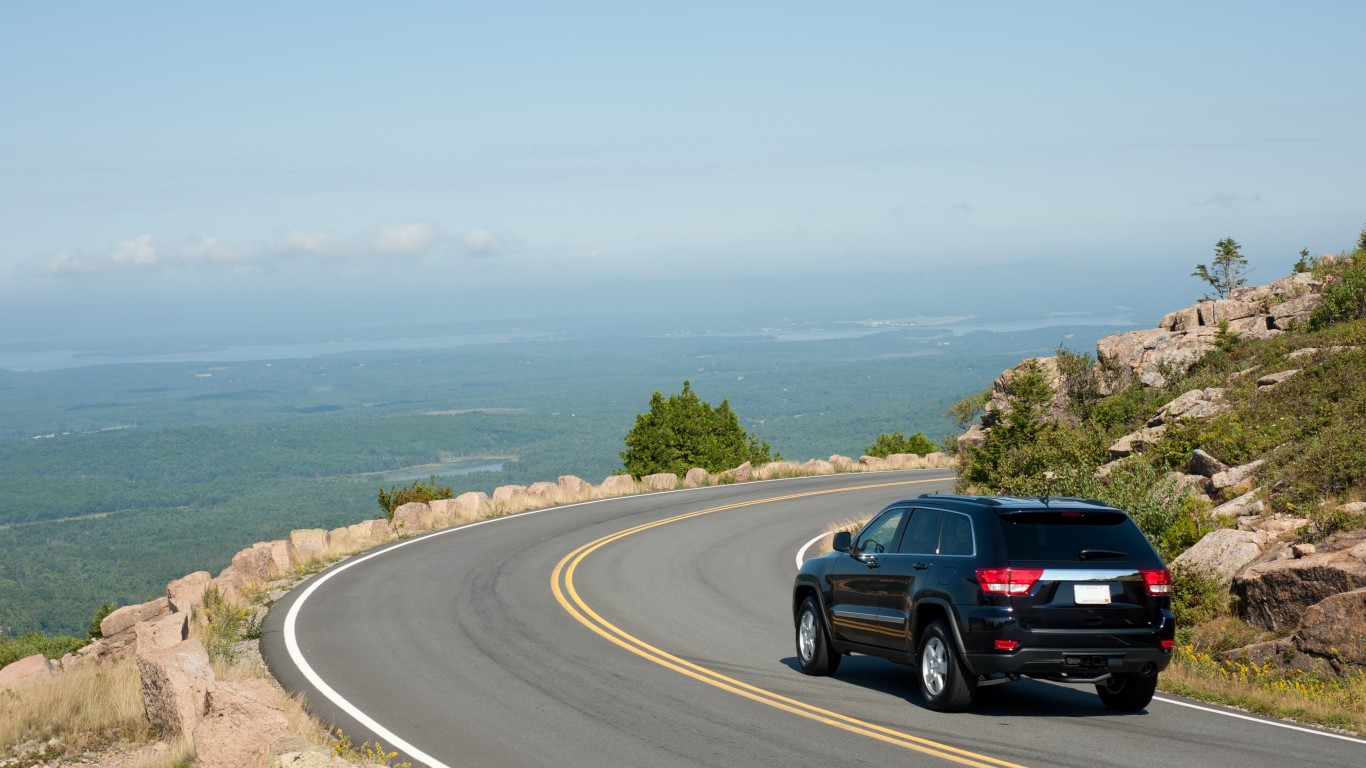
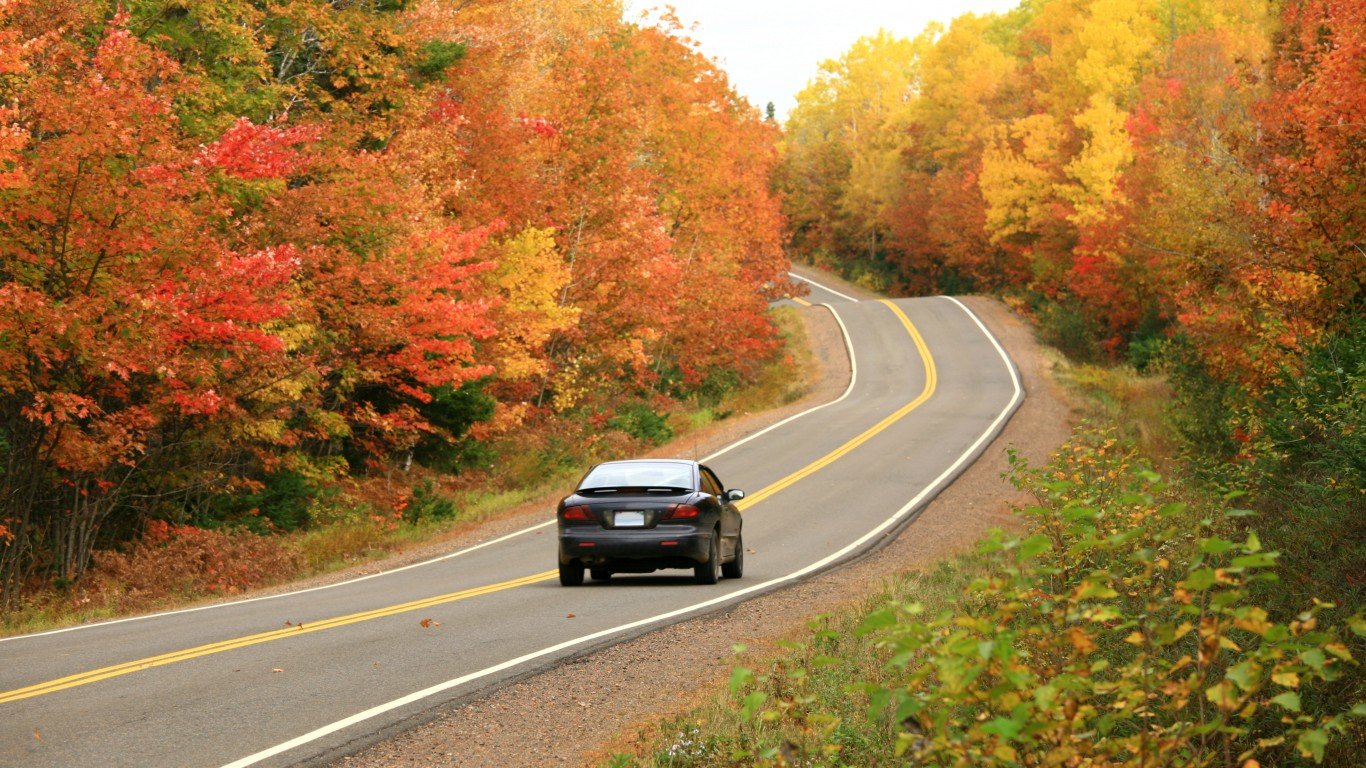
27. Maine
> 2021 motor fuel consumption per licensed driver: 801.5 gal/driver
> 2021 gas consumed: 846.8 million gal. — 10th fewest
> 2021 licensed drivers: 1.1 million — 10th fewest
> Avg. gas price as of Apr 11, 2023: $3.47 per gal. — 19th lowest
> Est. annual cost of driving at current gas prices: $2,780.46 — 16th lowest
> 2021 miles driven per licensed driver: 13,781 — 23rd fewest (30.9% urban, 69.1% rural)
> 2022 population: 1.4 million — 9th smallest
[in-text-ad-2]

26. Utah
> 2021 motor fuel consumption per licensed driver: 809.1 gal/driver
> 2021 gas consumed: 1.8 billion gal. — 18th fewest
> 2021 licensed drivers: 2.2 million — 19th fewest
> Avg. gas price as of Apr 11, 2023: $3.69 per gal. — 11th highest
> Est. annual cost of driving at current gas prices: $2,987.94 — 24th highest
> 2021 miles driven per licensed driver: 15,240 — 16th most (70.8% urban, 29.2% rural)
> 2022 population: 3.4 million — 21st smallest
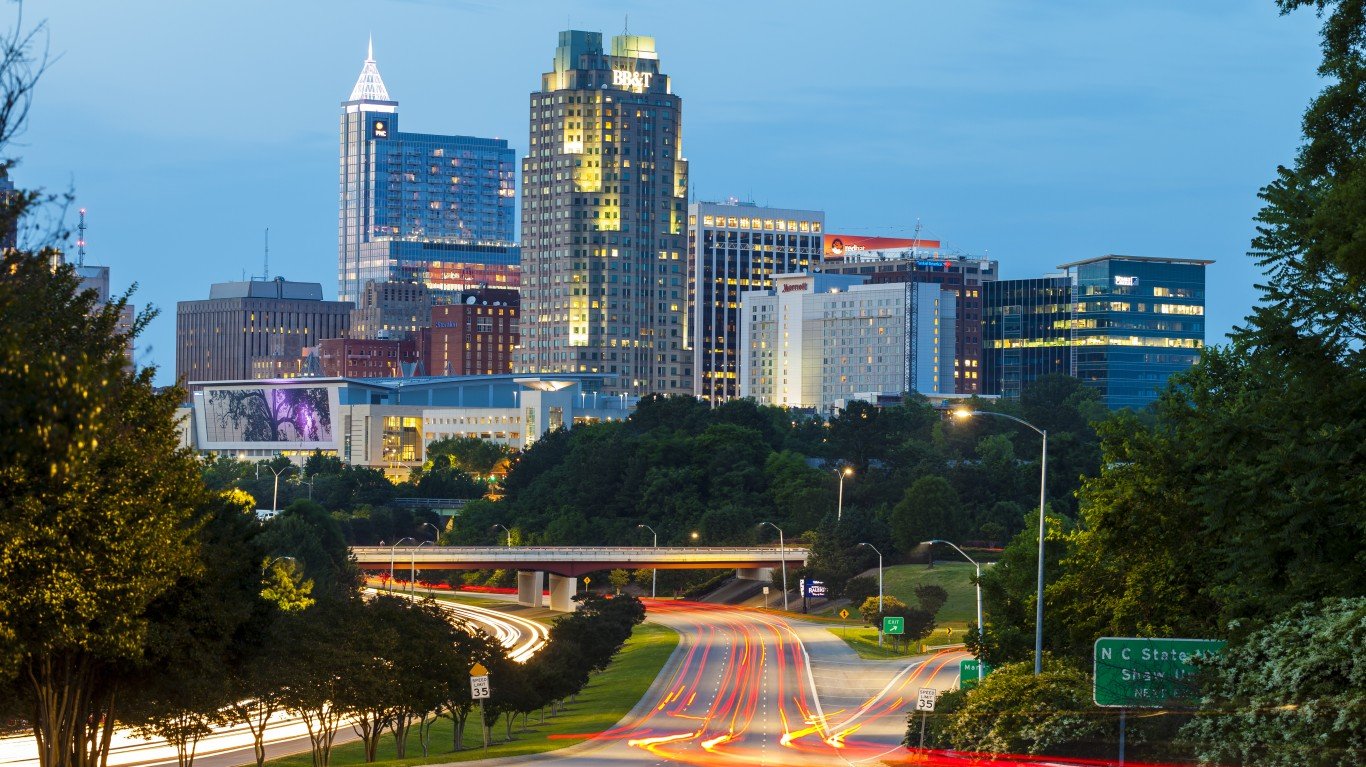
25. North Carolina
> 2021 motor fuel consumption per licensed driver: 811.5 gal/driver
> 2021 gas consumed: 6.3 billion gal. — 7th most
> 2021 licensed drivers: 7.8 million — 9th most
> Avg. gas price as of Apr 11, 2023: $3.54 per gal. — 25th highest
> Est. annual cost of driving at current gas prices: $2,874.48 — 21st lowest
> 2021 miles driven per licensed driver: 15,162 — 18th most (65.5% urban, 34.5% rural)
> 2022 population: 10.7 million — 9th largest
[in-text-ad]
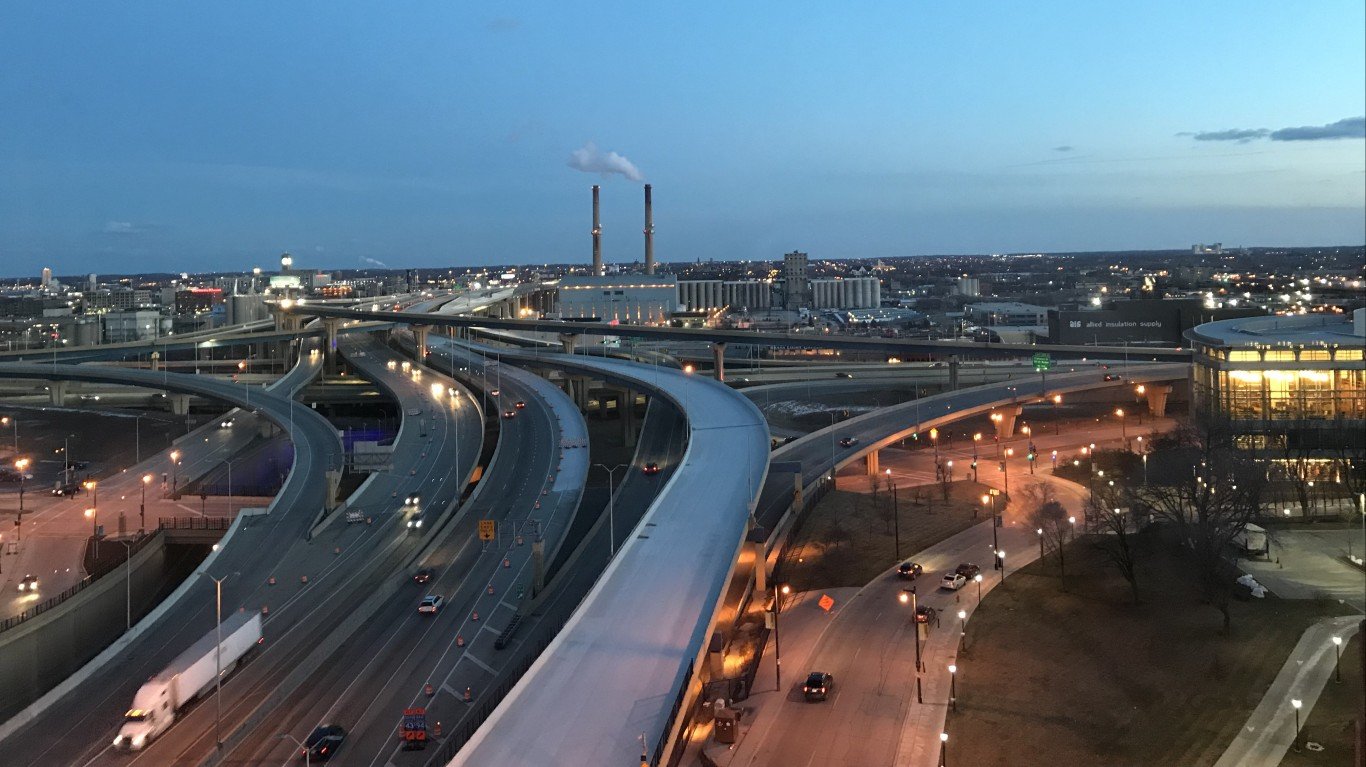
24. Wisconsin
> 2021 motor fuel consumption per licensed driver: 818.3 gal/driver
> 2021 gas consumed: 3.6 billion gal. — 19th most
> 2021 licensed drivers: 4.3 million — 20th most
> Avg. gas price as of Apr 11, 2023: $3.53 per gal. — 24th lowest
> Est. annual cost of driving at current gas prices: $2,891.18 — 22nd lowest
> 2021 miles driven per licensed driver: 14,970 — 19th most (48.8% urban, 51.2% rural)
> 2022 population: 5.9 million — 20th largest
[recirclink id=1224594]

23. Georgia
> 2021 motor fuel consumption per licensed driver: 824.6 gal/driver
> 2021 gas consumed: 6.3 billion gal. — 6th most
> 2021 licensed drivers: 7.7 million — 10th most
> Avg. gas price as of Apr 11, 2023: $3.39 per gal. — 12th lowest
> Est. annual cost of driving at current gas prices: $2,798.56 — 17th lowest
> 2021 miles driven per licensed driver: 15,747 — 13th most (74.9% urban, 25.1% rural)
> 2022 population: 10.9 million — 8th largest
22. Kansas
> 2021 motor fuel consumption per licensed driver: 878.4 gal/driver
> 2021 gas consumed: 1.8 billion gal. — 19th fewest
> 2021 licensed drivers: 2.1 million — 17th fewest
> Avg. gas price as of Apr 11, 2023: $3.36 per gal. — 9th lowest
> Est. annual cost of driving at current gas prices: $2,953.25 — 25th lowest
> 2021 miles driven per licensed driver: 15,166 — 17th most (51.4% urban, 48.6% rural)
> 2022 population: 2.9 million — 16th smallest
[in-text-ad-2]
21. Louisiana
> 2021 motor fuel consumption per licensed driver: 882.0 gal/driver
> 2021 gas consumed: 3.0 billion gal. — 25th most
> 2021 licensed drivers: 3.4 million — 25th most
> Avg. gas price as of Apr 11, 2023: $3.29 per gal. — 4th lowest
> Est. annual cost of driving at current gas prices: $2,903.58 — 23rd lowest
> 2021 miles driven per licensed driver: 15,920 — 12th most (61.7% urban, 38.3% rural)
> 2022 population: 4.6 million — 25th largest
20. Virginia
> 2021 motor fuel consumption per licensed driver: 888.6 gal/driver
> 2021 gas consumed: 5.3 billion gal. — 11th most
> 2021 licensed drivers: 5.9 million — 12th most
> Avg. gas price as of Apr 11, 2023: $3.53 per gal. — 25th lowest
> Est. annual cost of driving at current gas prices: $3,140.20 — 21st highest
> 2021 miles driven per licensed driver: 13,548 — 21st fewest (62.5% urban, 37.5% rural)
> 2022 population: 8.7 million — 12th largest
[in-text-ad]
19. Tennessee
> 2021 motor fuel consumption per licensed driver: 920.0 gal/driver
> 2021 gas consumed: 4.6 billion gal. — 12th most
> 2021 licensed drivers: 5.0 million — 15th most
> Avg. gas price as of Apr 11, 2023: $3.38 per gal. — 10th lowest
> Est. annual cost of driving at current gas prices: $3,106.09 — 23rd highest
> 2021 miles driven per licensed driver: 16,487 — 10th most (67.4% urban, 32.6% rural)
> 2022 population: 7.1 million — 15th largest
[recirclink id=1199450]
18. South Carolina
> 2021 motor fuel consumption per licensed driver: 945.8 gal/driver
> 2021 gas consumed: 3.8 billion gal. — 18th most
> 2021 licensed drivers: 4.0 million — 24th most
> Avg. gas price as of Apr 11, 2023: $3.39 per gal. — 11th lowest
> Est. annual cost of driving at current gas prices: $3,208.96 — 20th highest
> 2021 miles driven per licensed driver: 14,406 — 22nd most (54.7% urban, 45.3% rural)
> 2022 population: 5.3 million — 23rd largest
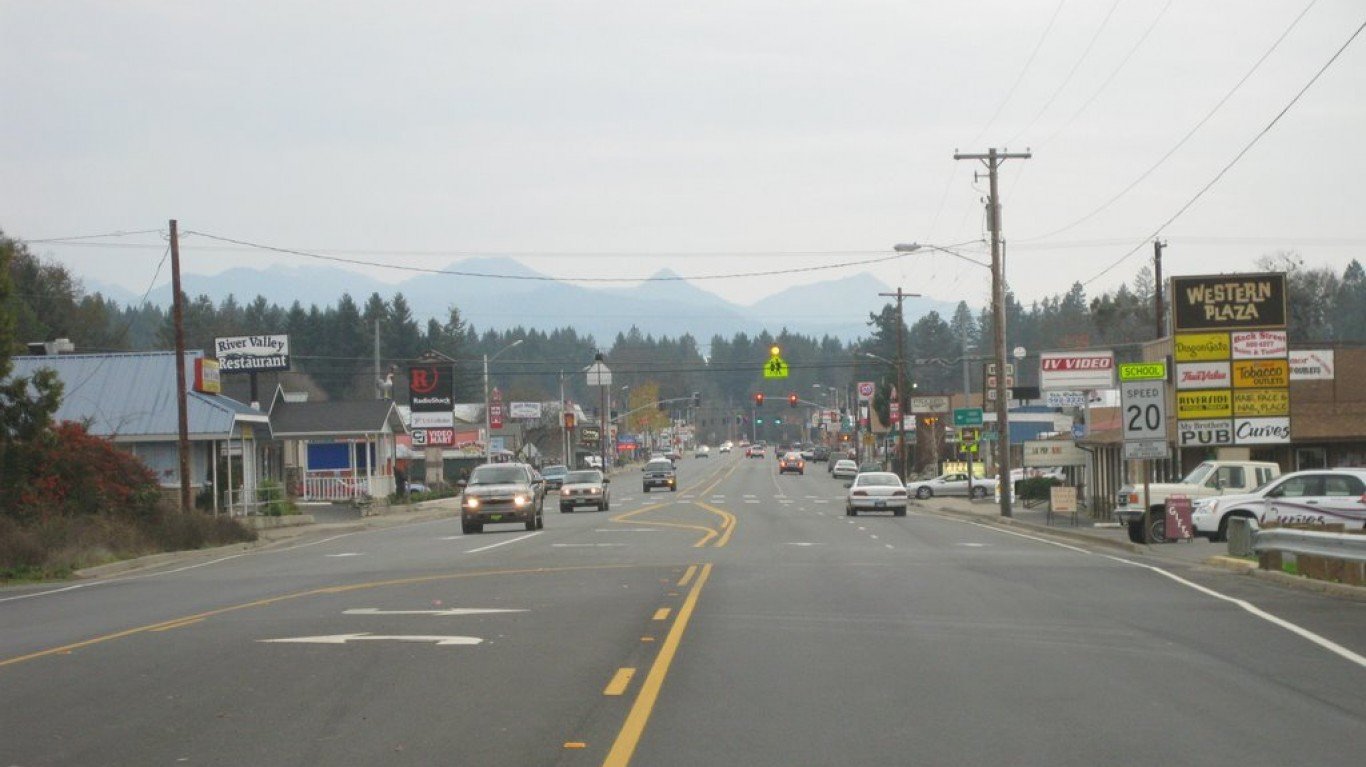
17. Idaho
> 2021 motor fuel consumption per licensed driver: 947.2 gal/driver
> 2021 gas consumed: 1.3 billion gal. — 12th fewest
> 2021 licensed drivers: 1.3 million — 13th fewest
> Avg. gas price as of Apr 11, 2023: $3.61 per gal. — 18th highest
> Est. annual cost of driving at current gas prices: $3,419.38 — 15th highest
> 2021 miles driven per licensed driver: 14,372 — 23rd most (41.9% urban, 58.1% rural)
> 2022 population: 1.9 million — 13th smallest
[in-text-ad-2]

16. Indiana
> 2021 motor fuel consumption per licensed driver: 974.6 gal/driver
> 2021 gas consumed: 4.5 billion gal. — 13th most
> 2021 licensed drivers: 4.6 million — 17th most
> Avg. gas price as of Apr 11, 2023: $3.69 per gal. — 12th highest
> Est. annual cost of driving at current gas prices: $3,598.19 — 10th highest
> 2021 miles driven per licensed driver: 16,963 — 7th most (63.0% urban, 37.0% rural)
> 2022 population: 6.8 million — 17th largest
15. Arkansas
> 2021 motor fuel consumption per licensed driver: 996.3 gal/driver
> 2021 gas consumed: 2.3 billion gal. — 21st fewest
> 2021 licensed drivers: 2.3 million — 20th fewest
> Avg. gas price as of Apr 11, 2023: $3.24 per gal. — 2nd lowest
> Est. annual cost of driving at current gas prices: $3,228.85 — 19th highest
> 2021 miles driven per licensed driver: 16,657 — 9th most (49.9% urban, 50.1% rural)
> 2022 population: 3.0 million — 18th smallest
[in-text-ad]
14. Nebraska
> 2021 motor fuel consumption per licensed driver: 1,009.9 gal/driver
> 2021 gas consumed: 1.5 billion gal. — 14th fewest
> 2021 licensed drivers: 1.4 million — 14th fewest
> Avg. gas price as of Apr 11, 2023: $3.55 per gal. — 24th highest
> Est. annual cost of driving at current gas prices: $3,583.05 — 11th highest
> 2021 miles driven per licensed driver: 14,741 — 21st most (44.0% urban, 56.0% rural)
> 2022 population: 2.0 million — 14th smallest
[recirclink id=1213143]
13. Missouri
> 2021 motor fuel consumption per licensed driver: 1,013.8 gal/driver
> 2021 gas consumed: 4.3 billion gal. — 15th most
> 2021 licensed drivers: 4.3 million — 21st most
> Avg. gas price as of Apr 11, 2023: $3.36 per gal. — 8th lowest
> Est. annual cost of driving at current gas prices: $3,407.53 — 16th highest
> 2021 miles driven per licensed driver: 18,664 — 4th most (54.3% urban, 45.7% rural)
> 2022 population: 6.2 million — 18th largest
12. Kentucky
> 2021 motor fuel consumption per licensed driver: 1,028.8 gal/driver
> 2021 gas consumed: 3.1 billion gal. — 23rd most
> 2021 licensed drivers: 3.0 million — 24th fewest
> Avg. gas price as of Apr 11, 2023: $3.45 per gal. — 18th lowest
> Est. annual cost of driving at current gas prices: $3,553.42 — 13th highest
> 2021 miles driven per licensed driver: 16,143 — 11th most (45.1% urban, 54.9% rural)
> 2022 population: 4.5 million — 25th smallest
[in-text-ad-2]
11. Iowa
> 2021 motor fuel consumption per licensed driver: 1,032.6 gal/driver
> 2021 gas consumed: 2.4 billion gal. — 22nd fewest
> 2021 licensed drivers: 2.3 million — 21st fewest
> Avg. gas price as of Apr 11, 2023: $3.53 per gal. — 23rd lowest
> Est. annual cost of driving at current gas prices: $3,647.05 — 9th highest
> 2021 miles driven per licensed driver: 14,087 — 25th fewest (39.6% urban, 60.4% rural)
> 2022 population: 3.2 million — 20th smallest
10. Montana
> 2021 motor fuel consumption per licensed driver: 1,033.2 gal/driver
> 2021 gas consumed: 885.1 million gal. — 11th fewest
> 2021 licensed drivers: 856,696 — 8th fewest
> Avg. gas price as of Apr 11, 2023: $3.45 per gal. — 16th lowest
> Est. annual cost of driving at current gas prices: $3,561.48 — 12th highest
> 2021 miles driven per licensed driver: 15,737 — 14th most (29.9% urban, 70.1% rural)
> 2022 population: 1.1 million — 8th smallest
[in-text-ad]
9. Alabama
> 2021 motor fuel consumption per licensed driver: 1,063.7 gal/driver
> 2021 gas consumed: 4.3 billion gal. — 16th most
> 2021 licensed drivers: 4.1 million — 23rd most
> Avg. gas price as of Apr 11, 2023: $3.29 per gal. — 3rd lowest
> Est. annual cost of driving at current gas prices: $3,500.55 — 14th highest
> 2021 miles driven per licensed driver: 19,589 — 3rd most (53.7% urban, 46.3% rural)
> 2022 population: 5.1 million — 24th largest
[recirclink id=1206389]

8. Texas
> 2021 motor fuel consumption per licensed driver: 1,111.2 gal/driver
> 2021 gas consumed: 20.3 billion gal. — the most
> 2021 licensed drivers: 18.3 million — 2nd most
> Avg. gas price as of Apr 11, 2023: $3.36 per gal. — 6th lowest
> Est. annual cost of driving at current gas prices: $3,731.44 — 8th highest
> 2021 miles driven per licensed driver: 15,577 — 15th most (72.2% urban, 27.8% rural)
> 2022 population: 30.0 million — 2nd largest
7. Oklahoma
> 2021 motor fuel consumption per licensed driver: 1,123.4 gal/driver
> 2021 gas consumed: 2.9 billion gal. — 24th fewest
> 2021 licensed drivers: 2.6 million — 22nd fewest
> Avg. gas price as of Apr 11, 2023: $3.35 per gal. — 5th lowest
> Est. annual cost of driving at current gas prices: $3,764.49 — 7th highest
> 2021 miles driven per licensed driver: 17,232 — 6th most (49.8% urban, 50.2% rural)
> 2022 population: 4.0 million — 23rd smallest
[in-text-ad-2]
6. South Dakota
> 2021 motor fuel consumption per licensed driver: 1,148.5 gal/driver
> 2021 gas consumed: 770.8 million gal. — 8th fewest
> 2021 licensed drivers: 671,149 — 5th fewest
> Avg. gas price as of Apr 11, 2023: $3.56 per gal. — 23rd highest
> Est. annual cost of driving at current gas prices: $4,083.92 — 5th highest
> 2021 miles driven per licensed driver: 14,891 — 20th most (29.1% urban, 70.9% rural)
> 2022 population: 909,824 — 5th smallest
5. West Virginia
> 2021 motor fuel consumption per licensed driver: 1,162.7 gal/driver
> 2021 gas consumed: 1.3 billion gal. — 13th fewest
> 2021 licensed drivers: 1.1 million — 11th fewest
> Avg. gas price as of Apr 11, 2023: $3.56 per gal. — 21st highest
> Est. annual cost of driving at current gas prices: $4,143.97 — 4th highest
> 2021 miles driven per licensed driver: 14,126 — 24th most (48.3% urban, 51.7% rural)
> 2022 population: 1.8 million — 12th smallest
[in-text-ad]
4. New Mexico
> 2021 motor fuel consumption per licensed driver: 1,200.7 gal/driver
> 2021 gas consumed: 1.8 billion gal. — 17th fewest
> 2021 licensed drivers: 1.5 million — 15th fewest
> Avg. gas price as of Apr 11, 2023: $3.65 per gal. — 13th highest
> Est. annual cost of driving at current gas prices: $4,387.40 — 3rd highest
> 2021 miles driven per licensed driver: 18,158 — 5th most (40.1% urban, 59.9% rural)
> 2022 population: 2.1 million — 15th smallest
[recirclink id=1203101]

3. Mississippi
> 2021 motor fuel consumption per licensed driver: 1,225.4 gal/driver
> 2021 gas consumed: 2.5 billion gal. — 23rd fewest
> 2021 licensed drivers: 2.0 million — 16th fewest
> Avg. gas price as of Apr 11, 2023: $3.17 per gal. — the lowest
> Est. annual cost of driving at current gas prices: $3,880.75 — 6th highest
> 2021 miles driven per licensed driver: 20,097 — 2nd most (40.6% urban, 59.4% rural)
> 2022 population: 2.9 million — 17th smallest
2. North Dakota
> 2021 motor fuel consumption per licensed driver: 1,277.0 gal/driver
> 2021 gas consumed: 702.0 million gal. — 6th fewest
> 2021 licensed drivers: 549,721 — 4th fewest
> Avg. gas price as of Apr 11, 2023: $3.52 per gal. — 21st lowest
> Est. annual cost of driving at current gas prices: $4,496.33 — 2nd highest
> 2021 miles driven per licensed driver: 16,837 — 8th most (32.0% urban, 68.0% rural)
> 2022 population: 779261 — 4th smallest
[in-text-ad-2]
1. Wyoming
> 2021 motor fuel consumption per licensed driver: 1,712.1 gal/driver
> 2021 gas consumed: 737.0 million gal. — 7th fewest
> 2021 licensed drivers: 430,472 — the fewest
> Avg. gas price as of Apr 11, 2023: $3.43 per gal. — 15th lowest
> Est. annual cost of driving at current gas prices: $5,872.61 — the highest
> 2021 miles driven per licensed driver: 25,778 — the most (26.1% urban, 73.9% rural)
> 2022 population: 581,381 — the smallest
Contact [email protected] for any questions or corrections.