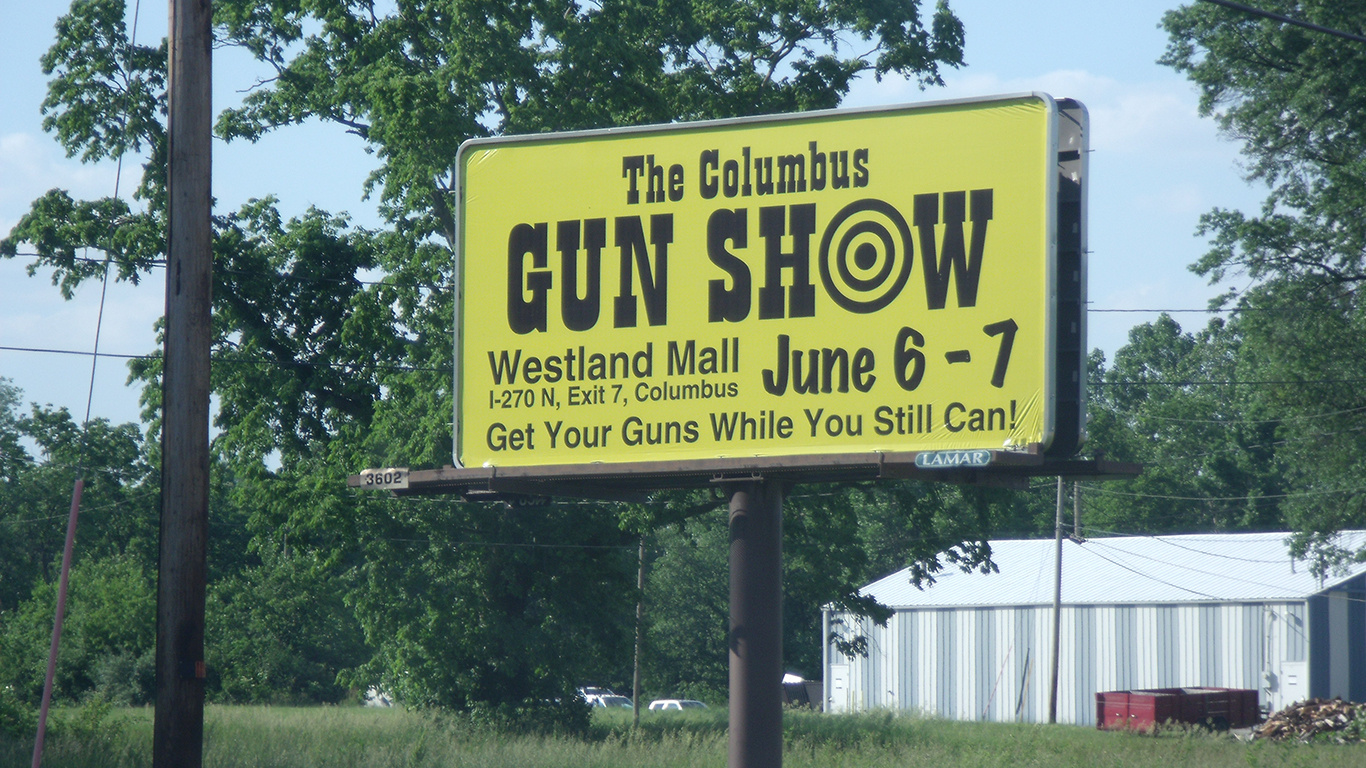
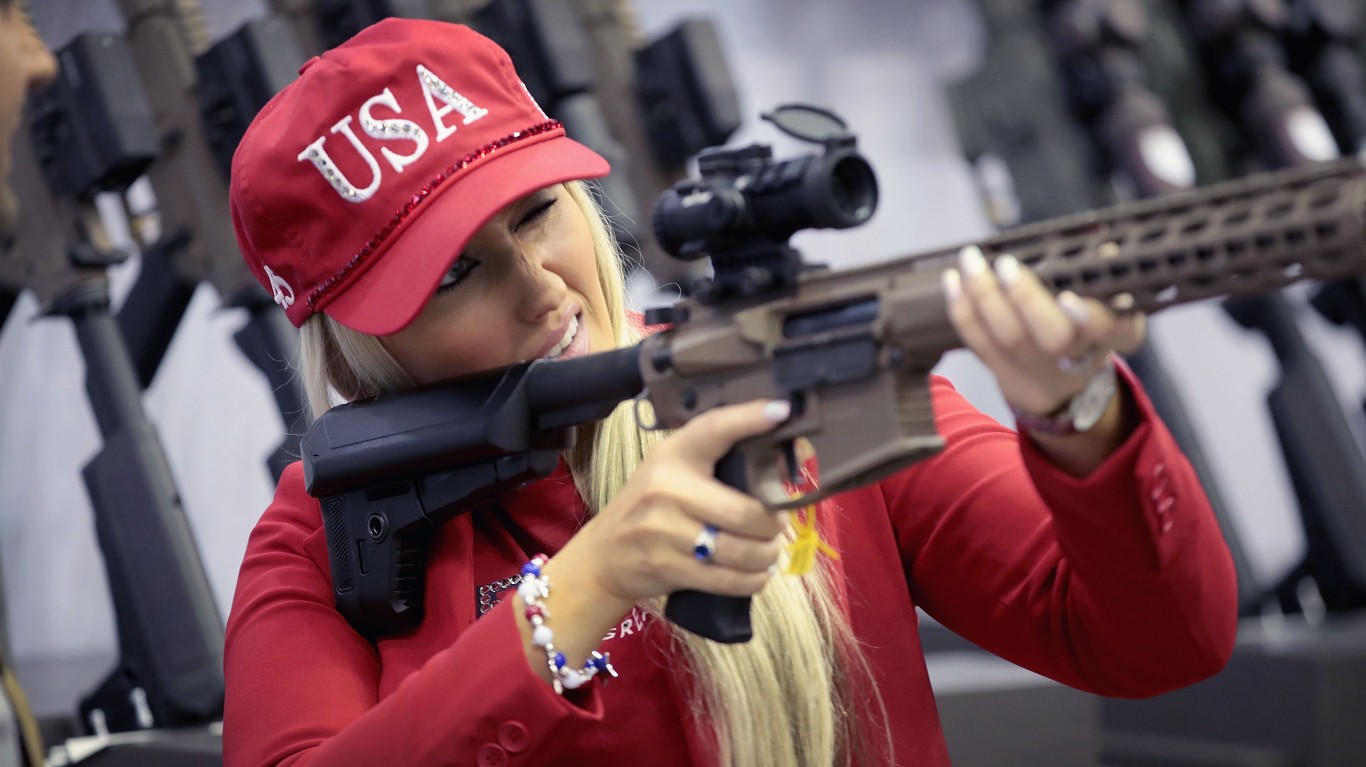
The Oregon House of Representatives passed this week a gun control package, which would increase the minimum age to buy most guns to 21 — with the exception of some hunting rifles — and prevent the sale of homemade guns without serial numbers (sometimes called ghost guns). It also gives local governments within the state the right to institute concealed carry bans. The bill, which advocates described as a “common sense,” will go to the state senate, and is expected to pass there as well. (Also check out the states with the loosest gun laws.)
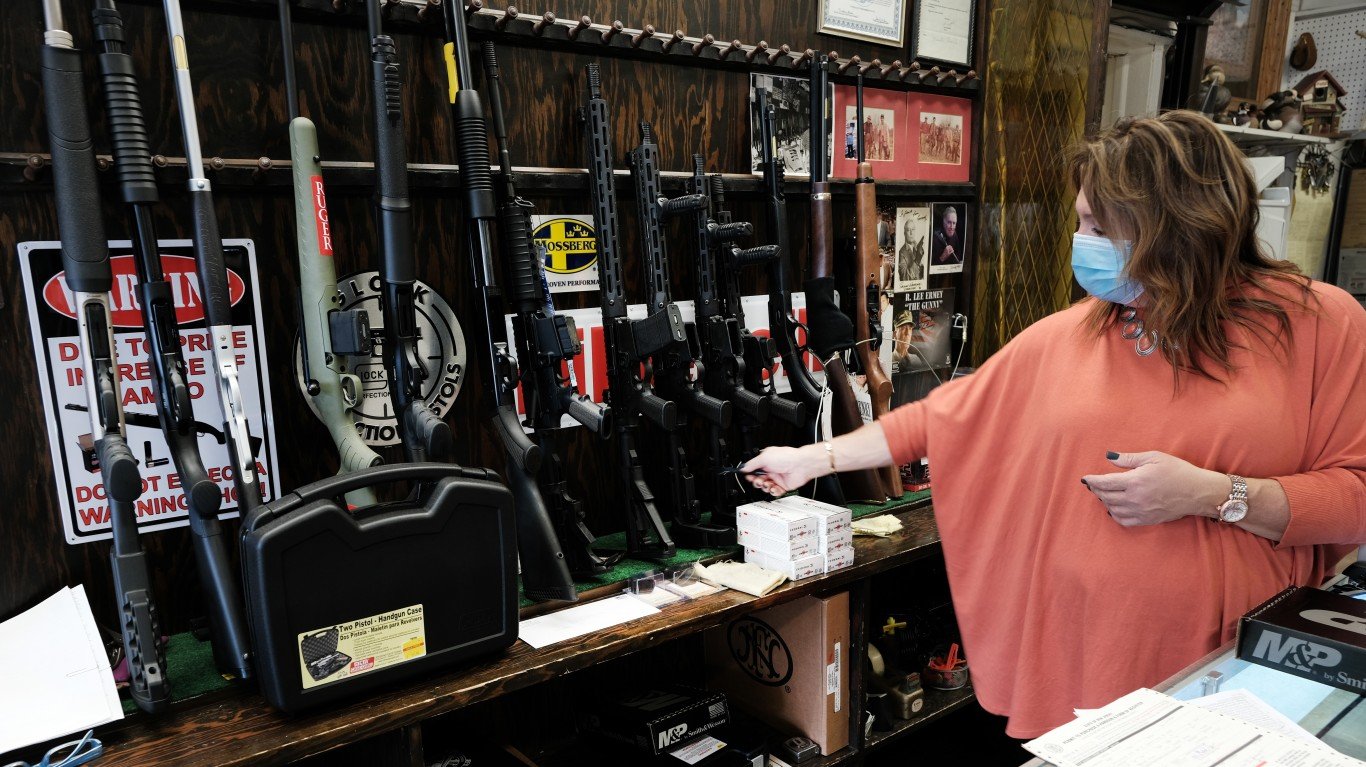
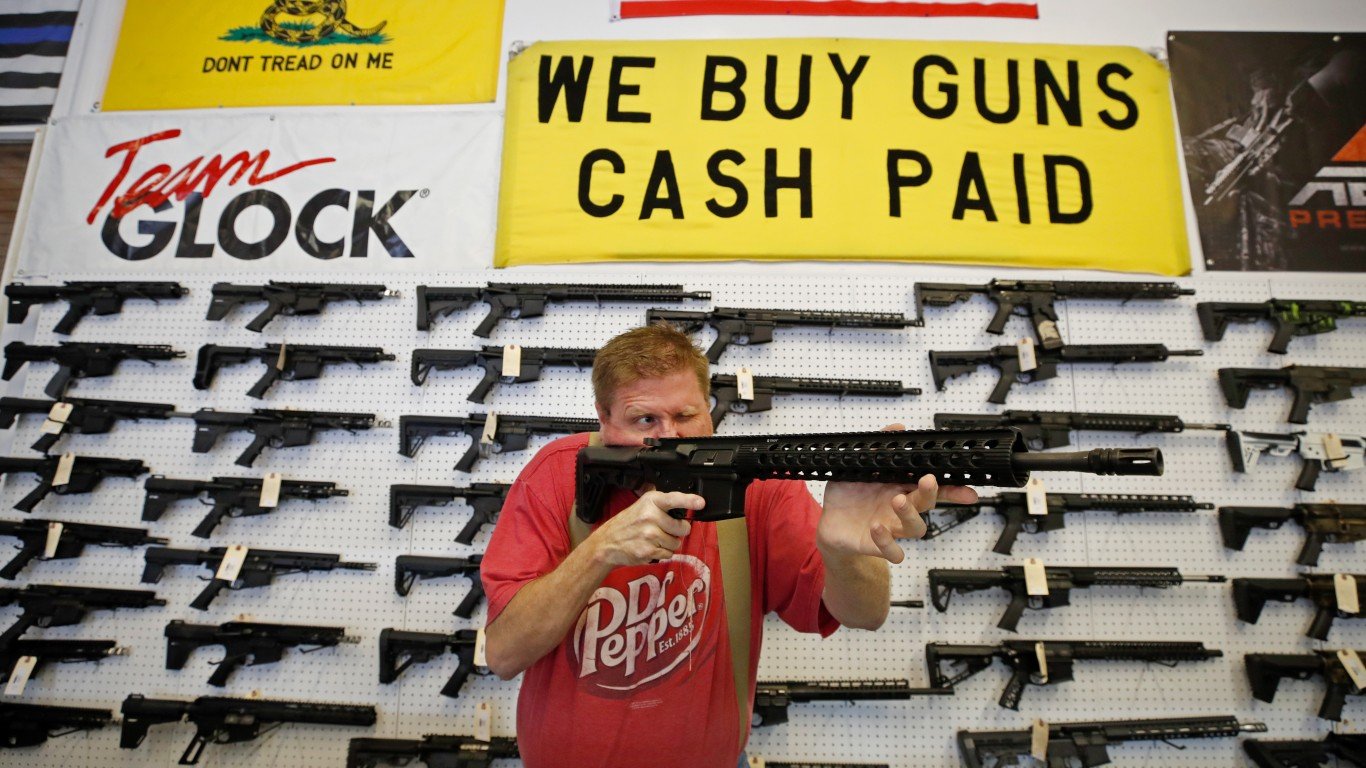
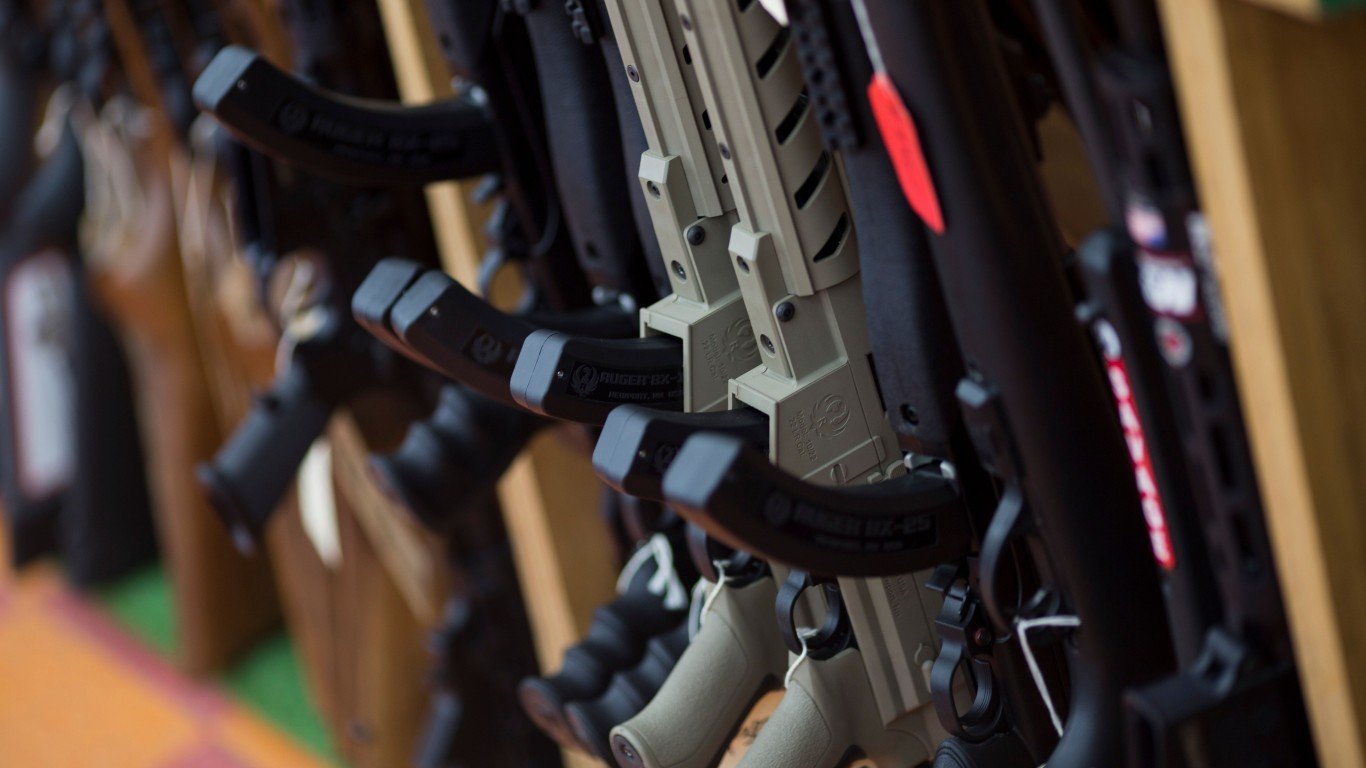
The looming legislation may have inspired a rush to buy guns in the state before greater restrictions are to be put in place. There is no direct way to track gun sales in the United States, but based on the closest available approximation, firearm background checks, Oregon had the second-most guns purchased last month, and checks were up nearly 50% in the state compared to the same month a year ago.
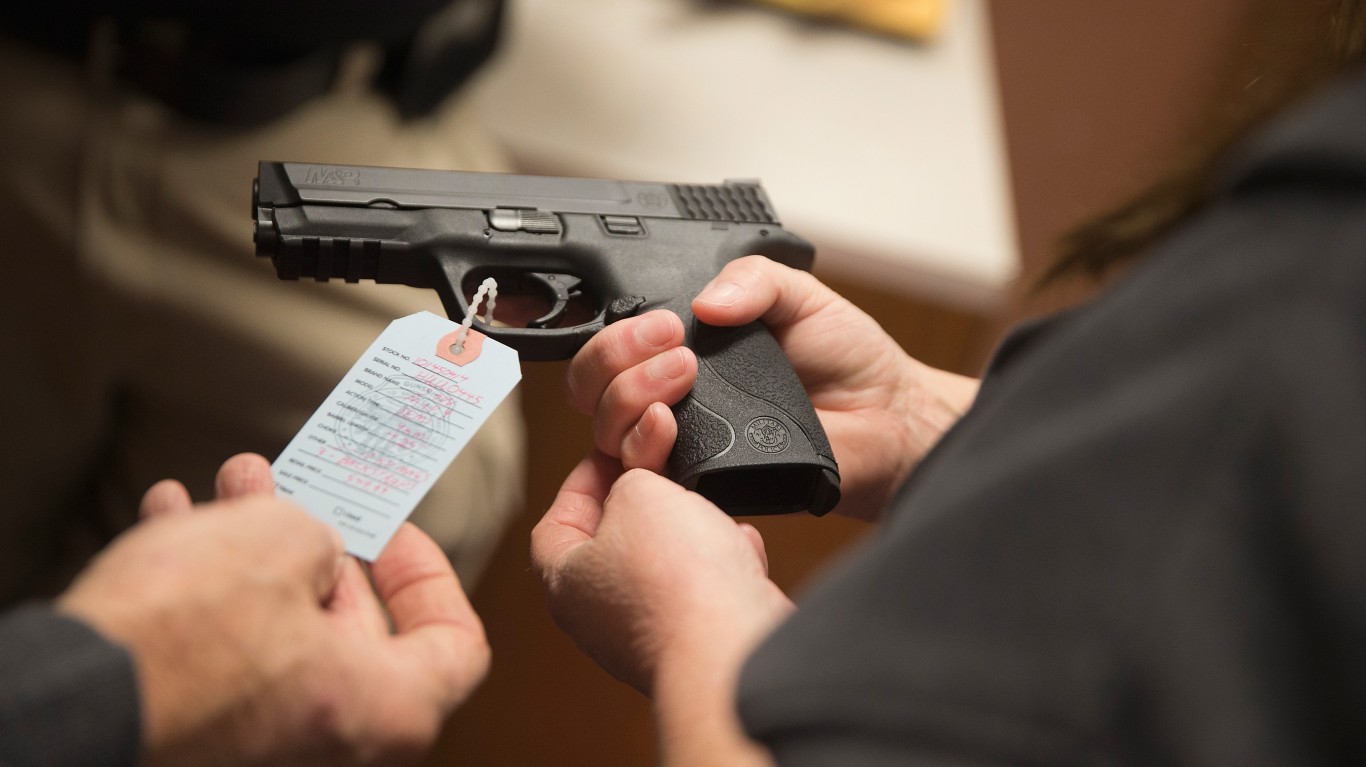
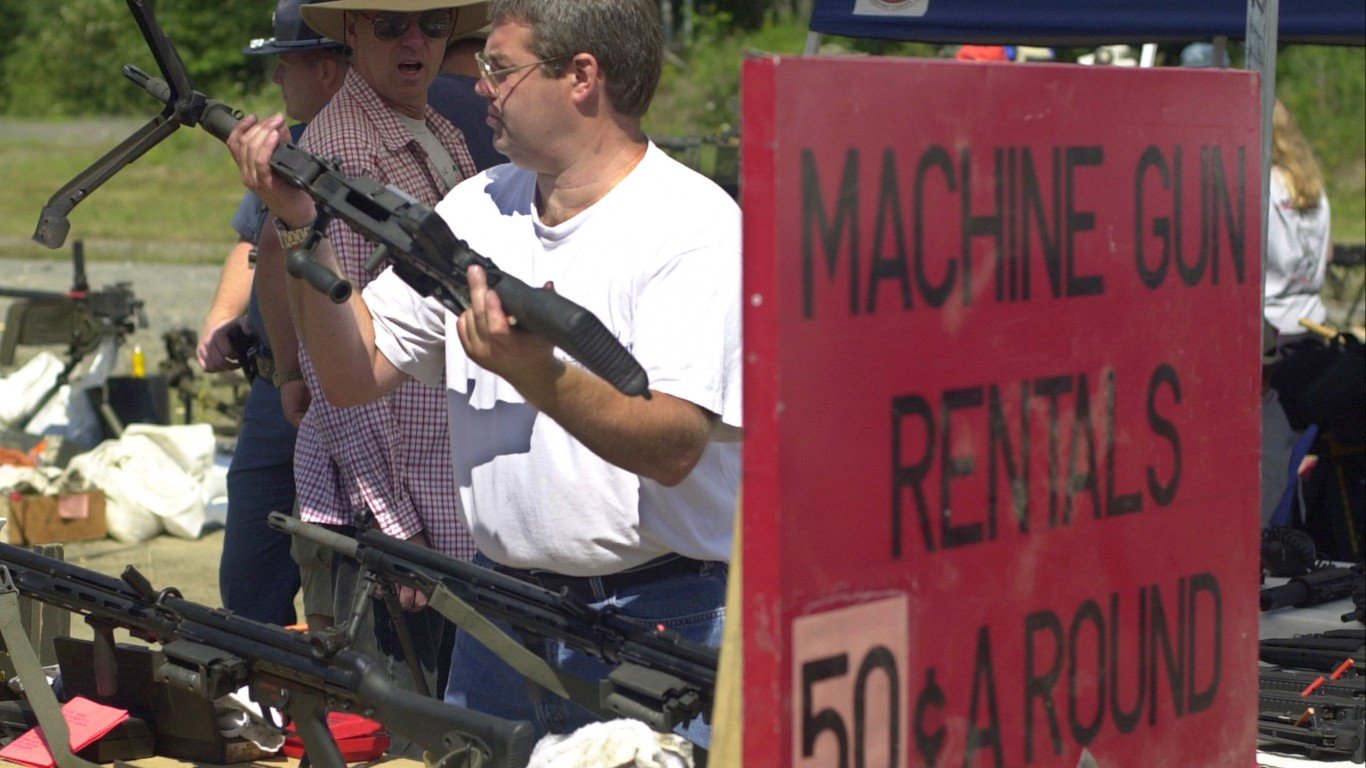
About 2.6 million firearm background checks were conducted in the United States in April, according to data compiled by the FBI. That figure represents a decrease of more than 300,000 checks compared to March but an increase of about 80,000 checks compared to April of last year. These checks, however, include background checks initiated for reasons that are not tied to the direct purchasing of a firearm, including rentals and pawn shop transactions.
To get closer to an accurate reflection of true gun sales, we excluded several categories of checks, including pawn shop transactions, returns, rentals, and rechecks, which are conducted periodically by some states on existing permit holders. After these adjustments, the remaining 1.7 million background checks – amounting to about 5.2 checks per 1,000 residents nationwide – are more likely to be tied to the sale of a gun.
To find the states where the most people bought guns last month, 24/7 Wall St. used data from the FBI’s National Instant Criminal Background Check System. States are ranked based on the number of gun background checks in April 2023 per 1,000 state residents. We adjusted the number of background checks by excluding the aforementioned categories that are not tied to the direct purchasing of a firearm. Even after removing these categories, background checks still only serve as a rough approximation of gun sales and they are likely over or under estimation in some states.
Click here to see states where the most people bought guns last month.
Click here to see our detailed methodology.
Based on last month’s background checks, states in the West had the highest gun sales per capita. All six top states for background checks per person are Western states. In the No. 1 state, Idaho, 24,505 checks were initiated last month, or 12.6 per 1,000 residents. On the other end of the list, the states with the fewest gun sales per person are either in the Northeast or in left-leaning Pacific states like Hawaii and California. Hawaii ranks lowest, with just 1,912 firearm background checks initiated last month in a state with 1.4 million people. (Also see: the states with the strictest gun laws.)
50. Hawaii
> Firearm background checks per 1,000 residents, Apr 2023: 1.3
> Firearm background checks, Apr 2023: 1,912 — the fewest
> Most common type of firearm check: No data available
> Firearm background checks per 1,000 residents, Apr 2022: 1.0 — the fewest
> Firearm background checks, Apr 2022: 1,450 — the fewest
> Change in background checks, Apr 2021- April 2022: +462 (+31.9% — 4th largest increase)
> 2022 Population: 1,440,196 — 11th smallest
[in-text-ad]
49. New Jersey
> Firearm background checks per 1,000 residents, Apr 2023: 1.4
> Firearm background checks, Apr 2023: 13,189 — 16th fewest
> Most common type of firearm check: Handguns
> Firearm background checks per 1,000 residents, Apr 2022: 1.5 — 2nd fewest
> Firearm background checks, Apr 2022: 13,711 — 16th fewest
> Change in background checks, Apr 2021- April 2022: -522 (-3.8% — 12th smallest decrease)
> 2022 Population: 9,261,699 — 11th largest
[recirclink id=1149324]
48. New York
> Firearm background checks per 1,000 residents, Apr 2023: 1.6
> Firearm background checks, Apr 2023: 31,008 — 21st most
> Most common type of firearm check: Long guns
> Firearm background checks per 1,000 residents, Apr 2022: 1.7 — 3rd fewest
> Firearm background checks, Apr 2022: 34,419 — 20th most
> Change in background checks, Apr 2021- April 2022: -3,411 (-9.9% — 9th largest decrease)
> 2022 Population: 19,677,151 — 4th largest
47. Rhode Island
> Firearm background checks per 1,000 residents, Apr 2023: 2.1
> Firearm background checks, Apr 2023: 2,250 — 2nd fewest
> Most common type of firearm check: Handguns
> Firearm background checks per 1,000 residents, Apr 2022: 2.2 — 4th fewest
> Firearm background checks, Apr 2022: 2,363 — 2nd fewest
> Change in background checks, Apr 2021- April 2022: -113 (-4.8% — 14th smallest decrease)
> 2022 Population: 1,093,734 — 7th smallest
[in-text-ad-2]
46. California
> Firearm background checks per 1,000 residents, Apr 2023: 2.6
> Firearm background checks, Apr 2023: 100,320 — 3rd most
> Most common type of firearm check: Handguns
> Firearm background checks per 1,000 residents, Apr 2022: 2.5 — 5th fewest
> Firearm background checks, Apr 2022: 98,709 — 4th most
> Change in background checks, Apr 2021- April 2022: +1,611 (+1.6% — 13th largest increase)
> 2022 Population: 39,029,342 — the largest

45. Massachusetts
> Firearm background checks per 1,000 residents, Apr 2023: 2.7
> Firearm background checks, Apr 2023: 18,755 — 22nd fewest
> Most common type of firearm check: Handguns
> Firearm background checks per 1,000 residents, Apr 2022: 2.6 — 6th fewest
> Firearm background checks, Apr 2022: 18,484 — 20th fewest
> Change in background checks, Apr 2021- April 2022: +271 (+1.5% — 15th largest increase)
> 2022 Population: 6,981,974 — 16th largest
[in-text-ad]
44. Iowa
> Firearm background checks per 1,000 residents, Apr 2023: 3.4
> Firearm background checks, Apr 2023: 10,843 — 11th fewest
> Most common type of firearm check: Handguns
> Firearm background checks per 1,000 residents, Apr 2022: 3.2 — 8th fewest
> Firearm background checks, Apr 2022: 10,158 — 11th fewest
> Change in background checks, Apr 2021- April 2022: +685 (+6.7% — 11th largest increase)
> 2022 Population: 3,200,517 — 20th smallest
[recirclink id=1191452]
43. Nebraska
> Firearm background checks per 1,000 residents, Apr 2023: 3.4
> Firearm background checks, Apr 2023: 6,725 — 8th fewest
> Most common type of firearm check: Long guns
> Firearm background checks per 1,000 residents, Apr 2022: 3.3 — 9th fewest
> Firearm background checks, Apr 2022: 6,465 — 7th fewest
> Change in background checks, Apr 2021- April 2022: +260 (+4.0% — 12th largest increase)
> 2022 Population: 1,967,923 — 14th smallest

42. Georgia
> Firearm background checks per 1,000 residents, Apr 2023: 3.8
> Firearm background checks, Apr 2023: 41,267 — 18th most
> Most common type of firearm check: Handguns
> Firearm background checks per 1,000 residents, Apr 2022: 4.1 — 12th fewest
> Firearm background checks, Apr 2022: 44,794 — 15th most
> Change in background checks, Apr 2021- April 2022: -3,527 (-7.9% — 12th largest decrease)
> 2022 Population: 10,912,876 — 8th largest
[in-text-ad-2]
41. Texas
> Firearm background checks per 1,000 residents, Apr 2023: 3.9
> Firearm background checks, Apr 2023: 118,321 — the most
> Most common type of firearm check: Handguns
> Firearm background checks per 1,000 residents, Apr 2022: 4.3 — 13th fewest
> Firearm background checks, Apr 2022: 129,198 — the most
> Change in background checks, Apr 2021- April 2022: -10,877 (-8.4% — 11th largest decrease)
> 2022 Population: 30,029,572 — 2nd largest
40. Nevada
> Firearm background checks per 1,000 residents, Apr 2023: 4.1
> Firearm background checks, Apr 2023: 13,025 — 15th fewest
> Most common type of firearm check: Handguns
> Firearm background checks per 1,000 residents, Apr 2022: 3.6 — 10th fewest
> Firearm background checks, Apr 2022: 11,423 — 12th fewest
> Change in background checks, Apr 2021- April 2022: +1,602 (+14.0% — 8th largest increase)
> 2022 Population: 3,177,772 — 19th smallest
[in-text-ad]
39. Ohio
> Firearm background checks per 1,000 residents, Apr 2023: 4.3
> Firearm background checks, Apr 2023: 50,760 — 10th most
> Most common type of firearm check: Handguns
> Firearm background checks per 1,000 residents, Apr 2022: 4.7 — 14th fewest
> Firearm background checks, Apr 2022: 54,895 — 10th most
> Change in background checks, Apr 2021- April 2022: -4,135 (-7.5% — 13th largest decrease)
> 2022 Population: 11,756,058 — 7th largest
[recirclink id=1159297]
38. South Carolina
> Firearm background checks per 1,000 residents, Apr 2023: 4.4
> Firearm background checks, Apr 2023: 23,221 — 24th fewest
> Most common type of firearm check: Handguns
> Firearm background checks per 1,000 residents, Apr 2022: 6.0 — 23rd fewest
> Firearm background checks, Apr 2022: 31,705 — 22nd most
> Change in background checks, Apr 2021- April 2022: -8,484 (-26.8% — 2nd largest decrease)
> 2022 Population: 5,282,634 — 23rd largest
37. Delaware
> Firearm background checks per 1,000 residents, Apr 2023: 4.5
> Firearm background checks, Apr 2023: 4,556 — 4th fewest
> Most common type of firearm check: Handguns
> Firearm background checks per 1,000 residents, Apr 2022: 4.7 — 15th fewest
> Firearm background checks, Apr 2022: 4,791 — 4th fewest
> Change in background checks, Apr 2021- April 2022: -235 (-4.9% — 16th smallest decrease)
> 2022 Population: 1,018,396 — 6th smallest
[in-text-ad-2]

36. Maryland
> Firearm background checks per 1,000 residents, Apr 2023: 4.5
> Firearm background checks, Apr 2023: 27,849 — 22nd most
> Most common type of firearm check: Handguns
> Firearm background checks per 1,000 residents, Apr 2022: 3.1 — 7th fewest
> Firearm background checks, Apr 2022: 18,984 — 22nd fewest
> Change in background checks, Apr 2021- April 2022: +8,865 (+46.7% — 3rd largest increase)
> 2022 Population: 6,164,660 — 19th largest
35. Kentucky
> Firearm background checks per 1,000 residents, Apr 2023: 4.5
> Firearm background checks, Apr 2023: 20,508 — 23rd fewest
> Most common type of firearm check: Handguns
> Firearm background checks per 1,000 residents, Apr 2022: 5.0 — 18th fewest
> Firearm background checks, Apr 2022: 22,719 — 24th fewest
> Change in background checks, Apr 2021- April 2022: -2,211 (-9.7% — 10th largest decrease)
> 2022 Population: 4,512,310 — 25th smallest
[in-text-ad]
34. Connecticut
> Firearm background checks per 1,000 residents, Apr 2023: 4.7
> Firearm background checks, Apr 2023: 17,070 — 20th fewest
> Most common type of firearm check: Handguns
> Firearm background checks per 1,000 residents, Apr 2022: 6.4 — 25th most
> Firearm background checks, Apr 2022: 23,104 — 25th fewest
> Change in background checks, Apr 2021- April 2022: -6,034 (-26.1% — 3rd largest decrease)
> 2022 Population: 3,626,205 — 22nd smallest
[recirclink id=1215627]
33. Kansas
> Firearm background checks per 1,000 residents, Apr 2023: 4.8
> Firearm background checks, Apr 2023: 14,071 — 18th fewest
> Most common type of firearm check: Handguns
> Firearm background checks per 1,000 residents, Apr 2022: 4.9 — 17th fewest
> Firearm background checks, Apr 2022: 14,443 — 18th fewest
> Change in background checks, Apr 2021- April 2022: -372 (-2.6% — 10th smallest decrease)
> 2022 Population: 2,937,150 — 16th smallest

32. Virginia
> Firearm background checks per 1,000 residents, Apr 2023: 5.1
> Firearm background checks, Apr 2023: 44,341 — 15th most
> Most common type of firearm check: Handguns
> Firearm background checks per 1,000 residents, Apr 2022: 5.2 — 19th fewest
> Firearm background checks, Apr 2022: 45,337 — 14th most
> Change in background checks, Apr 2021- April 2022: -996 (-2.2% — 7th smallest decrease)
> 2022 Population: 8,683,619 — 12th largest
[in-text-ad-2]
31. Florida
> Firearm background checks per 1,000 residents, Apr 2023: 5.3
> Firearm background checks, Apr 2023: 118,201 — 2nd most
> Most common type of firearm check: Handguns
> Firearm background checks per 1,000 residents, Apr 2022: 5.3 — 22nd fewest
> Firearm background checks, Apr 2022: 118,483 — 2nd most
> Change in background checks, Apr 2021- April 2022: -282 (-0.2% — 2nd smallest decrease)
> 2022 Population: 22,244,823 — 3rd largest
30. Arkansas
> Firearm background checks per 1,000 residents, Apr 2023: 5.3
> Firearm background checks, Apr 2023: 16,191 — 19th fewest
> Most common type of firearm check: Handguns
> Firearm background checks per 1,000 residents, Apr 2022: 5.2 — 20th fewest
> Firearm background checks, Apr 2022: 15,976 — 19th fewest
> Change in background checks, Apr 2021- April 2022: +215 (+1.3% — 16th largest increase)
> 2022 Population: 3,045,637 — 18th smallest
[in-text-ad]
29. Indiana
> Firearm background checks per 1,000 residents, Apr 2023: 5.4
> Firearm background checks, Apr 2023: 36,566 — 19th most
> Most common type of firearm check: Handguns
> Firearm background checks per 1,000 residents, Apr 2022: 6.0 — 24th fewest
> Firearm background checks, Apr 2022: 41,172 — 19th most
> Change in background checks, Apr 2021- April 2022: -4,606 (-11.2% — 7th largest decrease)
> 2022 Population: 6,833,037 — 17th largest
[recirclink id=1149324]
28. Louisiana
> Firearm background checks per 1,000 residents, Apr 2023: 5.4
> Firearm background checks, Apr 2023: 24,616 — 25th most
> Most common type of firearm check: Handguns
> Firearm background checks per 1,000 residents, Apr 2022: 5.3 — 21st fewest
> Firearm background checks, Apr 2022: 24,250 — 24th most
> Change in background checks, Apr 2021- April 2022: +366 (+1.5% — 14th largest increase)
> 2022 Population: 4,590,241 — 25th largest
27. Arizona
> Firearm background checks per 1,000 residents, Apr 2023: 5.6
> Firearm background checks, Apr 2023: 41,330 — 17th most
> Most common type of firearm check: Handguns
> Firearm background checks per 1,000 residents, Apr 2022: 8.0 — 11th most
> Firearm background checks, Apr 2022: 58,767 — 9th most
> Change in background checks, Apr 2021- April 2022: -17,437 (-29.7% — the largest decrease)
> 2022 Population: 7,359,197 — 14th largest
[in-text-ad-2]
26. Missouri
> Firearm background checks per 1,000 residents, Apr 2023: 5.7
> Firearm background checks, Apr 2023: 35,488 — 20th most
> Most common type of firearm check: Handguns
> Firearm background checks per 1,000 residents, Apr 2022: 6.9 — 19th most
> Firearm background checks, Apr 2022: 42,436 — 18th most
> Change in background checks, Apr 2021- April 2022: -6,948 (-16.4% — 5th largest decrease)
> 2022 Population: 6,177,957 — 18th largest
25. Mississippi
> Firearm background checks per 1,000 residents, Apr 2023: 5.8
> Firearm background checks, Apr 2023: 17,152 — 21st fewest
> Most common type of firearm check: Handguns
> Firearm background checks per 1,000 residents, Apr 2022: 6.5 — 22nd most
> Firearm background checks, Apr 2022: 19,111 — 23rd fewest
> Change in background checks, Apr 2021- April 2022: -1,959 (-10.3% — 8th largest decrease)
> 2022 Population: 2,940,057 — 17th smallest
[in-text-ad]
24. Vermont
> Firearm background checks per 1,000 residents, Apr 2023: 5.9
> Firearm background checks, Apr 2023: 3,833 — 3rd fewest
> Most common type of firearm check: Long guns
> Firearm background checks per 1,000 residents, Apr 2022: 6.1 — 25th fewest
> Firearm background checks, Apr 2022: 3,921 — 3rd fewest
> Change in background checks, Apr 2021- April 2022: -88 (-2.2% — 8th smallest decrease)
> 2022 Population: 647,064 — 2nd smallest
[recirclink id=1191452]

23. New Mexico
> Firearm background checks per 1,000 residents, Apr 2023: 6.0
> Firearm background checks, Apr 2023: 12,752 — 14th fewest
> Most common type of firearm check: Handguns
> Firearm background checks per 1,000 residents, Apr 2022: 6.4 — 24th most
> Firearm background checks, Apr 2022: 13,467 — 15th fewest
> Change in background checks, Apr 2021- April 2022: -715 (-5.3% — 17th smallest decrease)
> 2022 Population: 2,113,344 — 15th smallest
22. Illinois
> Firearm background checks per 1,000 residents, Apr 2023: 6.1
> Firearm background checks, Apr 2023: 76,572 — 7th most
> Most common type of firearm check: Handguns
> Firearm background checks per 1,000 residents, Apr 2022: 4.8 — 16th fewest
> Firearm background checks, Apr 2022: 60,398 — 8th most
> Change in background checks, Apr 2021- April 2022: +16,174 (+26.8% — 7th largest increase)
> 2022 Population: 12,582,032 — 6th largest
[in-text-ad-2]
21. Michigan
> Firearm background checks per 1,000 residents, Apr 2023: 6.1
> Firearm background checks, Apr 2023: 61,304 — 9th most
> Most common type of firearm check: Handguns
> Firearm background checks per 1,000 residents, Apr 2022: 6.5 — 23rd most
> Firearm background checks, Apr 2022: 64,993 — 7th most
> Change in background checks, Apr 2021- April 2022: -3,689 (-5.7% — 16th largest decrease)
> 2022 Population: 10,034,113 — 10th largest
20. Maine
> Firearm background checks per 1,000 residents, Apr 2023: 6.5
> Firearm background checks, Apr 2023: 8,999 — 10th fewest
> Most common type of firearm check: Handguns
> Firearm background checks per 1,000 residents, Apr 2022: 6.6 — 21st most
> Firearm background checks, Apr 2022: 9,172 — 10th fewest
> Change in background checks, Apr 2021- April 2022: -173 (-1.9% — 6th smallest decrease)
> 2022 Population: 1,385,340 — 9th smallest
[in-text-ad]

19. Oklahoma
> Firearm background checks per 1,000 residents, Apr 2023: 6.7
> Firearm background checks, Apr 2023: 27,011 — 23rd most
> Most common type of firearm check: Handguns
> Firearm background checks per 1,000 residents, Apr 2022: 6.8 — 20th most
> Firearm background checks, Apr 2022: 27,499 — 23rd most
> Change in background checks, Apr 2021- April 2022: -488 (-1.8% — 5th smallest decrease)
> 2022 Population: 4,019,800 — 23rd smallest
[recirclink id=1159297]
18. South Dakota
> Firearm background checks per 1,000 residents, Apr 2023: 6.8
> Firearm background checks, Apr 2023: 6,177 — 7th fewest
> Most common type of firearm check: Long guns
> Firearm background checks per 1,000 residents, Apr 2022: 7.8 — 15th most
> Firearm background checks, Apr 2022: 7,115 — 8th fewest
> Change in background checks, Apr 2021- April 2022: -938 (-13.2% — 6th largest decrease)
> 2022 Population: 909,824 — 5th smallest
17. North Carolina
> Firearm background checks per 1,000 residents, Apr 2023: 7.4
> Firearm background checks, Apr 2023: 79,484 — 6th most
> Most common type of firearm check: Handguns
> Firearm background checks per 1,000 residents, Apr 2022: 4.0 — 11th fewest
> Firearm background checks, Apr 2022: 43,086 — 17th most
> Change in background checks, Apr 2021- April 2022: +36,398 (+84.5% — the largest increase)
> 2022 Population: 10,698,973 — 9th largest
[in-text-ad-2]
16. Pennsylvania
> Firearm background checks per 1,000 residents, Apr 2023: 7.5
> Firearm background checks, Apr 2023: 97,151 — 4th most
> Most common type of firearm check: Handguns
> Firearm background checks per 1,000 residents, Apr 2022: 7.9 — 12th most
> Firearm background checks, Apr 2022: 102,153 — 3rd most
> Change in background checks, Apr 2021- April 2022: -5,002 (-4.9% — 15th smallest decrease)
> 2022 Population: 12,972,008 — 5th largest
15. Utah
> Firearm background checks per 1,000 residents, Apr 2023: 7.5
> Firearm background checks, Apr 2023: 25,391 — 24th most
> Most common type of firearm check: Handguns
> Firearm background checks per 1,000 residents, Apr 2022: 6.9 — 18th most
> Firearm background checks, Apr 2022: 23,343 — 25th most
> Change in background checks, Apr 2021- April 2022: +2,048 (+8.8% — 9th largest increase)
> 2022 Population: 3,380,800 — 21st smallest
[in-text-ad]
14. North Dakota
> Firearm background checks per 1,000 residents, Apr 2023: 7.7
> Firearm background checks, Apr 2023: 6,018 — 6th fewest
> Most common type of firearm check: Long guns
> Firearm background checks per 1,000 residents, Apr 2022: 7.7 — 16th most
> Firearm background checks, Apr 2022: 6,027 — 6th fewest
> Change in background checks, Apr 2021- April 2022: -09 (-0.1% — the smallest decrease)
> 2022 Population: 779,261 — 4th smallest
[recirclink id=1215627]
13. West Virginia
> Firearm background checks per 1,000 residents, Apr 2023: 7.8
> Firearm background checks, Apr 2023: 13,776 — 17th fewest
> Most common type of firearm check: Long guns
> Firearm background checks per 1,000 residents, Apr 2022: 7.8 — 13th most
> Firearm background checks, Apr 2022: 13,914 — 17th fewest
> Change in background checks, Apr 2021- April 2022: -138 (-1.0% — 3rd smallest decrease)
> 2022 Population: 1,775,156 — 12th smallest
12. Minnesota
> Firearm background checks per 1,000 residents, Apr 2023: 7.9
> Firearm background checks, Apr 2023: 45,008 — 14th most
> Most common type of firearm check: Long guns
> Firearm background checks per 1,000 residents, Apr 2022: 8.2 — 10th most
> Firearm background checks, Apr 2022: 46,940 — 13th most
> Change in background checks, Apr 2021- April 2022: -1,932 (-4.1% — 13th smallest decrease)
> 2022 Population: 5,717,184 — 22nd largest
[in-text-ad-2]

11. Colorado
> Firearm background checks per 1,000 residents, Apr 2023: 8.1
> Firearm background checks, Apr 2023: 47,276 — 13th most
> Most common type of firearm check: Handguns
> Firearm background checks per 1,000 residents, Apr 2022: 7.5 — 17th most
> Firearm background checks, Apr 2022: 43,740 — 16th most
> Change in background checks, Apr 2021- April 2022: +3,536 (+8.1% — 10th largest increase)
> 2022 Population: 5,839,926 — 21st largest
10. New Hampshire
> Firearm background checks per 1,000 residents, Apr 2023: 8.2
> Firearm background checks, Apr 2023: 11,418 — 12th fewest
> Most common type of firearm check: Handguns
> Firearm background checks per 1,000 residents, Apr 2022: 8.4 — 8th most
> Firearm background checks, Apr 2022: 11,712 — 13th fewest
> Change in background checks, Apr 2021- April 2022: -294 (-2.5% — 9th smallest decrease)
> 2022 Population: 1,395,231 — 10th smallest
[in-text-ad]
9. Alabama
> Firearm background checks per 1,000 residents, Apr 2023: 8.5
> Firearm background checks, Apr 2023: 42,940 — 16th most
> Most common type of firearm check: Handguns
> Firearm background checks per 1,000 residents, Apr 2022: 10.2 — 2nd most
> Firearm background checks, Apr 2022: 51,585 — 12th most
> Change in background checks, Apr 2021- April 2022: -8,645 (-16.8% — 4th largest decrease)
> 2022 Population: 5,074,296 — 24th largest
[recirclink id=1149324]
8. Wisconsin
> Firearm background checks per 1,000 residents, Apr 2023: 8.5
> Firearm background checks, Apr 2023: 50,265 — 11th most
> Most common type of firearm check: Handguns
> Firearm background checks per 1,000 residents, Apr 2022: 9.1 — 7th most
> Firearm background checks, Apr 2022: 53,406 — 11th most
> Change in background checks, Apr 2021- April 2022: -3,141 (-5.9% — 15th largest decrease)
> 2022 Population: 5,892,539 — 20th largest
7. Tennessee
> Firearm background checks per 1,000 residents, Apr 2023: 8.9
> Firearm background checks, Apr 2023: 62,631 — 8th most
> Most common type of firearm check: Handguns
> Firearm background checks per 1,000 residents, Apr 2022: 9.5 — 6th most
> Firearm background checks, Apr 2022: 67,230 — 5th most
> Change in background checks, Apr 2021- April 2022: -4,599 (-6.8% — 14th largest decrease)
> 2022 Population: 7,051,339 — 15th largest
[in-text-ad-2]

6. Wyoming
> Firearm background checks per 1,000 residents, Apr 2023: 9.3
> Firearm background checks, Apr 2023: 5,408 — 5th fewest
> Most common type of firearm check: Handguns
> Firearm background checks per 1,000 residents, Apr 2022: 9.6 — 5th most
> Firearm background checks, Apr 2022: 5,560 — 5th fewest
> Change in background checks, Apr 2021- April 2022: -152 (-2.7% — 11th smallest decrease)
> 2022 Population: 581,381 — the smallest
5. Alaska
> Firearm background checks per 1,000 residents, Apr 2023: 9.4
> Firearm background checks, Apr 2023: 6,912 — 9th fewest
> Most common type of firearm check: Handguns
> Firearm background checks per 1,000 residents, Apr 2022: 10.0 — 3rd most
> Firearm background checks, Apr 2022: 7,318 — 9th fewest
> Change in background checks, Apr 2021- April 2022: -406 (-5.5% — 17th largest decrease)
> 2022 Population: 733,583 — 3rd smallest
[in-text-ad]
4. Montana
> Firearm background checks per 1,000 residents, Apr 2023: 10.4
> Firearm background checks, Apr 2023: 11,627 — 13th fewest
> Most common type of firearm check: Long guns
> Firearm background checks per 1,000 residents, Apr 2022: 10.5 — the most
> Firearm background checks, Apr 2022: 11,789 — 14th fewest
> Change in background checks, Apr 2021- April 2022: -162 (-1.4% — 4th smallest decrease)
> 2022 Population: 1,122,867 — 8th smallest
[recirclink id=1191452]
3. Washington
> Firearm background checks per 1,000 residents, Apr 2023: 11.0
> Firearm background checks, Apr 2023: 85,459 — 5th most
> Most common type of firearm check: Handguns
> Firearm background checks per 1,000 residents, Apr 2022: 8.4 — 9th most
> Firearm background checks, Apr 2022: 65,310 — 6th most
> Change in background checks, Apr 2021- April 2022: +20,149 (+30.9% — 5th largest increase)
> 2022 Population: 7,785,786 — 13th largest

2. Oregon
> Firearm background checks per 1,000 residents, Apr 2023: 11.7
> Firearm background checks, Apr 2023: 49,724 — 12th most
> Most common type of firearm check: Handguns
> Firearm background checks per 1,000 residents, Apr 2022: 7.8 — 14th most
> Firearm background checks, Apr 2022: 33,192 — 21st most
> Change in background checks, Apr 2021- April 2022: +16,532 (+49.8% — 2nd largest increase)
> 2022 Population: 4,240,137 — 24th smallest
[in-text-ad-2]
1. Idaho
> Firearm background checks per 1,000 residents, Apr 2023: 12.6
> Firearm background checks, Apr 2023: 24,505 — 25th fewest
> Most common type of firearm check: Handguns
> Firearm background checks per 1,000 residents, Apr 2022: 9.7 — 4th most
> Firearm background checks, Apr 2022: 18,862 — 21st fewest
> Change in background checks, Apr 2021- April 2022: +5,643 (+29.9% — 6th largest increase)
> 2022 Population: 1,939,033 — 13th smallest
Methodology:
To find the states where the most people bought guns last month, 24/7 Wall St. used FBI data from its National Instant Criminal Background Check System. To get a more accurate approximation of gun sales, we excluded several categories of checks, including pawn shop transactions, returns, rentals, and rechecks, which are conducted periodically by some states on existing permit holders. We ranked states based on the number of gun checks in April 2023 per 1,000 people in each state.
Even after removing some types of checks that are clearly unrelated to a new firearm purchase, because every state has different laws in terms of when background checks are required and different accounting practices, background checks still only serve as a rough approximation of gun sales.
The most glaring example of this is Illinois, which alone accounted for about half of the background checks in the country after excluding the aforementioned categories. Illinois no longer breaks down background checks separately, but did from July 2016 through July 2021. During the four full years of data, an average of 9.2% of Illinois’s non-private sale or gun-specific permit checks were non-rechecks. We applied that average to the most recent state figures to estimate Illinois’ count. This was done only because Illinois is such a glaring example of inconsistency and because there was historical data to produce an estimate.
There are likely other states for which the background check figures listed are inflated or underestimated proxies for gun sales.
Population data came from the U.S. Census Bureau’s Population and Housing Unit Estimates Program, and are for July of 2022, the most recent data available.
Contact [email protected] for any questions or corrections.