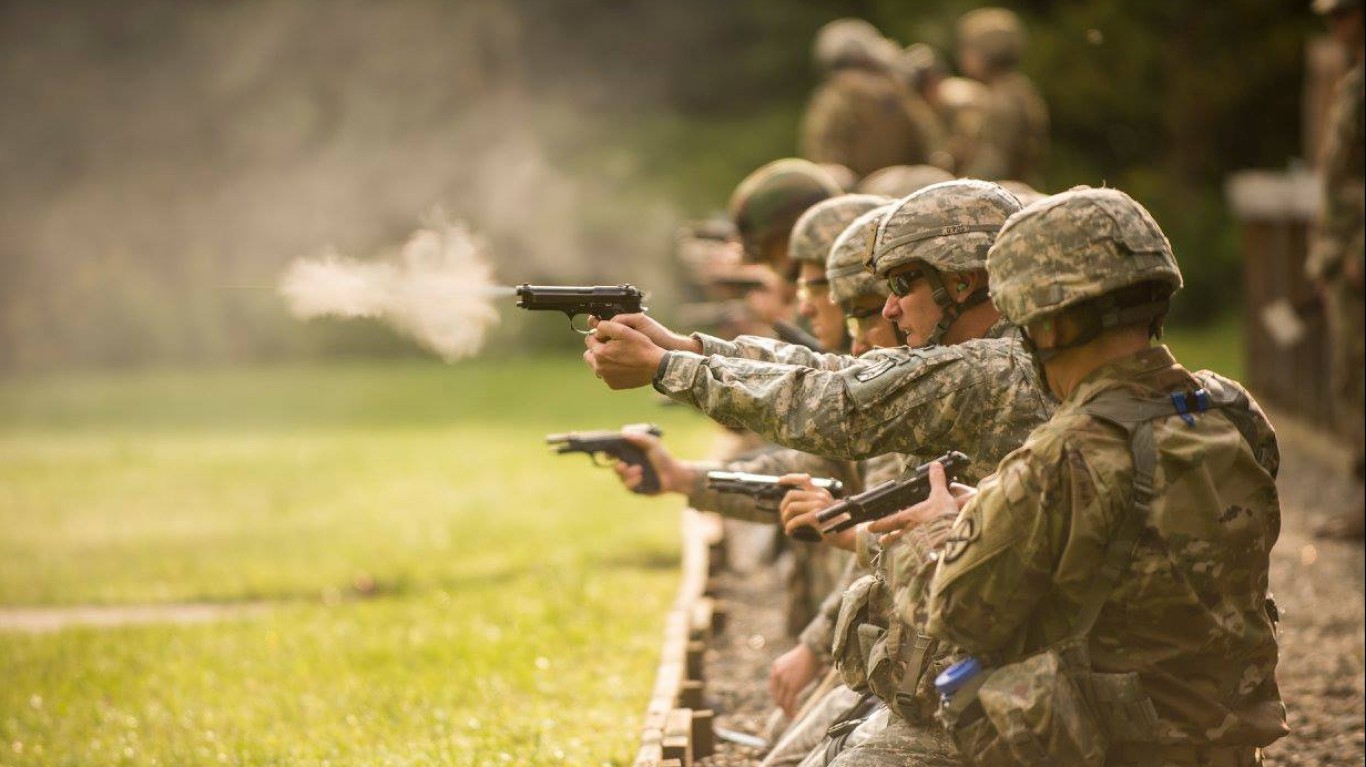
Tennessee continues to reel from the school shooting last week that left three children and three faculty dead. That event was just the latest mass killing in the United States – an event which has been a near-weekly occurrence this year. At the time of this writing, there have been 13 mass murders – shootings leaving at least four innocent people dead – this year, and 128 more events, in which four or more people are shot but there were no fatalities.
The country is on track to come close to the 690 such incidents in 2021, the record in the decade since the Gun Violence Archive began tracking these events, and likely of all time. Enacting some gun control measures last year, President Joe Biden signed into law a measure that enhances background checks for those under the age of 21. But with that, he told reporters last month, ““I have gone the full extent of my executive authority to do, on my own, anything about guns.”
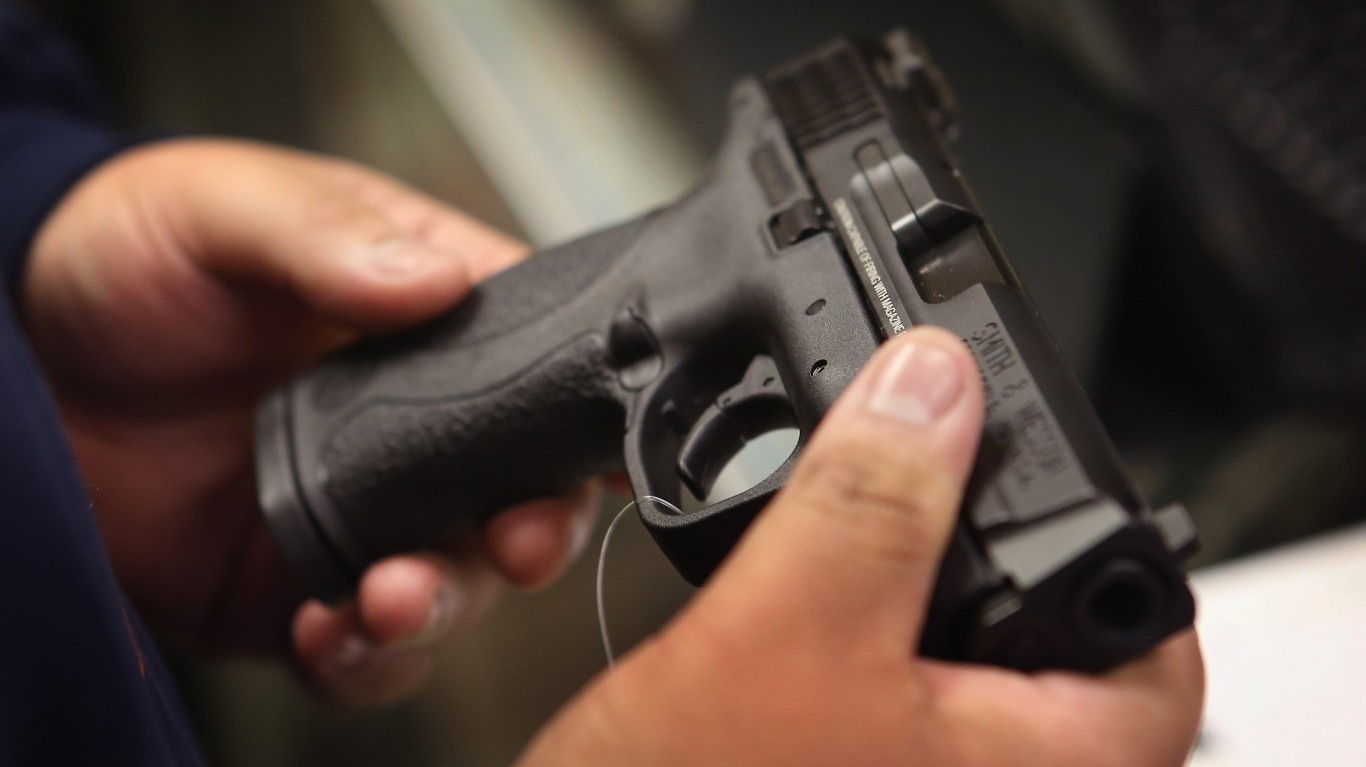
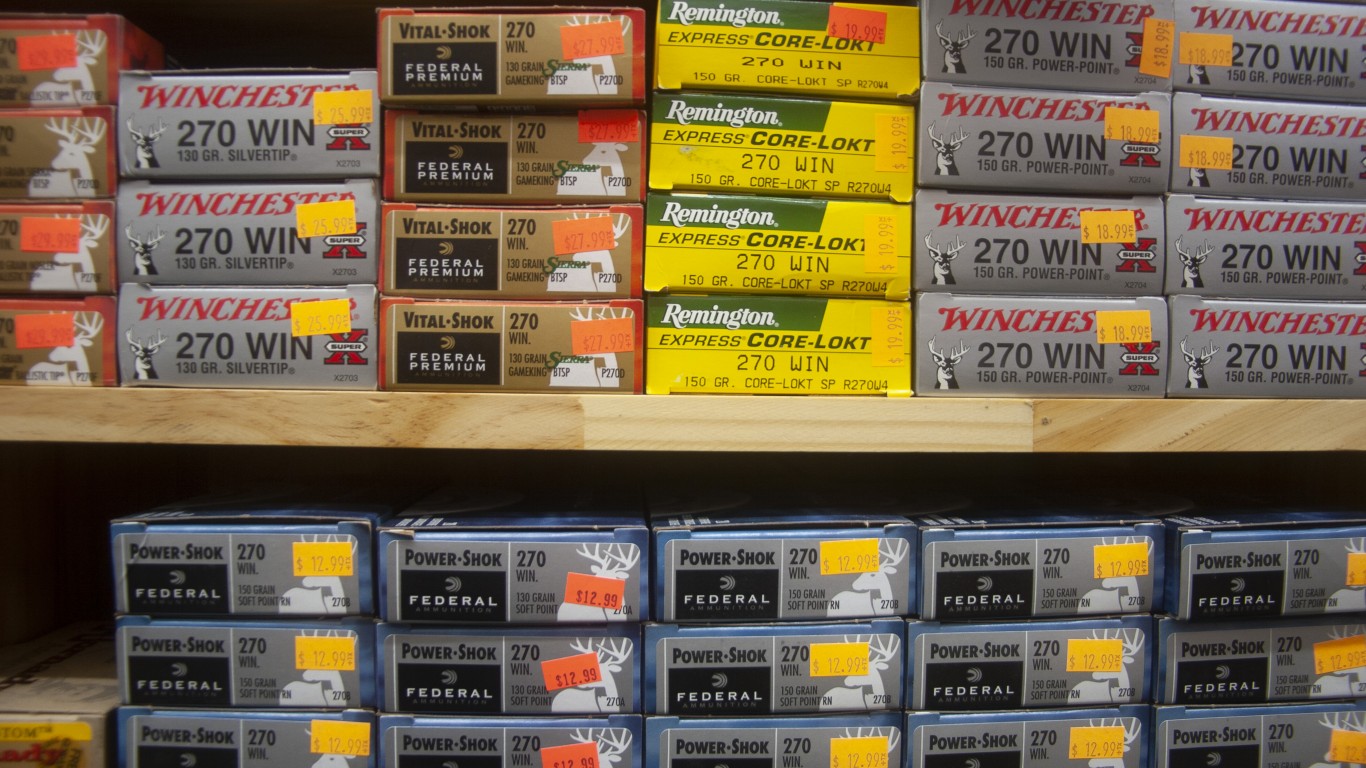
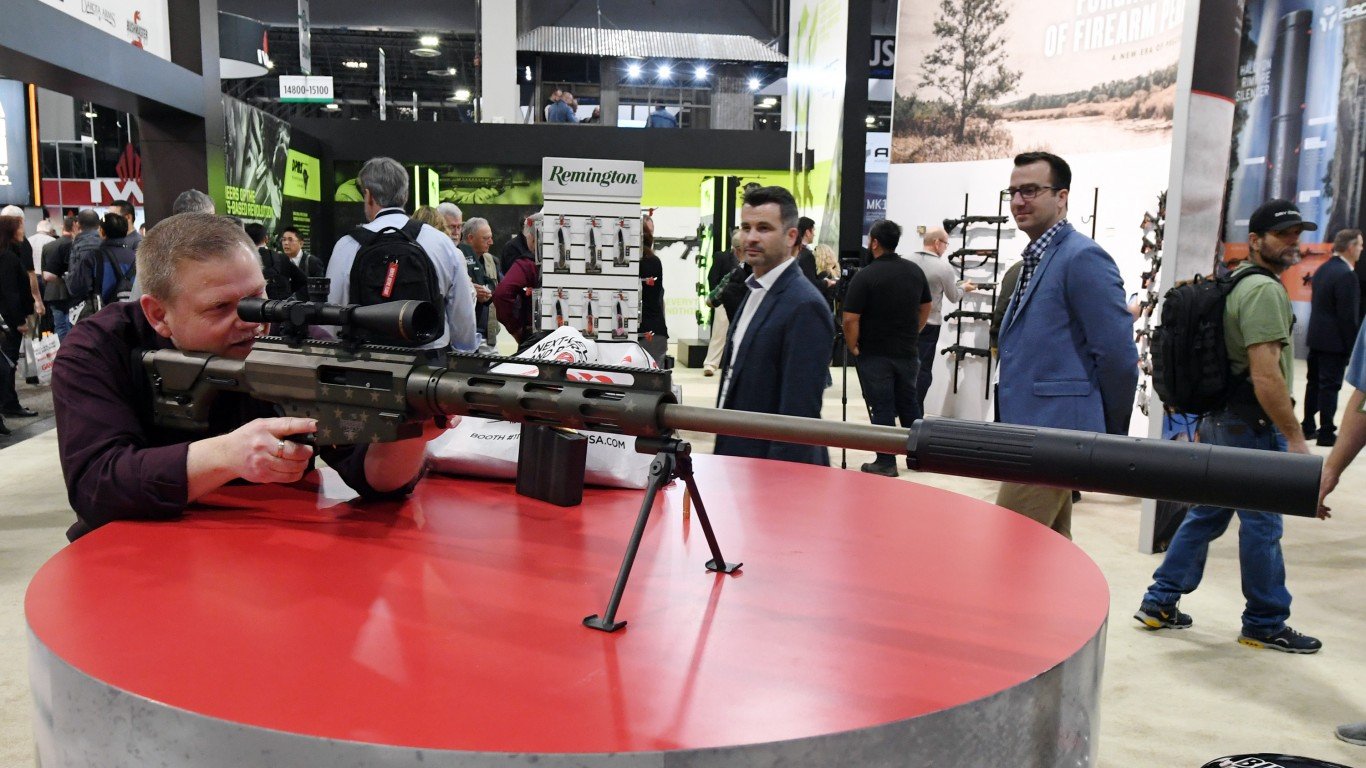
In March, just under three million firearm background checks were conducted in the United States, according to data compiled by the FBI. That figure represents a substantial increase of more than 450,000 checks, or 18%, more than the 2.5 million that were conducted in February. But last month’s figure is more or less in line with that of March of 2022.
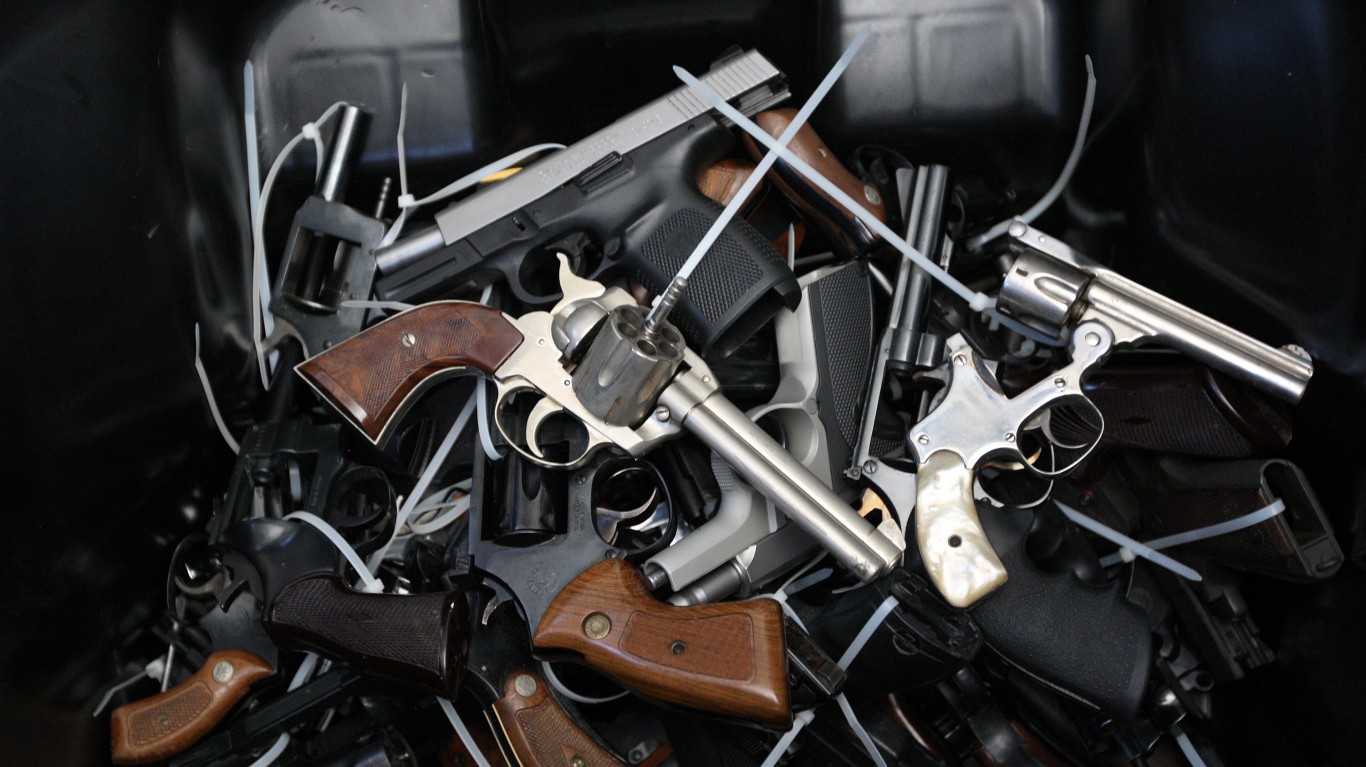
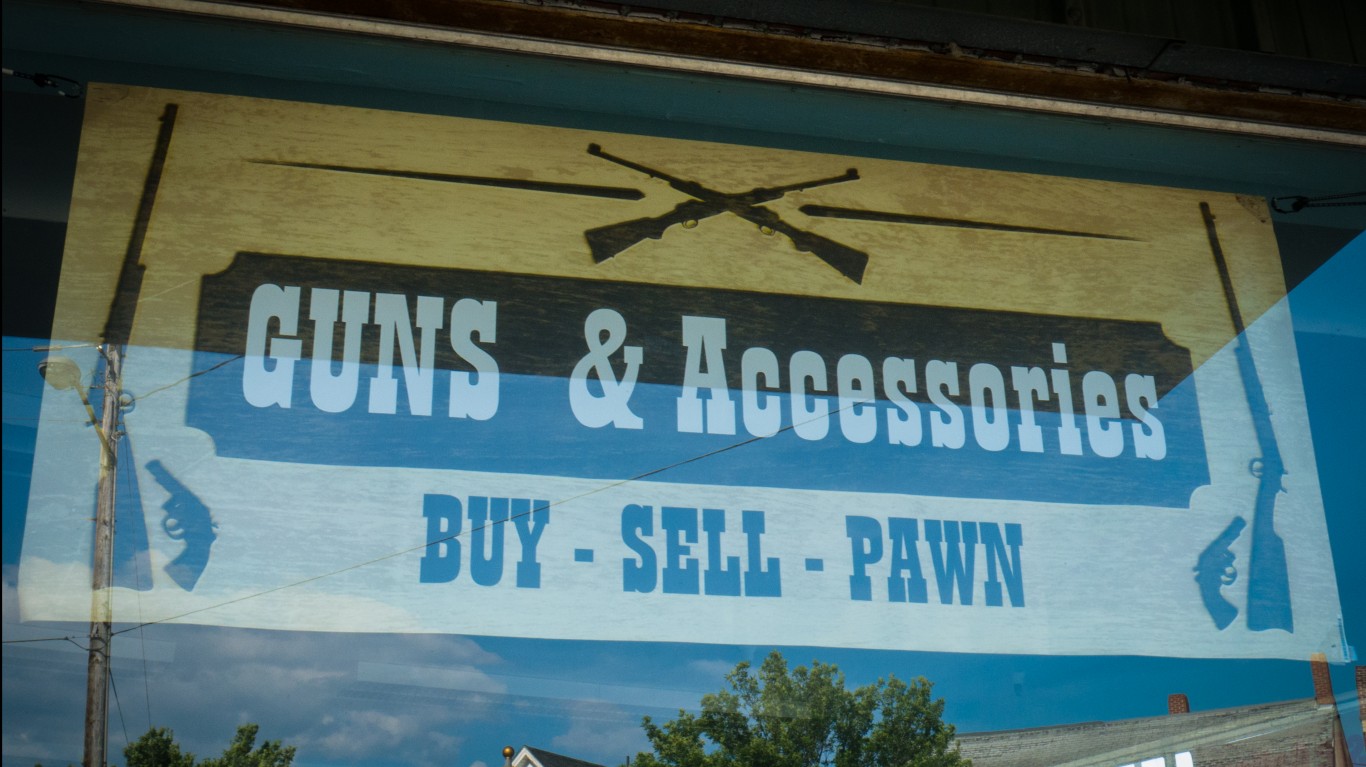
Background checks are often used to approximate the level of gun sales. However, checks can also be initiated for reasons that are not tied to gun sales, including rentals and pawn shop transactions. (See the best-selling guns last year.)
To find the states where the most people bought guns last month, 24/7 Wall St. used data from the FBI’s National Instant Criminal Background Check System. States are ranked based on the number of gun background checks in March 2023 per 1,000 people in each state. To get closer to an accurate reflection of true gun sales, we excluded several categories of checks, including pawn shop transactions, returns, rentals, and rechecks, which are conducted periodically by some states on existing permit holders. After these adjustments, the remaining 2 million background checks – amounting to about 5.9 checks per 1,000 residents nationwide – are more likely to be tied to the sale of a gun.
Click here to see a detailed methodology.
Click here to see the states where the most people bought guns last month.
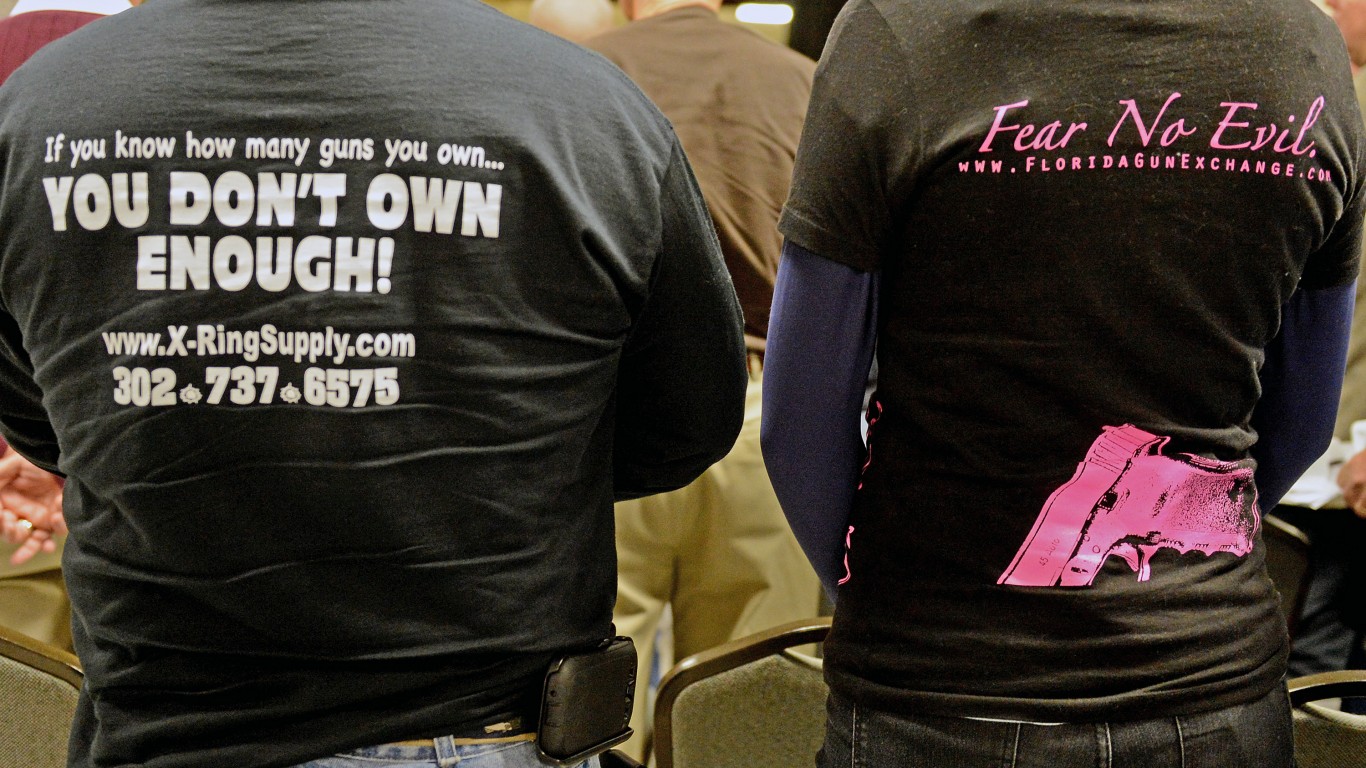
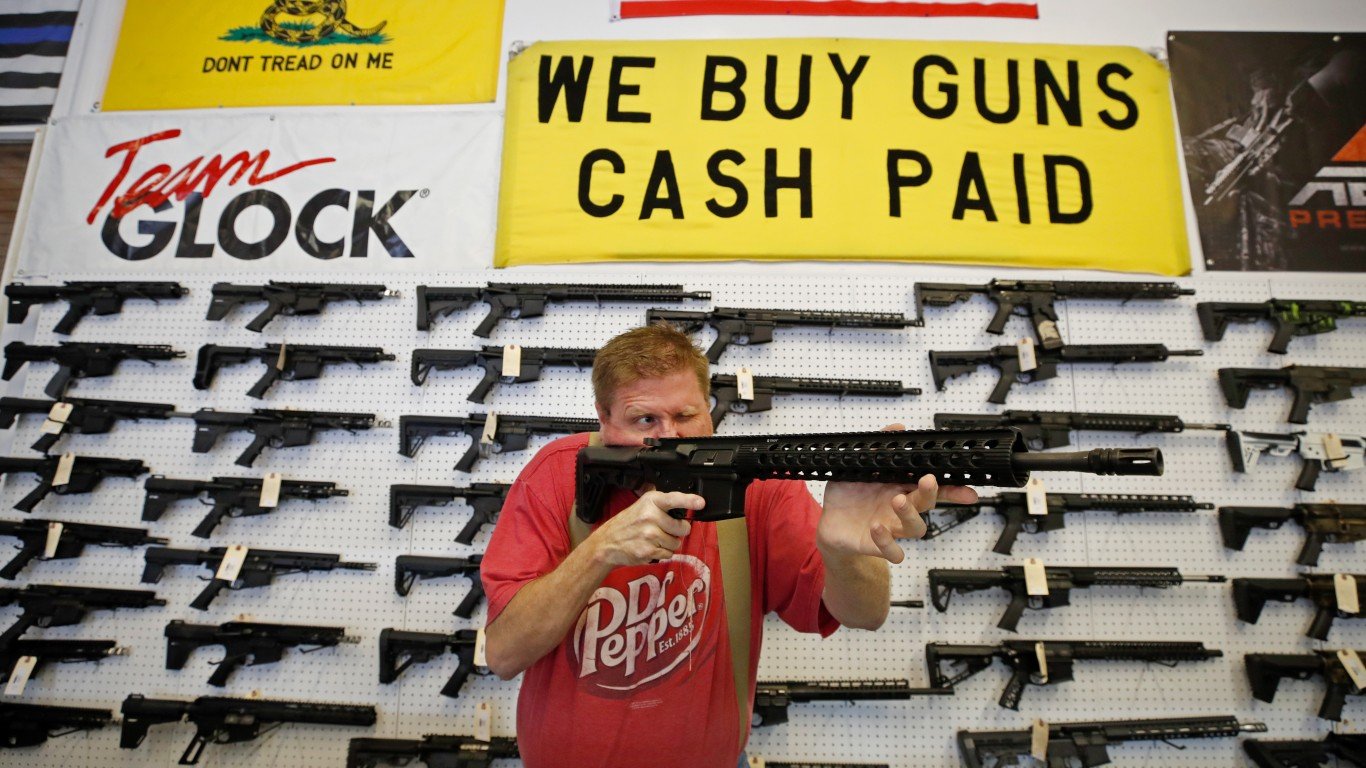
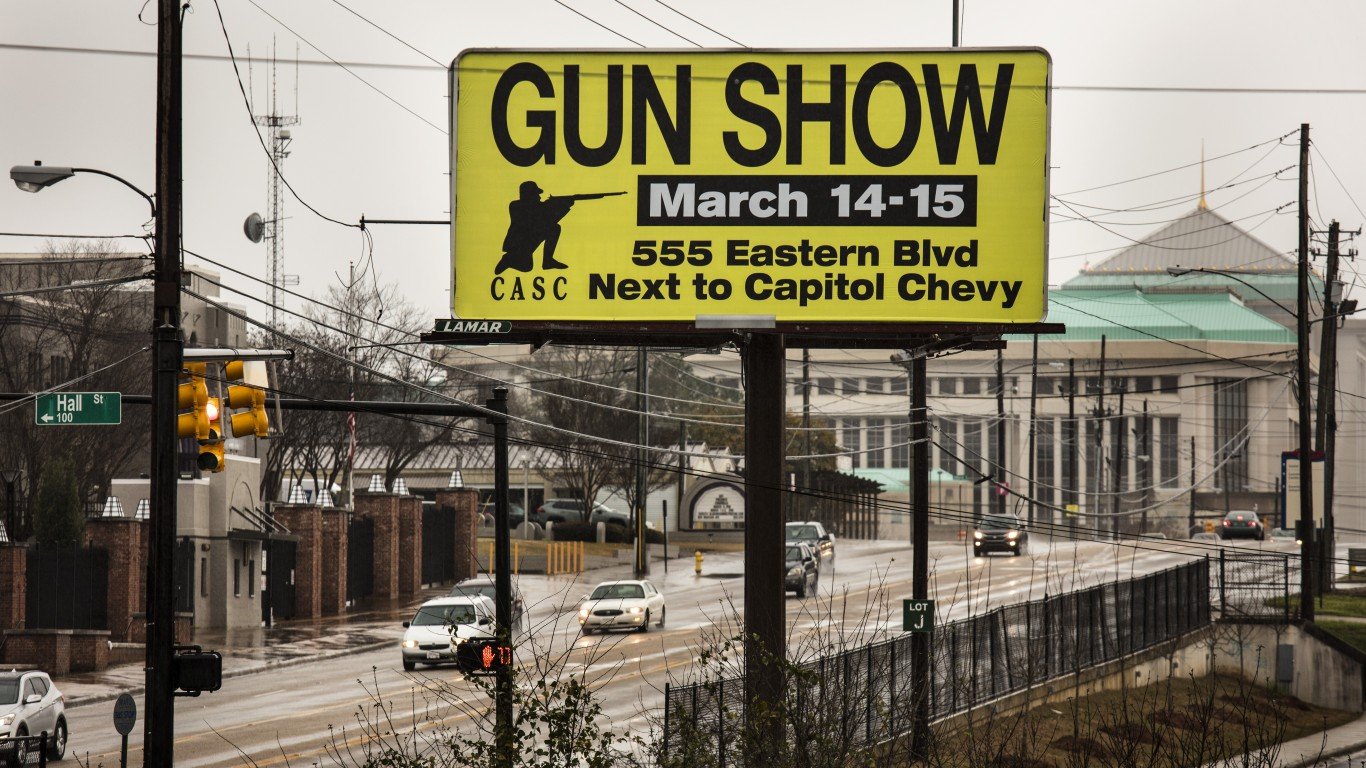
Firearm background checks are a frequent key topic in the debate over gun control policy in the United States. Currently, the federal government only requires background checks before the sale of guns at federally licensed arms dealers and not at private gun shops. Many states have their own additional policies. Fifteen states (and Washington, D.C.) required a criminal background check for the sale of all firearms, and another four mandate checks only for the sale of handguns. (These are the countries Americans buy the most handguns from.)
Based on March’s background checks data, states in the Midwest, the South, and the West bought the most guns per capita. On the other end of the list, four of the six states with the fewest background checks per 1,000 residents were in the Northeast. Hawaii ranked lowest, with just 1,722 permit checks initiated, or 1.6 per 1,000 people.
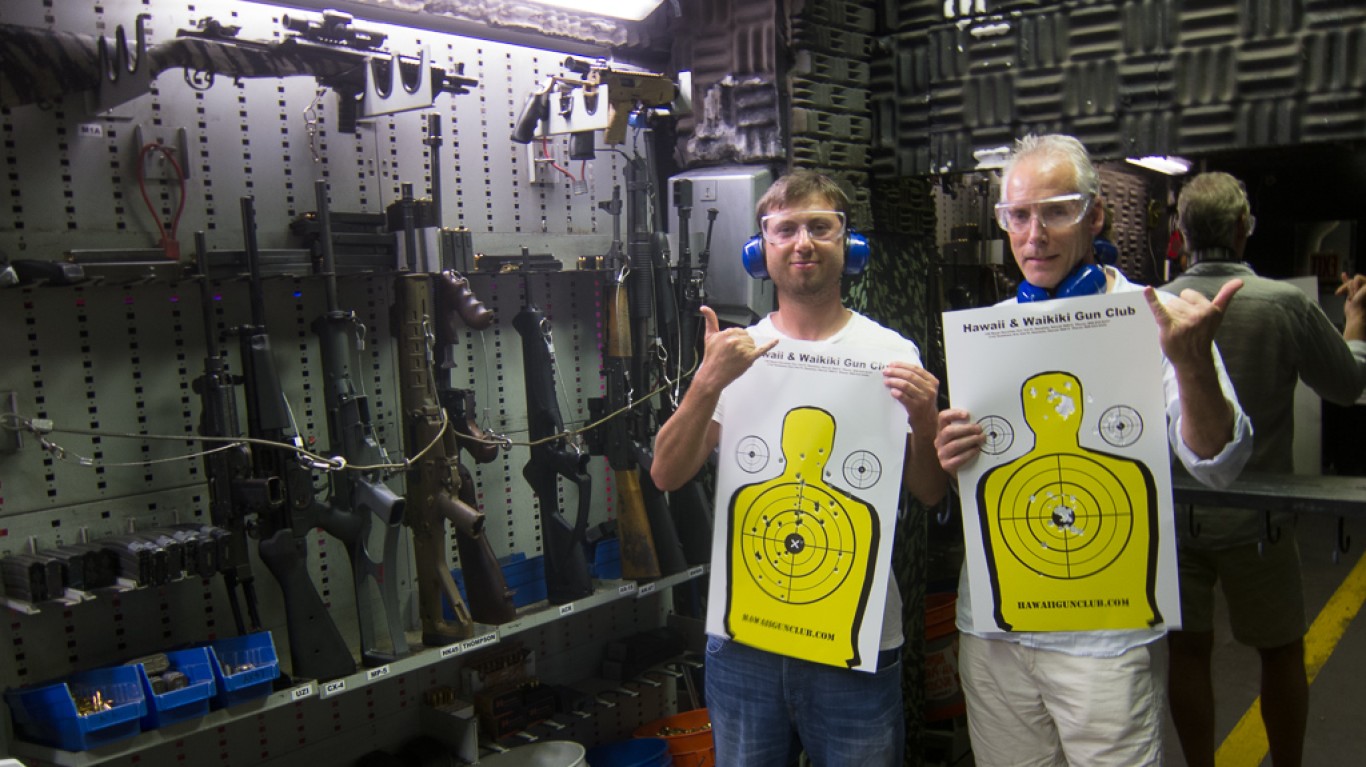
50. Hawaii
> Firearm background checks per 1,000 residents, Mar 2023: 1.6
> Firearm background checks, Mar 2023: 2,307 — the fewest
> Most common type of firearm check: No data available
> Firearm background checks per 1,000 residents, Mar 2022: 1.2 — the fewest
> Firearm background checks, Mar 2022: 1,779 — the fewest
> Change in background checks, Mar 2021- Mar 2022: +528 (+29.7% — 3rd largest increase)
> 2022 Population: 1,440,196 — 11th smallest
[in-text-ad]
49. New York
> Firearm background checks per 1,000 residents, Mar 2023: 1.8
> Firearm background checks, Mar 2023: 35,483 — 22nd most
> Most common type of firearm check: Long guns
> Firearm background checks per 1,000 residents, Mar 2022: 2.1 — 3rd fewest
> Firearm background checks, Mar 2022: 40,404 — 21st most
> Change in background checks, Mar 2021- Mar 2022: -4,921 (-12.2% — 17th largest decrease)
> 2022 Population: 19,677,151 — 4th largest
[recirclink id=1207370]
48. New Jersey
> Firearm background checks per 1,000 residents, Mar 2023: 1.8
> Firearm background checks, Mar 2023: 16,704 — 17th fewest
> Most common type of firearm check: Handguns
> Firearm background checks per 1,000 residents, Mar 2022: 1.9 — 2nd fewest
> Firearm background checks, Mar 2022: 17,166 — 15th fewest
> Change in background checks, Mar 2021- Mar 2022: -462 (-2.7% — 5th smallest decrease)
> 2022 Population: 9,261,699 — 11th largest
47. Rhode Island
> Firearm background checks per 1,000 residents, Mar 2023: 2.2
> Firearm background checks, Mar 2023: 2,432 — 2nd fewest
> Most common type of firearm check: Handguns
> Firearm background checks per 1,000 residents, Mar 2022: 2.9 — 4th fewest
> Firearm background checks, Mar 2022: 3,122 — 2nd fewest
> Change in background checks, Mar 2021- Mar 2022: -690 (-22.1% — 4th largest decrease)
> 2022 Population: 1,093,734 — 7th smallest
[in-text-ad-2]
46. California
> Firearm background checks per 1,000 residents, Mar 2023: 2.8
> Firearm background checks, Mar 2023: 111,119 — 4th most
> Most common type of firearm check: Handguns
> Firearm background checks per 1,000 residents, Mar 2022: 2.9 — 5th fewest
> Firearm background checks, Mar 2022: 112,100 — 4th most
> Change in background checks, Mar 2021- Mar 2022: -981 (-0.9% — 3rd smallest decrease)
> 2022 Population: 39,029,342 — the largest

45. Massachusetts
> Firearm background checks per 1,000 residents, Mar 2023: 3.1
> Firearm background checks, Mar 2023: 21,850 — 23rd fewest
> Most common type of firearm check: Handguns
> Firearm background checks per 1,000 residents, Mar 2022: 3.4 — 6th fewest
> Firearm background checks, Mar 2022: 23,672 — 22nd fewest
> Change in background checks, Mar 2021- Mar 2022: -1,822 (-7.7% — 9th smallest decrease)
> 2022 Population: 6,981,974 — 16th largest
[in-text-ad]
44. Nebraska
> Firearm background checks per 1,000 residents, Mar 2023: 4.3
> Firearm background checks, Mar 2023: 8,450 — 9th fewest
> Most common type of firearm check: Long guns
> Firearm background checks per 1,000 residents, Mar 2022: 4.0 — 8th fewest
> Firearm background checks, Mar 2022: 7,909 — 8th fewest
> Change in background checks, Mar 2021- Mar 2022: +541 (+6.8% — 4th smallest increase)
> 2022 Population: 1,967,923 — 14th smallest
[recirclink id=1207112]
43. Nevada
> Firearm background checks per 1,000 residents, Mar 2023: 4.3
> Firearm background checks, Mar 2023: 13,665 — 13th fewest
> Most common type of firearm check: Handguns
> Firearm background checks per 1,000 residents, Mar 2022: 4.9 — 10th fewest
> Firearm background checks, Mar 2022: 15,438 — 14th fewest
> Change in background checks, Mar 2021- Mar 2022: -1,773 (-11.5% — 19th largest decrease)
> 2022 Population: 3,177,772 — 19th smallest
42. Delaware
> Firearm background checks per 1,000 residents, Mar 2023: 4.5
> Firearm background checks, Mar 2023: 4,551 — 4th fewest
> Most common type of firearm check: Handguns
> Firearm background checks per 1,000 residents, Mar 2022: 5.6 — 13th fewest
> Firearm background checks, Mar 2022: 5,684 — 4th fewest
> Change in background checks, Mar 2021- Mar 2022: -1,133 (-19.9% — 5th largest decrease)
> 2022 Population: 1,018,396 — 6th smallest
[in-text-ad-2]

41. Texas
> Firearm background checks per 1,000 residents, Mar 2023: 4.7
> Firearm background checks, Mar 2023: 139,942 — the most
> Most common type of firearm check: Handguns
> Firearm background checks per 1,000 residents, Mar 2022: 5.3 — 11th fewest
> Firearm background checks, Mar 2022: 158,102 — the most
> Change in background checks, Mar 2021- Mar 2022: -18,160 (-11.5% — 18th largest decrease)
> 2022 Population: 30,029,572 — 2nd largest
40. Iowa
> Firearm background checks per 1,000 residents, Mar 2023: 4.7
> Firearm background checks, Mar 2023: 15,091 — 14th fewest
> Most common type of firearm check: Long guns
> Firearm background checks per 1,000 residents, Mar 2022: 4.5 — 9th fewest
> Firearm background checks, Mar 2022: 14,267 — 13th fewest
> Change in background checks, Mar 2021- Mar 2022: +824 (+5.8% — 3rd smallest increase)
> 2022 Population: 3,200,517 — 20th smallest
[in-text-ad]

39. Georgia
> Firearm background checks per 1,000 residents, Mar 2023: 4.8
> Firearm background checks, Mar 2023: 52,381 — 15th most
> Most common type of firearm check: Handguns
> Firearm background checks per 1,000 residents, Mar 2022: 5.5 — 12th fewest
> Firearm background checks, Mar 2022: 60,410 — 13th most
> Change in background checks, Mar 2021- Mar 2022: -8,029 (-13.3% — 15th largest decrease)
> 2022 Population: 10,912,876 — 8th largest
[recirclink id=1205786]

38. Ohio
> Firearm background checks per 1,000 residents, Mar 2023: 5.3
> Firearm background checks, Mar 2023: 62,130 — 10th most
> Most common type of firearm check: Handguns
> Firearm background checks per 1,000 residents, Mar 2022: 6.1 — 16th fewest
> Firearm background checks, Mar 2022: 71,815 — 10th most
> Change in background checks, Mar 2021- Mar 2022: -9,685 (-13.5% — 14th largest decrease)
> 2022 Population: 11,756,058 — 7th largest
37. Louisiana
> Firearm background checks per 1,000 residents, Mar 2023: 5.4
> Firearm background checks, Mar 2023: 24,752 — 24th fewest
> Most common type of firearm check: Handguns
> Firearm background checks per 1,000 residents, Mar 2022: 7.5 — 24th fewest
> Firearm background checks, Mar 2022: 34,202 — 23rd most
> Change in background checks, Mar 2021- Mar 2022: -9,450 (-27.6% — the largest decrease)
> 2022 Population: 4,590,241 — 25th largest
[in-text-ad-2]

36. Florida
> Firearm background checks per 1,000 residents, Mar 2023: 5.5
> Firearm background checks, Mar 2023: 122,130 — 2nd most
> Most common type of firearm check: Handguns
> Firearm background checks per 1,000 residents, Mar 2022: 6.0 — 15th fewest
> Firearm background checks, Mar 2022: 134,324 — 2nd most
> Change in background checks, Mar 2021- Mar 2022: -12,194 (-9.1% — 16th smallest decrease)
> 2022 Population: 22,244,823 — 3rd largest
35. Kansas
> Firearm background checks per 1,000 residents, Mar 2023: 5.5
> Firearm background checks, Mar 2023: 16,226 — 16th fewest
> Most common type of firearm check: Handguns
> Firearm background checks per 1,000 residents, Mar 2022: 6.4 — 20th fewest
> Firearm background checks, Mar 2022: 18,767 — 18th fewest
> Change in background checks, Mar 2021- Mar 2022: -2,541 (-13.5% — 13th largest decrease)
> 2022 Population: 2,937,150 — 16th smallest
[in-text-ad]
34. Kentucky
> Firearm background checks per 1,000 residents, Mar 2023: 5.6
> Firearm background checks, Mar 2023: 25,105 — 25th fewest
> Most common type of firearm check: Handguns
> Firearm background checks per 1,000 residents, Mar 2022: 6.7 — 21st fewest
> Firearm background checks, Mar 2022: 30,264 — 25th most
> Change in background checks, Mar 2021- Mar 2022: -5,159 (-17.0% — 8th largest decrease)
> 2022 Population: 4,512,310 — 25th smallest
[recirclink id=1204832]

33. Virginia
> Firearm background checks per 1,000 residents, Mar 2023: 5.7
> Firearm background checks, Mar 2023: 49,524 — 16th most
> Most common type of firearm check: Handguns
> Firearm background checks per 1,000 residents, Mar 2022: 6.2 — 18th fewest
> Firearm background checks, Mar 2022: 54,207 — 14th most
> Change in background checks, Mar 2021- Mar 2022: -4,683 (-8.6% — 15th smallest decrease)
> 2022 Population: 8,683,619 — 12th largest
32. South Carolina
> Firearm background checks per 1,000 residents, Mar 2023: 5.8
> Firearm background checks, Mar 2023: 30,587 — 24th most
> Most common type of firearm check: Handguns
> Firearm background checks per 1,000 residents, Mar 2022: 7.7 — 23rd most
> Firearm background checks, Mar 2022: 40,647 — 20th most
> Change in background checks, Mar 2021- Mar 2022: -10,060 (-24.7% — 2nd largest decrease)
> 2022 Population: 5,282,634 — 23rd largest
[in-text-ad-2]
31. North Carolina
> Firearm background checks per 1,000 residents, Mar 2023: 5.8
> Firearm background checks, Mar 2023: 62,501 — 9th most
> Most common type of firearm check: Long guns
> Firearm background checks per 1,000 residents, Mar 2022: 5.8 — 14th fewest
> Firearm background checks, Mar 2022: 61,751 — 12th most
> Change in background checks, Mar 2021- Mar 2022: +750 (+1.2% — the smallest increase)
> 2022 Population: 10,698,973 — 9th largest
30. Connecticut
> Firearm background checks per 1,000 residents, Mar 2023: 5.9
> Firearm background checks, Mar 2023: 21,344 — 20th fewest
> Most common type of firearm check: Handguns
> Firearm background checks per 1,000 residents, Mar 2022: 7.3 — 23rd fewest
> Firearm background checks, Mar 2022: 26,332 — 23rd fewest
> Change in background checks, Mar 2021- Mar 2022: -4,988 (-18.9% — 6th largest decrease)
> 2022 Population: 3,626,205 — 22nd smallest
[in-text-ad]

29. Maryland
> Firearm background checks per 1,000 residents, Mar 2023: 6.0
> Firearm background checks, Mar 2023: 36,684 — 21st most
> Most common type of firearm check: Handguns
> Firearm background checks per 1,000 residents, Mar 2022: 3.5 — 7th fewest
> Firearm background checks, Mar 2022: 21,583 — 19th fewest
> Change in background checks, Mar 2021- Mar 2022: +15,101 (+70.0% — the largest increase)
> 2022 Population: 6,164,660 — 19th largest
[recirclink id=1081968]
28. Arizona
> Firearm background checks per 1,000 residents, Mar 2023: 6.4
> Firearm background checks, Mar 2023: 47,333 — 18th most
> Most common type of firearm check: Handguns
> Firearm background checks per 1,000 residents, Mar 2022: 6.3 — 19th fewest
> Firearm background checks, Mar 2022: 46,491 — 19th most
> Change in background checks, Mar 2021- Mar 2022: +842 (+1.8% — 2nd smallest increase)
> 2022 Population: 7,359,197 — 14th largest

27. Indiana
> Firearm background checks per 1,000 residents, Mar 2023: 6.6
> Firearm background checks, Mar 2023: 45,121 — 20th most
> Most common type of firearm check: Handguns
> Firearm background checks per 1,000 residents, Mar 2022: 7.7 — 24th most
> Firearm background checks, Mar 2022: 52,444 — 18th most
> Change in background checks, Mar 2021- Mar 2022: -7,323 (-14.0% — 12th largest decrease)
> 2022 Population: 6,833,037 — 17th largest
[in-text-ad-2]
26. Vermont
> Firearm background checks per 1,000 residents, Mar 2023: 6.8
> Firearm background checks, Mar 2023: 4,429 — 3rd fewest
> Most common type of firearm check: Handguns
> Firearm background checks per 1,000 residents, Mar 2022: 7.5 — 25th fewest
> Firearm background checks, Mar 2022: 4,840 — 3rd fewest
> Change in background checks, Mar 2021- Mar 2022: -411 (-8.5% — 12th smallest decrease)
> 2022 Population: 647,064 — 2nd smallest
25. Arkansas
> Firearm background checks per 1,000 residents, Mar 2023: 6.9
> Firearm background checks, Mar 2023: 20,870 — 19th fewest
> Most common type of firearm check: Handguns
> Firearm background checks per 1,000 residents, Mar 2022: 7.1 — 22nd fewest
> Firearm background checks, Mar 2022: 21,622 — 20th fewest
> Change in background checks, Mar 2021- Mar 2022: -752 (-3.5% — 6th smallest decrease)
> 2022 Population: 3,045,637 — 18th smallest
[in-text-ad]
24. Illinois
> Firearm background checks per 1,000 residents, Mar 2023: 7.3
> Firearm background checks, Mar 2023: 91,319 — 6th most
> Most common type of firearm check: Handguns
> Firearm background checks per 1,000 residents, Mar 2022: 6.1 — 17th fewest
> Firearm background checks, Mar 2022: 77,027 — 7th most
> Change in background checks, Mar 2021- Mar 2022: +14,292 (+18.6% — 5th largest increase)
> 2022 Population: 12,582,032 — 6th largest
[recirclink id=1207370]
23. Maine
> Firearm background checks per 1,000 residents, Mar 2023: 7.4
> Firearm background checks, Mar 2023: 10,196 — 10th fewest
> Most common type of firearm check: Handguns
> Firearm background checks per 1,000 residents, Mar 2022: 8.2 — 20th most
> Firearm background checks, Mar 2022: 11,355 — 10th fewest
> Change in background checks, Mar 2021- Mar 2022: -1,159 (-10.2% — 19th smallest decrease)
> 2022 Population: 1,385,340 — 9th smallest
22. Mississippi
> Firearm background checks per 1,000 residents, Mar 2023: 7.4
> Firearm background checks, Mar 2023: 21,824 — 22nd fewest
> Most common type of firearm check: Handguns
> Firearm background checks per 1,000 residents, Mar 2022: 9.0 — 16th most
> Firearm background checks, Mar 2022: 26,571 — 24th fewest
> Change in background checks, Mar 2021- Mar 2022: -4,747 (-17.9% — 7th largest decrease)
> 2022 Population: 2,940,057 — 17th smallest
[in-text-ad-2]

21. Oklahoma
> Firearm background checks per 1,000 residents, Mar 2023: 7.4
> Firearm background checks, Mar 2023: 29,881 — 25th most
> Most common type of firearm check: Handguns
> Firearm background checks per 1,000 residents, Mar 2022: 8.3 — 19th most
> Firearm background checks, Mar 2022: 33,543 — 24th most
> Change in background checks, Mar 2021- Mar 2022: -3,662 (-10.9% — 20th smallest decrease)
> 2022 Population: 4,019,800 — 23rd smallest

20. New Mexico
> Firearm background checks per 1,000 residents, Mar 2023: 7.4
> Firearm background checks, Mar 2023: 15,733 — 15th fewest
> Most common type of firearm check: Handguns
> Firearm background checks per 1,000 residents, Mar 2022: 8.1 — 22nd most
> Firearm background checks, Mar 2022: 17,213 — 16th fewest
> Change in background checks, Mar 2021- Mar 2022: -1,480 (-8.6% — 13th smallest decrease)
> 2022 Population: 2,113,344 — 15th smallest
[in-text-ad]
19. Missouri
> Firearm background checks per 1,000 residents, Mar 2023: 7.5
> Firearm background checks, Mar 2023: 46,367 — 19th most
> Most common type of firearm check: Handguns
> Firearm background checks per 1,000 residents, Mar 2022: 8.7 — 18th most
> Firearm background checks, Mar 2022: 53,978 — 15th most
> Change in background checks, Mar 2021- Mar 2022: -7,611 (-14.1% — 11th largest decrease)
> 2022 Population: 6,177,957 — 18th largest
[recirclink id=1207112]
18. Michigan
> Firearm background checks per 1,000 residents, Mar 2023: 7.6
> Firearm background checks, Mar 2023: 76,279 — 7th most
> Most common type of firearm check: Handguns
> Firearm background checks per 1,000 residents, Mar 2022: 7.7 — 25th most
> Firearm background checks, Mar 2022: 76,795 — 8th most
> Change in background checks, Mar 2021- Mar 2022: -516 (-0.7% — 2nd smallest decrease)
> 2022 Population: 10,034,113 — 10th largest
17. South Dakota
> Firearm background checks per 1,000 residents, Mar 2023: 8.2
> Firearm background checks, Mar 2023: 7,469 — 8th fewest
> Most common type of firearm check: Long guns
> Firearm background checks per 1,000 residents, Mar 2022: 9.4 — 13th most
> Firearm background checks, Mar 2022: 8,586 — 9th fewest
> Change in background checks, Mar 2021- Mar 2022: -1,117 (-13.0% — 16th largest decrease)
> 2022 Population: 909,824 — 5th smallest
[in-text-ad-2]
16. North Dakota
> Firearm background checks per 1,000 residents, Mar 2023: 8.2
> Firearm background checks, Mar 2023: 6,426 — 6th fewest
> Most common type of firearm check: Long guns
> Firearm background checks per 1,000 residents, Mar 2022: 9.8 — 10th most
> Firearm background checks, Mar 2022: 7,641 — 7th fewest
> Change in background checks, Mar 2021- Mar 2022: -1,215 (-15.9% — 10th largest decrease)
> 2022 Population: 779,261 — 4th smallest
15. Minnesota
> Firearm background checks per 1,000 residents, Mar 2023: 8.4
> Firearm background checks, Mar 2023: 47,865 — 17th most
> Most common type of firearm check: Handguns
> Firearm background checks per 1,000 residents, Mar 2022: 9.3 — 14th most
> Firearm background checks, Mar 2022: 53,302 — 16th most
> Change in background checks, Mar 2021- Mar 2022: -5,437 (-10.2% — 18th smallest decrease)
> 2022 Population: 5,717,184 — 22nd largest
[in-text-ad]
14. New Hampshire
> Firearm background checks per 1,000 residents, Mar 2023: 8.7
> Firearm background checks, Mar 2023: 12,179 — 11th fewest
> Most common type of firearm check: Handguns
> Firearm background checks per 1,000 residents, Mar 2022: 9.6 — 11th most
> Firearm background checks, Mar 2022: 13,326 — 12th fewest
> Change in background checks, Mar 2021- Mar 2022: -1,147 (-8.6% — 14th smallest decrease)
> 2022 Population: 1,395,231 — 10th smallest
[recirclink id=1205786]
13. Utah
> Firearm background checks per 1,000 residents, Mar 2023: 9.2
> Firearm background checks, Mar 2023: 31,263 — 23rd most
> Most common type of firearm check: Handguns
> Firearm background checks per 1,000 residents, Mar 2022: 8.2 — 21st most
> Firearm background checks, Mar 2022: 27,575 — 25th fewest
> Change in background checks, Mar 2021- Mar 2022: +3,688 (+13.4% — 6th largest increase)
> 2022 Population: 3,380,800 — 21st smallest
12. Pennsylvania
> Firearm background checks per 1,000 residents, Mar 2023: 9.3
> Firearm background checks, Mar 2023: 121,099 — 3rd most
> Most common type of firearm check: Handguns
> Firearm background checks per 1,000 residents, Mar 2022: 9.5 — 12th most
> Firearm background checks, Mar 2022: 123,475 — 3rd most
> Change in background checks, Mar 2021- Mar 2022: -2,376 (-1.9% — 4th smallest decrease)
> 2022 Population: 12,972,008 — 5th largest
[in-text-ad-2]
11. Alaska
> Firearm background checks per 1,000 residents, Mar 2023: 9.4
> Firearm background checks, Mar 2023: 6,878 — 7th fewest
> Most common type of firearm check: Handguns
> Firearm background checks per 1,000 residents, Mar 2022: 10.2 — 8th most
> Firearm background checks, Mar 2022: 7,459 — 6th fewest
> Change in background checks, Mar 2021- Mar 2022: -581 (-7.8% — 11th smallest decrease)
> 2022 Population: 733,583 — 3rd smallest

10. Colorado
> Firearm background checks per 1,000 residents, Mar 2023: 9.7
> Firearm background checks, Mar 2023: 56,524 — 13th most
> Most common type of firearm check: Handguns
> Firearm background checks per 1,000 residents, Mar 2022: 9.0 — 17th most
> Firearm background checks, Mar 2022: 52,537 — 17th most
> Change in background checks, Mar 2021- Mar 2022: +3,987 (+7.6% — 5th smallest increase)
> 2022 Population: 5,839,926 — 21st largest
[in-text-ad]
9. Wisconsin
> Firearm background checks per 1,000 residents, Mar 2023: 10.1
> Firearm background checks, Mar 2023: 59,486 — 11th most
> Most common type of firearm check: Handguns
> Firearm background checks per 1,000 residents, Mar 2022: 10.7 — 6th most
> Firearm background checks, Mar 2022: 63,253 — 11th most
> Change in background checks, Mar 2021- Mar 2022: -3,767 (-6.0% — 8th smallest decrease)
> 2022 Population: 5,892,539 — 20th largest
[recirclink id=1204832]
8. Tennessee
> Firearm background checks per 1,000 residents, Mar 2023: 10.1
> Firearm background checks, Mar 2023: 71,551 — 8th most
> Most common type of firearm check: Handguns
> Firearm background checks per 1,000 residents, Mar 2022: 12.1 — 3rd most
> Firearm background checks, Mar 2022: 85,303 — 5th most
> Change in background checks, Mar 2021- Mar 2022: -13,752 (-16.1% — 9th largest decrease)
> 2022 Population: 7,051,339 — 15th largest

7. West Virginia
> Firearm background checks per 1,000 residents, Mar 2023: 10.2
> Firearm background checks, Mar 2023: 18,070 — 18th fewest
> Most common type of firearm check: Long guns
> Firearm background checks per 1,000 residents, Mar 2022: 10.2 — 7th most
> Firearm background checks, Mar 2022: 18,163 — 17th fewest
> Change in background checks, Mar 2021- Mar 2022: -93 (-0.5% — the smallest decrease)
> 2022 Population: 1,775,156 — 12th smallest
[in-text-ad-2]

6. Wyoming
> Firearm background checks per 1,000 residents, Mar 2023: 10.5
> Firearm background checks, Mar 2023: 6,085 — 5th fewest
> Most common type of firearm check: Handguns
> Firearm background checks per 1,000 residents, Mar 2022: 11.3 — 5th most
> Firearm background checks, Mar 2022: 6,596 — 5th fewest
> Change in background checks, Mar 2021- Mar 2022: -511 (-7.7% — 10th smallest decrease)
> 2022 Population: 581,381 — the smallest
5. Alabama
> Firearm background checks per 1,000 residents, Mar 2023: 10.9
> Firearm background checks, Mar 2023: 55,265 — 14th most
> Most common type of firearm check: Handguns
> Firearm background checks per 1,000 residents, Mar 2022: 14.2 — the most
> Firearm background checks, Mar 2022: 72,240 — 9th most
> Change in background checks, Mar 2021- Mar 2022: -16,975 (-23.5% — 3rd largest decrease)
> 2022 Population: 5,074,296 — 24th largest
[in-text-ad]
4. Idaho
> Firearm background checks per 1,000 residents, Mar 2023: 11.0
> Firearm background checks, Mar 2023: 21,399 — 21st fewest
> Most common type of firearm check: Handguns
> Firearm background checks per 1,000 residents, Mar 2022: 12.1 — 2nd most
> Firearm background checks, Mar 2022: 23,556 — 21st fewest
> Change in background checks, Mar 2021- Mar 2022: -2,157 (-9.2% — 17th smallest decrease)
> 2022 Population: 1,939,033 — 13th smallest
[recirclink id=1081968]
3. Montana
> Firearm background checks per 1,000 residents, Mar 2023: 11.2
> Firearm background checks, Mar 2023: 12,553 — 12th fewest
> Most common type of firearm check: Handguns
> Firearm background checks per 1,000 residents, Mar 2022: 11.7 — 4th most
> Firearm background checks, Mar 2022: 13,139 — 11th fewest
> Change in background checks, Mar 2021- Mar 2022: -586 (-4.5% — 7th smallest decrease)
> 2022 Population: 1,122,867 — 8th smallest
2. Washington
> Firearm background checks per 1,000 residents, Mar 2023: 12.2
> Firearm background checks, Mar 2023: 95,119 — 5th most
> Most common type of firearm check: Handguns
> Firearm background checks per 1,000 residents, Mar 2022: 9.9 — 9th most
> Firearm background checks, Mar 2022: 77,232 — 6th most
> Change in background checks, Mar 2021- Mar 2022: +17,887 (+23.2% — 4th largest increase)
> 2022 Population: 7,785,786 — 13th largest
[in-text-ad-2]

1. Oregon
> Firearm background checks per 1,000 residents, Mar 2023: 13.5
> Firearm background checks, Mar 2023: 57,326 — 12th most
> Most common type of firearm check: Handguns
> Firearm background checks per 1,000 residents, Mar 2022: 9.2 — 15th most
> Firearm background checks, Mar 2022: 38,920 — 22nd most
> Change in background checks, Mar 2021- Mar 2022: +18,406 (+47.3% — 2nd largest increase)
> 2022 Population: 4,240,137 — 24th smallest
Methodology
To find the states where the most people bought guns last month, 24/7 Wall St. used FBI data from its National Instant Criminal Background Check System. To get closer to an accurate approximation of gun sales, we excluded several categories of checks, including pawn shop transactions, returns, rentals, and rechecks, which are conducted periodically by some states on existing permit holders. We ranked states based on the number of gun checks in March 2023 per 1,000 people in each state.
Even after removing some types of checks that are clearly unrelated to a new firearm purchase, because every state has different laws in terms of when background checks are required and different accounting practices, background checks still only serve as a rough approximation of gun sales.
The most glaring example of this is Illinois, which alone accounted for about half of the background checks in the country after excluding the aforementioned categories. Illinois no longer breaks down background checks separately, but did from July 2016 through July 2021. During the four full years of data, an average of 9.2% of Illinois’s non-private sale or gun-specific permit checks were non-rechecks. We applied that average to the most recent state figures to estimate Illinois’ count. This was done only because Illinois is such a glaring example of inconsistency and because there was historical data to produce an estimate.
There are likely other states for which the background check figures listed are inflated or underestimated proxies for gun sales.
Population data came from the U.S. Census Bureau’s Population and Housing Unit Estimates Program, and are for July of 2022, the most recent data available.
Contact [email protected] for any questions or corrections.