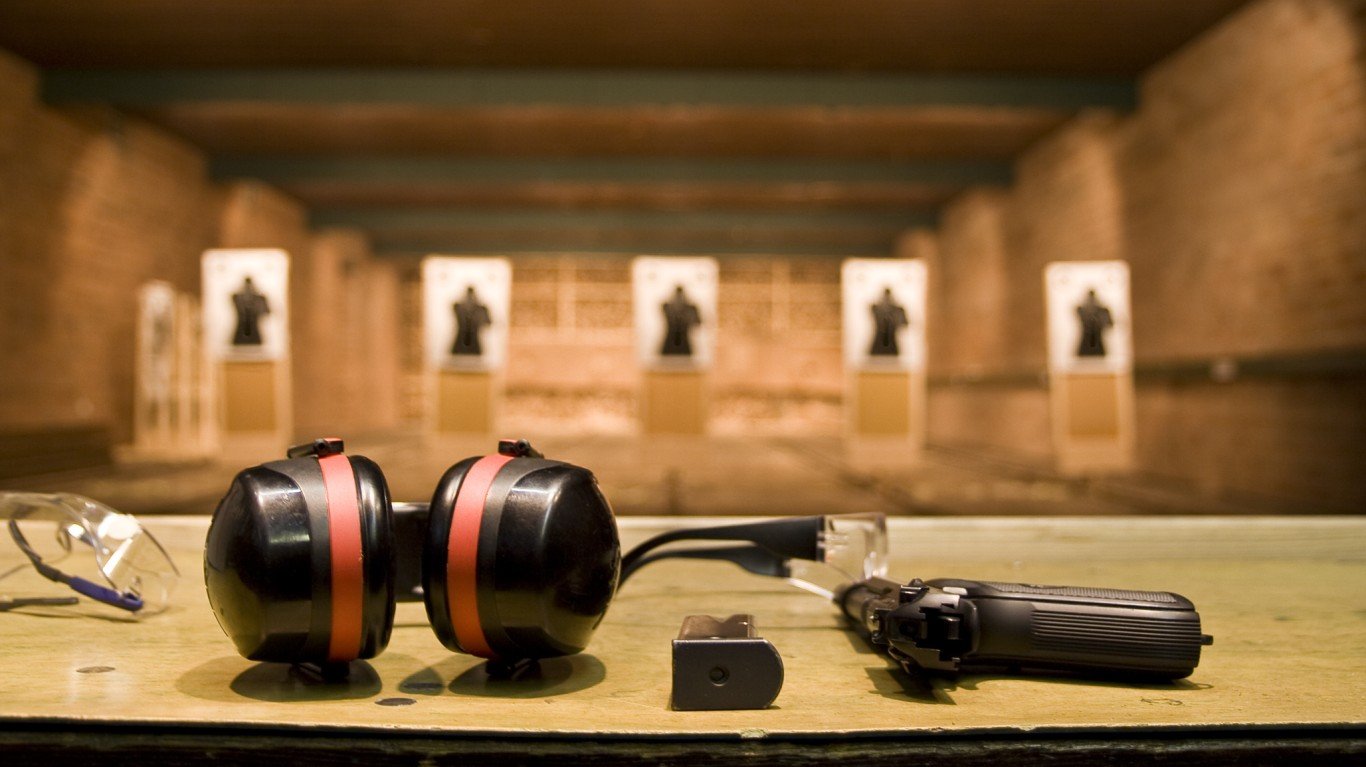
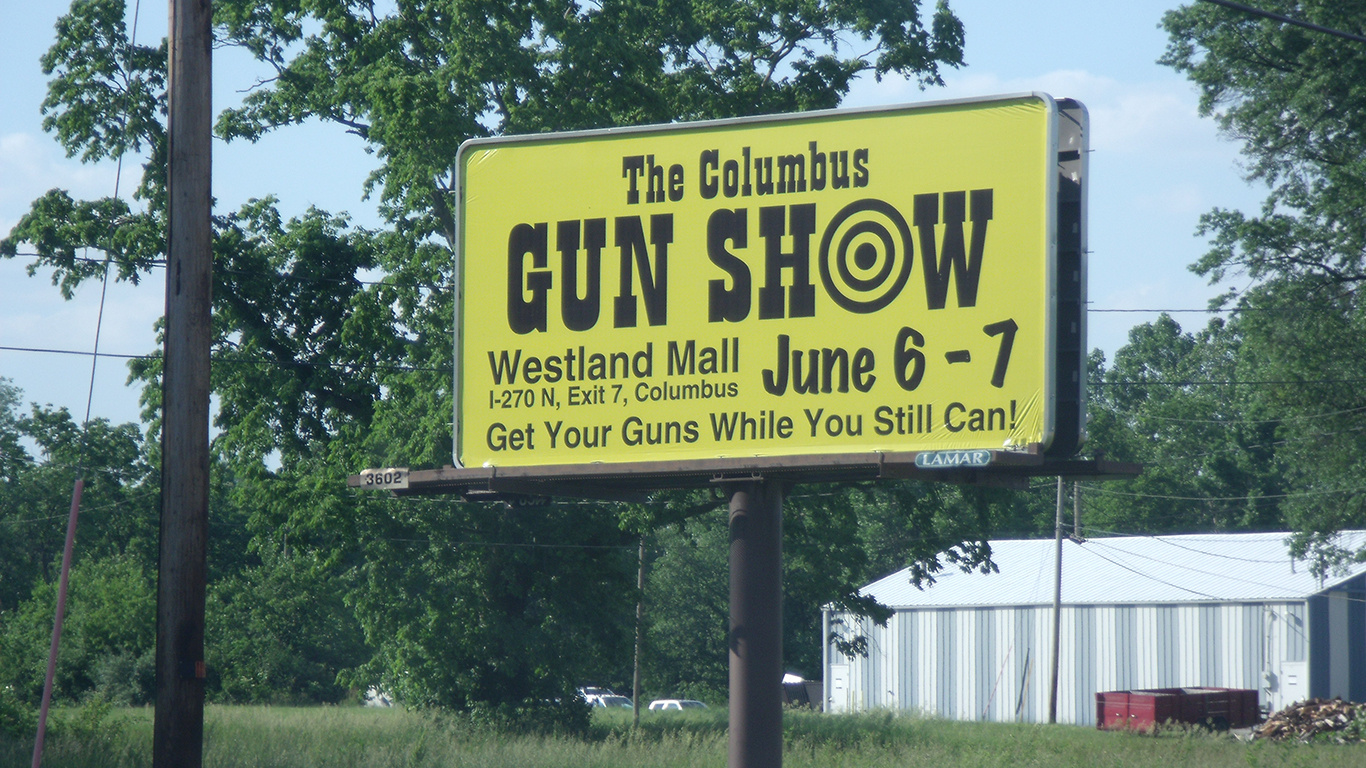
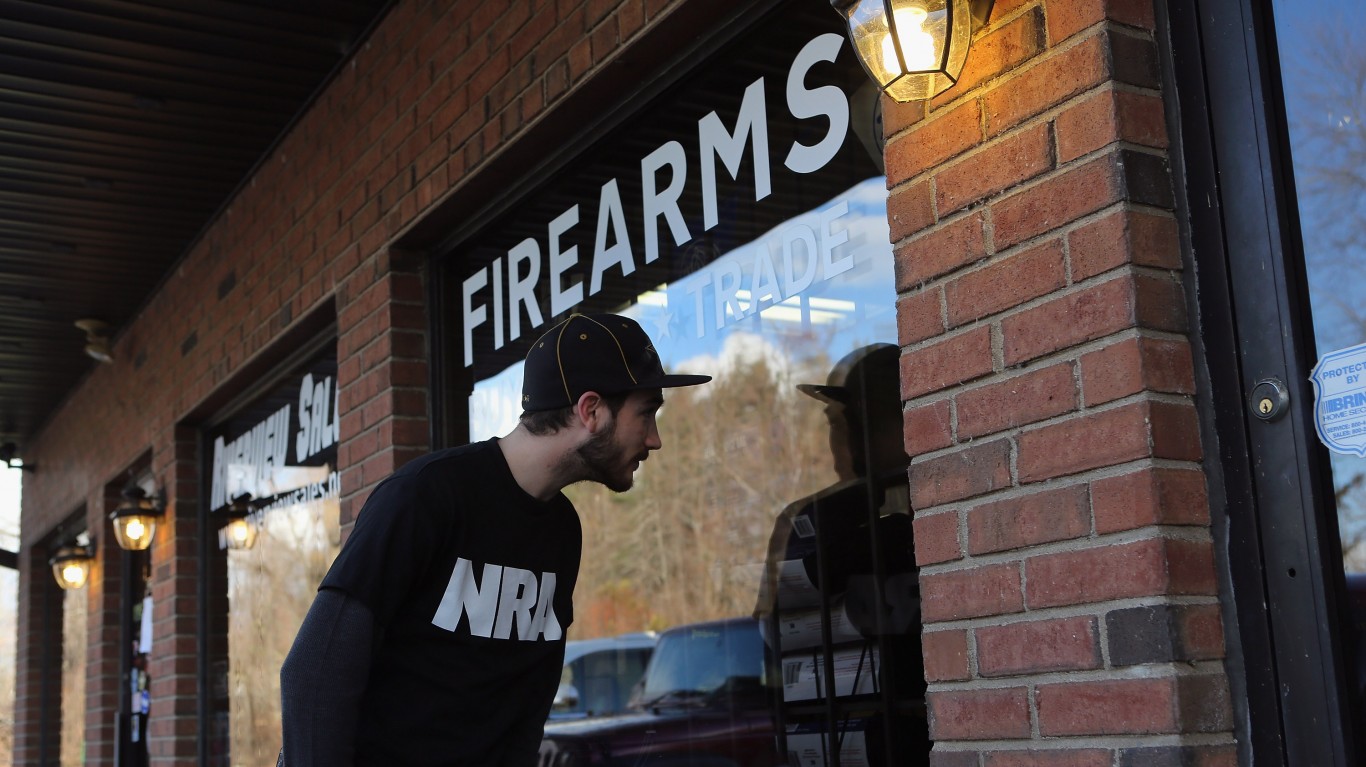
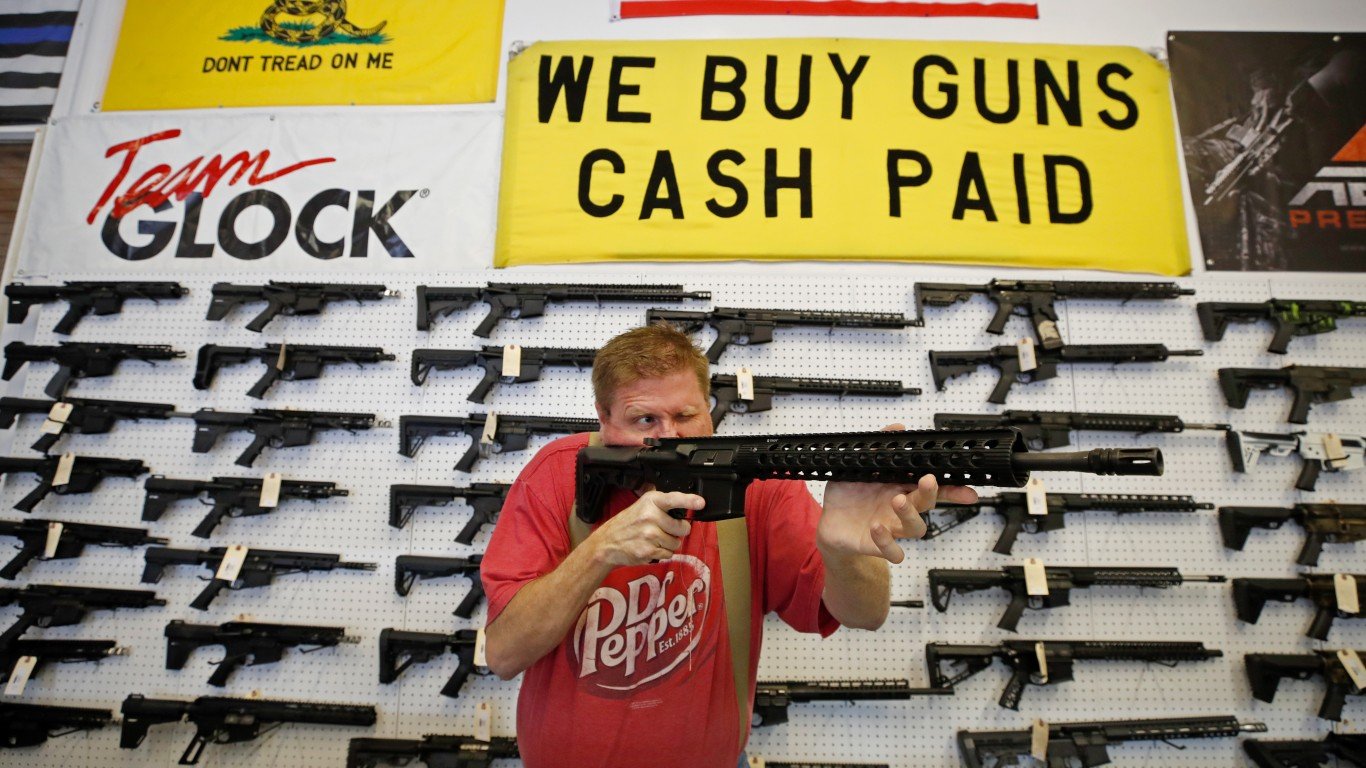
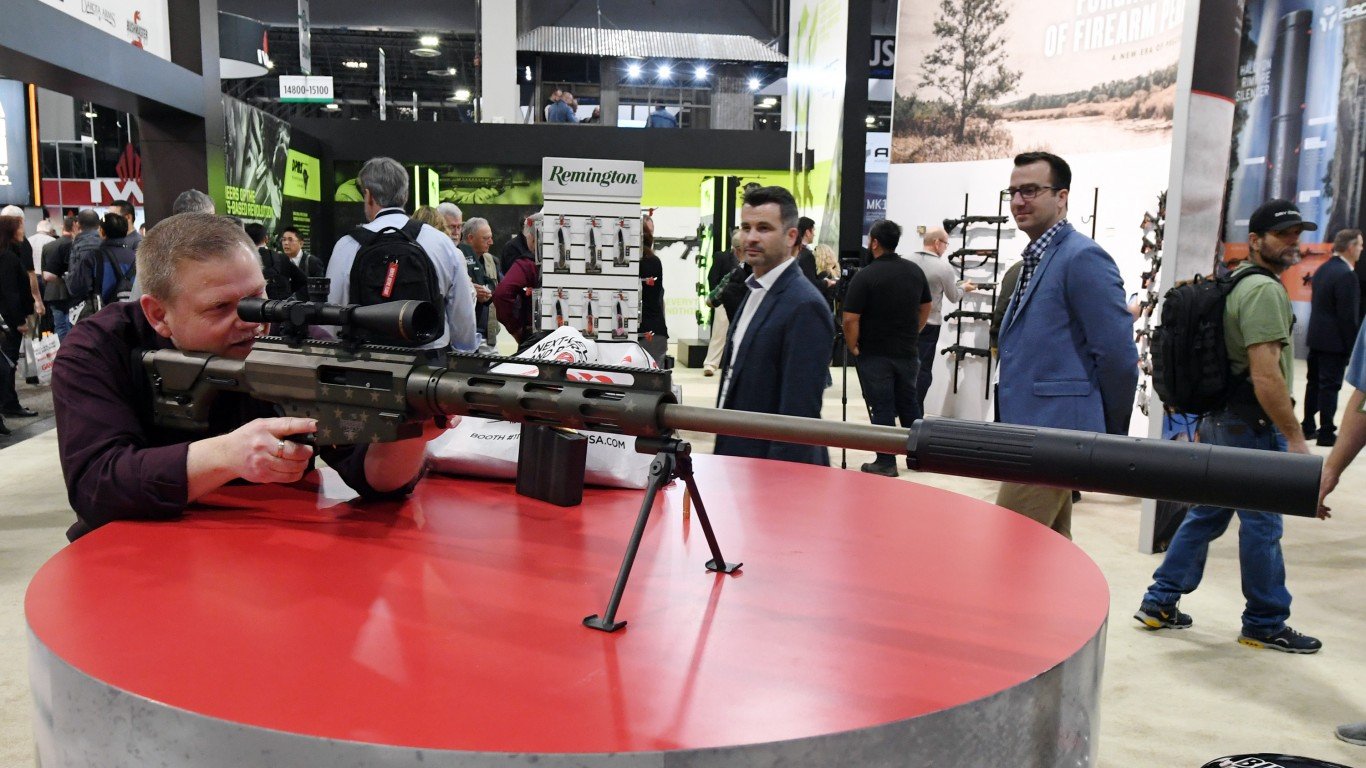
Some U.S. cities became increasingly more dangerous during the pandemic as the violent victimization rate rose in urban areas from 2020 to 2021, according to Department of Justice data. Against the violence, pandemic concerns, civil unrest, and a backdrop of recurring mass shooting events, gun sales – as approximated by firearm background checks – spiked in 2020 and 2021. Many Americans who had never owned a gun were purchasing them.
In 2022, most types of violent crime dropped in major American cities, while robberies and theft cases rose, according to the Council on Criminal Justice. Background checks also declined in 2022 to pre-pandemic levels, and it appears they have been relatively flat nationwide so far this year, increasing by 0.3% in the first four months of 2023 compared to the first four months of last year. While background checks increased in some states and decreased in others, gun sales were not even in all states. (Here is every state’s grade on gun laws.)
To find the states where the most people bought guns so far this year, 24/7 Wall St. used FBI data from its National Instant Criminal Background Check System for the first four months of 2023. To get a more accurate approximation of gun sales, we excluded several categories of checks, including pawn shop transactions, returns, rentals, and rechecks, which are conducted periodically by some states on existing permit holders. Even after adjusting background checks, they still only serve as a rough approximation. We ranked states based on the number of firearm background checks in the first four months of 2023 per 1,000 people.
Among the 10 states with the most firearm background checks per 1,000 residents from January to April of this year are the Western states of Oregon, Washington, Idaho, Montana, Alaska, and Wyoming. In terms of total numbers of firearm background checks over the January-to-April period, Texas had the most at more than 507,000, and also had the most in the year-prior period. Florida, with almost 461,000 firearm background checks, was second.
Some of the states where the most people bought guns are also among the states where background checks spiked, including Oregon and Washington, where background checks jumped respectively by 55% and 17% in the first four months of 2023 compared to the same period in 2022. In Alabama, however, background checks dropped by 21% over the period even though the state ranks third in gun sales per capita. Conversely, in Hawaii, which ranks dead last in gun sales per capita, background checks soared by 32%.
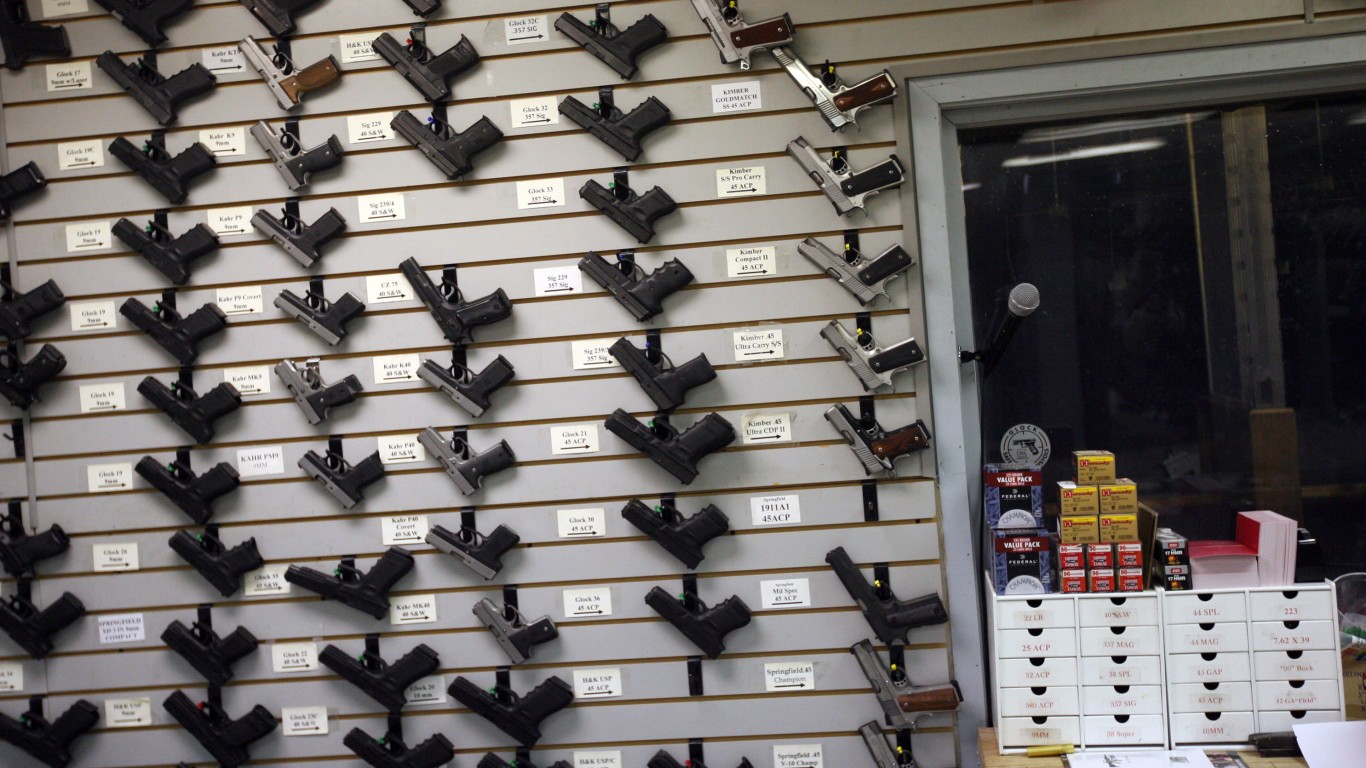
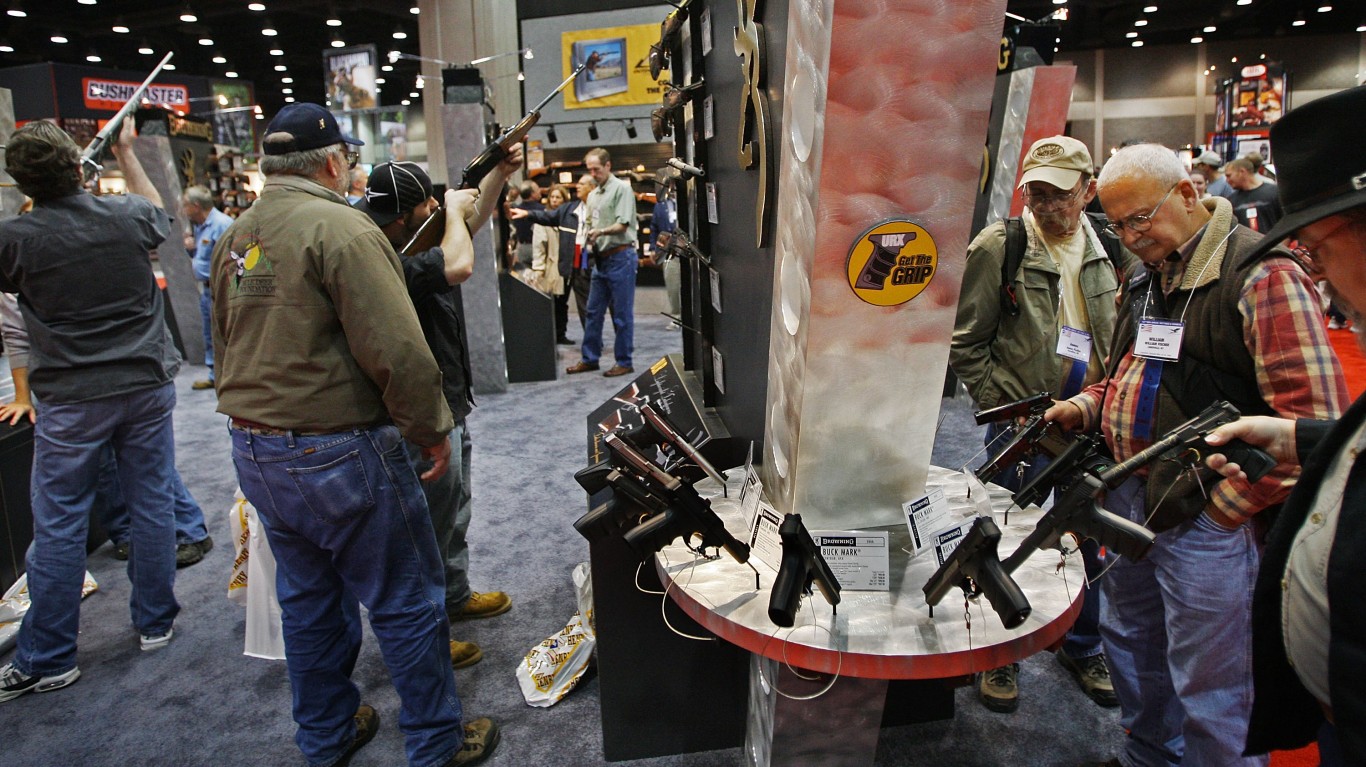
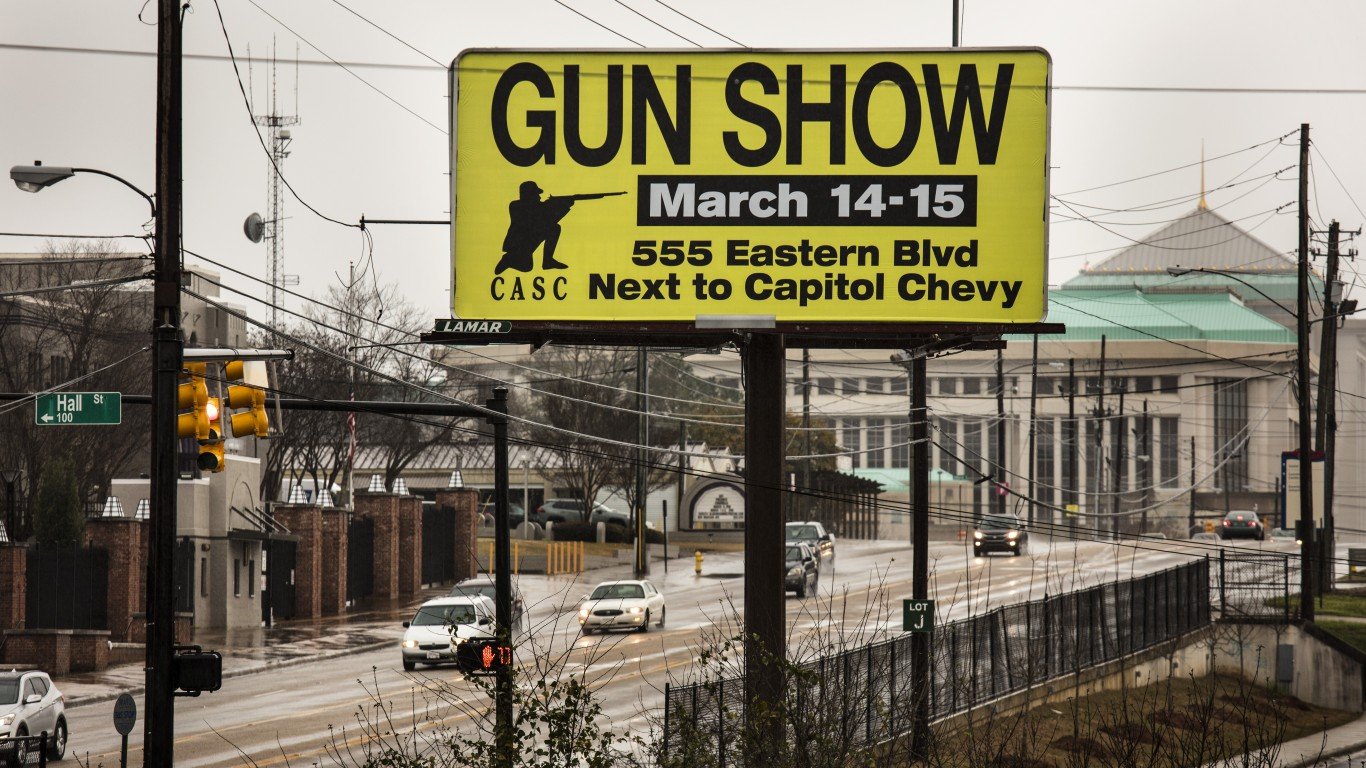
Firearm background checks are a frequent topic in the debate over gun control policy in the United States. The federal government only requires background checks before the sale of guns at federally licensed arms dealers and not at private gun shops. Many states have their own additional policies. Fourteen states and Washington, D.C. require a criminal background check for the sale of all firearms. Seven others either have additional or slightly different mandates, according to Giffords Law Center. (These are the 10 countries Americans buy the most handguns from.)
Click here to see the states where the most people have bought guns so far this year.
Click here to read our detailed methodology.
50. Hawaii
> Firearm background checks per 1,000 residents, Jan-Apr 2023: 5.4
> Firearm background checks, Jan-Apr 2023: 7,788 — the fewest
> Most common type of firearm check: No data available
> Firearm background checks per 1,000 residents, Jan-Apr 2022: 4.1 — the fewest
> Firearm background checks, Jan-Apr 2022: 5,908 — the fewest
> Change in background checks, Jan-Apr 2021 – Jan-Apr 2022: +1,880 (+31.8% — 3rd largest increase)
> 2022 Population: 1,440,196 — 11th fewest
[in-text-ad]
49. New York
> Firearm background checks per 1,000 residents, Jan-Apr 2023: 6.2
> Firearm background checks, Jan-Apr 2023: 122,943 — 22nd most
> Most common type of firearm check: Long guns
> Firearm background checks per 1,000 residents, Jan-Apr 2022: 6.7 — 3rd fewest
> Firearm background checks, Jan-Apr 2022: 132,723 — 22nd most
> Change in background checks, Jan-Apr 2021 – Jan-Apr 2022: -9,780 (-7.4% — 12th largest decrease)
> 2022 Population: 19,677,151 — 4th most
[recirclink id=488456]
48. New Jersey
> Firearm background checks per 1,000 residents, Jan-Apr 2023: 6.5
> Firearm background checks, Jan-Apr 2023: 59,979 — 16th fewest
> Most common type of firearm check: Handguns
> Firearm background checks per 1,000 residents, Jan-Apr 2022: 6.1 — 2nd fewest
> Firearm background checks, Jan-Apr 2022: 56,628 — 16th fewest
> Change in background checks, Jan-Apr 2021 – Jan-Apr 2022: +3,351 (+5.9% — 9th largest increase)
> 2022 Population: 9,261,699 — 11th most

47. Rhode Island
> Firearm background checks per 1,000 residents, Jan-Apr 2023: 8.3
> Firearm background checks, Jan-Apr 2023: 9,076 — 2nd fewest
> Most common type of firearm check: Handguns
> Firearm background checks per 1,000 residents, Jan-Apr 2022: 9.2 — 4th fewest
> Firearm background checks, Jan-Apr 2022: 10,022 — 2nd fewest
> Change in background checks, Jan-Apr 2021 – Jan-Apr 2022: -946 (-9.4% — 7th largest decrease)
> 2022 Population: 1,093,734 — 7th fewest
[in-text-ad-2]
46. California
> Firearm background checks per 1,000 residents, Jan-Apr 2023: 10.3
> Firearm background checks, Jan-Apr 2023: 402,226 — 4th most
> Most common type of firearm check: Handguns
> Firearm background checks per 1,000 residents, Jan-Apr 2022: 10.1 — 5th fewest
> Firearm background checks, Jan-Apr 2022: 394,014 — 4th most
> Change in background checks, Jan-Apr 2021 – Jan-Apr 2022: +8,212 (+2.1% — 15th largest increase)
> 2022 Population: 39,029,342 — the most

45. Massachusetts
> Firearm background checks per 1,000 residents, Jan-Apr 2023: 11.5
> Firearm background checks, Jan-Apr 2023: 80,602 — 22nd fewest
> Most common type of firearm check: Handguns
> Firearm background checks per 1,000 residents, Jan-Apr 2022: 11.1 — 6th fewest
> Firearm background checks, Jan-Apr 2022: 77,526 — 22nd fewest
> Change in background checks, Jan-Apr 2021 – Jan-Apr 2022: +3,076 (+4.0% — 14th largest increase)
> 2022 Population: 6,981,974 — 16th most
[in-text-ad]
44. Nebraska
> Firearm background checks per 1,000 residents, Jan-Apr 2023: 14.3
> Firearm background checks, Jan-Apr 2023: 28,230 — 9th fewest
> Most common type of firearm check: Long guns
> Firearm background checks per 1,000 residents, Jan-Apr 2022: 13.6 — 8th fewest
> Firearm background checks, Jan-Apr 2022: 26,737 — 8th fewest
> Change in background checks, Jan-Apr 2021 – Jan-Apr 2022: +1,493 (+5.6% — 11th largest increase)
> 2022 Population: 1,967,923 — 14th fewest
[recirclink id=488594]

43. Nevada
> Firearm background checks per 1,000 residents, Jan-Apr 2023: 14.9
> Firearm background checks, Jan-Apr 2023: 47,466 — 13th fewest
> Most common type of firearm check: Handguns
> Firearm background checks per 1,000 residents, Jan-Apr 2022: 16.1 — 10th fewest
> Firearm background checks, Jan-Apr 2022: 51,284 — 14th fewest
> Change in background checks, Jan-Apr 2021 – Jan-Apr 2022: -3,818 (-7.4% — 11th largest decrease)
> 2022 Population: 3,177,772 — 19th fewest

42. Iowa
> Firearm background checks per 1,000 residents, Jan-Apr 2023: 15.8
> Firearm background checks, Jan-Apr 2023: 50,410 — 14th fewest
> Most common type of firearm check: Long guns
> Firearm background checks per 1,000 residents, Jan-Apr 2022: 14.6 — 9th fewest
> Firearm background checks, Jan-Apr 2022: 46,787 — 13th fewest
> Change in background checks, Jan-Apr 2021 – Jan-Apr 2022: +3,623 (+7.7% — 8th largest increase)
> 2022 Population: 3,200,517 — 20th fewest
[in-text-ad-2]
41. Texas
> Firearm background checks per 1,000 residents, Jan-Apr 2023: 16.9
> Firearm background checks, Jan-Apr 2023: 507,437 — the most
> Most common type of firearm check: Handguns
> Firearm background checks per 1,000 residents, Jan-Apr 2022: 17.8 — 11th fewest
> Firearm background checks, Jan-Apr 2022: 534,557 — the most
> Change in background checks, Jan-Apr 2021 – Jan-Apr 2022: -27,120 (-5.1% — 13th smallest decrease)
> 2022 Population: 30,029,572 — 2nd most
40. Delaware
> Firearm background checks per 1,000 residents, Jan-Apr 2023: 17.0
> Firearm background checks, Jan-Apr 2023: 17,327 — 4th fewest
> Most common type of firearm check: Handguns
> Firearm background checks per 1,000 residents, Jan-Apr 2022: 19.5 — 15th fewest
> Firearm background checks, Jan-Apr 2022: 19,903 — 4th fewest
> Change in background checks, Jan-Apr 2021 – Jan-Apr 2022: -2,576 (-12.9% — 4th largest decrease)
> 2022 Population: 1,018,396 — 6th fewest
[in-text-ad]
39. Georgia
> Firearm background checks per 1,000 residents, Jan-Apr 2023: 17.2
> Firearm background checks, Jan-Apr 2023: 187,807 — 15th most
> Most common type of firearm check: Handguns
> Firearm background checks per 1,000 residents, Jan-Apr 2022: 18.5 — 12th fewest
> Firearm background checks, Jan-Apr 2022: 201,942 — 13th most
> Change in background checks, Jan-Apr 2021 – Jan-Apr 2022: -14,135 (-7.0% — 16th largest decrease)
> 2022 Population: 10,912,876 — 8th most
[recirclink id=488561]
38. Ohio
> Firearm background checks per 1,000 residents, Jan-Apr 2023: 18.3
> Firearm background checks, Jan-Apr 2023: 215,578 — 10th most
> Most common type of firearm check: Handguns
> Firearm background checks per 1,000 residents, Jan-Apr 2022: 19.4 — 14th fewest
> Firearm background checks, Jan-Apr 2022: 228,272 — 10th most
> Change in background checks, Jan-Apr 2021 – Jan-Apr 2022: -12,694 (-5.6% — 14th smallest decrease)
> 2022 Population: 11,756,058 — 7th most
37. Kentucky
> Firearm background checks per 1,000 residents, Jan-Apr 2023: 20.0
> Firearm background checks, Jan-Apr 2023: 90,433 — 24th fewest
> Most common type of firearm check: Handguns
> Firearm background checks per 1,000 residents, Jan-Apr 2022: 21.6 — 18th fewest
> Firearm background checks, Jan-Apr 2022: 97,415 — 25th most
> Change in background checks, Jan-Apr 2021 – Jan-Apr 2022: -6,982 (-7.2% — 15th largest decrease)
> 2022 Population: 4,512,310 — 25th fewest
[in-text-ad-2]
36. Louisiana
> Firearm background checks per 1,000 residents, Jan-Apr 2023: 20.4
> Firearm background checks, Jan-Apr 2023: 93,858 — 25th fewest
> Most common type of firearm check: Handguns
> Firearm background checks per 1,000 residents, Jan-Apr 2022: 24.6 — 25th fewest
> Firearm background checks, Jan-Apr 2022: 112,999 — 23rd most
> Change in background checks, Jan-Apr 2021 – Jan-Apr 2022: -19,141 (-16.9% — 3rd largest decrease)
> 2022 Population: 4,590,241 — 25th most
35. Kansas
> Firearm background checks per 1,000 residents, Jan-Apr 2023: 20.5
> Firearm background checks, Jan-Apr 2023: 60,183 — 17th fewest
> Most common type of firearm check: Handguns
> Firearm background checks per 1,000 residents, Jan-Apr 2022: 21.4 — 17th fewest
> Firearm background checks, Jan-Apr 2022: 62,918 — 18th fewest
> Change in background checks, Jan-Apr 2021 – Jan-Apr 2022: -2,735 (-4.3% — 10th smallest decrease)
> 2022 Population: 2,937,150 — 16th fewest
[in-text-ad]

34. Florida
> Firearm background checks per 1,000 residents, Jan-Apr 2023: 20.7
> Firearm background checks, Jan-Apr 2023: 460,743 — 2nd most
> Most common type of firearm check: Handguns
> Firearm background checks per 1,000 residents, Jan-Apr 2022: 21.3 — 16th fewest
> Firearm background checks, Jan-Apr 2022: 474,855 — 2nd most
> Change in background checks, Jan-Apr 2021 – Jan-Apr 2022: -14,112 (-3.0% — 7th smallest decrease)
> 2022 Population: 22,244,823 — 3rd most
[recirclink id=488514]
33. Connecticut
> Firearm background checks per 1,000 residents, Jan-Apr 2023: 21.0
> Firearm background checks, Jan-Apr 2023: 76,096 — 20th fewest
> Most common type of firearm check: Handguns
> Firearm background checks per 1,000 residents, Jan-Apr 2022: 24.1 — 23rd fewest
> Firearm background checks, Jan-Apr 2022: 87,334 — 24th fewest
> Change in background checks, Jan-Apr 2021 – Jan-Apr 2022: -11,238 (-12.9% — 5th largest decrease)
> 2022 Population: 3,626,205 — 22nd fewest

32. South Carolina
> Firearm background checks per 1,000 residents, Jan-Apr 2023: 21.1
> Firearm background checks, Jan-Apr 2023: 111,224 — 23rd most
> Most common type of firearm check: Handguns
> Firearm background checks per 1,000 residents, Jan-Apr 2022: 25.8 — 23rd most
> Firearm background checks, Jan-Apr 2022: 136,467 — 20th most
> Change in background checks, Jan-Apr 2021 – Jan-Apr 2022: -25,243 (-18.5% — 2nd largest decrease)
> 2022 Population: 5,282,634 — 23rd most
[in-text-ad-2]

31. Virginia
> Firearm background checks per 1,000 residents, Jan-Apr 2023: 21.4
> Firearm background checks, Jan-Apr 2023: 185,737 — 16th most
> Most common type of firearm check: Handguns
> Firearm background checks per 1,000 residents, Jan-Apr 2022: 21.7 — 20th fewest
> Firearm background checks, Jan-Apr 2022: 188,562 — 14th most
> Change in background checks, Jan-Apr 2021 – Jan-Apr 2022: -2,825 (-1.5% — 3rd smallest decrease)
> 2022 Population: 8,683,619 — 12th most

30. Maryland
> Firearm background checks per 1,000 residents, Jan-Apr 2023: 22.1
> Firearm background checks, Jan-Apr 2023: 136,152 — 21st most
> Most common type of firearm check: Handguns
> Firearm background checks per 1,000 residents, Jan-Apr 2022: 12.4 — 7th fewest
> Firearm background checks, Jan-Apr 2022: 76,160 — 20th fewest
> Change in background checks, Jan-Apr 2021 – Jan-Apr 2022: +59,992 (+78.8% — the largest increase)
> 2022 Population: 6,164,660 — 19th most
[in-text-ad]
29. Arizona
> Firearm background checks per 1,000 residents, Jan-Apr 2023: 22.5
> Firearm background checks, Jan-Apr 2023: 165,232 — 17th most
> Most common type of firearm check: Handguns
> Firearm background checks per 1,000 residents, Jan-Apr 2022: 23.6 — 22nd fewest
> Firearm background checks, Jan-Apr 2022: 173,549 — 17th most
> Change in background checks, Jan-Apr 2021 – Jan-Apr 2022: -8,317 (-4.8% — 12th smallest decrease)
> 2022 Population: 7,359,197 — 14th most
[recirclink id=488498]
28. North Carolina
> Firearm background checks per 1,000 residents, Jan-Apr 2023: 22.6
> Firearm background checks, Jan-Apr 2023: 241,817 — 9th most
> Most common type of firearm check: Handguns
> Firearm background checks per 1,000 residents, Jan-Apr 2022: 19.2 — 13th fewest
> Firearm background checks, Jan-Apr 2022: 204,897 — 12th most
> Change in background checks, Jan-Apr 2021 – Jan-Apr 2022: +36,920 (+18.0% — 5th largest increase)
> 2022 Population: 10,698,973 — 9th most
27. Arkansas
> Firearm background checks per 1,000 residents, Jan-Apr 2023: 22.8
> Firearm background checks, Jan-Apr 2023: 69,591 — 19th fewest
> Most common type of firearm check: Handguns
> Firearm background checks per 1,000 residents, Jan-Apr 2022: 22.7 — 21st fewest
> Firearm background checks, Jan-Apr 2022: 69,135 — 19th fewest
> Change in background checks, Jan-Apr 2021 – Jan-Apr 2022: +456 (+0.7% — 17th largest increase)
> 2022 Population: 3,045,637 — 18th fewest
[in-text-ad-2]
26. Indiana
> Firearm background checks per 1,000 residents, Jan-Apr 2023: 23.5
> Firearm background checks, Jan-Apr 2023: 160,630 — 19th most
> Most common type of firearm check: Handguns
> Firearm background checks per 1,000 residents, Jan-Apr 2022: 25.2 — 25th most
> Firearm background checks, Jan-Apr 2022: 171,881 — 18th most
> Change in background checks, Jan-Apr 2021 – Jan-Apr 2022: -11,251 (-6.5% — 15th smallest decrease)
> 2022 Population: 6,833,037 — 17th most

25. Vermont
> Firearm background checks per 1,000 residents, Jan-Apr 2023: 23.8
> Firearm background checks, Jan-Apr 2023: 15,426 — 3rd fewest
> Most common type of firearm check: Handguns
> Firearm background checks per 1,000 residents, Jan-Apr 2022: 24.1 — 24th fewest
> Firearm background checks, Jan-Apr 2022: 15,615 — 3rd fewest
> Change in background checks, Jan-Apr 2021 – Jan-Apr 2022: -189 (-1.2% — the smallest decrease)
> 2022 Population: 647,064 — 2nd fewest
[in-text-ad]
24. Maine
> Firearm background checks per 1,000 residents, Jan-Apr 2023: 25.6
> Firearm background checks, Jan-Apr 2023: 35,475 — 10th fewest
> Most common type of firearm check: Handguns
> Firearm background checks per 1,000 residents, Jan-Apr 2022: 25.9 — 22nd most
> Firearm background checks, Jan-Apr 2022: 35,913 — 10th fewest
> Change in background checks, Jan-Apr 2021 – Jan-Apr 2022: -438 (-1.2% — 2nd smallest decrease)
> 2022 Population: 1,385,340 — 9th fewest
[recirclink id=488094]
23. Michigan
> Firearm background checks per 1,000 residents, Jan-Apr 2023: 25.6
> Firearm background checks, Jan-Apr 2023: 257,143 — 8th most
> Most common type of firearm check: Handguns
> Firearm background checks per 1,000 residents, Jan-Apr 2022: 25.3 — 24th most
> Firearm background checks, Jan-Apr 2022: 254,195 — 7th most
> Change in background checks, Jan-Apr 2021 – Jan-Apr 2022: +2,948 (+1.2% — 16th largest increase)
> 2022 Population: 10,034,113 — 10th most

22. New Mexico
> Firearm background checks per 1,000 residents, Jan-Apr 2023: 26.0
> Firearm background checks, Jan-Apr 2023: 54,971 — 15th fewest
> Most common type of firearm check: Handguns
> Firearm background checks per 1,000 residents, Jan-Apr 2022: 26.4 — 21st most
> Firearm background checks, Jan-Apr 2022: 55,815 — 15th fewest
> Change in background checks, Jan-Apr 2021 – Jan-Apr 2022: -844 (-1.5% — 4th smallest decrease)
> 2022 Population: 2,113,344 — 15th fewest
[in-text-ad-2]
21. Missouri
> Firearm background checks per 1,000 residents, Jan-Apr 2023: 26.2
> Firearm background checks, Jan-Apr 2023: 161,893 — 18th most
> Most common type of firearm check: Handguns
> Firearm background checks per 1,000 residents, Jan-Apr 2022: 28.3 — 18th most
> Firearm background checks, Jan-Apr 2022: 174,694 — 16th most
> Change in background checks, Jan-Apr 2021 – Jan-Apr 2022: -12,801 (-7.3% — 14th largest decrease)
> 2022 Population: 6,177,957 — 18th most
20. Illinois
> Firearm background checks per 1,000 residents, Jan-Apr 2023: 26.2
> Firearm background checks, Jan-Apr 2023: 330,078 — 5th most
> Most common type of firearm check: Handguns
> Firearm background checks per 1,000 residents, Jan-Apr 2022: 21.6 — 19th fewest
> Firearm background checks, Jan-Apr 2022: 272,359 — 6th most
> Change in background checks, Jan-Apr 2021 – Jan-Apr 2022: +57,719 (+21.2% — 4th largest increase)
> 2022 Population: 12,582,032 — 6th most
[in-text-ad]
19. Mississippi
> Firearm background checks per 1,000 residents, Jan-Apr 2023: 27.0
> Firearm background checks, Jan-Apr 2023: 79,374 — 21st fewest
> Most common type of firearm check: Handguns
> Firearm background checks per 1,000 residents, Jan-Apr 2022: 29.5 — 17th most
> Firearm background checks, Jan-Apr 2022: 86,688 — 23rd fewest
> Change in background checks, Jan-Apr 2021 – Jan-Apr 2022: -7,314 (-8.4% — 8th largest decrease)
> 2022 Population: 2,940,057 — 17th fewest
[recirclink id=488247]

18. Oklahoma
> Firearm background checks per 1,000 residents, Jan-Apr 2023: 27.3
> Firearm background checks, Jan-Apr 2023: 109,904 — 24th most
> Most common type of firearm check: Handguns
> Firearm background checks per 1,000 residents, Jan-Apr 2022: 28.0 — 19th most
> Firearm background checks, Jan-Apr 2022: 112,413 — 24th most
> Change in background checks, Jan-Apr 2021 – Jan-Apr 2022: -2,509 (-2.2% — 6th smallest decrease)
> 2022 Population: 4,019,800 — 23rd fewest
17. Minnesota
> Firearm background checks per 1,000 residents, Jan-Apr 2023: 27.7
> Firearm background checks, Jan-Apr 2023: 158,156 — 20th most
> Most common type of firearm check: Handguns
> Firearm background checks per 1,000 residents, Jan-Apr 2022: 29.9 — 16th most
> Firearm background checks, Jan-Apr 2022: 170,678 — 19th most
> Change in background checks, Jan-Apr 2021 – Jan-Apr 2022: -12,522 (-7.3% — 13th largest decrease)
> 2022 Population: 5,717,184 — 22nd most
[in-text-ad-2]
16. South Dakota
> Firearm background checks per 1,000 residents, Jan-Apr 2023: 27.8
> Firearm background checks, Jan-Apr 2023: 25,310 — 8th fewest
> Most common type of firearm check: Long guns
> Firearm background checks per 1,000 residents, Jan-Apr 2022: 31.8 — 12th most
> Firearm background checks, Jan-Apr 2022: 28,964 — 9th fewest
> Change in background checks, Jan-Apr 2021 – Jan-Apr 2022: -3,654 (-12.6% — 6th largest decrease)
> 2022 Population: 909,824 — 5th fewest
15. Utah
> Firearm background checks per 1,000 residents, Jan-Apr 2023: 29.2
> Firearm background checks, Jan-Apr 2023: 98,814 — 25th most
> Most common type of firearm check: Handguns
> Firearm background checks per 1,000 residents, Jan-Apr 2022: 27.0 — 20th most
> Firearm background checks, Jan-Apr 2022: 91,282 — 25th fewest
> Change in background checks, Jan-Apr 2021 – Jan-Apr 2022: +7,532 (+8.3% — 7th largest increase)
> 2022 Population: 3,380,800 — 21st fewest
[in-text-ad]
14. North Dakota
> Firearm background checks per 1,000 residents, Jan-Apr 2023: 29.5
> Firearm background checks, Jan-Apr 2023: 23,012 — 6th fewest
> Most common type of firearm check: Long guns
> Firearm background checks per 1,000 residents, Jan-Apr 2022: 30.7 — 14th most
> Firearm background checks, Jan-Apr 2022: 23,961 — 6th fewest
> Change in background checks, Jan-Apr 2021 – Jan-Apr 2022: -949 (-4.0% — 8th smallest decrease)
> 2022 Population: 779,261 — 4th fewest
[recirclink id=488174]
13. New Hampshire
> Firearm background checks per 1,000 residents, Jan-Apr 2023: 32.0
> Firearm background checks, Jan-Apr 2023: 44,656 — 12th fewest
> Most common type of firearm check: Handguns
> Firearm background checks per 1,000 residents, Jan-Apr 2022: 31.9 — 10th most
> Firearm background checks, Jan-Apr 2022: 44,483 — 12th fewest
> Change in background checks, Jan-Apr 2021 – Jan-Apr 2022: +173 (+0.4% — 18th largest increase)
> 2022 Population: 1,395,231 — 10th fewest

12. Colorado
> Firearm background checks per 1,000 residents, Jan-Apr 2023: 32.3
> Firearm background checks, Jan-Apr 2023: 188,360 — 14th most
> Most common type of firearm check: Handguns
> Firearm background checks per 1,000 residents, Jan-Apr 2022: 30.7 — 15th most
> Firearm background checks, Jan-Apr 2022: 179,126 — 15th most
> Change in background checks, Jan-Apr 2021 – Jan-Apr 2022: +9,234 (+5.2% — 12th largest increase)
> 2022 Population: 5,839,926 — 21st most
[in-text-ad-2]
11. Pennsylvania
> Firearm background checks per 1,000 residents, Jan-Apr 2023: 32.6
> Firearm background checks, Jan-Apr 2023: 423,022 — 3rd most
> Most common type of firearm check: Handguns
> Firearm background checks per 1,000 residents, Jan-Apr 2022: 32.6 — 9th most
> Firearm background checks, Jan-Apr 2022: 422,386 — 3rd most
> Change in background checks, Jan-Apr 2021 – Jan-Apr 2022: +636 (+0.2% — 19th largest increase)
> 2022 Population: 12,972,008 — 5th most

10. Alaska
> Firearm background checks per 1,000 residents, Jan-Apr 2023: 32.8
> Firearm background checks, Jan-Apr 2023: 24,038 — 7th fewest
> Most common type of firearm check: Handguns
> Firearm background checks per 1,000 residents, Jan-Apr 2022: 34.4 — 7th most
> Firearm background checks, Jan-Apr 2022: 25,236 — 7th fewest
> Change in background checks, Jan-Apr 2021 – Jan-Apr 2022: -1,198 (-4.7% — 11th smallest decrease)
> 2022 Population: 733,583 — 3rd fewest
[in-text-ad]
9. West Virginia
> Firearm background checks per 1,000 residents, Jan-Apr 2023: 34.6
> Firearm background checks, Jan-Apr 2023: 61,506 — 18th fewest
> Most common type of firearm check: Long guns
> Firearm background checks per 1,000 residents, Jan-Apr 2022: 33.1 — 8th most
> Firearm background checks, Jan-Apr 2022: 58,837 — 17th fewest
> Change in background checks, Jan-Apr 2021 – Jan-Apr 2022: +2,669 (+4.5% — 13th largest increase)
> 2022 Population: 1,775,156 — 12th fewest
[recirclink id=487977]
8. Wyoming
> Firearm background checks per 1,000 residents, Jan-Apr 2023: 35.0
> Firearm background checks, Jan-Apr 2023: 20,325 — 5th fewest
> Most common type of firearm check: Handguns
> Firearm background checks per 1,000 residents, Jan-Apr 2022: 38.0 — 5th most
> Firearm background checks, Jan-Apr 2022: 22,112 — 5th fewest
> Change in background checks, Jan-Apr 2021 – Jan-Apr 2022: -1,787 (-8.1% — 9th largest decrease)
> 2022 Population: 581,381 — the fewest
7. Wisconsin
> Firearm background checks per 1,000 residents, Jan-Apr 2023: 35.9
> Firearm background checks, Jan-Apr 2023: 211,609 — 11th most
> Most common type of firearm check: Handguns
> Firearm background checks per 1,000 residents, Jan-Apr 2022: 37.5 — 6th most
> Firearm background checks, Jan-Apr 2022: 220,690 — 11th most
> Change in background checks, Jan-Apr 2021 – Jan-Apr 2022: -9,081 (-4.1% — 9th smallest decrease)
> 2022 Population: 5,892,539 — 20th most
[in-text-ad-2]
6. Washington
> Firearm background checks per 1,000 residents, Jan-Apr 2023: 37.4
> Firearm background checks, Jan-Apr 2023: 291,433 — 6th most
> Most common type of firearm check: Handguns
> Firearm background checks per 1,000 residents, Jan-Apr 2022: 31.9 — 11th most
> Firearm background checks, Jan-Apr 2022: 248,147 — 8th most
> Change in background checks, Jan-Apr 2021 – Jan-Apr 2022: +43,286 (+17.4% — 6th largest increase)
> 2022 Population: 7,785,786 — 13th most
5. Montana
> Firearm background checks per 1,000 residents, Jan-Apr 2023: 37.7
> Firearm background checks, Jan-Apr 2023: 42,280 — 11th fewest
> Most common type of firearm check: Handguns
> Firearm background checks per 1,000 residents, Jan-Apr 2022: 38.4 — 4th most
> Firearm background checks, Jan-Apr 2022: 43,163 — 11th fewest
> Change in background checks, Jan-Apr 2021 – Jan-Apr 2022: -883 (-2.0% — 5th smallest decrease)
> 2022 Population: 1,122,867 — 8th fewest
[in-text-ad]
4. Tennessee
> Firearm background checks per 1,000 residents, Jan-Apr 2023: 38.0
> Firearm background checks, Jan-Apr 2023: 267,980 — 7th most
> Most common type of firearm check: Handguns
> Firearm background checks per 1,000 residents, Jan-Apr 2022: 41.2 — 2nd most
> Firearm background checks, Jan-Apr 2022: 290,231 — 5th most
> Change in background checks, Jan-Apr 2021 – Jan-Apr 2022: -22,251 (-7.7% — 10th largest decrease)
> 2022 Population: 7,051,339 — 15th most
[recirclink id=487572]
3. Alabama
> Firearm background checks per 1,000 residents, Jan-Apr 2023: 38.7
> Firearm background checks, Jan-Apr 2023: 196,535 — 13th most
> Most common type of firearm check: Handguns
> Firearm background checks per 1,000 residents, Jan-Apr 2022: 48.8 — the most
> Firearm background checks, Jan-Apr 2022: 247,781 — 9th most
> Change in background checks, Jan-Apr 2021 – Jan-Apr 2022: -51,246 (-20.7% — the largest decrease)
> 2022 Population: 5,074,296 — 24th most
2. Idaho
> Firearm background checks per 1,000 residents, Jan-Apr 2023: 42.1
> Firearm background checks, Jan-Apr 2023: 81,684 — 23rd fewest
> Most common type of firearm check: Handguns
> Firearm background checks per 1,000 residents, Jan-Apr 2022: 39.8 — 3rd most
> Firearm background checks, Jan-Apr 2022: 77,194 — 21st fewest
> Change in background checks, Jan-Apr 2021 – Jan-Apr 2022: +4,490 (+5.8% — 10th largest increase)
> 2022 Population: 1,939,033 — 13th fewest
[in-text-ad-2]

1. Oregon
> Firearm background checks per 1,000 residents, Jan-Apr 2023: 48.7
> Firearm background checks, Jan-Apr 2023: 206,459 — 12th most
> Most common type of firearm check: Handguns
> Firearm background checks per 1,000 residents, Jan-Apr 2022: 31.4 — 13th most
> Firearm background checks, Jan-Apr 2022: 133,075 — 21st most
> Change in background checks, Jan-Apr 2021 – Jan-Apr 2022: +73,384 (+55.1% — 2nd largest increase)
> 2022 Population: 4,240,137 — 24th fewest
Methodology
To find the states where the most people bought guns so far this year, 24/7 Wall St. used FBI data from its National Instant Criminal Background Check System for the first four months of 2023. To get a more accurate approximation of gun sales, we excluded several categories of checks, including pawn shop transactions, returns, rentals, and rechecks, which are conducted periodically by some states on existing permit holders. We ranked states based on the combined number of gun checks through the first four months of 2023 per 1,000 people.
Even after removing some types of checks that are clearly unrelated to a new firearm purchase, because every state has different laws in terms of when background checks are required and different accounting practices, background checks still only serve as a rough approximation.
The most glaring example of this is Illinois, which alone accounted for about half of the background checks in the country after excluding the aforementioned categories of checks. Illinois no longer breaks down background checks separately, but did from July 2016 through July 2021. During the four full years of data, an average of 9.2% of Illinois’s non-private sale or gun-specific permit checks were non-rechecks. We applied that average to the most recent state figures to estimate Illinois’ count. This was done only because Illinois is such a glaring example of inconsistency and because there was historical data to produce an estimate.
There are likely other states for which the background check figures listed are inflated or underestimated proxies for gun sales.
Population data came from the U.S. Census Bureau’s Population and Housing Unit Estimates Program, and are for July of 2022, the most recent data available.
Contact [email protected] for any questions or corrections.