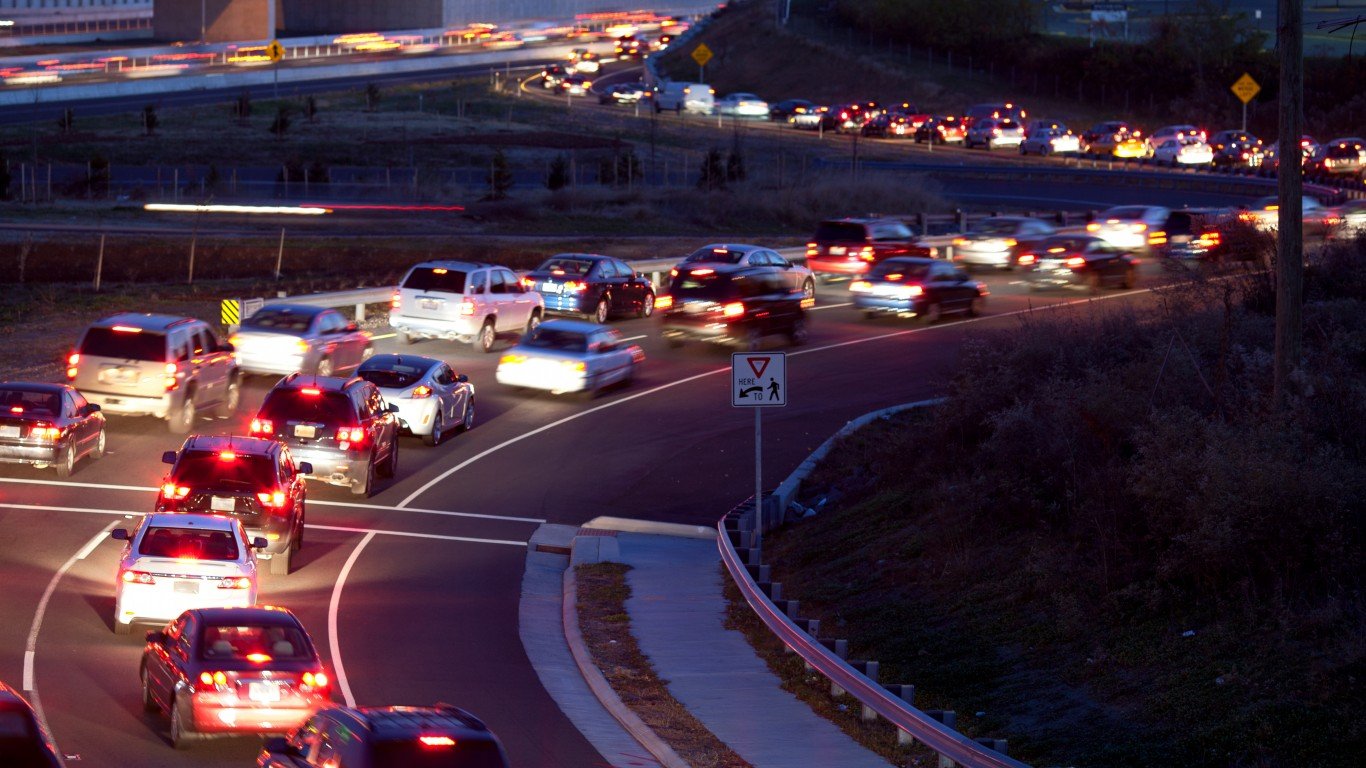
Certain cities can be especially dangerous for driving, more so than other areas. Whether they have ill-designed roads and traffic layouts that increase the likelihood of accidents or are regularly affected by inclement weather, like snow and ice, these factors all contribute to making driving more perilous. Then there are those cities that are highly congested, have roads in poor condition, or may have a prevalence of drunk driving. (Here are the worst car accidents in America since the 1990s.)
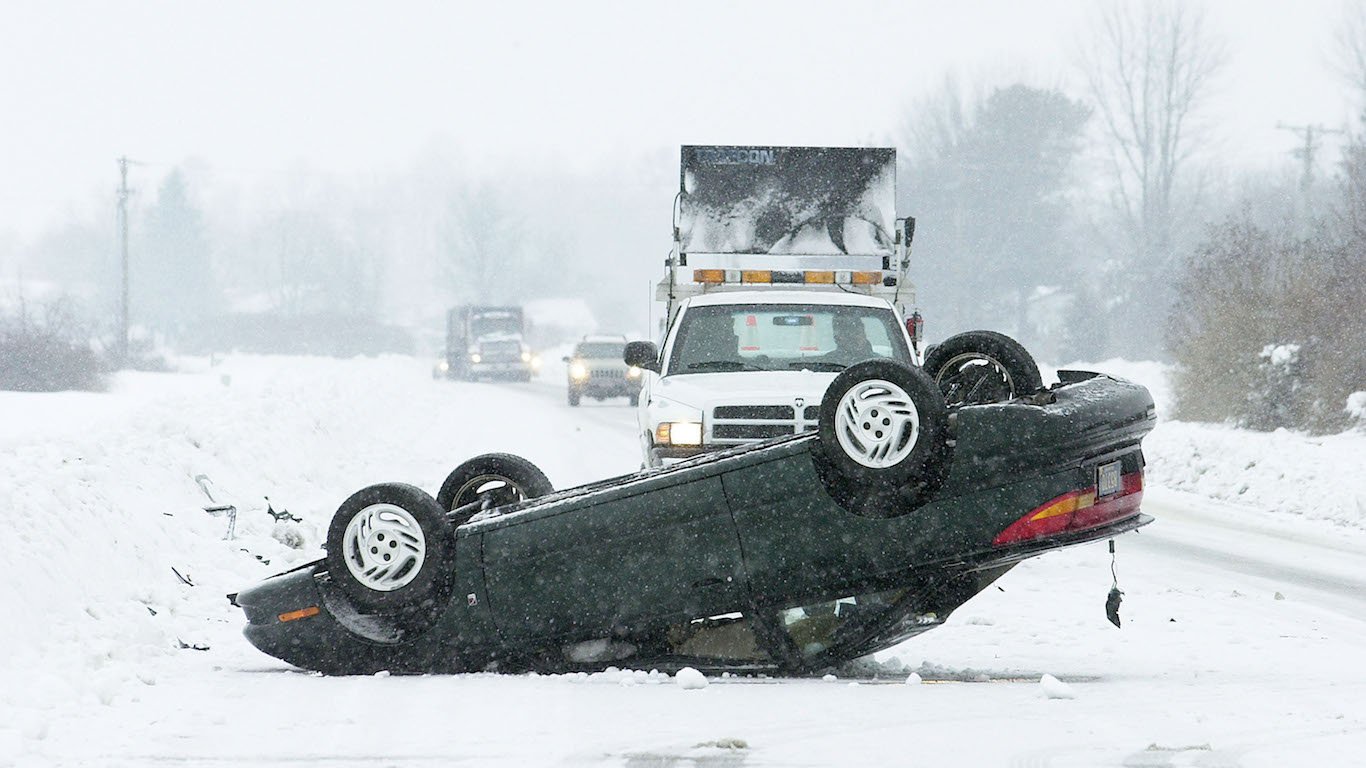
Dangerous driving cities are not unique to any certain part of the country. The National Highway Safety Administration estimates that nearly 43,000 Americans died from motor vehicle accidents in 2022, and although it declined slightly from the previous year, this is still a significant number of traffic deaths. (Here are the deadliest states to drive.)
24/7 Wall St. created a weighted index to measure driving and road conditions in 376 metropolitan statistical areas to identify the worst cities to drive in. The index consists of six measures: the shares of deadly vehicle accidents caused by weather and poor roadway conditions; the number of deadly accidents for every 100,000 people; the share of driving deaths involving alcohol; the average annual time lost to traffic congestion; and the average price of a regular gallon of gas at the state level on Nov. 28, 2022.
Here are the most challenging American cities to drive in.
See below to read our detailed methodology.
25. Charlottesville, VA

- Avg. traffic delays per commuter in 2020: 19 hours (middle 50% of 376 metro areas)
- Deadly crashes per 100,000 people, 2011-2020: 101 per 100,000 people (middle 50% of 376 metro areas)
- Share of deadly crashes caused by weather or road design/conditions: 53.6% (top 10% of 376 metro areas)
- Share of driving deaths involving alcohol: 26.4% (middle 50% of 376 metro areas)
24. Fresno, CA
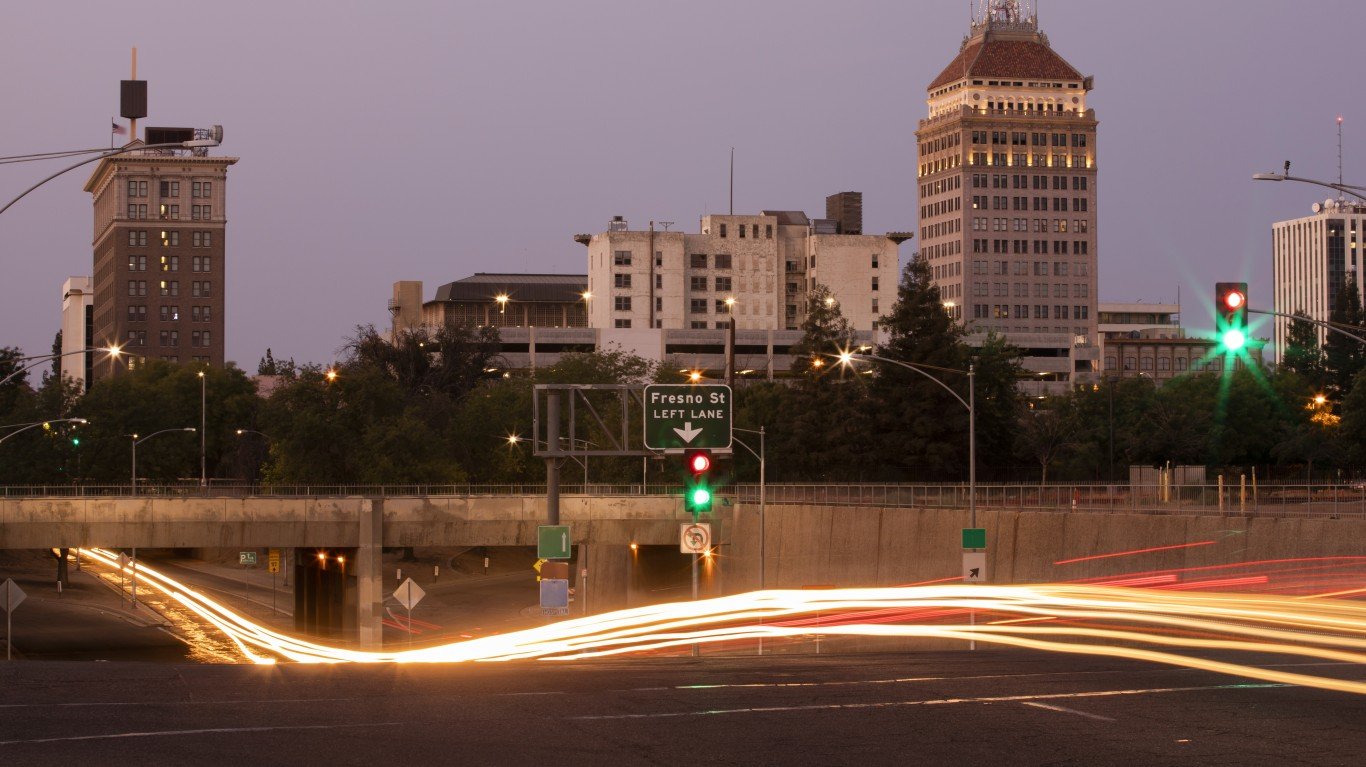
- Avg. traffic delays per commuter in 2020: 29 hours (top 10% of 376 metro areas)
- Deadly crashes per 100,000 people, 2011-2020: 117 per 100,000 people (middle 50% of 376 metro areas)
- Share of deadly crashes caused by weather or road design/conditions: 14.8% (bottom 25% of 376 metro areas)
- Share of driving deaths involving alcohol: 26.0% (middle 50% of 376 metro areas)
23. Chicago-Naperville-Elgin, IL-IN-WI
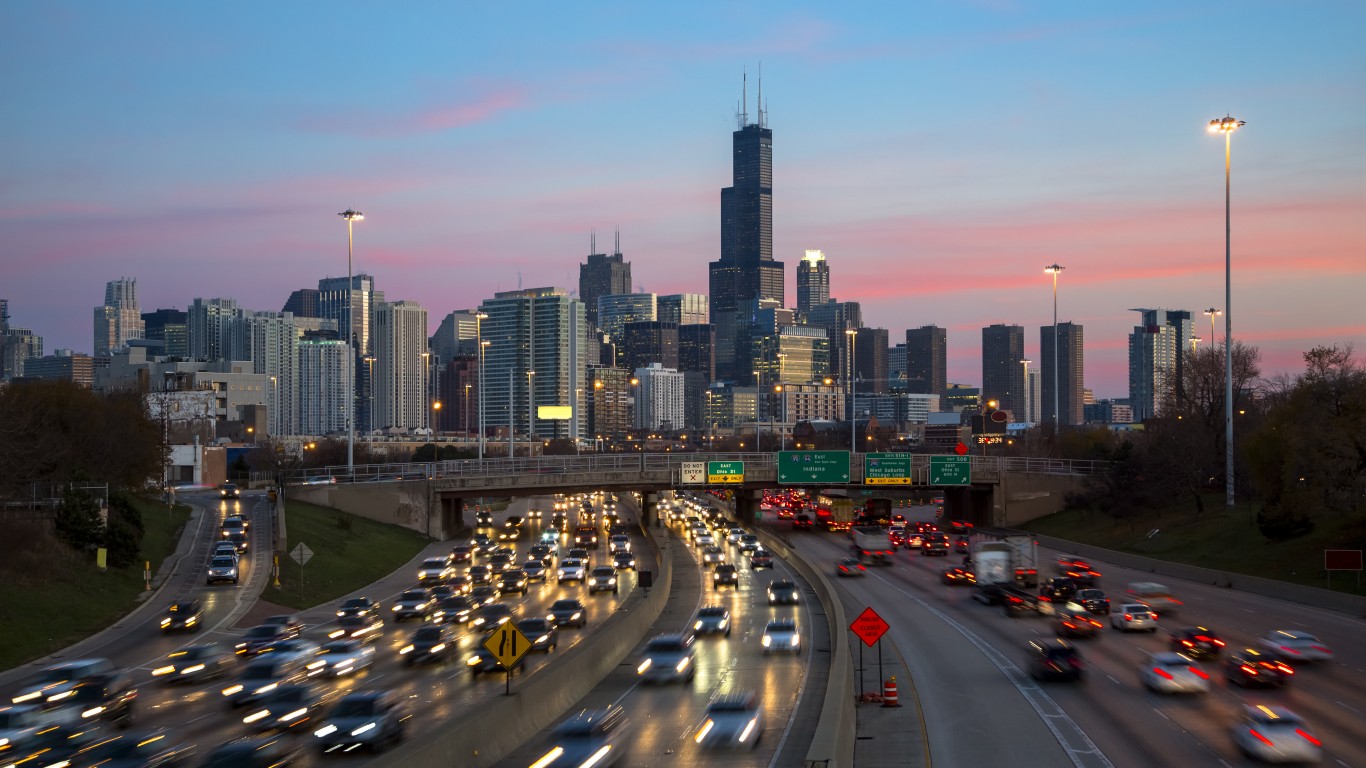
- Avg. traffic delays per commuter in 2020: 39 hours (top 10% of 376 metro areas)
- Deadly crashes per 100,000 people, 2011-2020: 55 per 100,000 people (bottom 10% of 376 metro areas)
- Share of deadly crashes caused by weather or road design/conditions: 18.2% (bottom 25% of 376 metro areas)
- Share of driving deaths involving alcohol: 26.6% (middle 50% of 376 metro areas)
22. Detroit-Warren-Dearborn, MI
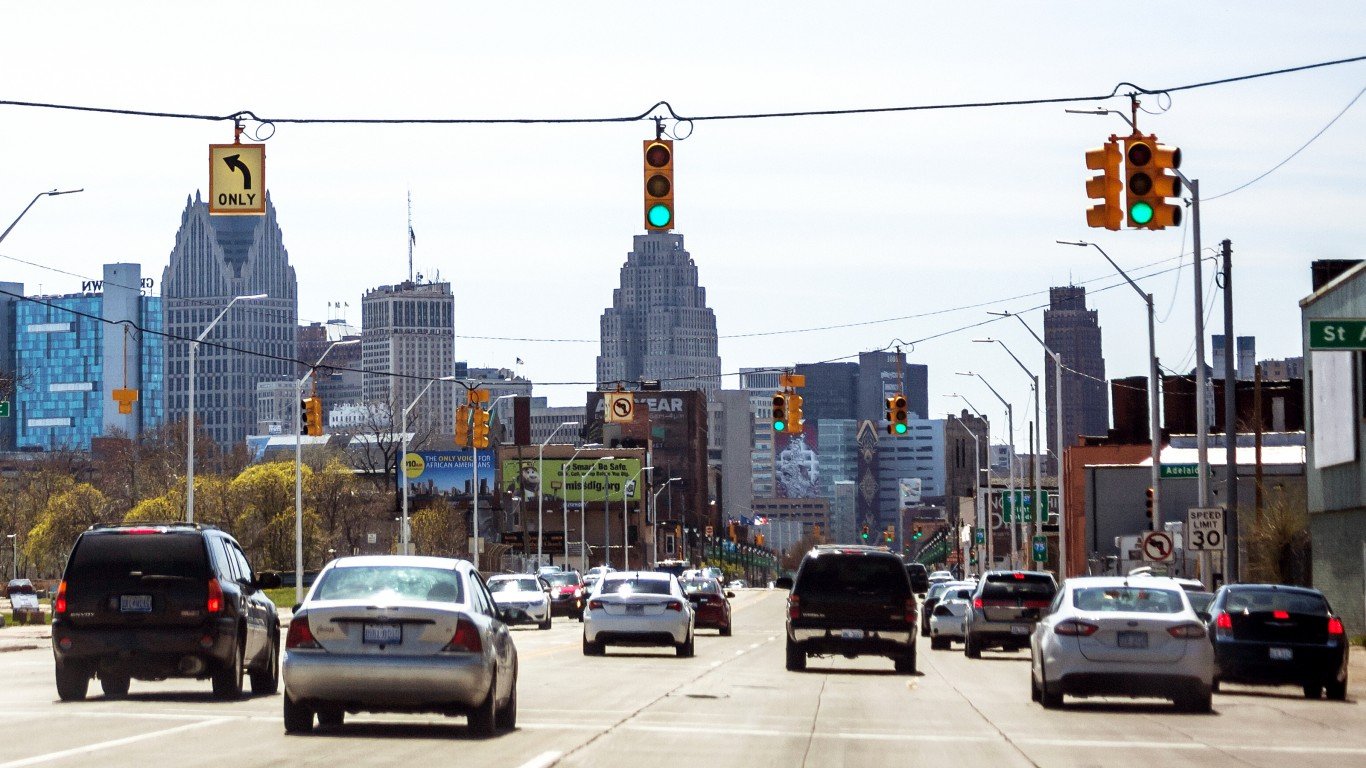
- Avg. traffic delays per commuter in 2020: 35 hours (top 10% of 376 metro areas)
- Deadly crashes per 100,000 people, 2011-2020: 73 per 100,000 people (bottom 25% of 376 metro areas)
- Share of deadly crashes caused by weather or road design/conditions: 34.0% (middle 50% of 376 metro areas)
- Share of driving deaths involving alcohol: 26.1% (middle 50% of 376 metro areas)
21. Austin-Round Rock-Georgetown, TX
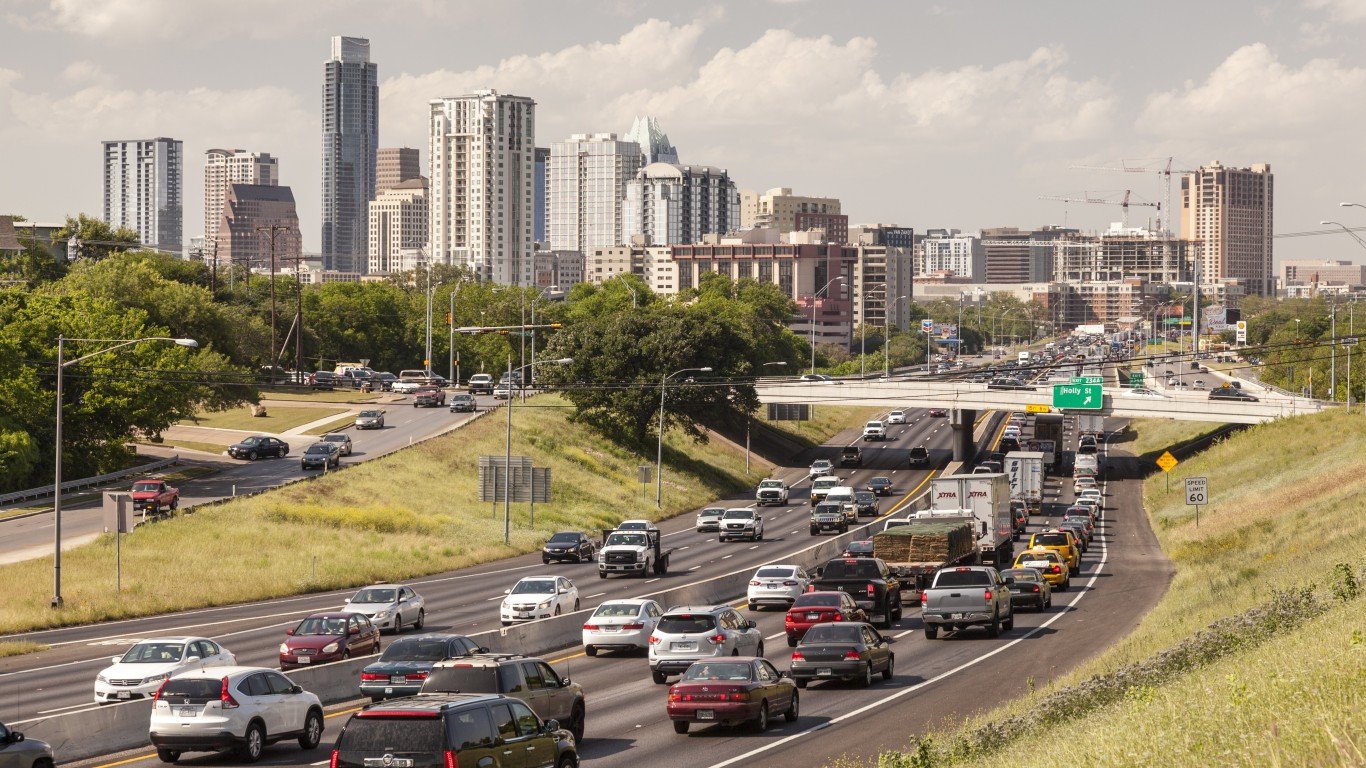
- Avg. traffic delays per commuter in 2020: 41 hours (top 10% of 376 metro areas)
- Deadly crashes per 100,000 people, 2011-2020: 89 per 100,000 people (middle 50% of 376 metro areas)
- Share of deadly crashes caused by weather or road design/conditions: 26.2% (middle 50% of 376 metro areas)
- Share of driving deaths involving alcohol: 25.4% (middle 50% of 376 metro areas)
20. Richmond, VA

- Avg. traffic delays per commuter in 2020: 24 hours (top 25% of 376 metro areas)
- Deadly crashes per 100,000 people, 2011-2020: 79 per 100,000 people (middle 50% of 376 metro areas)
- Share of deadly crashes caused by weather or road design/conditions: 45.8% (top 10% of 376 metro areas)
- Share of driving deaths involving alcohol: 30.1% (middle 50% of 376 metro areas)
19. Pittsburgh, PA
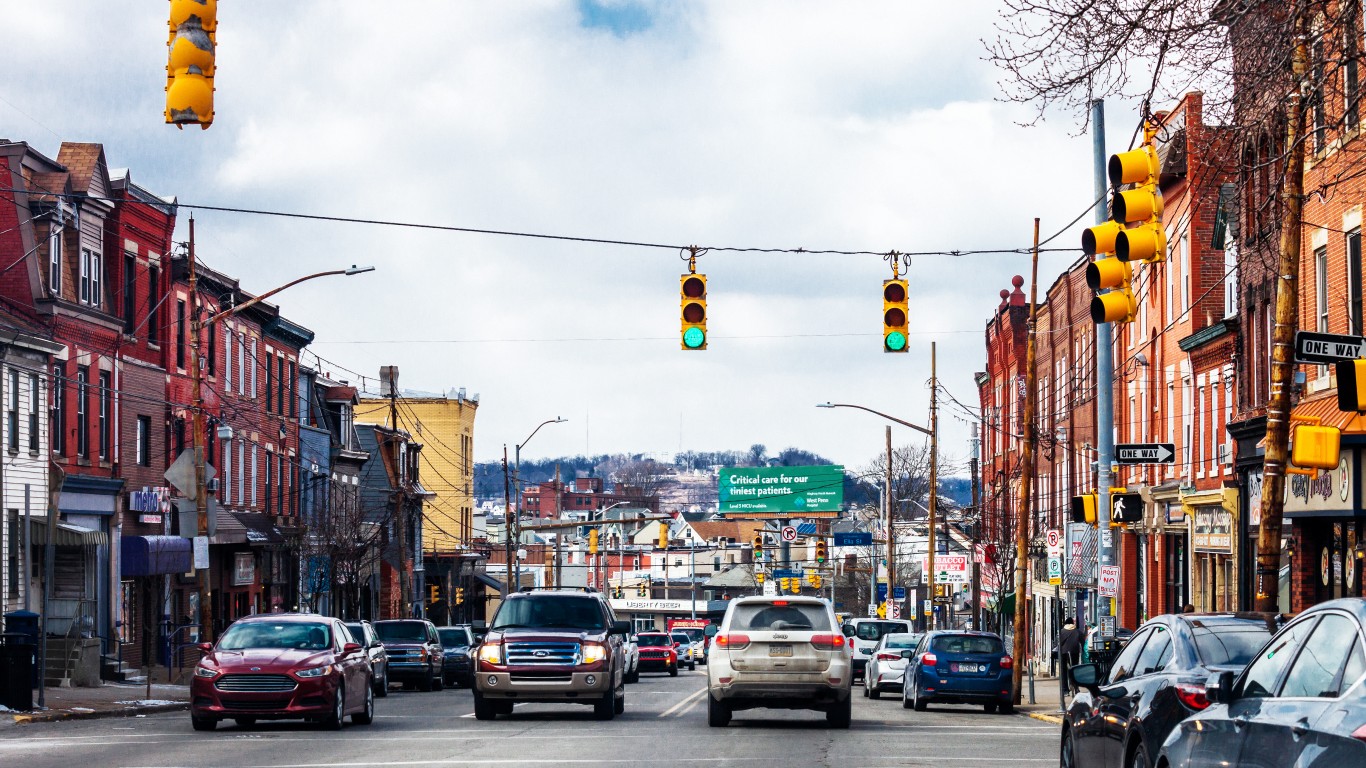
- Avg. traffic delays per commuter in 2020: 25 hours (top 25% of 376 metro areas)
- Deadly crashes per 100,000 people, 2011-2020: 78 per 100,000 people (bottom 25% of 376 metro areas)
- Share of deadly crashes caused by weather or road design/conditions: 19.2% (bottom 25% of 376 metro areas)
- Share of driving deaths involving alcohol: 28.4% (middle 50% of 376 metro areas)
18. Portland-Vancouver-Hillsboro, OR-WA
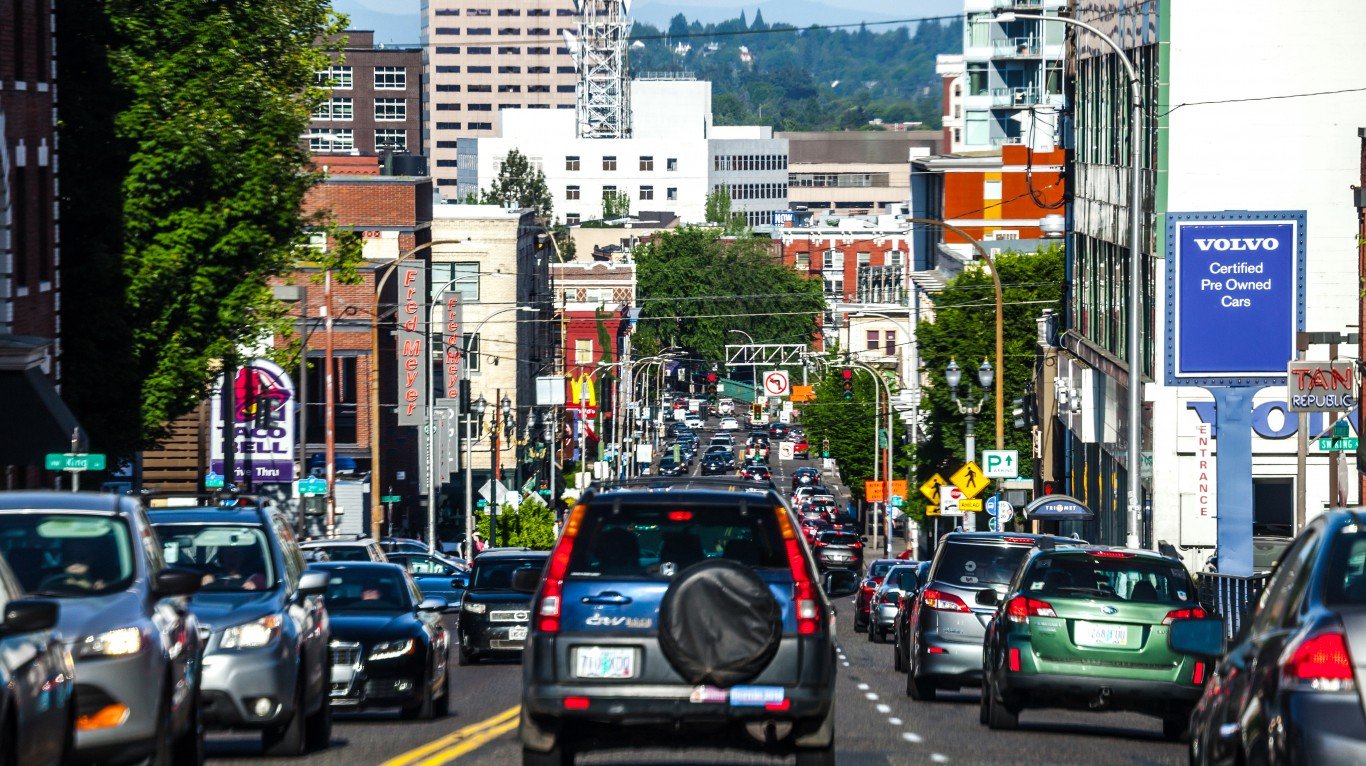
- Avg. traffic delays per commuter in 2020: 31 hours (top 10% of 376 metro areas)
- Deadly crashes per 100,000 people, 2011-2020: 57 per 100,000 people (bottom 10% of 376 metro areas)
- Share of deadly crashes caused by weather or road design/conditions: 38.5% (top 25% of 376 metro areas)
- Share of driving deaths involving alcohol: 27.8% (middle 50% of 376 metro areas)
17. Little Rock-North Little Rock-Conway, AR
- Avg. traffic delays per commuter in 2020: 33 hours (top 10% of 376 metro areas)
- Deadly crashes per 100,000 people, 2011-2020: 131 per 100,000 people (middle 50% of 376 metro areas)
- Share of deadly crashes caused by weather or road design/conditions: 19.6% (middle 50% of 376 metro areas)
- Share of driving deaths involving alcohol: 24.9% (middle 50% of 376 metro areas)
16. Seattle-Tacoma-Bellevue, WA
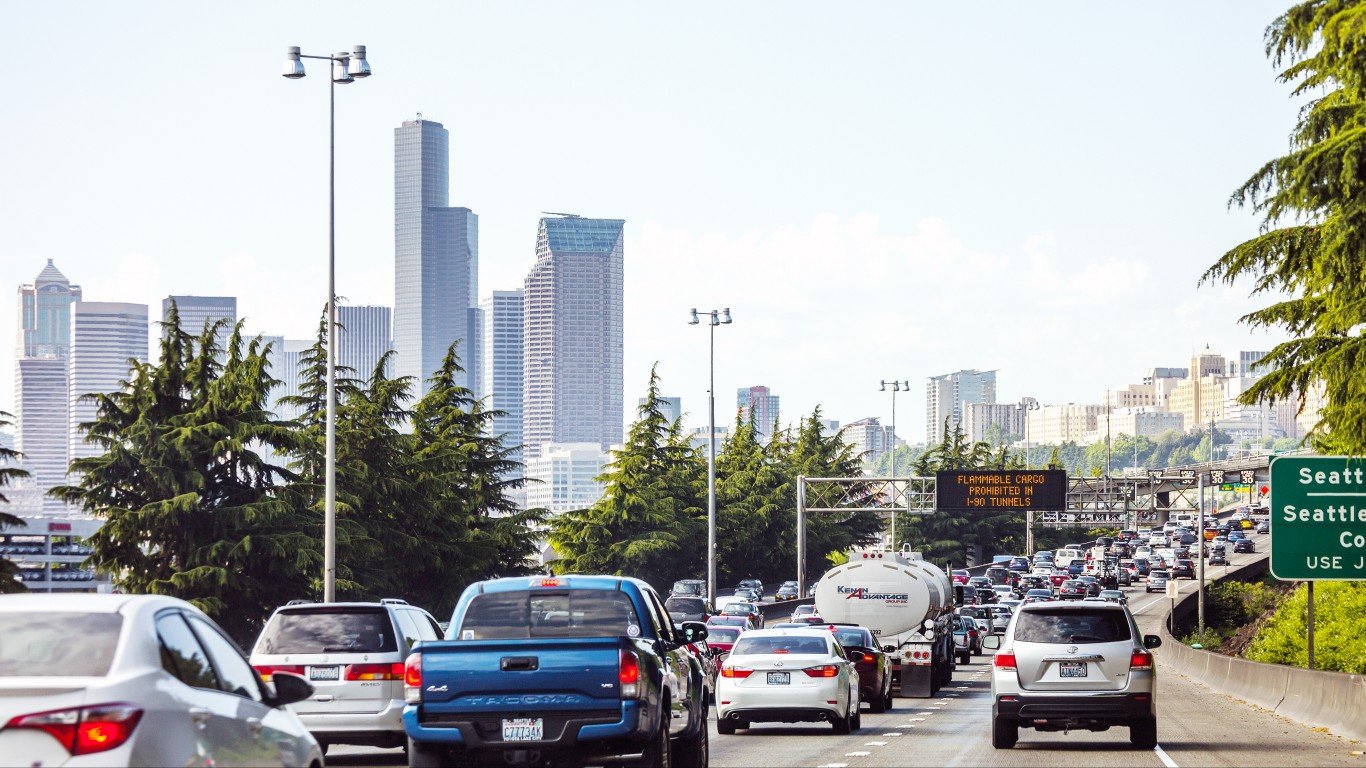
- Avg. traffic delays per commuter in 2020: 31 hours (top 10% of 376 metro areas)
- Deadly crashes per 100,000 people, 2011-2020: 47 per 100,000 people (bottom 10% of 376 metro areas)
- Share of deadly crashes caused by weather or road design/conditions: 35.0% (top 25% of 376 metro areas)
- Share of driving deaths involving alcohol: 31.7% (middle 50% of 376 metro areas)
15. Milwaukee-Waukesha, WI
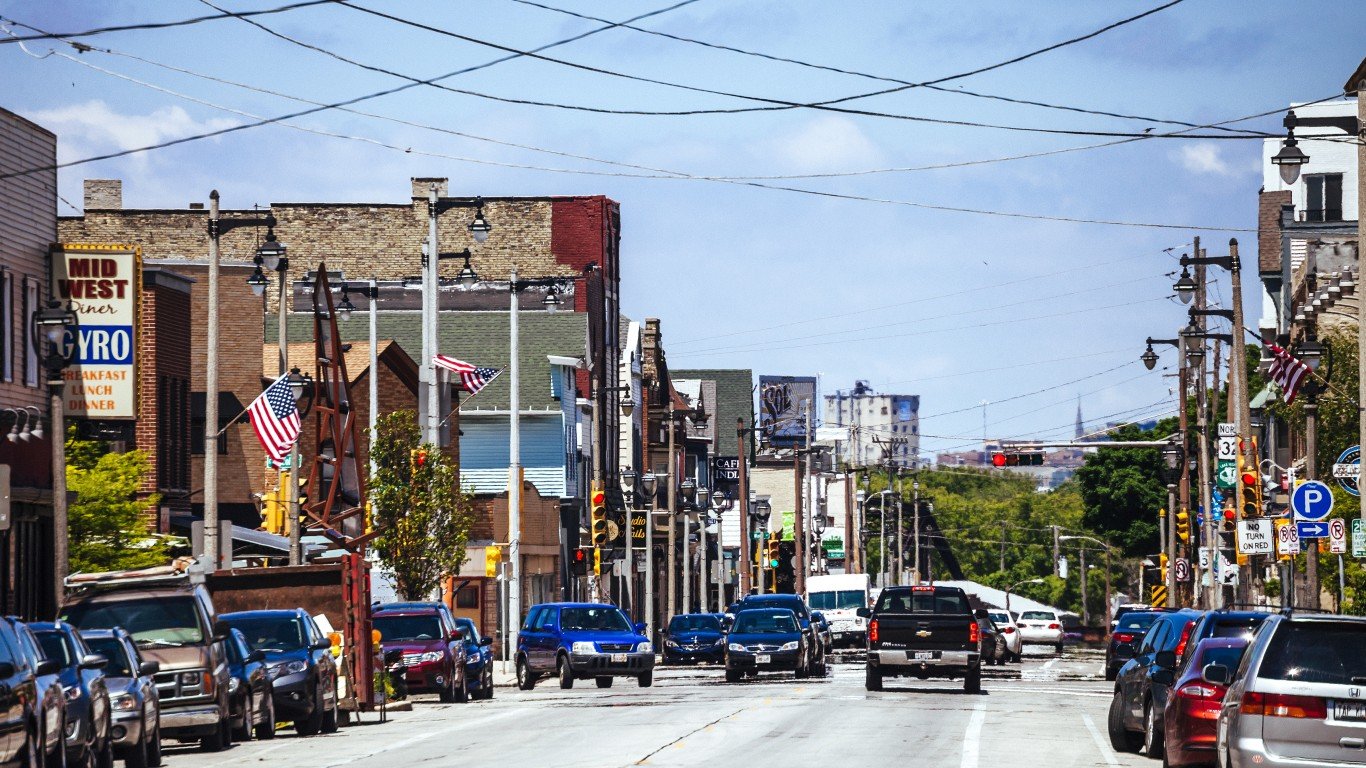
- Avg. traffic delays per commuter in 2020: 29 hours (top 10% of 376 metro areas)
- Deadly crashes per 100,000 people, 2011-2020: 63 per 100,000 people (bottom 25% of 376 metro areas)
- Share of deadly crashes caused by weather or road design/conditions: 44.2% (top 10% of 376 metro areas)
- Share of driving deaths involving alcohol: 28.0% (middle 50% of 376 metro areas)
14. Minneapolis-St. Paul-Bloomington, MN-WI
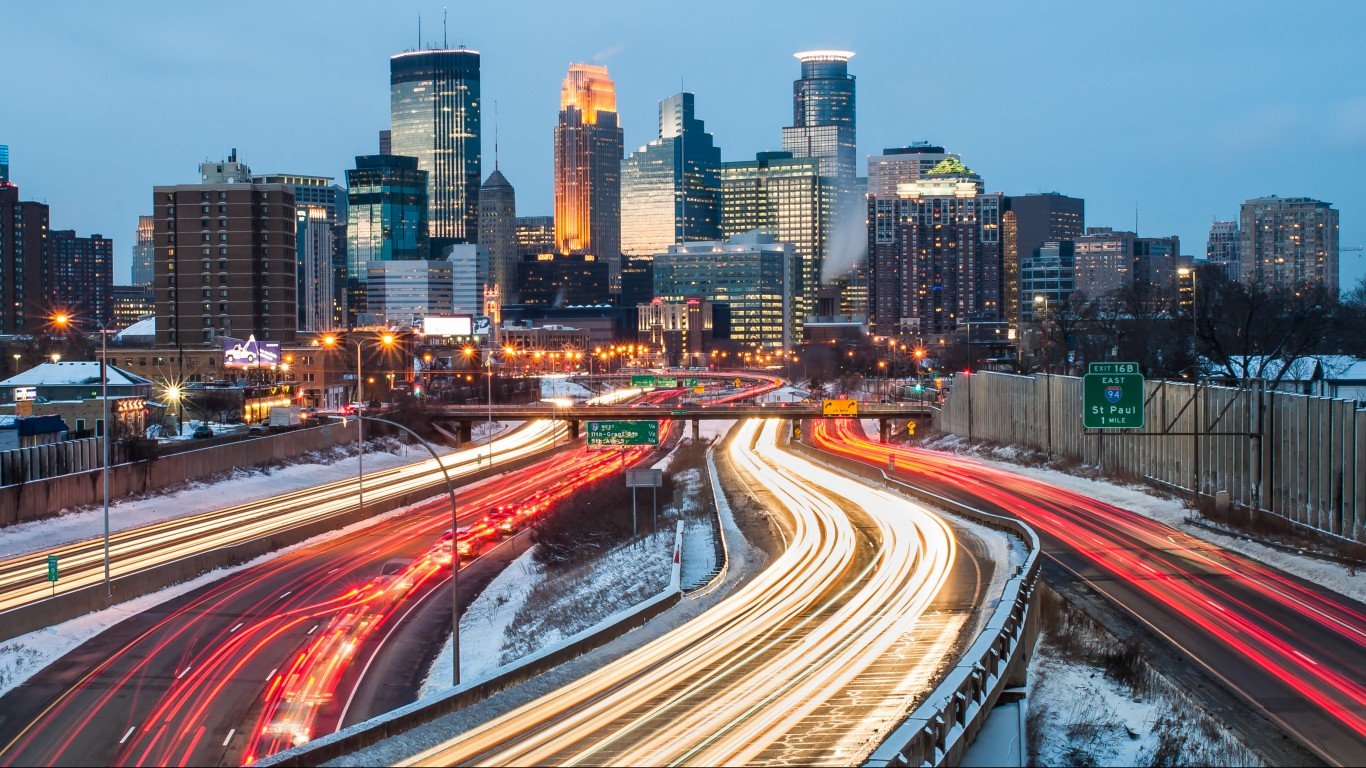
- Avg. traffic delays per commuter in 2020: 32 hours (top 10% of 376 metro areas)
- Deadly crashes per 100,000 people, 2011-2020: 43 per 100,000 people (bottom 10% of 376 metro areas)
- Share of deadly crashes caused by weather or road design/conditions: 36.8% (top 25% of 376 metro areas)
- Share of driving deaths involving alcohol: 31.9% (middle 50% of 376 metro areas)
13. Oklahoma City, OK
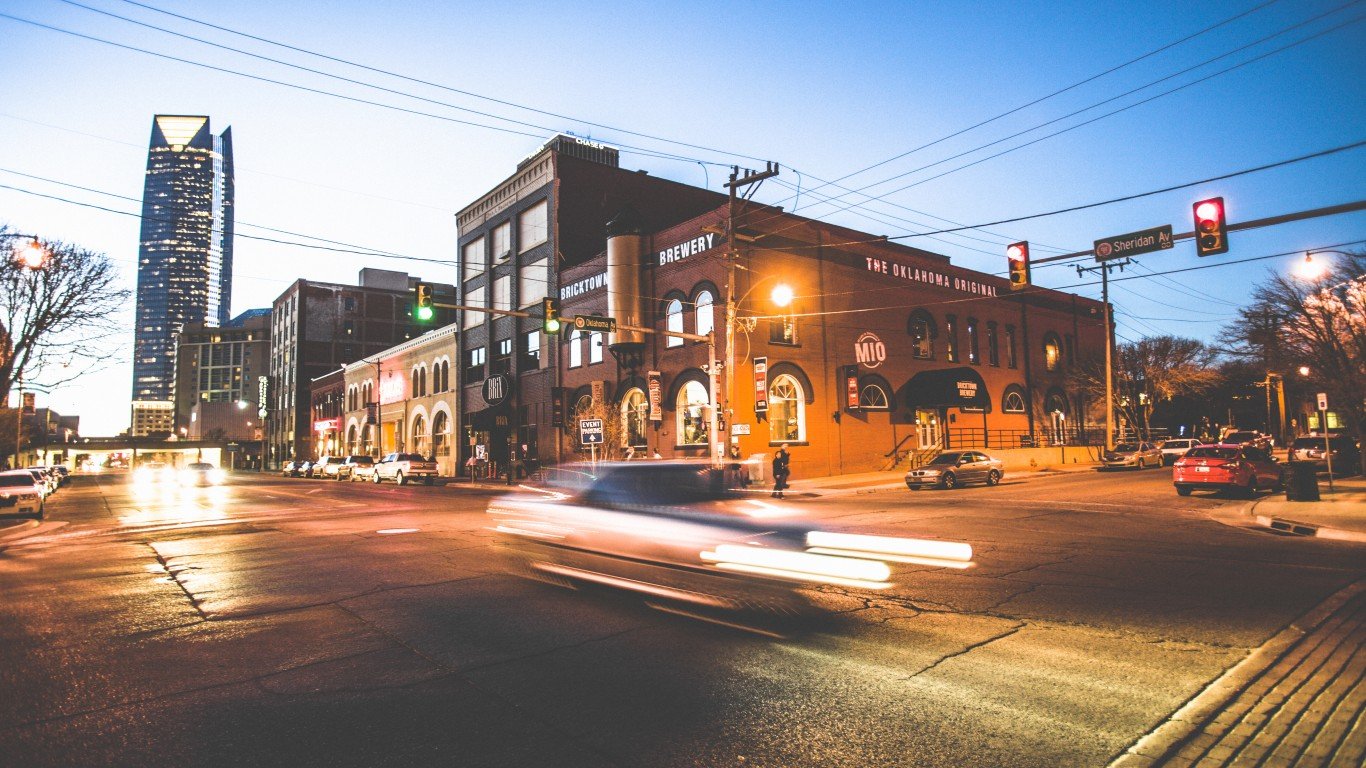
- Avg. traffic delays per commuter in 2020: 35 hours (top 10% of 376 metro areas)
- Deadly crashes per 100,000 people, 2011-2020: 109 per 100,000 people (middle 50% of 376 metro areas)
- Share of deadly crashes caused by weather or road design/conditions: 38.0% (top 25% of 376 metro areas)
- Share of driving deaths involving alcohol: 27.8% (middle 50% of 376 metro areas)
12. Washington-Arlington-Alexandria, DC-VA-MD-WV
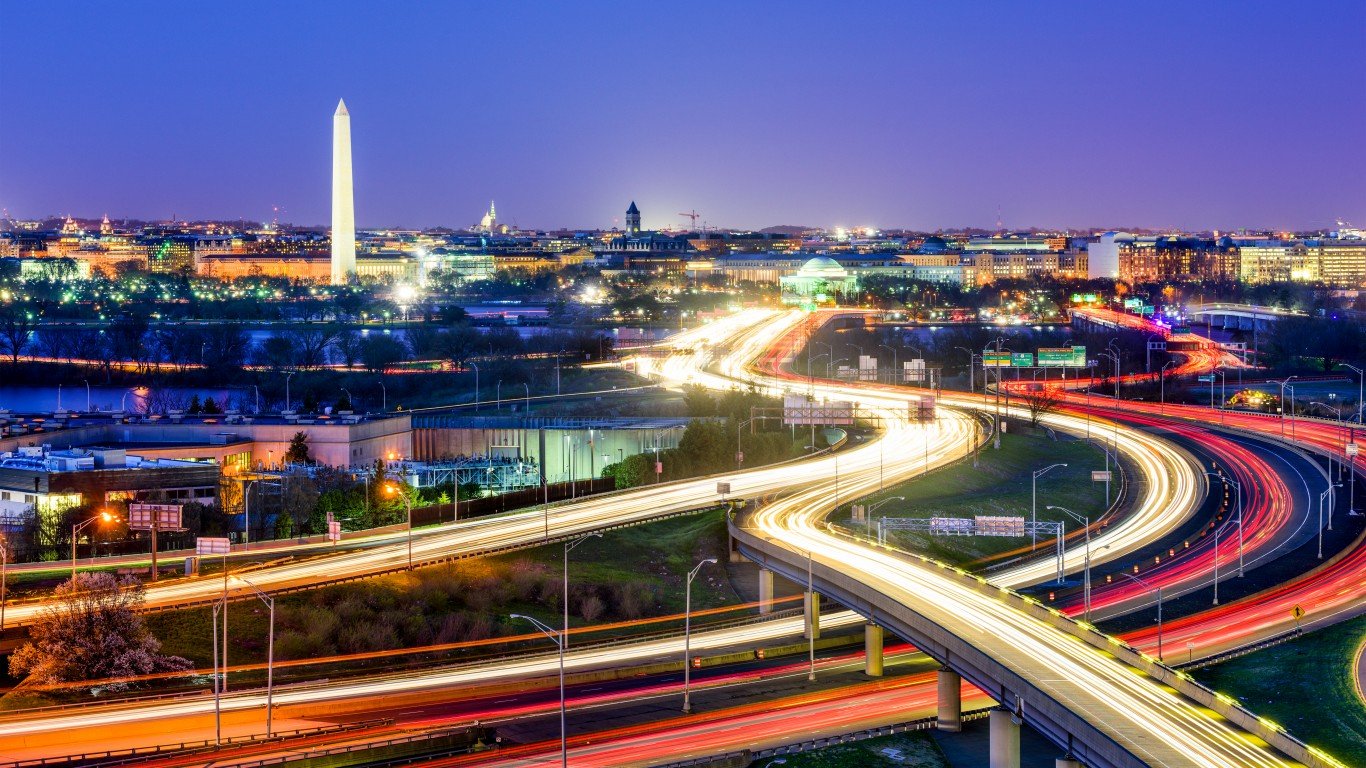
- Avg. traffic delays per commuter in 2020: 42 hours (top 10% of 376 metro areas)
- Deadly crashes per 100,000 people, 2011-2020: 43 per 100,000 people (bottom 10% of 376 metro areas)
- Share of deadly crashes caused by weather or road design/conditions: 26.9% (middle 50% of 376 metro areas)
- Share of driving deaths involving alcohol: 29.0% (middle 50% of 376 metro areas)
11. Cleveland-Elyria, OH
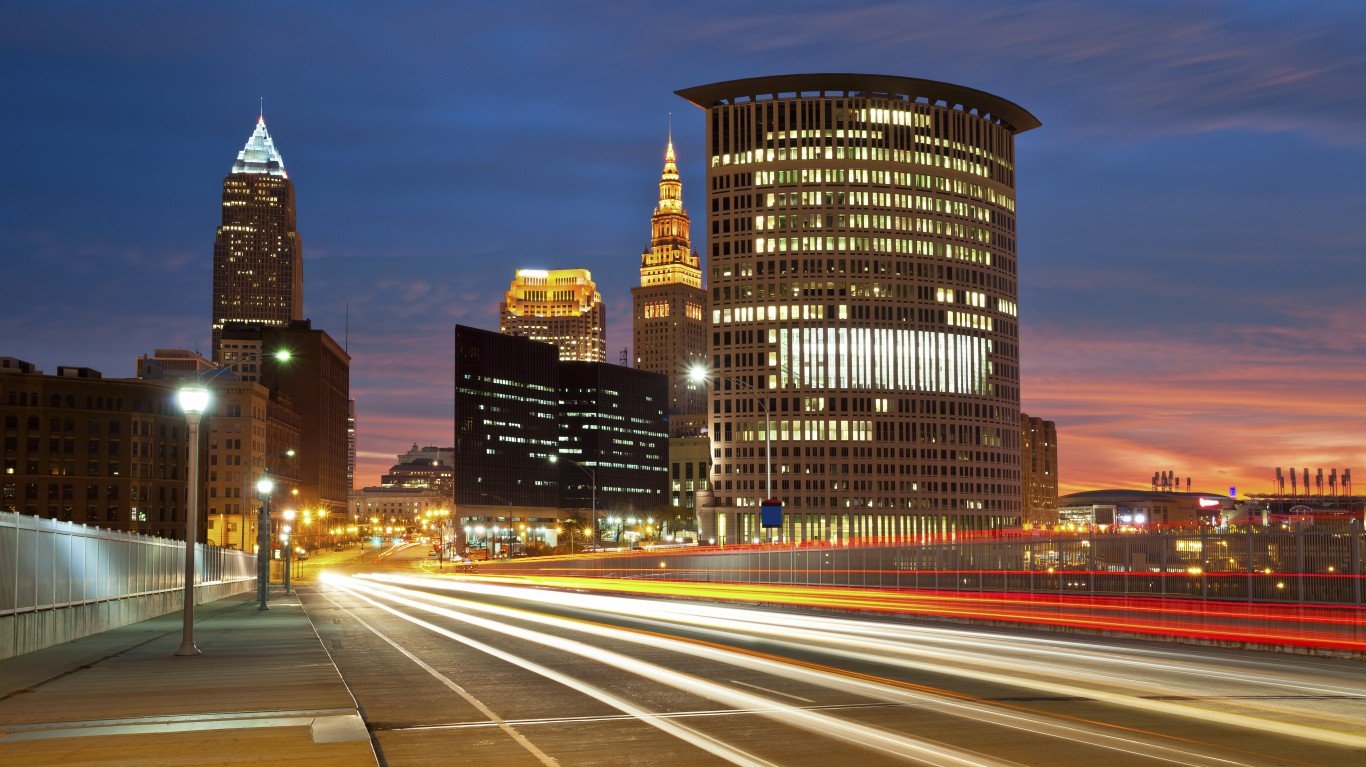
- Avg. traffic delays per commuter in 2020: 29 hours (top 10% of 376 metro areas)
- Deadly crashes per 100,000 people, 2011-2020: 59 per 100,000 people (bottom 10% of 376 metro areas)
- Share of deadly crashes caused by weather or road design/conditions: 42.4% (top 10% of 376 metro areas)
- Share of driving deaths involving alcohol: 40.4% (top 10% of 376 metro areas)
10. Odessa, TX
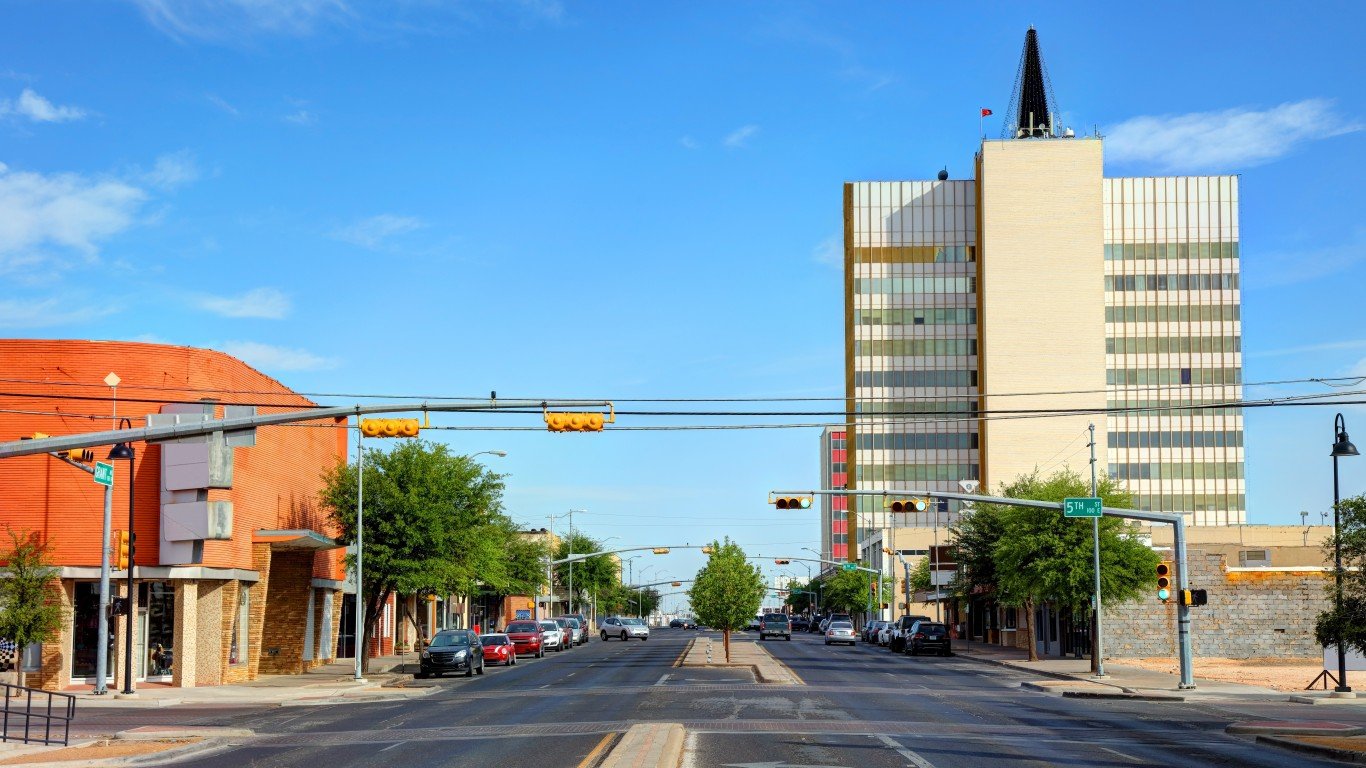
- Avg. traffic delays per commuter in 2020: 30 hours (top 10% of 376 metro areas)
- Deadly crashes per 100,000 people, 2011-2020: 253 per 100,000 people (top 10% of 376 metro areas)
- Share of deadly crashes caused by weather or road design/conditions: 13.2% (bottom 10% of 376 metro areas)
- Share of driving deaths involving alcohol: 37.1% (top 25% of 376 metro areas)
9. Anchorage, AK
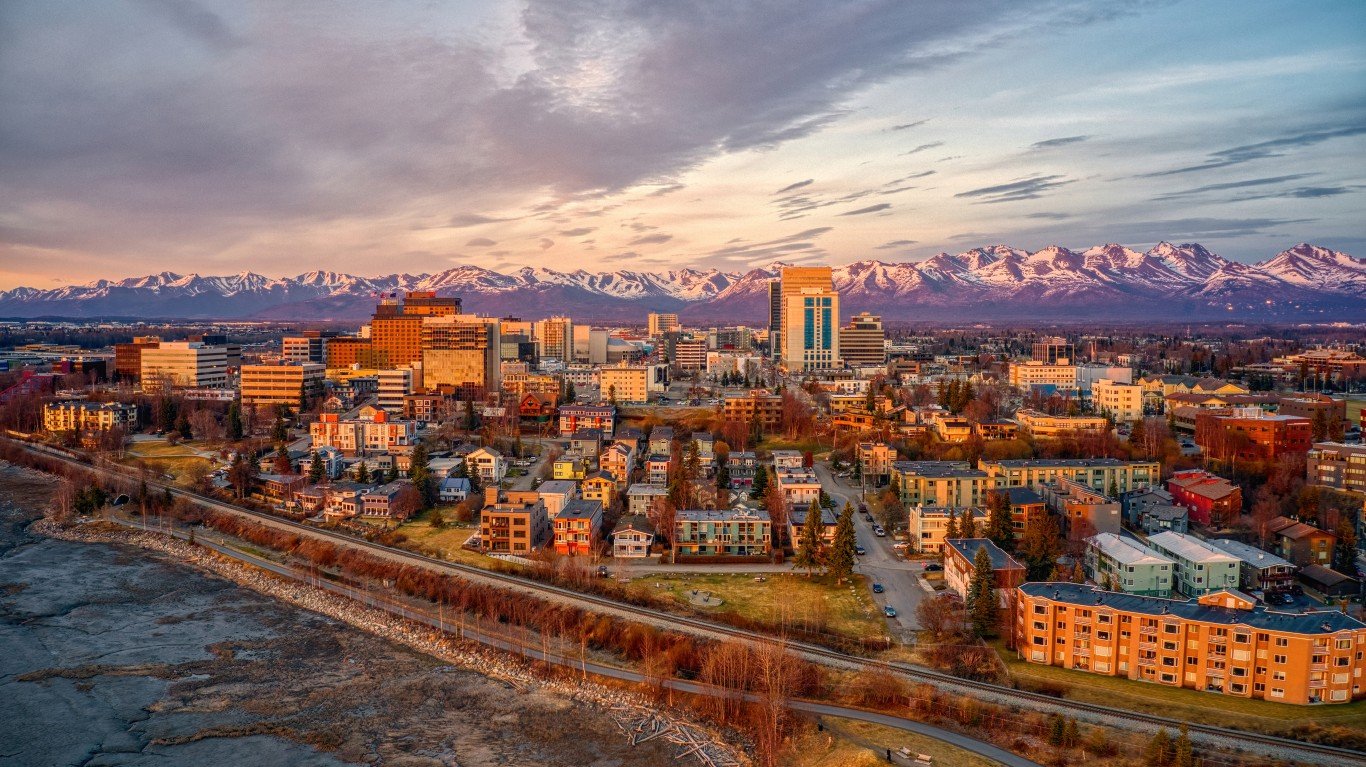
- Avg. traffic delays per commuter in 2020: 18 hours (middle 50% of 376 metro areas)
- Deadly crashes per 100,000 people, 2011-2020: 82 per 100,000 people (middle 50% of 376 metro areas)
- Share of deadly crashes caused by weather or road design/conditions: 51.7% (top 10% of 376 metro areas)
- Share of driving deaths involving alcohol: 30.3% (middle 50% of 376 metro areas)
8. Akron, OH
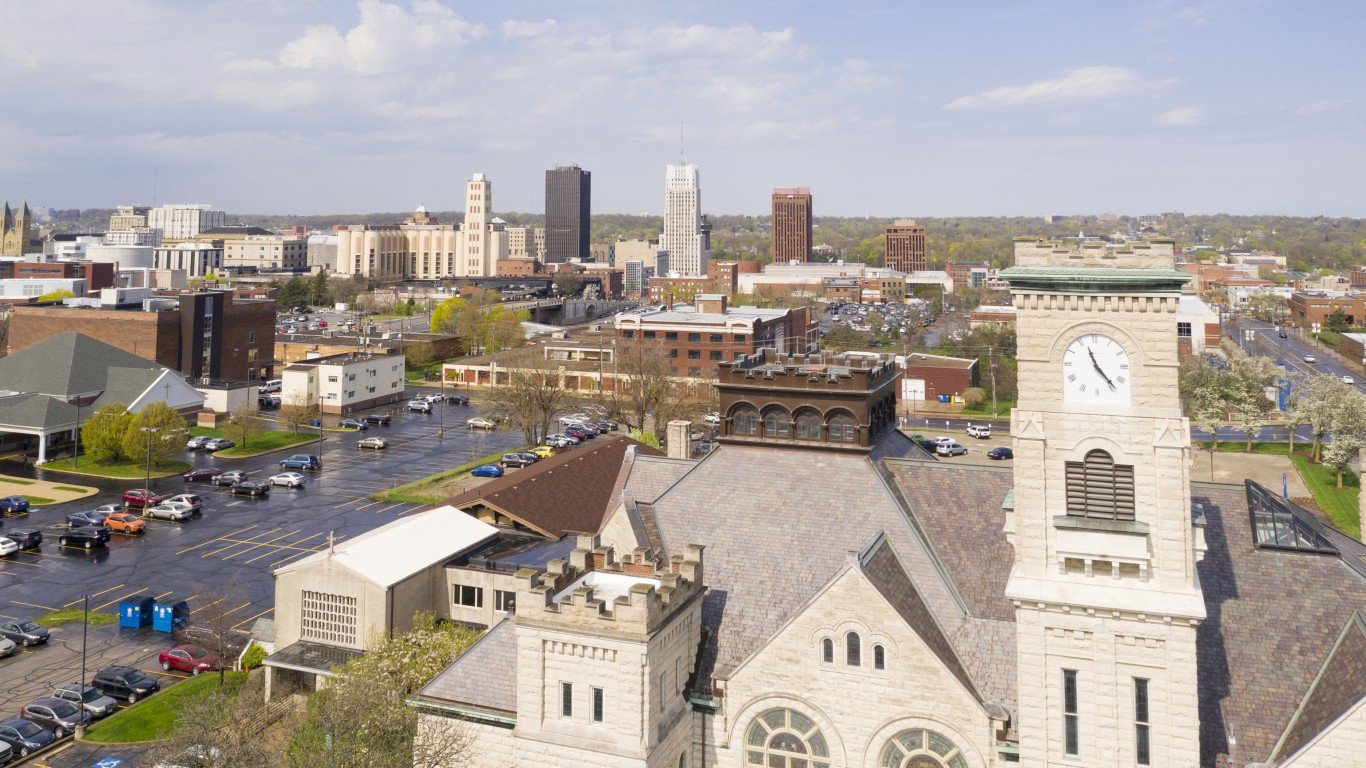
- Avg. traffic delays per commuter in 2020: 27 hours (top 25% of 376 metro areas)
- Deadly crashes per 100,000 people, 2011-2020: 65 per 100,000 people (bottom 25% of 376 metro areas)
- Share of deadly crashes caused by weather or road design/conditions: 46.8% (top 10% of 376 metro areas)
- Share of driving deaths involving alcohol: 38.3% (top 10% of 376 metro areas)
7. Los Angeles-Long Beach-Anaheim, CA
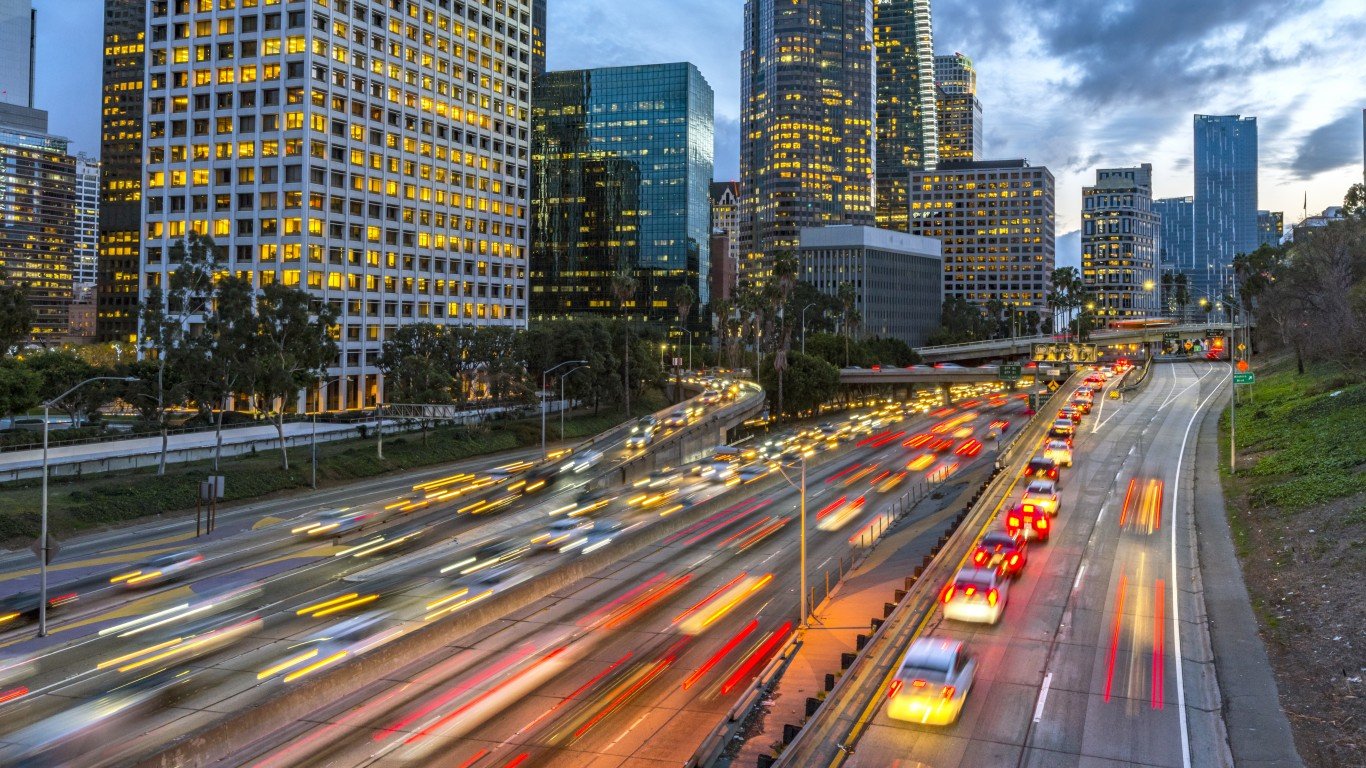
- Avg. traffic delays per commuter in 2020: 46 hours (top 10% of 376 metro areas)
- Deadly crashes per 100,000 people, 2011-2020: 62 per 100,000 people (bottom 10% of 376 metro areas)
- Share of deadly crashes caused by weather or road design/conditions: 13.9% (bottom 10% of 376 metro areas)
- Share of driving deaths involving alcohol: 23.0% (bottom 25% of 376 metro areas)
6. Sacramento-Roseville-Folsom, CA
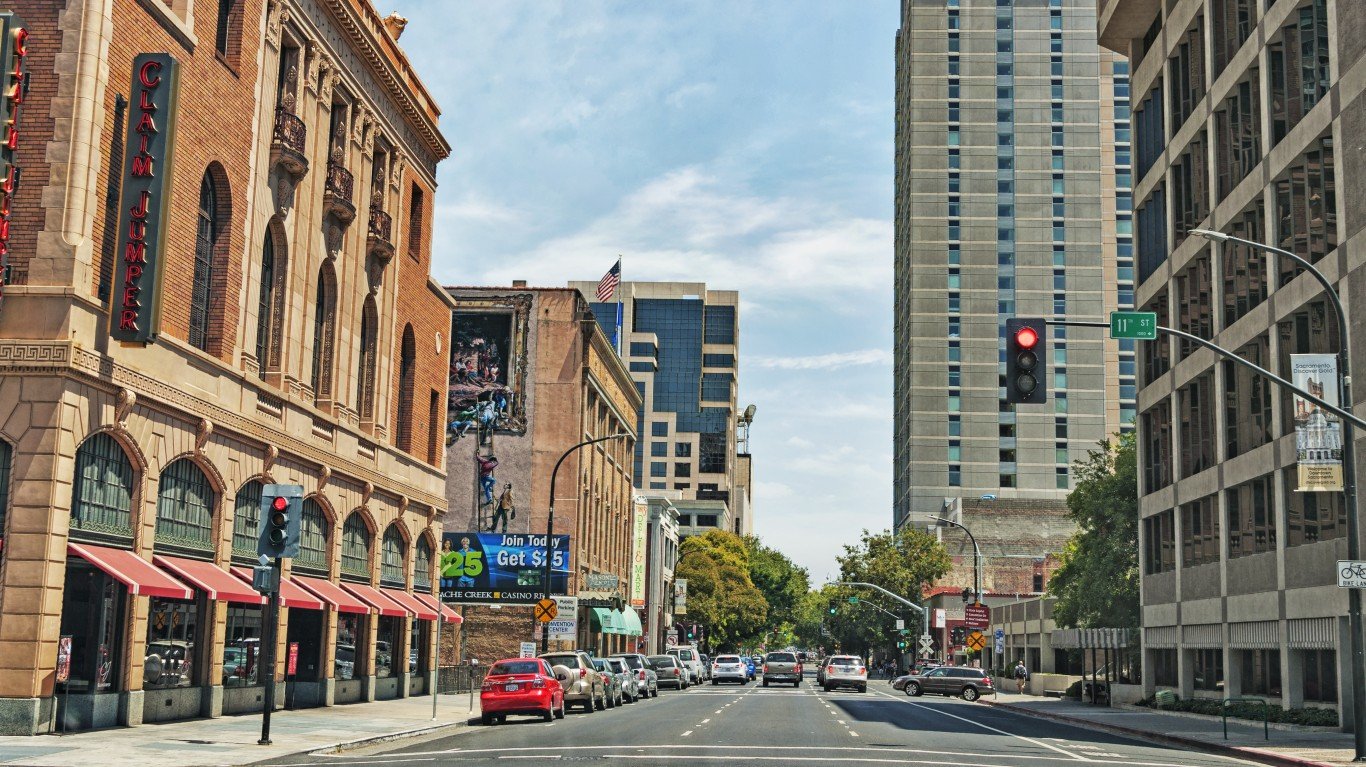
- Avg. traffic delays per commuter in 2020: 38 hours (top 10% of 376 metro areas)
- Deadly crashes per 100,000 people, 2011-2020: 85 per 100,000 people (middle 50% of 376 metro areas)
- Share of deadly crashes caused by weather or road design/conditions: 18.7% (bottom 25% of 376 metro areas)
- Share of driving deaths involving alcohol: 27.3% (middle 50% of 376 metro areas)
5. New York-Newark-Jersey City, NY-NJ-PA

- Avg. traffic delays per commuter in 2020: 56 hours (top 10% of 376 metro areas)
- Deadly crashes per 100,000 people, 2011-2020: 43 per 100,000 people (bottom 10% of 376 metro areas)
- Share of deadly crashes caused by weather or road design/conditions: 24.7% (middle 50% of 376 metro areas)
- Share of driving deaths involving alcohol: 19.2% (bottom 10% of 376 metro areas)
4. Houston-The Woodlands-Sugar Land, TX
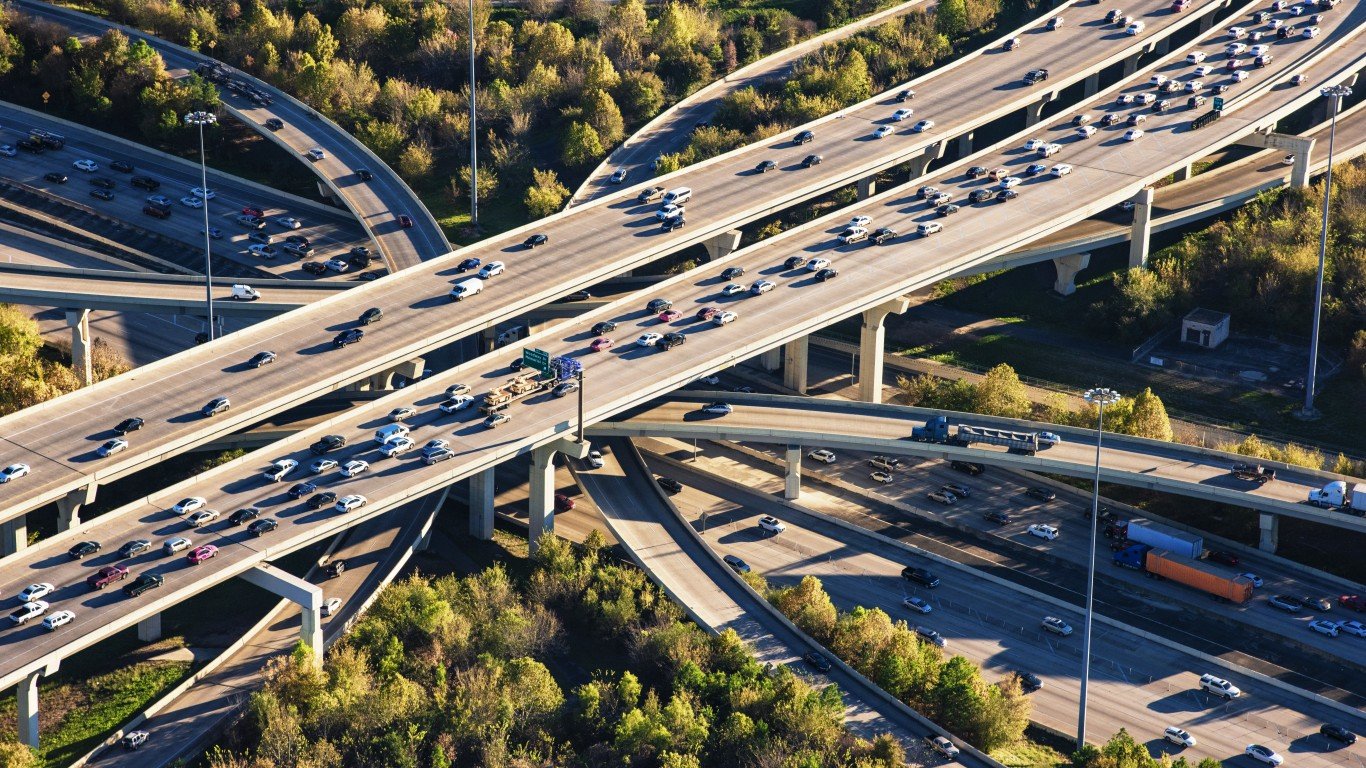
- Avg. traffic delays per commuter in 2020: 49 hours (top 10% of 376 metro areas)
- Deadly crashes per 100,000 people, 2011-2020: 85 per 100,000 people (middle 50% of 376 metro areas)
- Share of deadly crashes caused by weather or road design/conditions: 28.6% (middle 50% of 376 metro areas)
- Share of driving deaths involving alcohol: 30.7% (middle 50% of 376 metro areas)
3. San Francisco-Oakland-Berkeley, CA
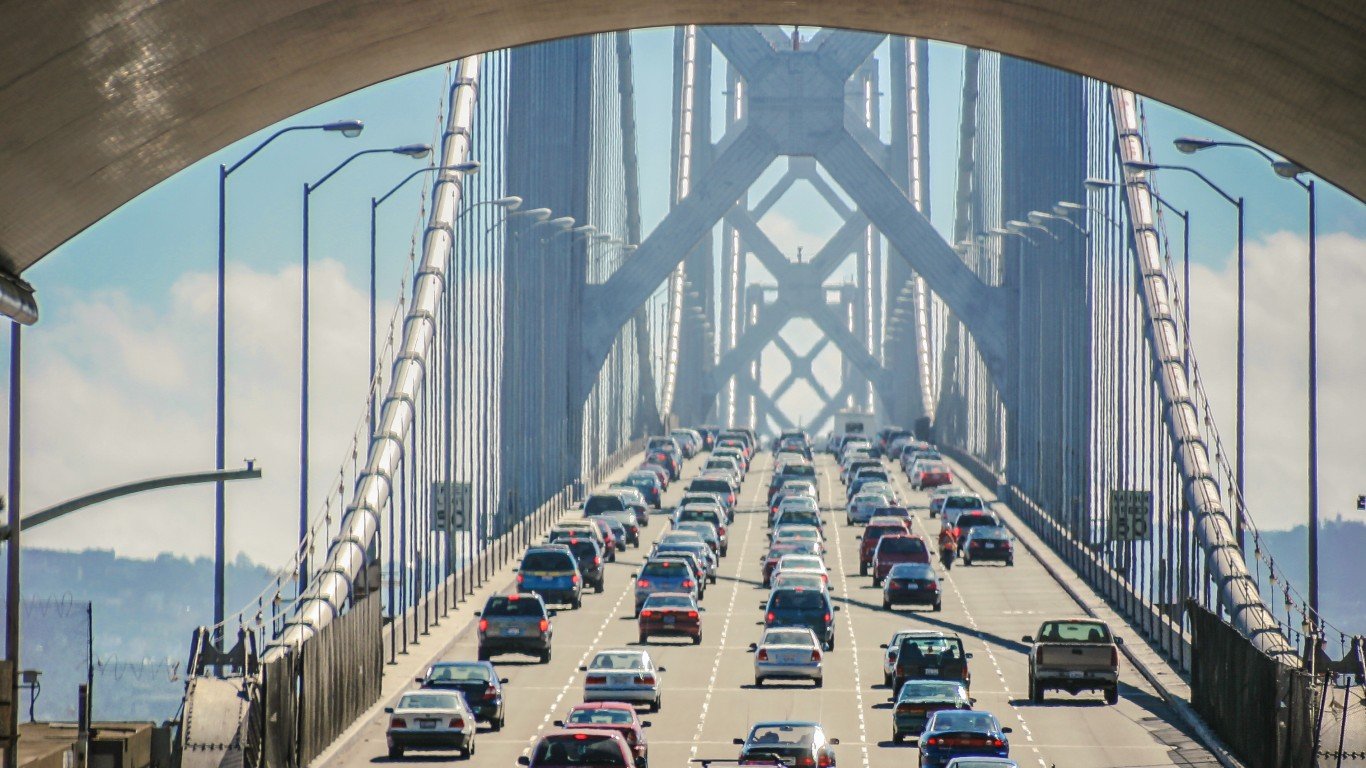
- Avg. traffic delays per commuter in 2020: 46 hours (top 10% of 376 metro areas)
- Deadly crashes per 100,000 people, 2011-2020: 47 per 100,000 people (bottom 10% of 376 metro areas)
- Share of deadly crashes caused by weather or road design/conditions: 22.3% (middle 50% of 376 metro areas)
- Share of driving deaths involving alcohol: 23.7% (middle 50% of 376 metro areas)
2. Boston-Cambridge-Newton, MA-NH
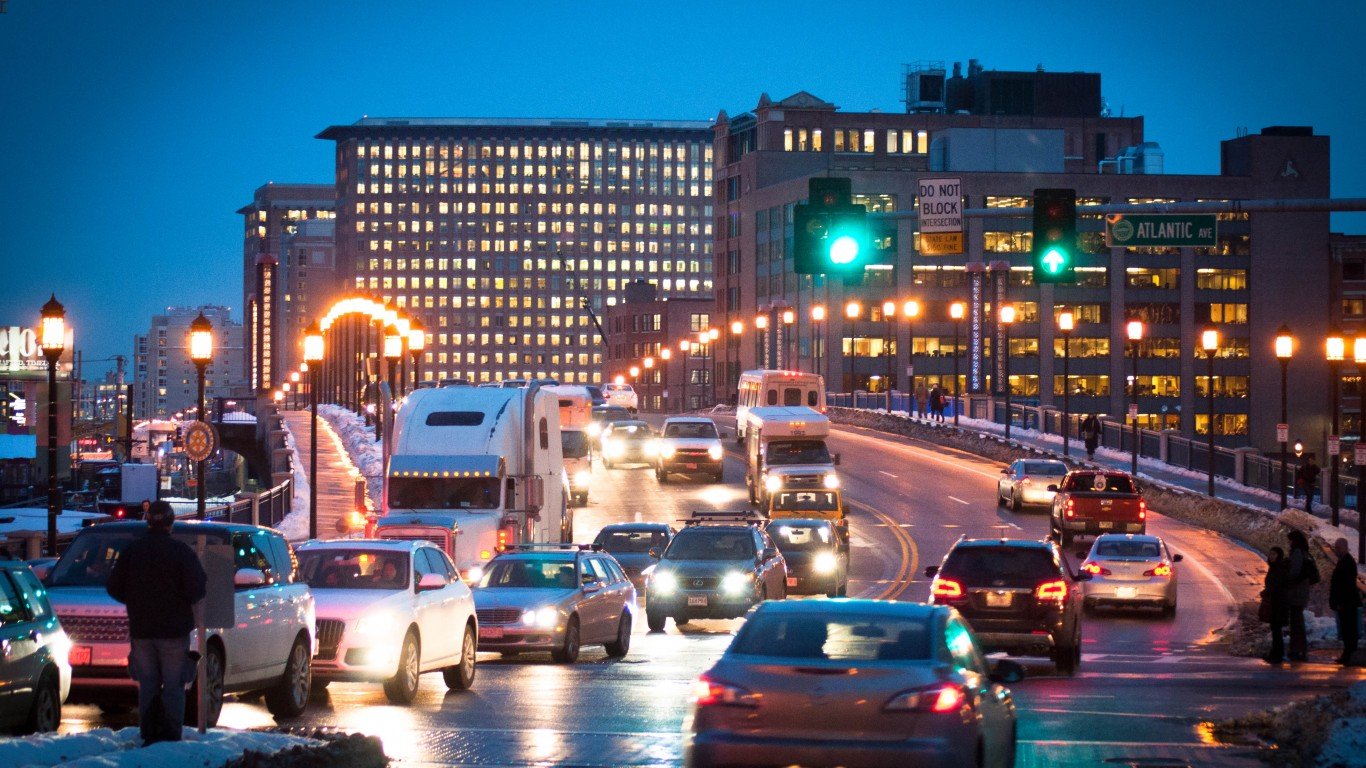
- Avg. traffic delays per commuter in 2020: 50 hours (top 10% of 376 metro areas)
- Deadly crashes per 100,000 people, 2011-2020: 42 per 100,000 people (bottom 10% of 376 metro areas)
- Share of deadly crashes caused by weather or road design/conditions: 26.2% (middle 50% of 376 metro areas)
- Share of driving deaths involving alcohol: 30.4% (middle 50% of 376 metro areas)
1. Fairbanks, AK
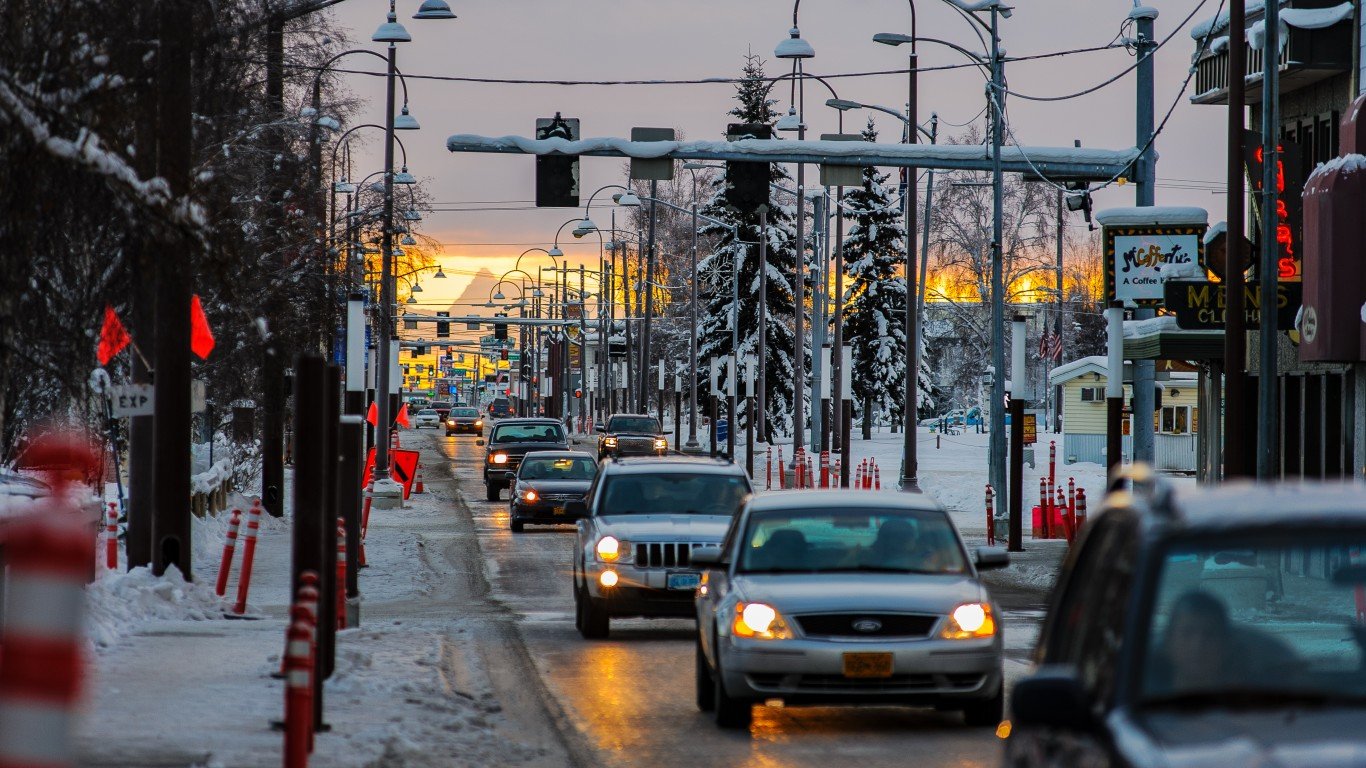
- Avg. traffic delays per commuter in 2020: 14 hours (middle 50% of 376 metro areas)
- Deadly crashes per 100,000 people, 2011-2020: 85 per 100,000 people (middle 50% of 376 metro areas)
- Share of deadly crashes caused by weather or road design/conditions: 38.1% (top 25% of 376 metro areas)
- Share of driving deaths involving alcohol: 37.0% (top 25% of 376 metro areas)
Contact [email protected] for any questions or corrections.