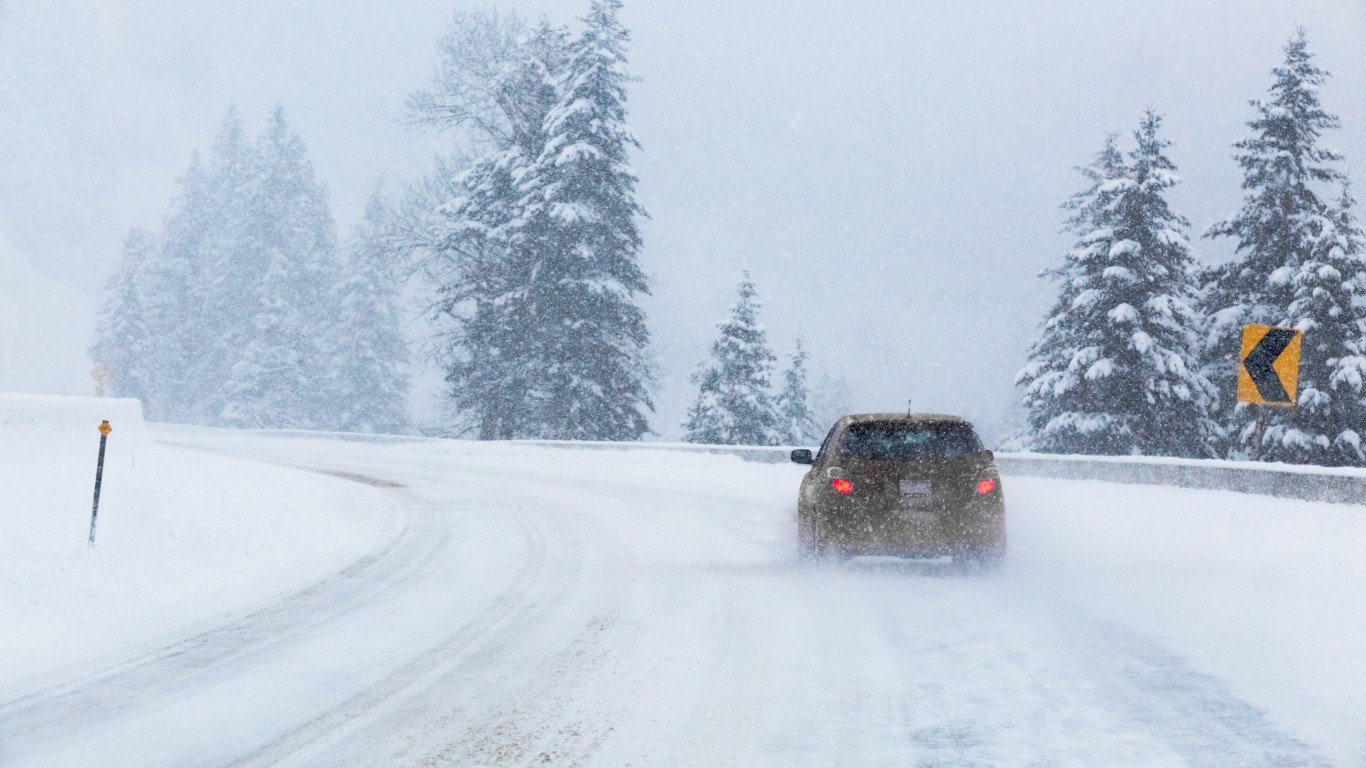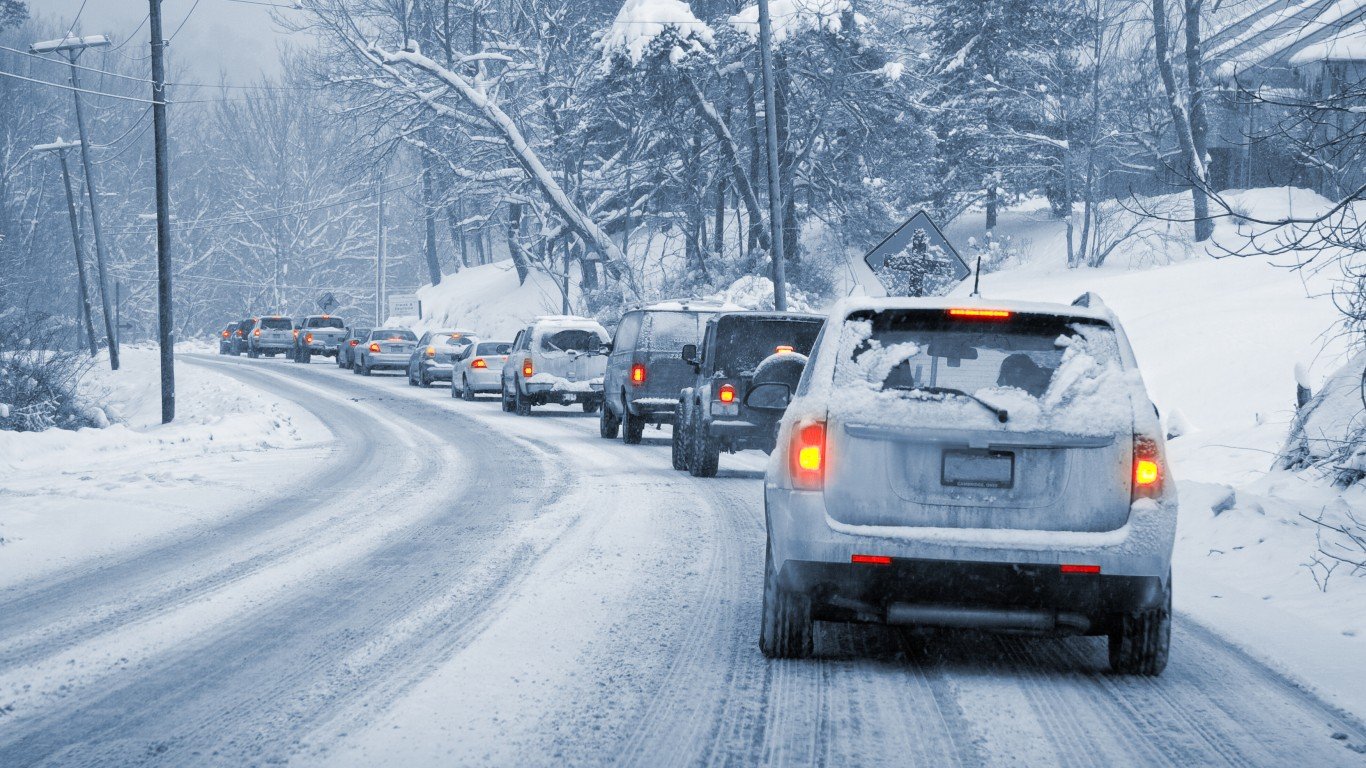
In much of the country, the winter months can be among the most dangerous for motorists. According to the Department of Transportation, nearly a quarter of all weather-related crashes in the U.S. occur on icy, slushy, and snowy roads. These conditions contribute to more than 1,300 roadway deaths and over 116,800 injuries every year in the United States.
Nationwide, fatal crashes occur disproportionately in rural areas. Data from the DOT shows that rural roads account for only 32% of vehicle miles traveled in the U.S. — yet 40% of all roadway fatalities happen on rural roads.
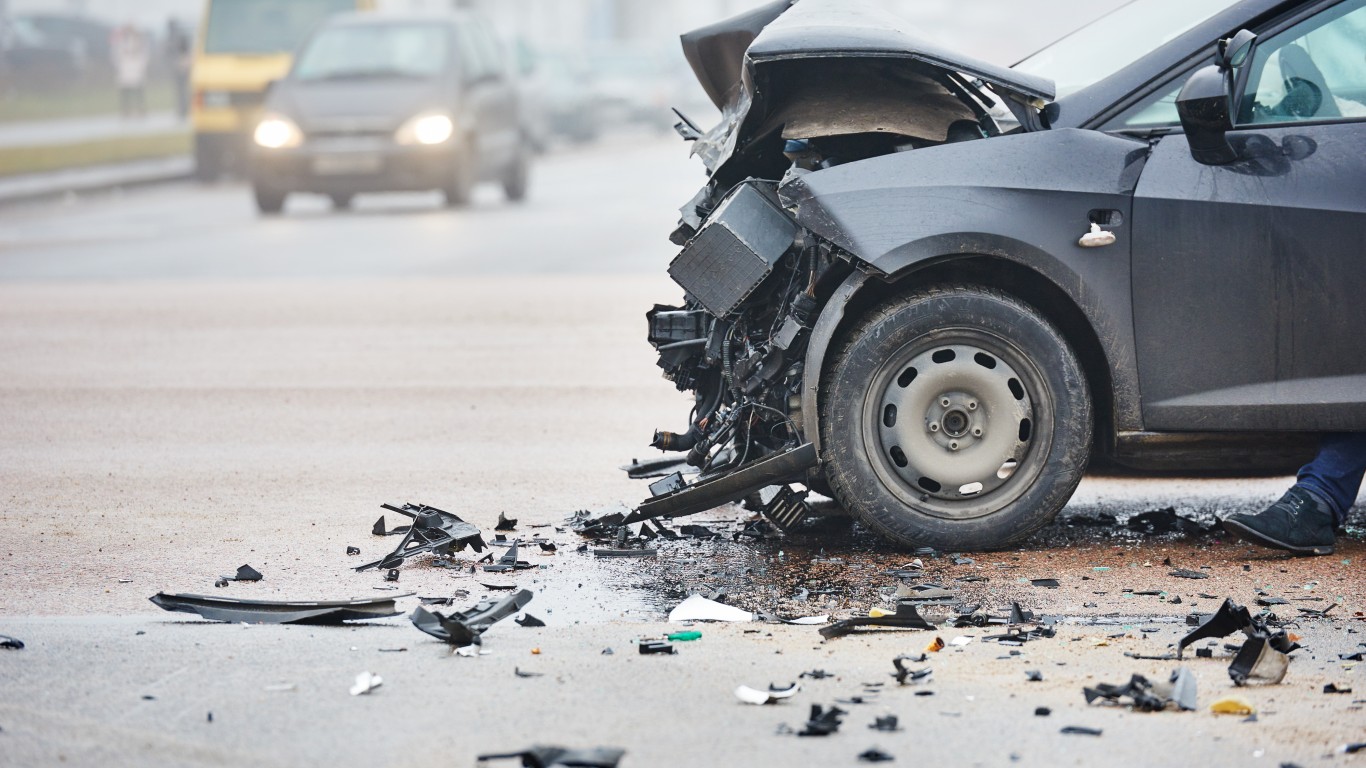
Though cities are statistically safer for drivers, urban roads are by no means immune to the hazards associated with winter driving, especially in some cities. There were more than 1,200 fatal winter-weather crashes across 244 U.S. metropolitan areas between 2017 and 2021. These deadly crashes were especially concentrated in certain cities. (Here is a look at the most challenging American cities to drive in.)
Using data from the National Highway Traffic Safety Administration, 24/7 Wall St. identified the worst American cities for winter driving. Metro areas are ranked on the total number of fatal crashes between 2017 and 2021 in winter weather conditions — including snow, sleet, and freezing rain — for every 100,000 commuters who either drive or carpool to work. To calculate fatal crash rates in winter weather, county data was aggregated up to the metro area level and adjusted using five-year commuting data from the U.S. Census Bureau’s 2022 American Community Survey. Metro areas with fewer than five fatal winter-weather crashes between 2017 and 2021 were excluded from analysis.
In the 50 metro areas on this list, a cumulative total of 583 fatal winter-weather crashes were reported in the last five years. In these cities, fatal winter crash rates range from about 2 for every 100,000 commuters who drive or carpool, to 20 per 100,000.
Most metro areas on this list are in the Midwest, including seven in Michigan and six in Ohio. The 10 Western cities that rank among the worst for winter driving include both Anchorage and Fairbanks, the only two metro areas in Alaska. Maine, New York and Pennsylvania are the only states in the Northeast represented on this list and only two Southern metro areas rank among the worst cities for winter driving. (Here is a look at the states with the best weather year round.)
These are the worst cities for winter driving.
50. Chicago-Naperville-Elgin, IL-IN-WI

- Winter weather fatal crash rate, 2017-2021: 2.0 per 100,000 commuters who drive or carpool
- Total fatal crashes in winter conditions, 2017-2021: 70
- Most fatal winter-weather crashes in a single year, 2017-2021: 20 (28.6% of 5-yr. total)
- Avg. number of fatal crashes in winter conditions, 2017-2021: 14.0 per year
- Total commuters who drive or carpool: 3,443,445 (72.9% of all commuters)
49. Madison, WI
- Winter weather fatal crash rate, 2017-2021: 2.1 per 100,000 commuters who drive or carpool
- Total fatal crashes in winter conditions, 2017-2021: 6
- Most fatal winter-weather crashes in a single year, 2017-2021: 4 (66.7% of 5-yr. total)
- Avg. number of fatal crashes in winter conditions, 2017-2021: 1.2 per year
- Total commuters who drive or carpool: 283,052 (75.1% of all commuters)
48. Rochester, NY
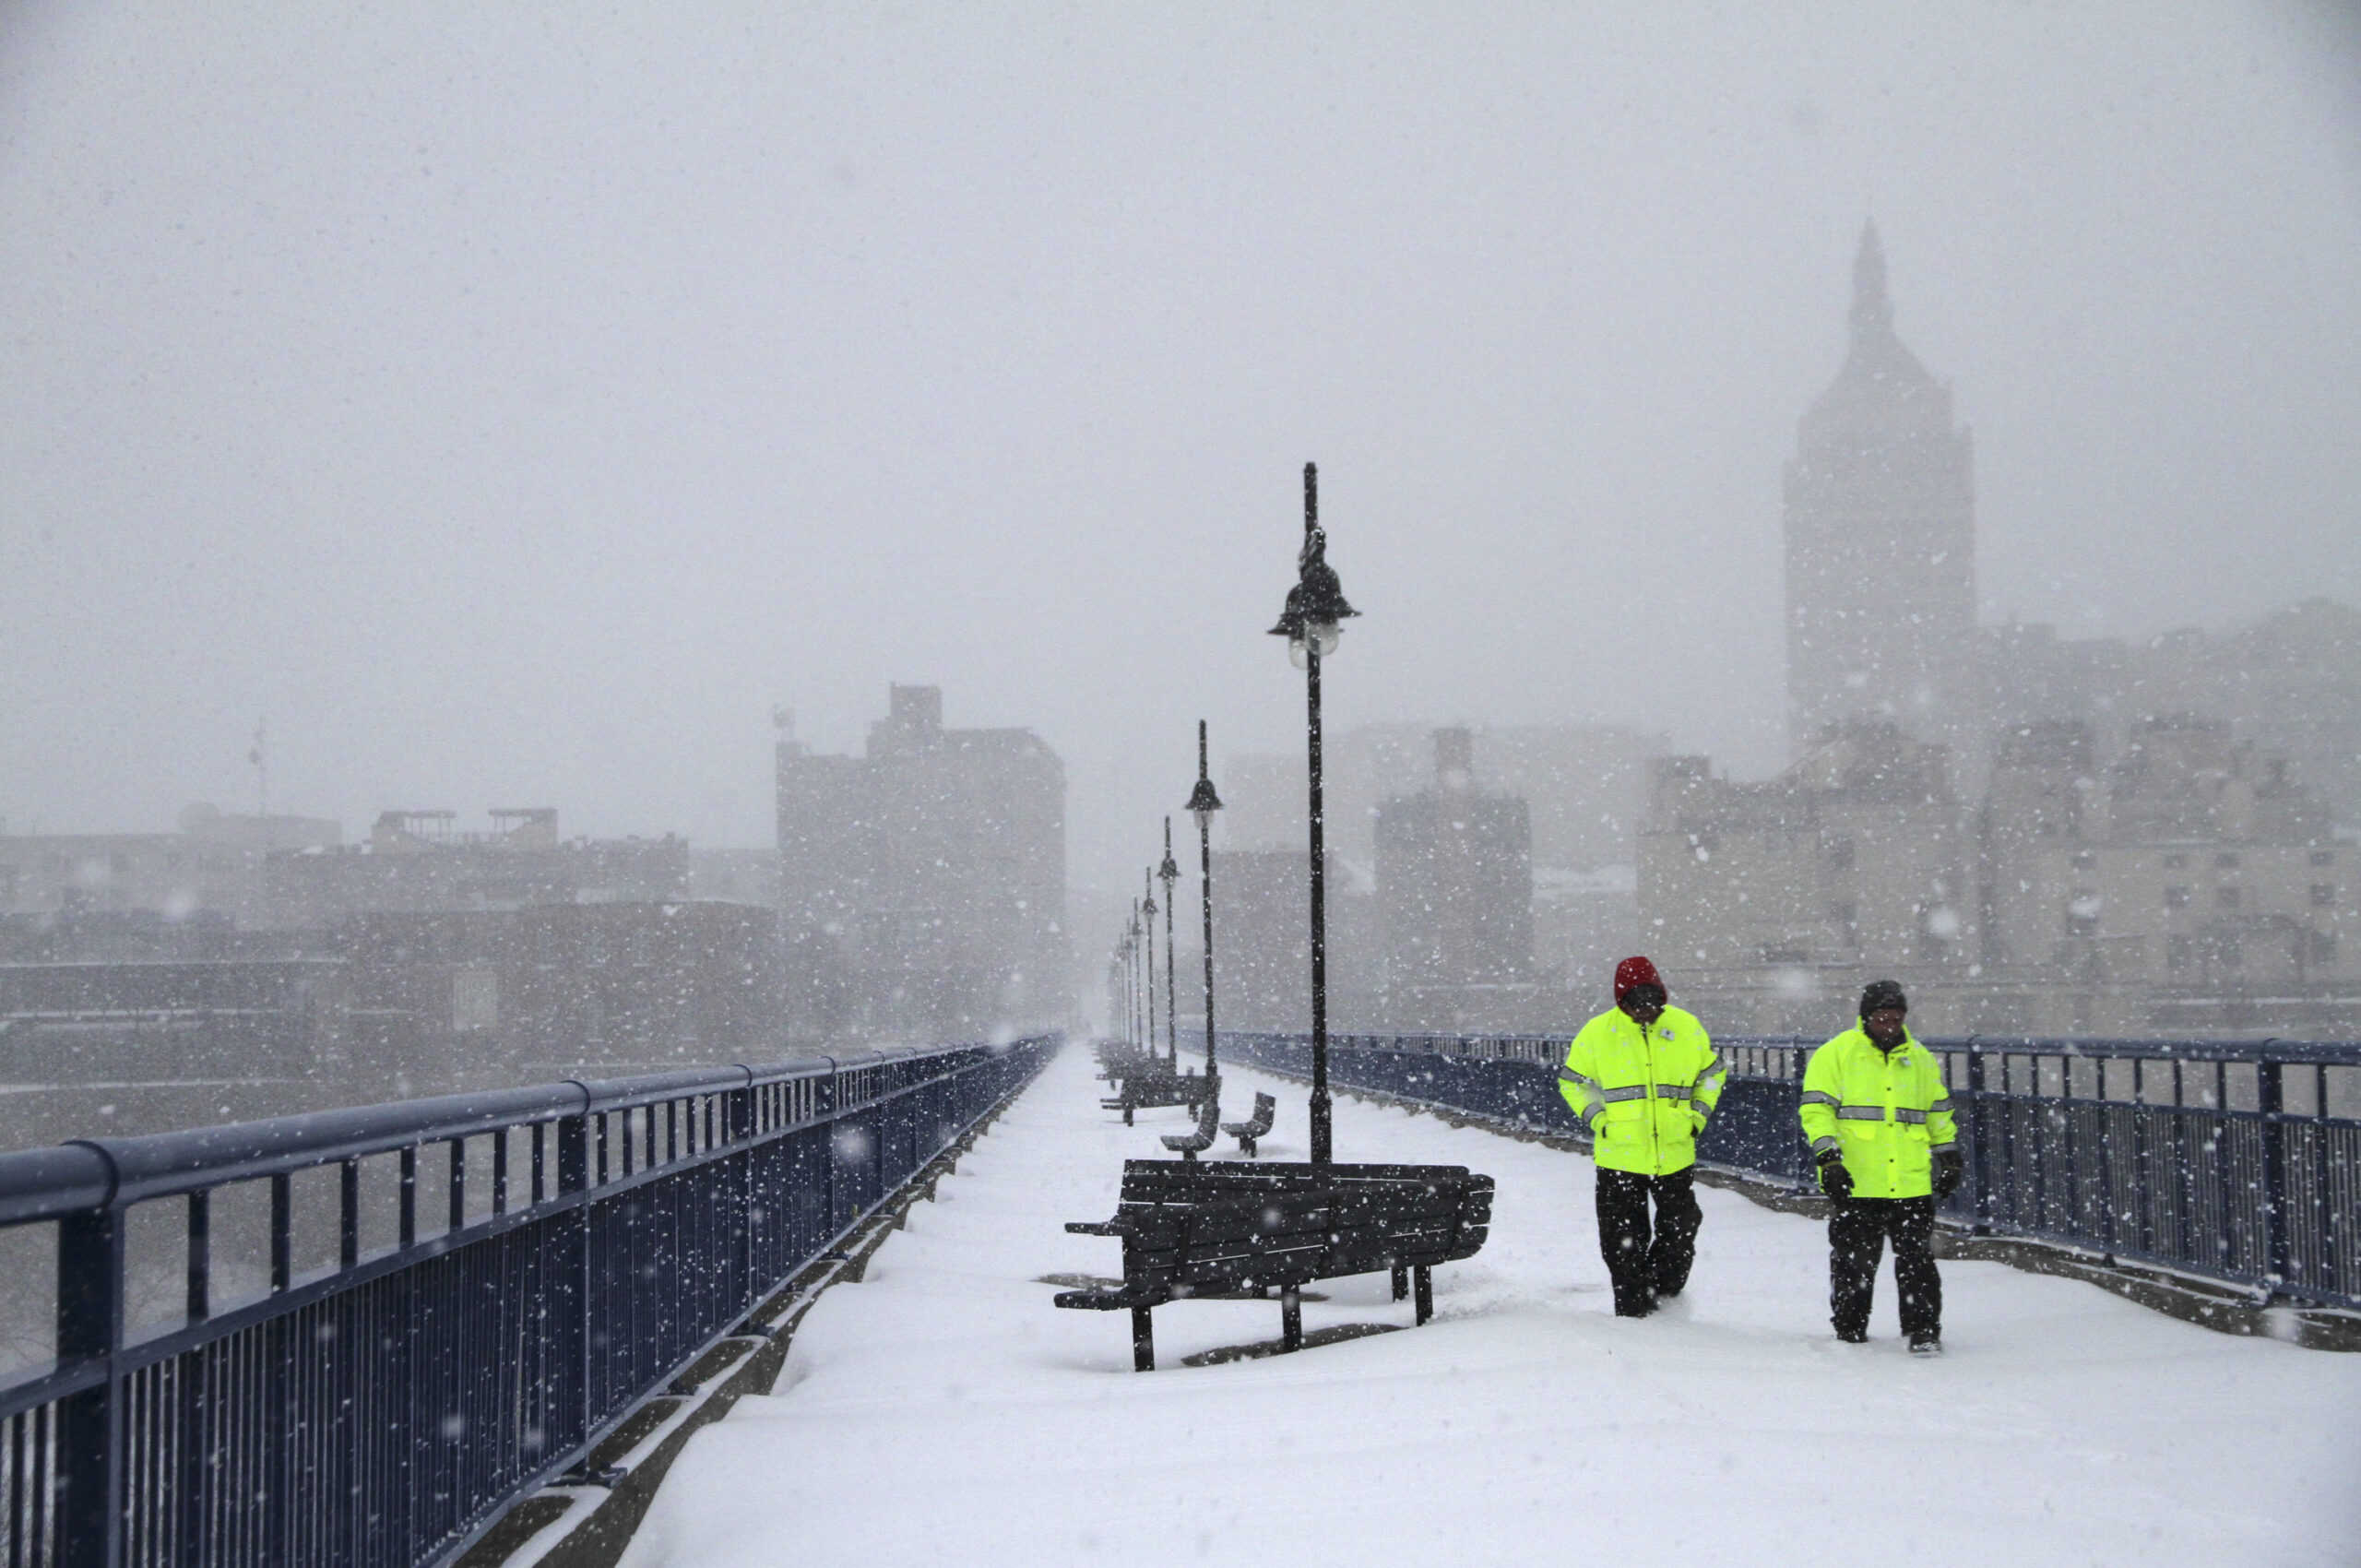
- Winter weather fatal crash rate, 2017-2021: 2.3 per 100,000 commuters who drive or carpool
- Total fatal crashes in winter conditions, 2017-2021: 10
- Most fatal winter-weather crashes in a single year, 2017-2021: 3 (30.0% of 5-yr. total)
- Avg. number of fatal crashes in winter conditions, 2017-2021: 2.0 per year
- Total commuters who drive or carpool: 433,395 (83.5% of all commuters)
47. Detroit-Warren-Dearborn, MI
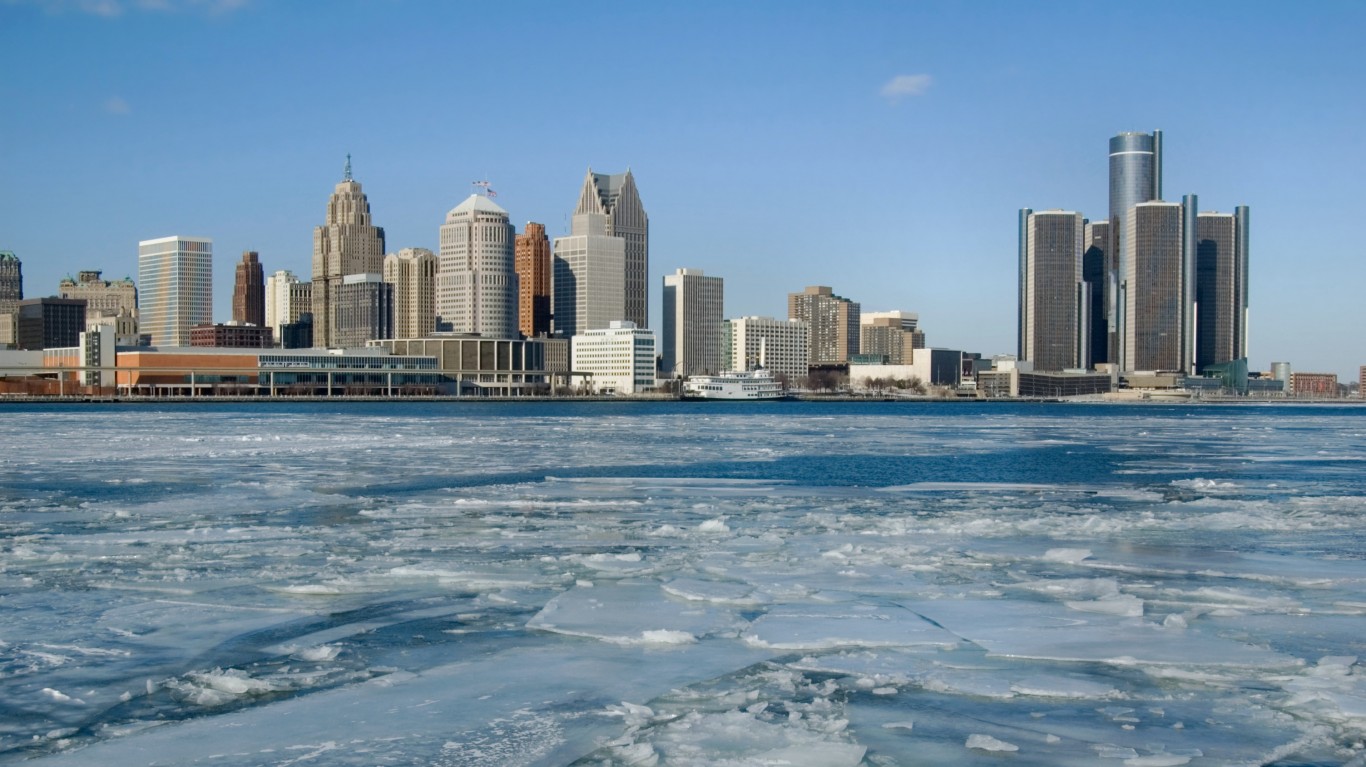
- Winter weather fatal crash rate, 2017-2021: 2.3 per 100,000 commuters who drive or carpool
- Total fatal crashes in winter conditions, 2017-2021: 40
- Most fatal winter-weather crashes in a single year, 2017-2021: 10 (25.0% of 5-yr. total)
- Avg. number of fatal crashes in winter conditions, 2017-2021: 8.0 per year
- Total commuters who drive or carpool: 1,705,750 (84.4% of all commuters)
46. Provo-Orem, UT

- Winter weather fatal crash rate, 2017-2021: 2.3 per 100,000 commuters who drive or carpool
- Total fatal crashes in winter conditions, 2017-2021: 6
- Most fatal winter-weather crashes in a single year, 2017-2021: 2 (33.3% of 5-yr. total)
- Avg. number of fatal crashes in winter conditions, 2017-2021: 1.2 per year
- Total commuters who drive or carpool: 255,587 (78.4% of all commuters)
45. Youngstown-Warren-Boardman, OH-PA

- Winter weather fatal crash rate, 2017-2021: 2.4 per 100,000 commuters who drive or carpool
- Total fatal crashes in winter conditions, 2017-2021: 5
- Most fatal winter-weather crashes in a single year, 2017-2021: 2 (40.0% of 5-yr. total)
- Avg. number of fatal crashes in winter conditions, 2017-2021: 1.0 per year
- Total commuters who drive or carpool: 207,677 (89.3% of all commuters)
44. Pittsburgh, PA
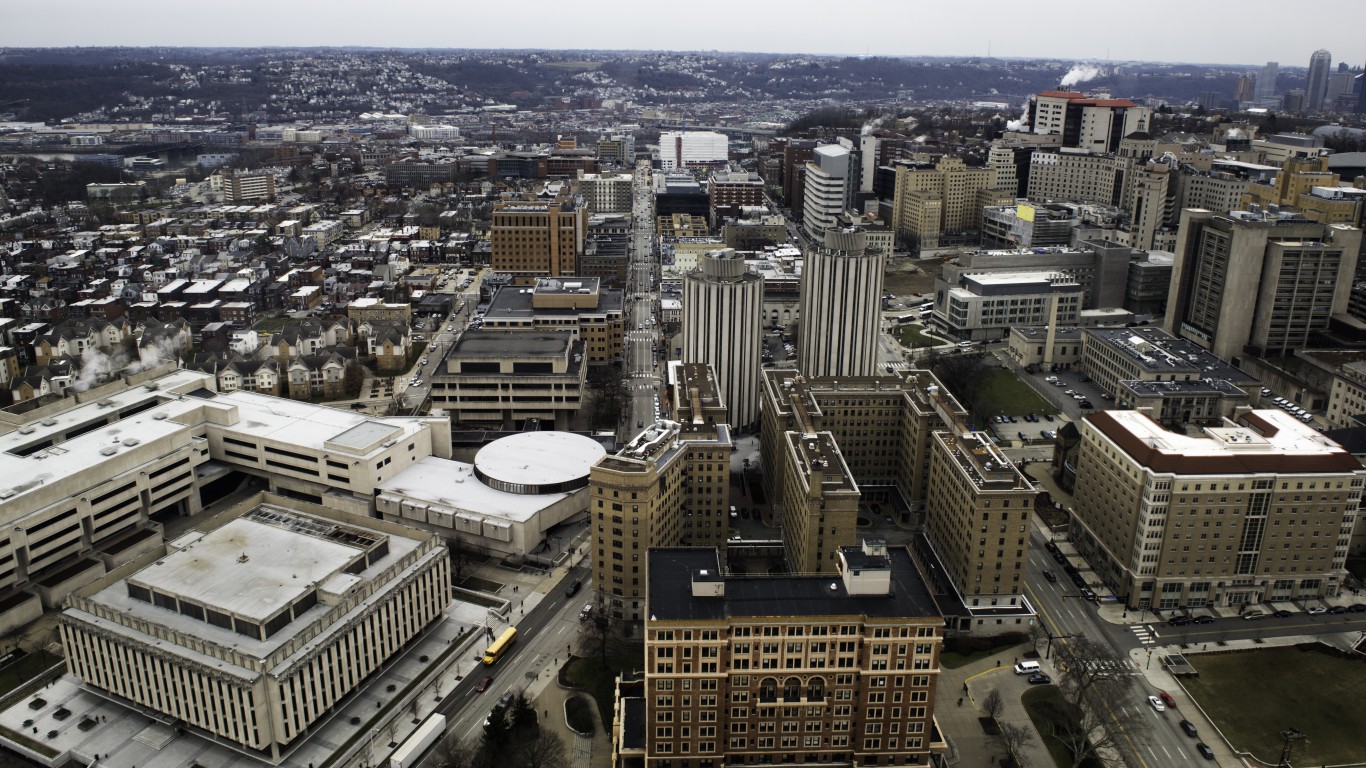
- Winter weather fatal crash rate, 2017-2021: 2.4 per 100,000 commuters who drive or carpool
- Total fatal crashes in winter conditions, 2017-2021: 22
- Most fatal winter-weather crashes in a single year, 2017-2021: 7 (31.8% of 5-yr. total)
- Avg. number of fatal crashes in winter conditions, 2017-2021: 4.4 per year
- Total commuters who drive or carpool: 902,968 (78.3% of all commuters)
43. Des Moines-West Des Moines, IA

- Winter weather fatal crash rate, 2017-2021: 2.6 per 100,000 commuters who drive or carpool
- Total fatal crashes in winter conditions, 2017-2021: 8
- Most fatal winter-weather crashes in a single year, 2017-2021: 4 (50.0% of 5-yr. total)
- Avg. number of fatal crashes in winter conditions, 2017-2021: 1.6 per year
- Total commuters who drive or carpool: 311,191 (83.8% of all commuters)
42. Syracuse, NY
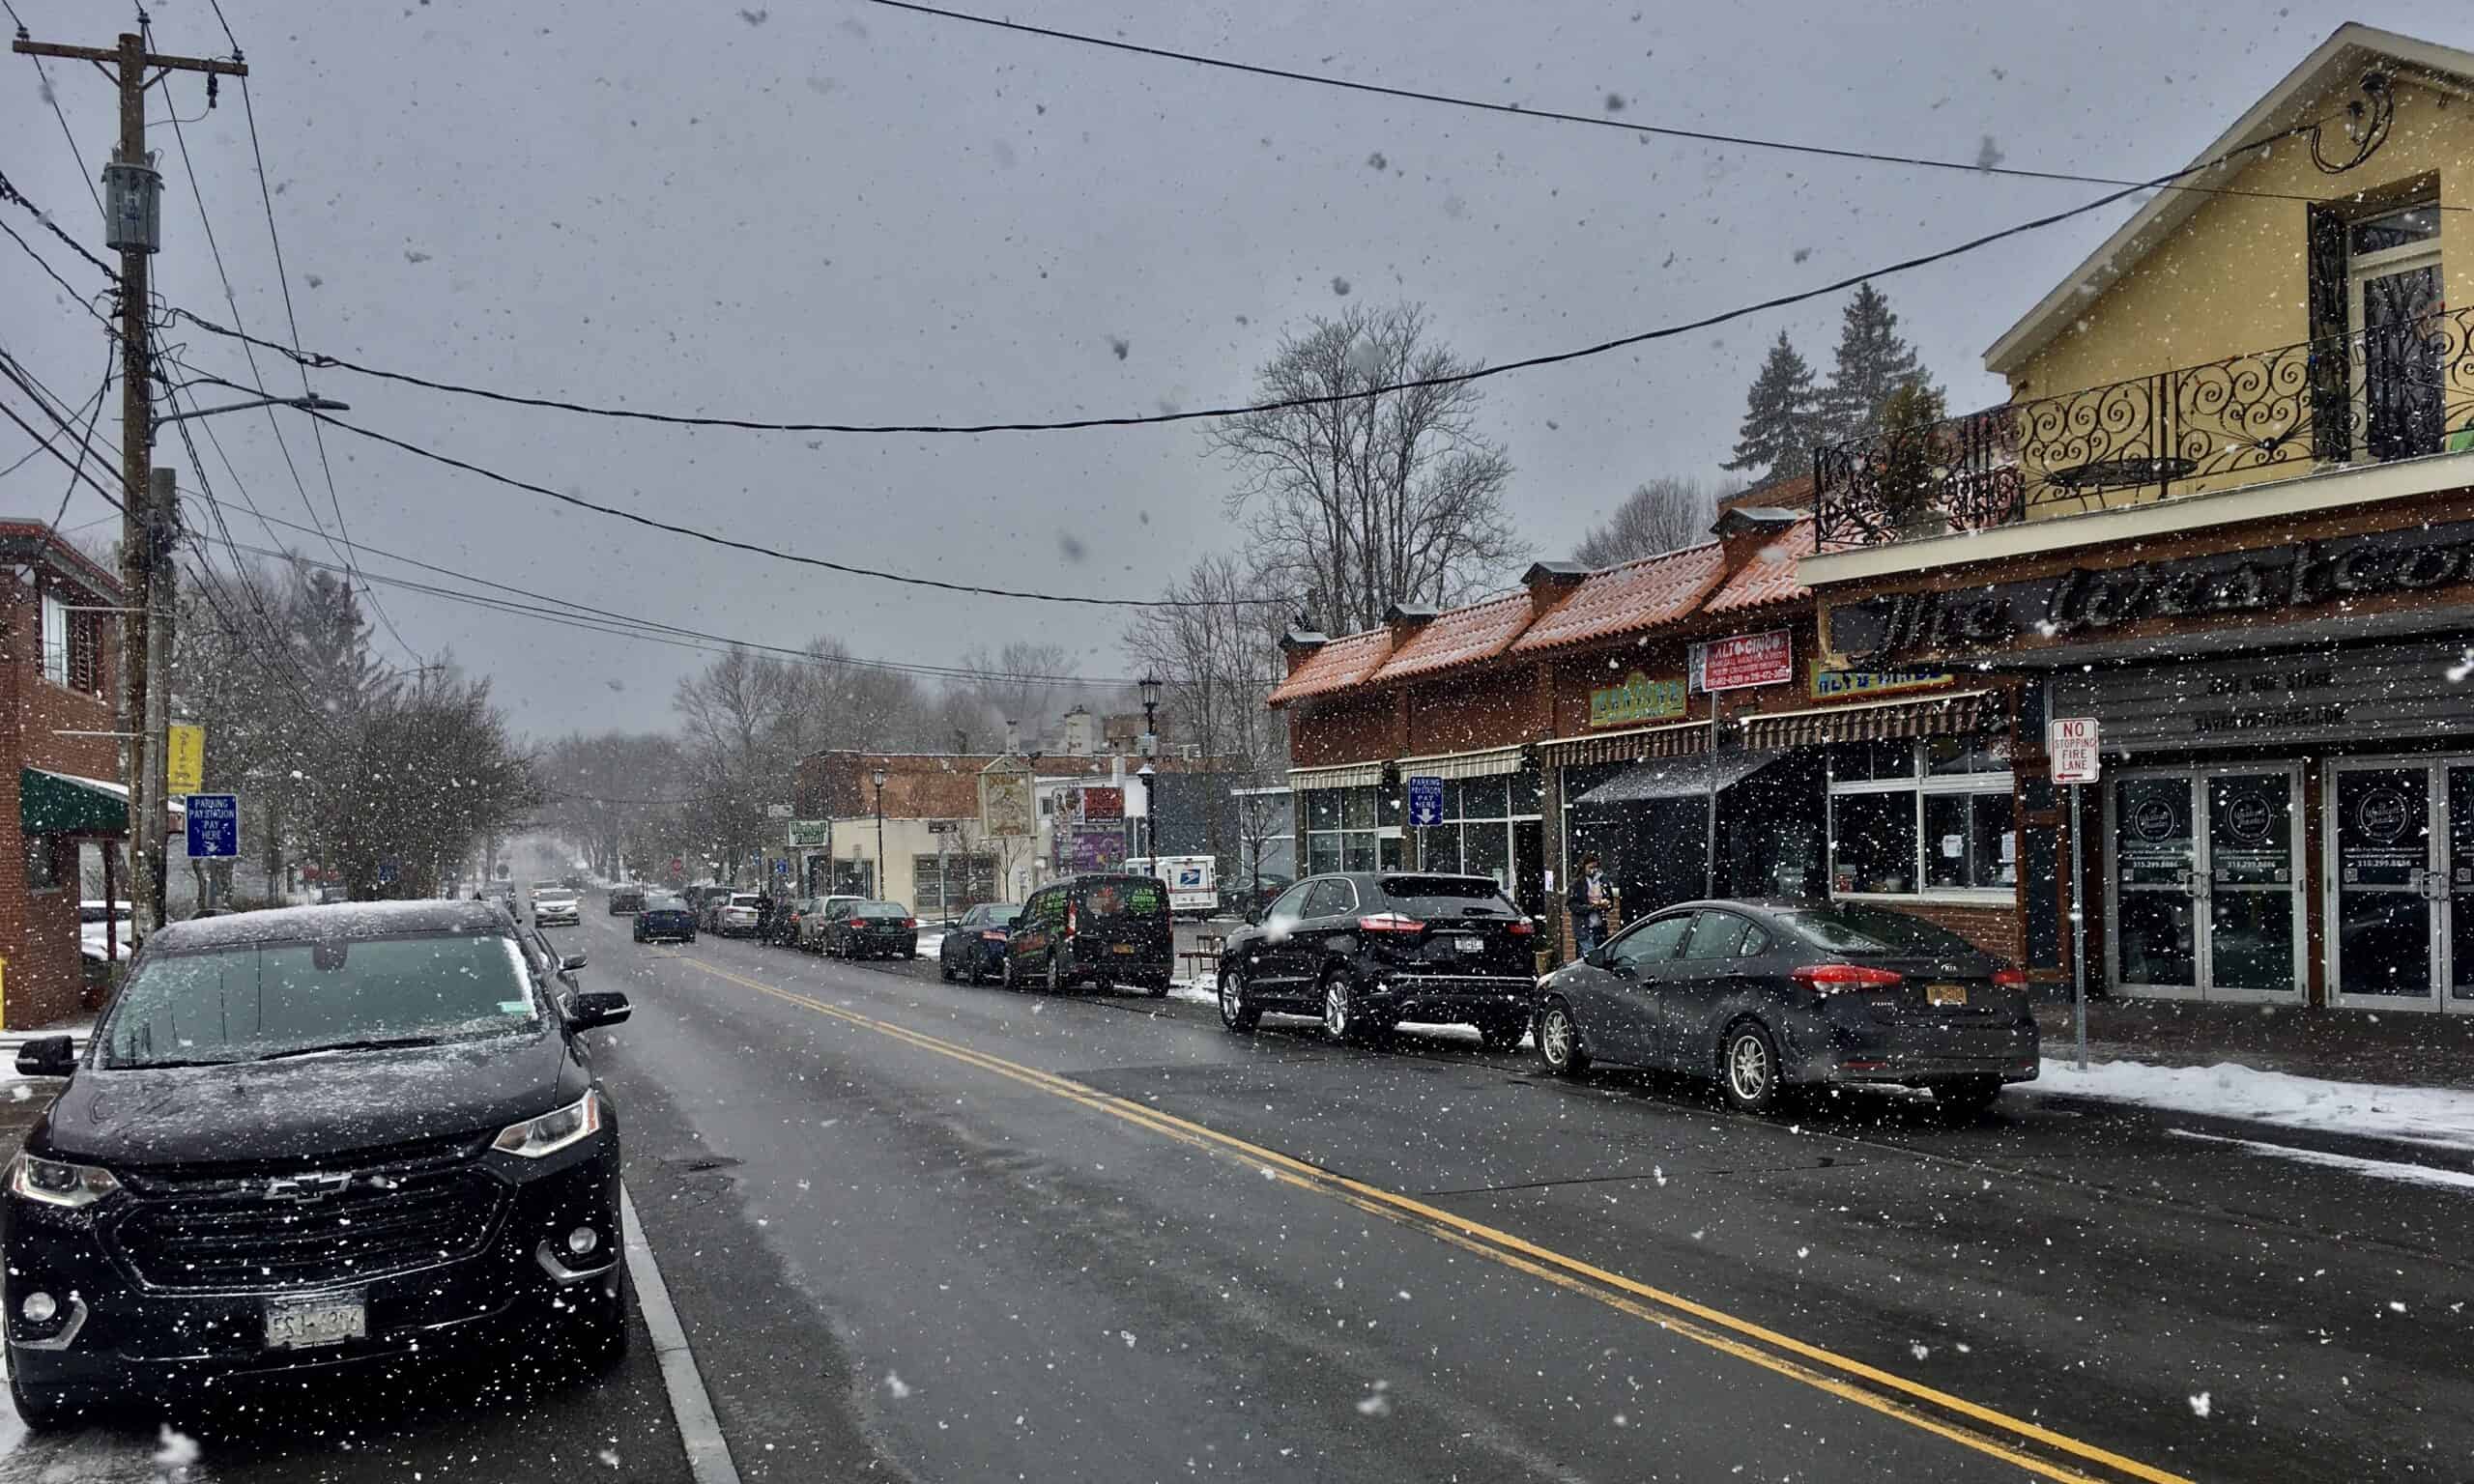
- Winter weather fatal crash rate, 2017-2021: 2.7 per 100,000 commuters who drive or carpool
- Total fatal crashes in winter conditions, 2017-2021: 7
- Most fatal winter-weather crashes in a single year, 2017-2021: 2 (28.6% of 5-yr. total)
- Avg. number of fatal crashes in winter conditions, 2017-2021: 1.4 per year
- Total commuters who drive or carpool: 255,445 (83.4% of all commuters)
41. Minneapolis-St. Paul-Bloomington, MN-WI
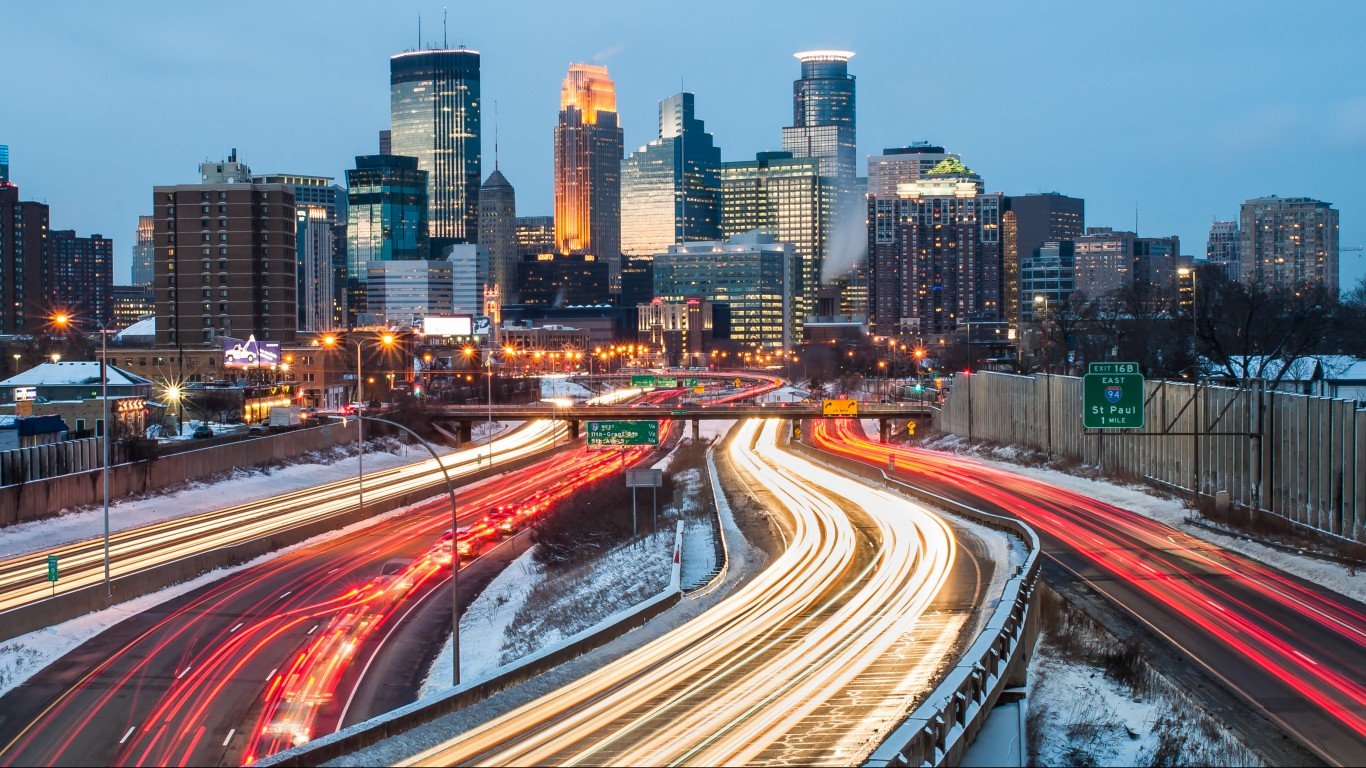
- Winter weather fatal crash rate, 2017-2021: 2.8 per 100,000 commuters who drive or carpool
- Total fatal crashes in winter conditions, 2017-2021: 42
- Most fatal winter-weather crashes in a single year, 2017-2021: 12 (28.6% of 5-yr. total)
- Avg. number of fatal crashes in winter conditions, 2017-2021: 8.4 per year
- Total commuters who drive or carpool: 1,506,248 (77.1% of all commuters)
40. Ogden-Clearfield, UT
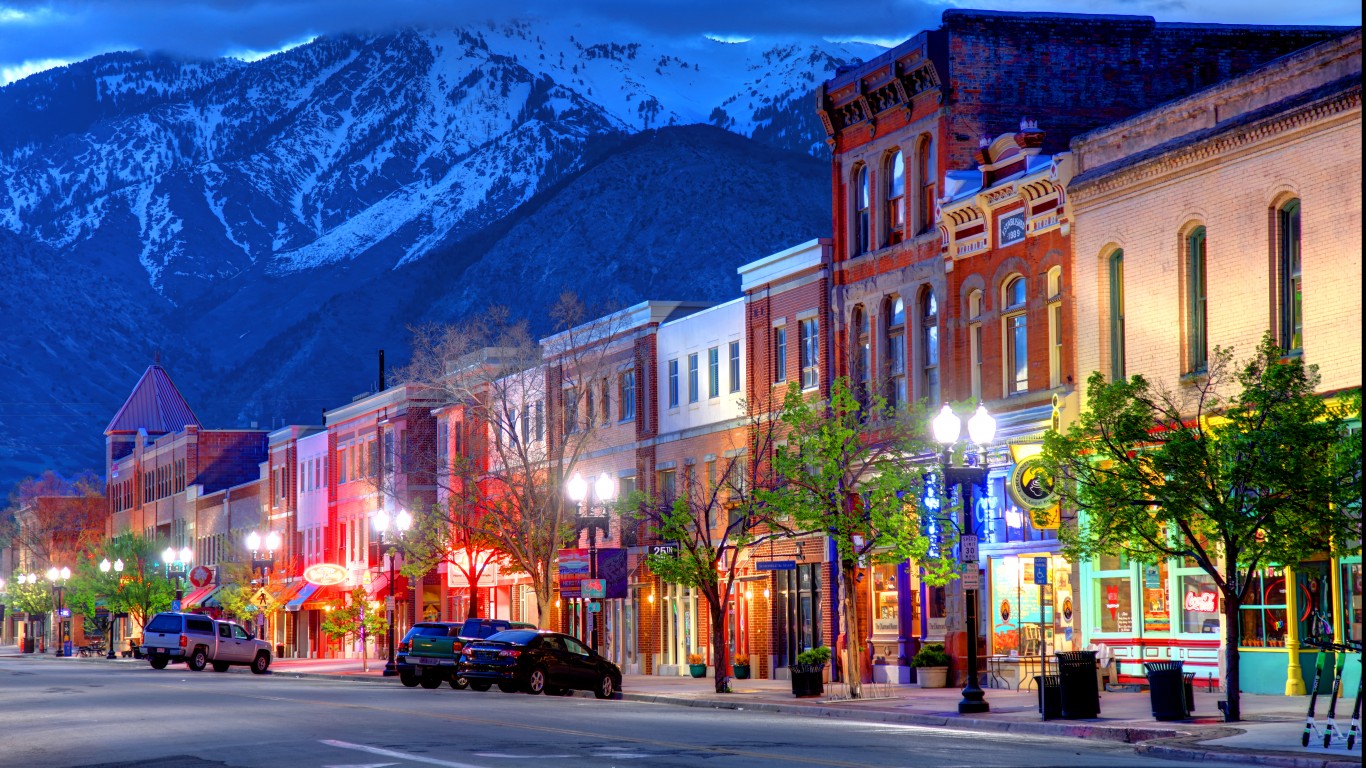
- Winter weather fatal crash rate, 2017-2021: 2.8 per 100,000 commuters who drive or carpool
- Total fatal crashes in winter conditions, 2017-2021: 8
- Most fatal winter-weather crashes in a single year, 2017-2021: 3 (37.5% of 5-yr. total)
- Avg. number of fatal crashes in winter conditions, 2017-2021: 1.6 per year
- Total commuters who drive or carpool: 284,472 (83.2% of all commuters)
39. Columbus, OH

- Winter weather fatal crash rate, 2017-2021: 2.9 per 100,000 commuters who drive or carpool
- Total fatal crashes in winter conditions, 2017-2021: 25
- Most fatal winter-weather crashes in a single year, 2017-2021: 7 (28.0% of 5-yr. total)
- Avg. number of fatal crashes in winter conditions, 2017-2021: 5.0 per year
- Total commuters who drive or carpool: 875,954 (81.2% of all commuters)
38. Fayetteville-Springdale-Rogers, AR-MO

- Winter weather fatal crash rate, 2017-2021: 3.0 per 100,000 commuters who drive or carpool
- Total fatal crashes in winter conditions, 2017-2021: 7
- Most fatal winter-weather crashes in a single year, 2017-2021: 3 (42.9% of 5-yr. total)
- Avg. number of fatal crashes in winter conditions, 2017-2021: 1.4 per year
- Total commuters who drive or carpool: 230,732 (86.1% of all commuters)
37. Peoria, IL

- Winter weather fatal crash rate, 2017-2021: 3.1 per 100,000 commuters who drive or carpool
- Total fatal crashes in winter conditions, 2017-2021: 5
- Most fatal winter-weather crashes in a single year, 2017-2021: 2 (40.0% of 5-yr. total)
- Avg. number of fatal crashes in winter conditions, 2017-2021: 1.0 per year
- Total commuters who drive or carpool: 160,523 (88.4% of all commuters)
36. Omaha-Council Bluffs, NE-IA

- Winter weather fatal crash rate, 2017-2021: 3.3 per 100,000 commuters who drive or carpool
- Total fatal crashes in winter conditions, 2017-2021: 14
- Most fatal winter-weather crashes in a single year, 2017-2021: 6 (42.9% of 5-yr. total)
- Avg. number of fatal crashes in winter conditions, 2017-2021: 2.8 per year
- Total commuters who drive or carpool: 427,687 (85.6% of all commuters)
35. Cleveland-Elyria, OH

- Winter weather fatal crash rate, 2017-2021: 3.4 per 100,000 commuters who drive or carpool
- Total fatal crashes in winter conditions, 2017-2021: 28
- Most fatal winter-weather crashes in a single year, 2017-2021: 8 (28.6% of 5-yr. total)
- Avg. number of fatal crashes in winter conditions, 2017-2021: 5.6 per year
- Total commuters who drive or carpool: 830,652 (83.2% of all commuters)
34. Scranton–Wilkes-Barre–Hazleton, PA

- Winter weather fatal crash rate, 2017-2021: 3.5 per 100,000 commuters who drive or carpool
- Total fatal crashes in winter conditions, 2017-2021: 8
- Most fatal winter-weather crashes in a single year, 2017-2021: 3 (37.5% of 5-yr. total)
- Avg. number of fatal crashes in winter conditions, 2017-2021: 1.6 per year
- Total commuters who drive or carpool: 228,837 (86.9% of all commuters)
33. Fort Collins, CO
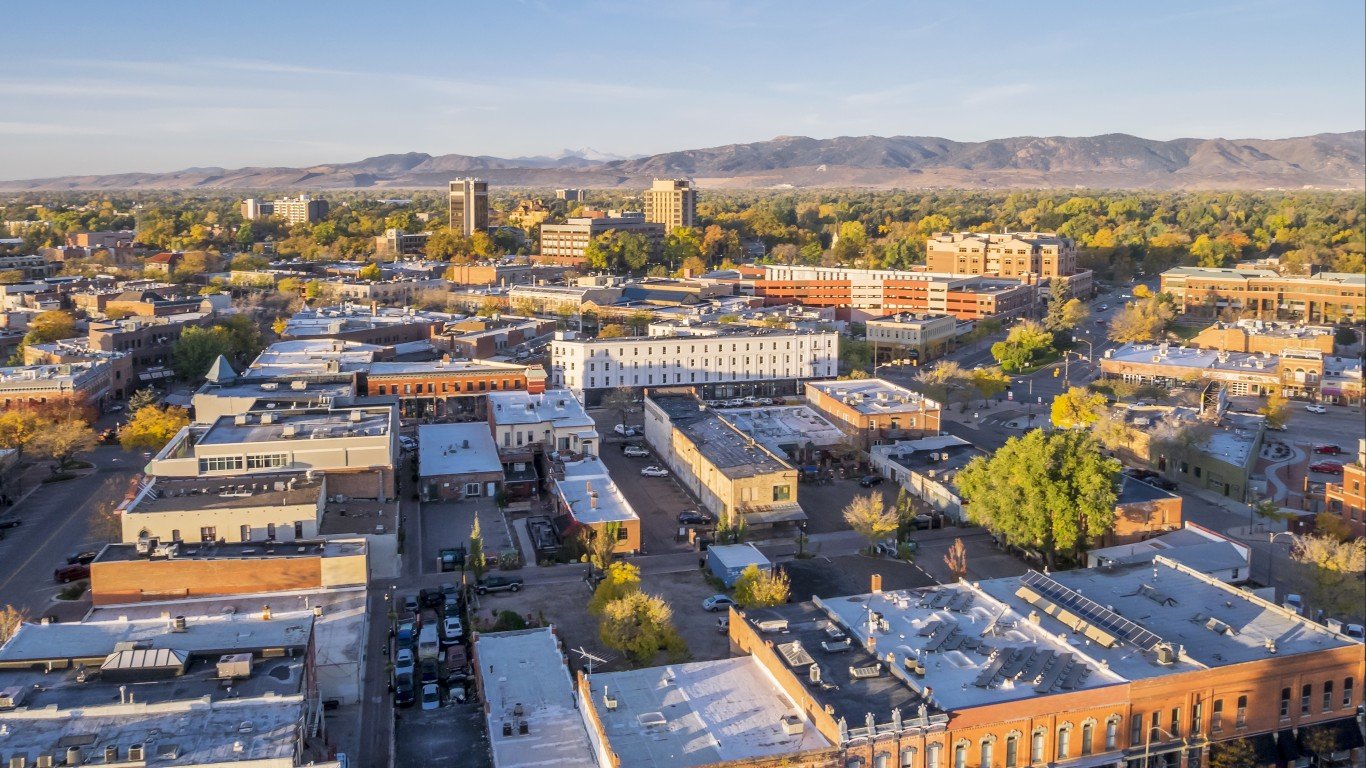
- Winter weather fatal crash rate, 2017-2021: 3.5 per 100,000 commuters who drive or carpool
- Total fatal crashes in winter conditions, 2017-2021: 5
- Most fatal winter-weather crashes in a single year, 2017-2021: 2 (40.0% of 5-yr. total)
- Avg. number of fatal crashes in winter conditions, 2017-2021: 1.0 per year
- Total commuters who drive or carpool: 142,573 (75.1% of all commuters)
32. Spokane-Spokane Valley, WA

- Winter weather fatal crash rate, 2017-2021: 3.7 per 100,000 commuters who drive or carpool
- Total fatal crashes in winter conditions, 2017-2021: 8
- Most fatal winter-weather crashes in a single year, 2017-2021: 3 (37.5% of 5-yr. total)
- Avg. number of fatal crashes in winter conditions, 2017-2021: 1.6 per year
- Total commuters who drive or carpool: 215,405 (81.5% of all commuters)
31. Lincoln, NE

- Winter weather fatal crash rate, 2017-2021: 3.8 per 100,000 commuters who drive or carpool
- Total fatal crashes in winter conditions, 2017-2021: 6
- Most fatal winter-weather crashes in a single year, 2017-2021: 3 (50.0% of 5-yr. total)
- Avg. number of fatal crashes in winter conditions, 2017-2021: 1.2 per year
- Total commuters who drive or carpool: 156,555 (85.8% of all commuters)
30. Green Bay, WI

- Winter weather fatal crash rate, 2017-2021: 4.0 per 100,000 commuters who drive or carpool
- Total fatal crashes in winter conditions, 2017-2021: 6
- Most fatal winter-weather crashes in a single year, 2017-2021: 3 (50.0% of 5-yr. total)
- Avg. number of fatal crashes in winter conditions, 2017-2021: 1.2 per year
- Total commuters who drive or carpool: 148,399 (87.9% of all commuters)
29. Akron, OH
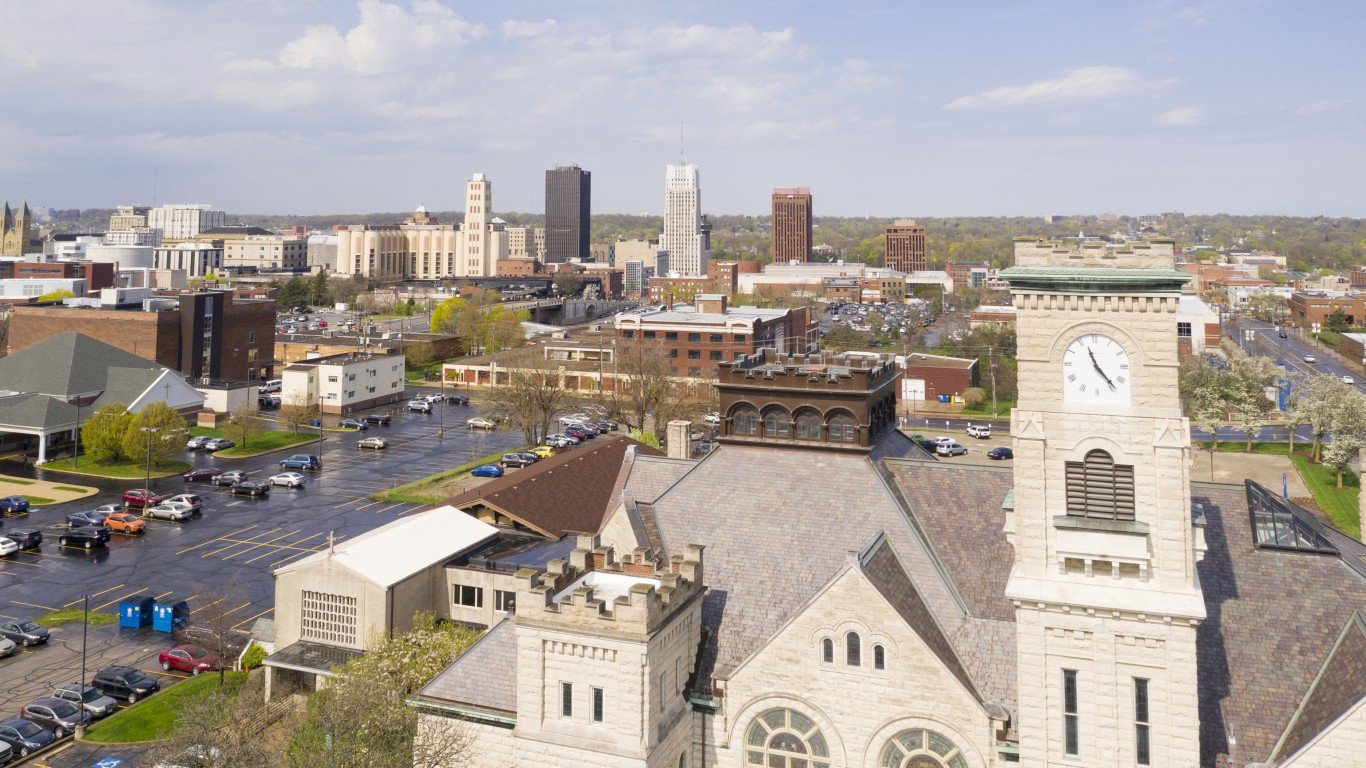
- Winter weather fatal crash rate, 2017-2021: 4.1 per 100,000 commuters who drive or carpool
- Total fatal crashes in winter conditions, 2017-2021: 12
- Most fatal winter-weather crashes in a single year, 2017-2021: 4 (33.3% of 5-yr. total)
- Avg. number of fatal crashes in winter conditions, 2017-2021: 2.4 per year
- Total commuters who drive or carpool: 295,938 (85.6% of all commuters)
28. Canton-Massillon, OH

- Winter weather fatal crash rate, 2017-2021: 4.3 per 100,000 commuters who drive or carpool
- Total fatal crashes in winter conditions, 2017-2021: 7
- Most fatal winter-weather crashes in a single year, 2017-2021: 3 (42.9% of 5-yr. total)
- Avg. number of fatal crashes in winter conditions, 2017-2021: 1.4 per year
- Total commuters who drive or carpool: 164,145 (87.0% of all commuters)
27. Grand Rapids-Wyoming, MI

- Winter weather fatal crash rate, 2017-2021: 4.3 per 100,000 commuters who drive or carpool
- Total fatal crashes in winter conditions, 2017-2021: 20
- Most fatal winter-weather crashes in a single year, 2017-2021: 6 (30.0% of 5-yr. total)
- Avg. number of fatal crashes in winter conditions, 2017-2021: 4.0 per year
- Total commuters who drive or carpool: 468,714 (86.0% of all commuters)
26. Amarillo, TX

- Winter weather fatal crash rate, 2017-2021: 4.3 per 100,000 commuters who drive or carpool
- Total fatal crashes in winter conditions, 2017-2021: 5
- Most fatal winter-weather crashes in a single year, 2017-2021: 2 (40.0% of 5-yr. total)
- Avg. number of fatal crashes in winter conditions, 2017-2021: 1.0 per year
- Total commuters who drive or carpool: 115,273 (91.2% of all commuters)
25. Appleton, WI

- Winter weather fatal crash rate, 2017-2021: 4.4 per 100,000 commuters who drive or carpool
- Total fatal crashes in winter conditions, 2017-2021: 5
- Most fatal winter-weather crashes in a single year, 2017-2021: 2 (40.0% of 5-yr. total)
- Avg. number of fatal crashes in winter conditions, 2017-2021: 1.0 per year
- Total commuters who drive or carpool: 112,819 (87.0% of all commuters)
24. Sioux Falls, SD
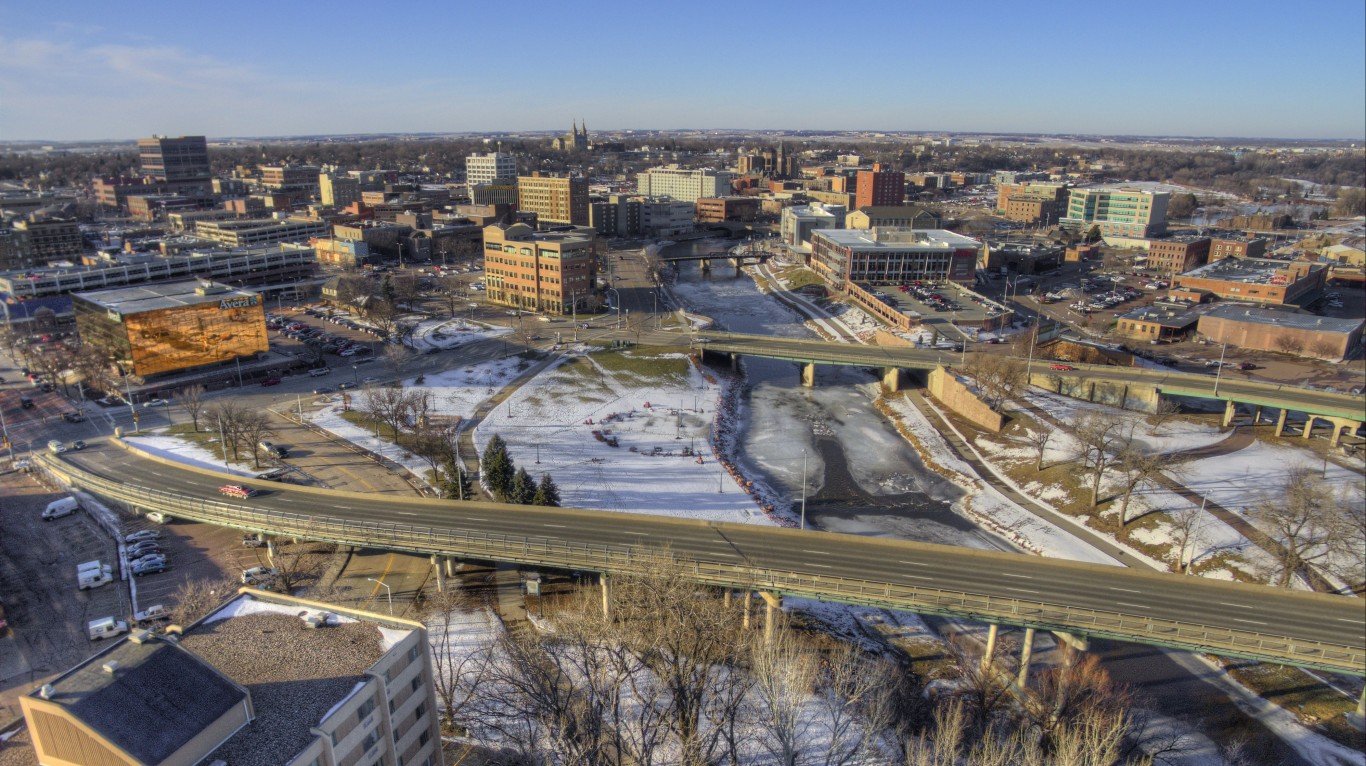
- Winter weather fatal crash rate, 2017-2021: 4.5 per 100,000 commuters who drive or carpool
- Total fatal crashes in winter conditions, 2017-2021: 6
- Most fatal winter-weather crashes in a single year, 2017-2021: 2 (33.3% of 5-yr. total)
- Avg. number of fatal crashes in winter conditions, 2017-2021: 1.2 per year
- Total commuters who drive or carpool: 134,462 (87.9% of all commuters)
23. Utica-Rome, NY
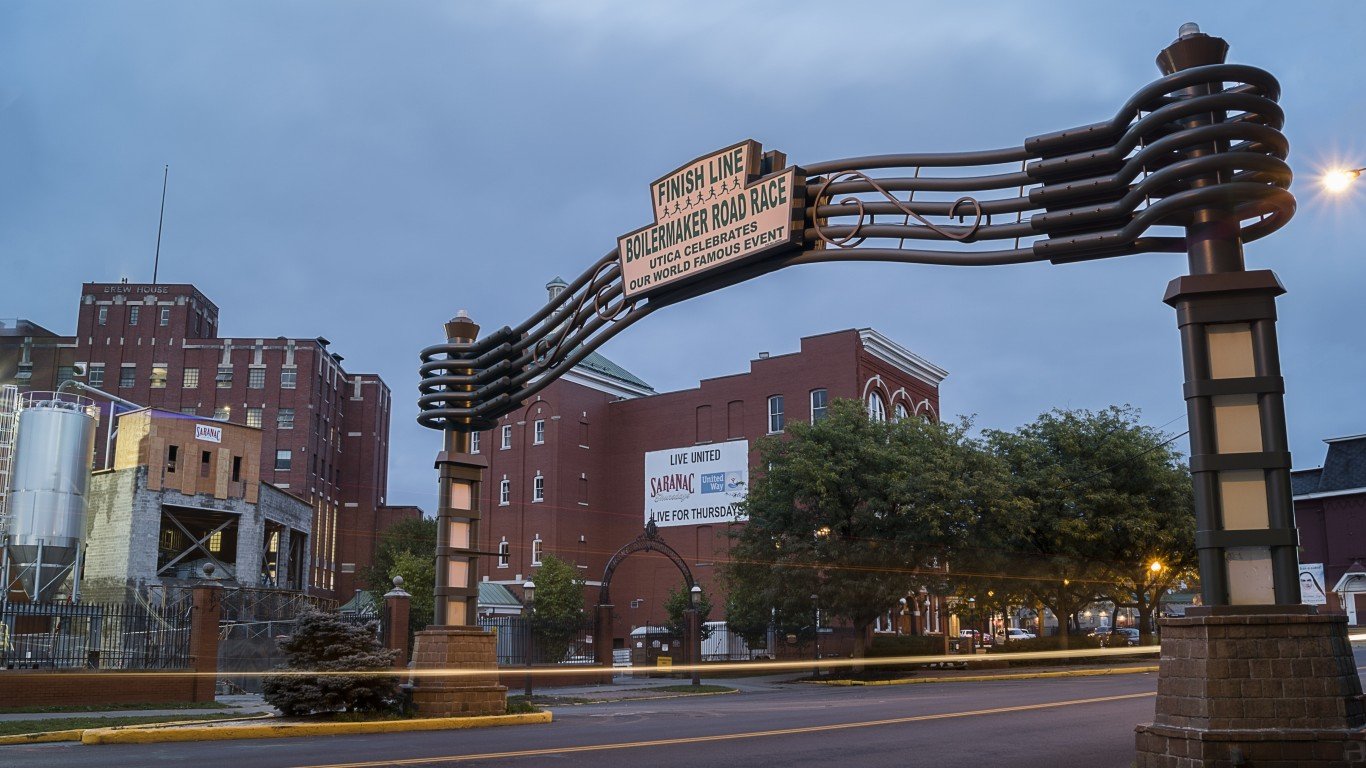
- Winter weather fatal crash rate, 2017-2021: 4.5 per 100,000 commuters who drive or carpool
- Total fatal crashes in winter conditions, 2017-2021: 5
- Most fatal winter-weather crashes in a single year, 2017-2021: 3 (60.0% of 5-yr. total)
- Avg. number of fatal crashes in winter conditions, 2017-2021: 1.0 per year
- Total commuters who drive or carpool: 110,325 (86.3% of all commuters)
22. Lansing-East Lansing, MI

- Winter weather fatal crash rate, 2017-2021: 4.7 per 100,000 commuters who drive or carpool
- Total fatal crashes in winter conditions, 2017-2021: 10
- Most fatal winter-weather crashes in a single year, 2017-2021: 4 (40.0% of 5-yr. total)
- Avg. number of fatal crashes in winter conditions, 2017-2021: 2.0 per year
- Total commuters who drive or carpool: 213,871 (82.0% of all commuters)
21. Toledo, OH

- Winter weather fatal crash rate, 2017-2021: 4.8 per 100,000 commuters who drive or carpool
- Total fatal crashes in winter conditions, 2017-2021: 13
- Most fatal winter-weather crashes in a single year, 2017-2021: 6 (46.2% of 5-yr. total)
- Avg. number of fatal crashes in winter conditions, 2017-2021: 2.6 per year
- Total commuters who drive or carpool: 270,661 (89.9% of all commuters)
20. Fort Wayne, IN

- Winter weather fatal crash rate, 2017-2021: 5.5 per 100,000 commuters who drive or carpool
- Total fatal crashes in winter conditions, 2017-2021: 10
- Most fatal winter-weather crashes in a single year, 2017-2021: 6 (60.0% of 5-yr. total)
- Avg. number of fatal crashes in winter conditions, 2017-2021: 2.0 per year
- Total commuters who drive or carpool: 181,992 (89.5% of all commuters)
19. Erie, PA

- Winter weather fatal crash rate, 2017-2021: 5.7 per 100,000 commuters who drive or carpool
- Total fatal crashes in winter conditions, 2017-2021: 6
- Most fatal winter-weather crashes in a single year, 2017-2021: 4 (66.7% of 5-yr. total)
- Avg. number of fatal crashes in winter conditions, 2017-2021: 1.2 per year
- Total commuters who drive or carpool: 106,091 (86.6% of all commuters)
18. Ann Arbor, MI
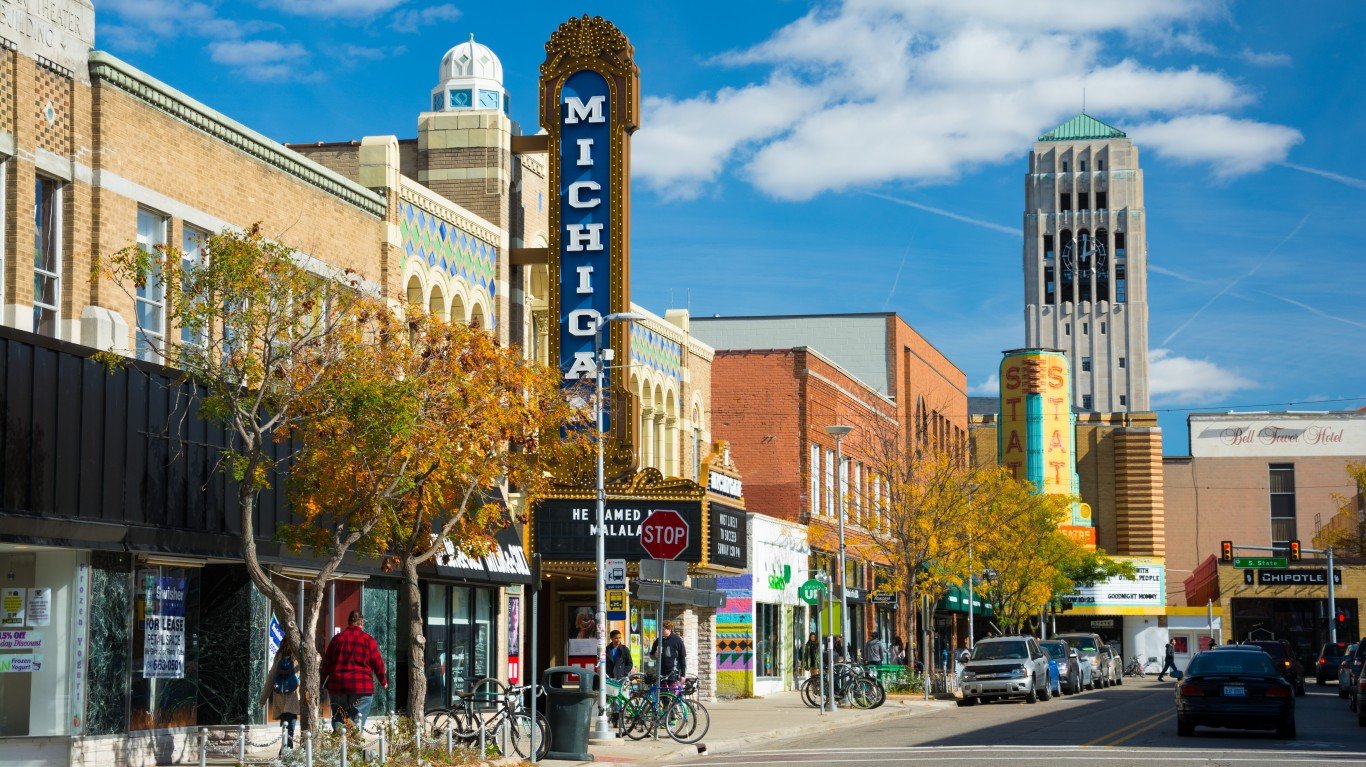
- Winter weather fatal crash rate, 2017-2021: 6.2 per 100,000 commuters who drive or carpool
- Total fatal crashes in winter conditions, 2017-2021: 8
- Most fatal winter-weather crashes in a single year, 2017-2021: 4 (50.0% of 5-yr. total)
- Avg. number of fatal crashes in winter conditions, 2017-2021: 1.6 per year
- Total commuters who drive or carpool: 129,000 (70.0% of all commuters)
17. Bend-Redmond, OR
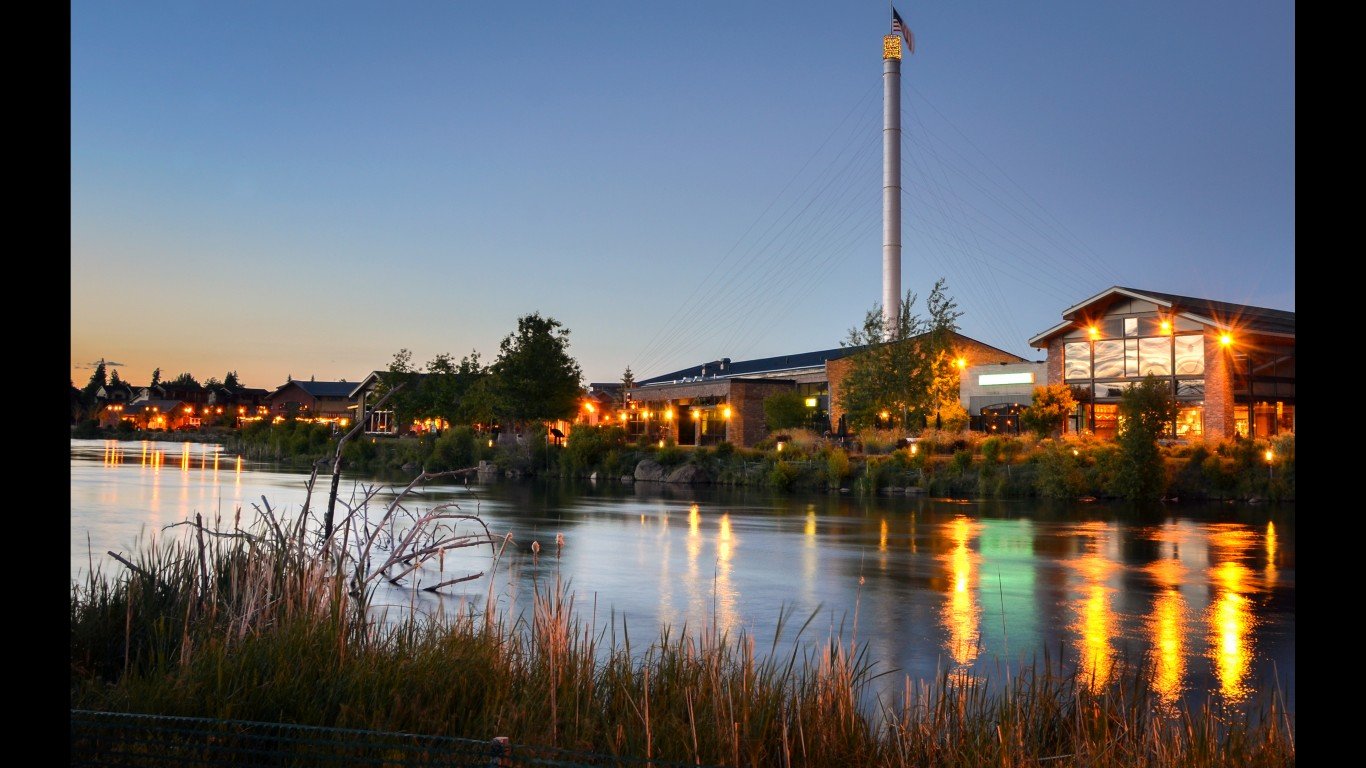
- Winter weather fatal crash rate, 2017-2021: 6.8 per 100,000 commuters who drive or carpool
- Total fatal crashes in winter conditions, 2017-2021: 5
- Most fatal winter-weather crashes in a single year, 2017-2021: 2 (40.0% of 5-yr. total)
- Avg. number of fatal crashes in winter conditions, 2017-2021: 1.0 per year
- Total commuters who drive or carpool: 73,830 (76.4% of all commuters)
16. Janesville-Beloit, WI
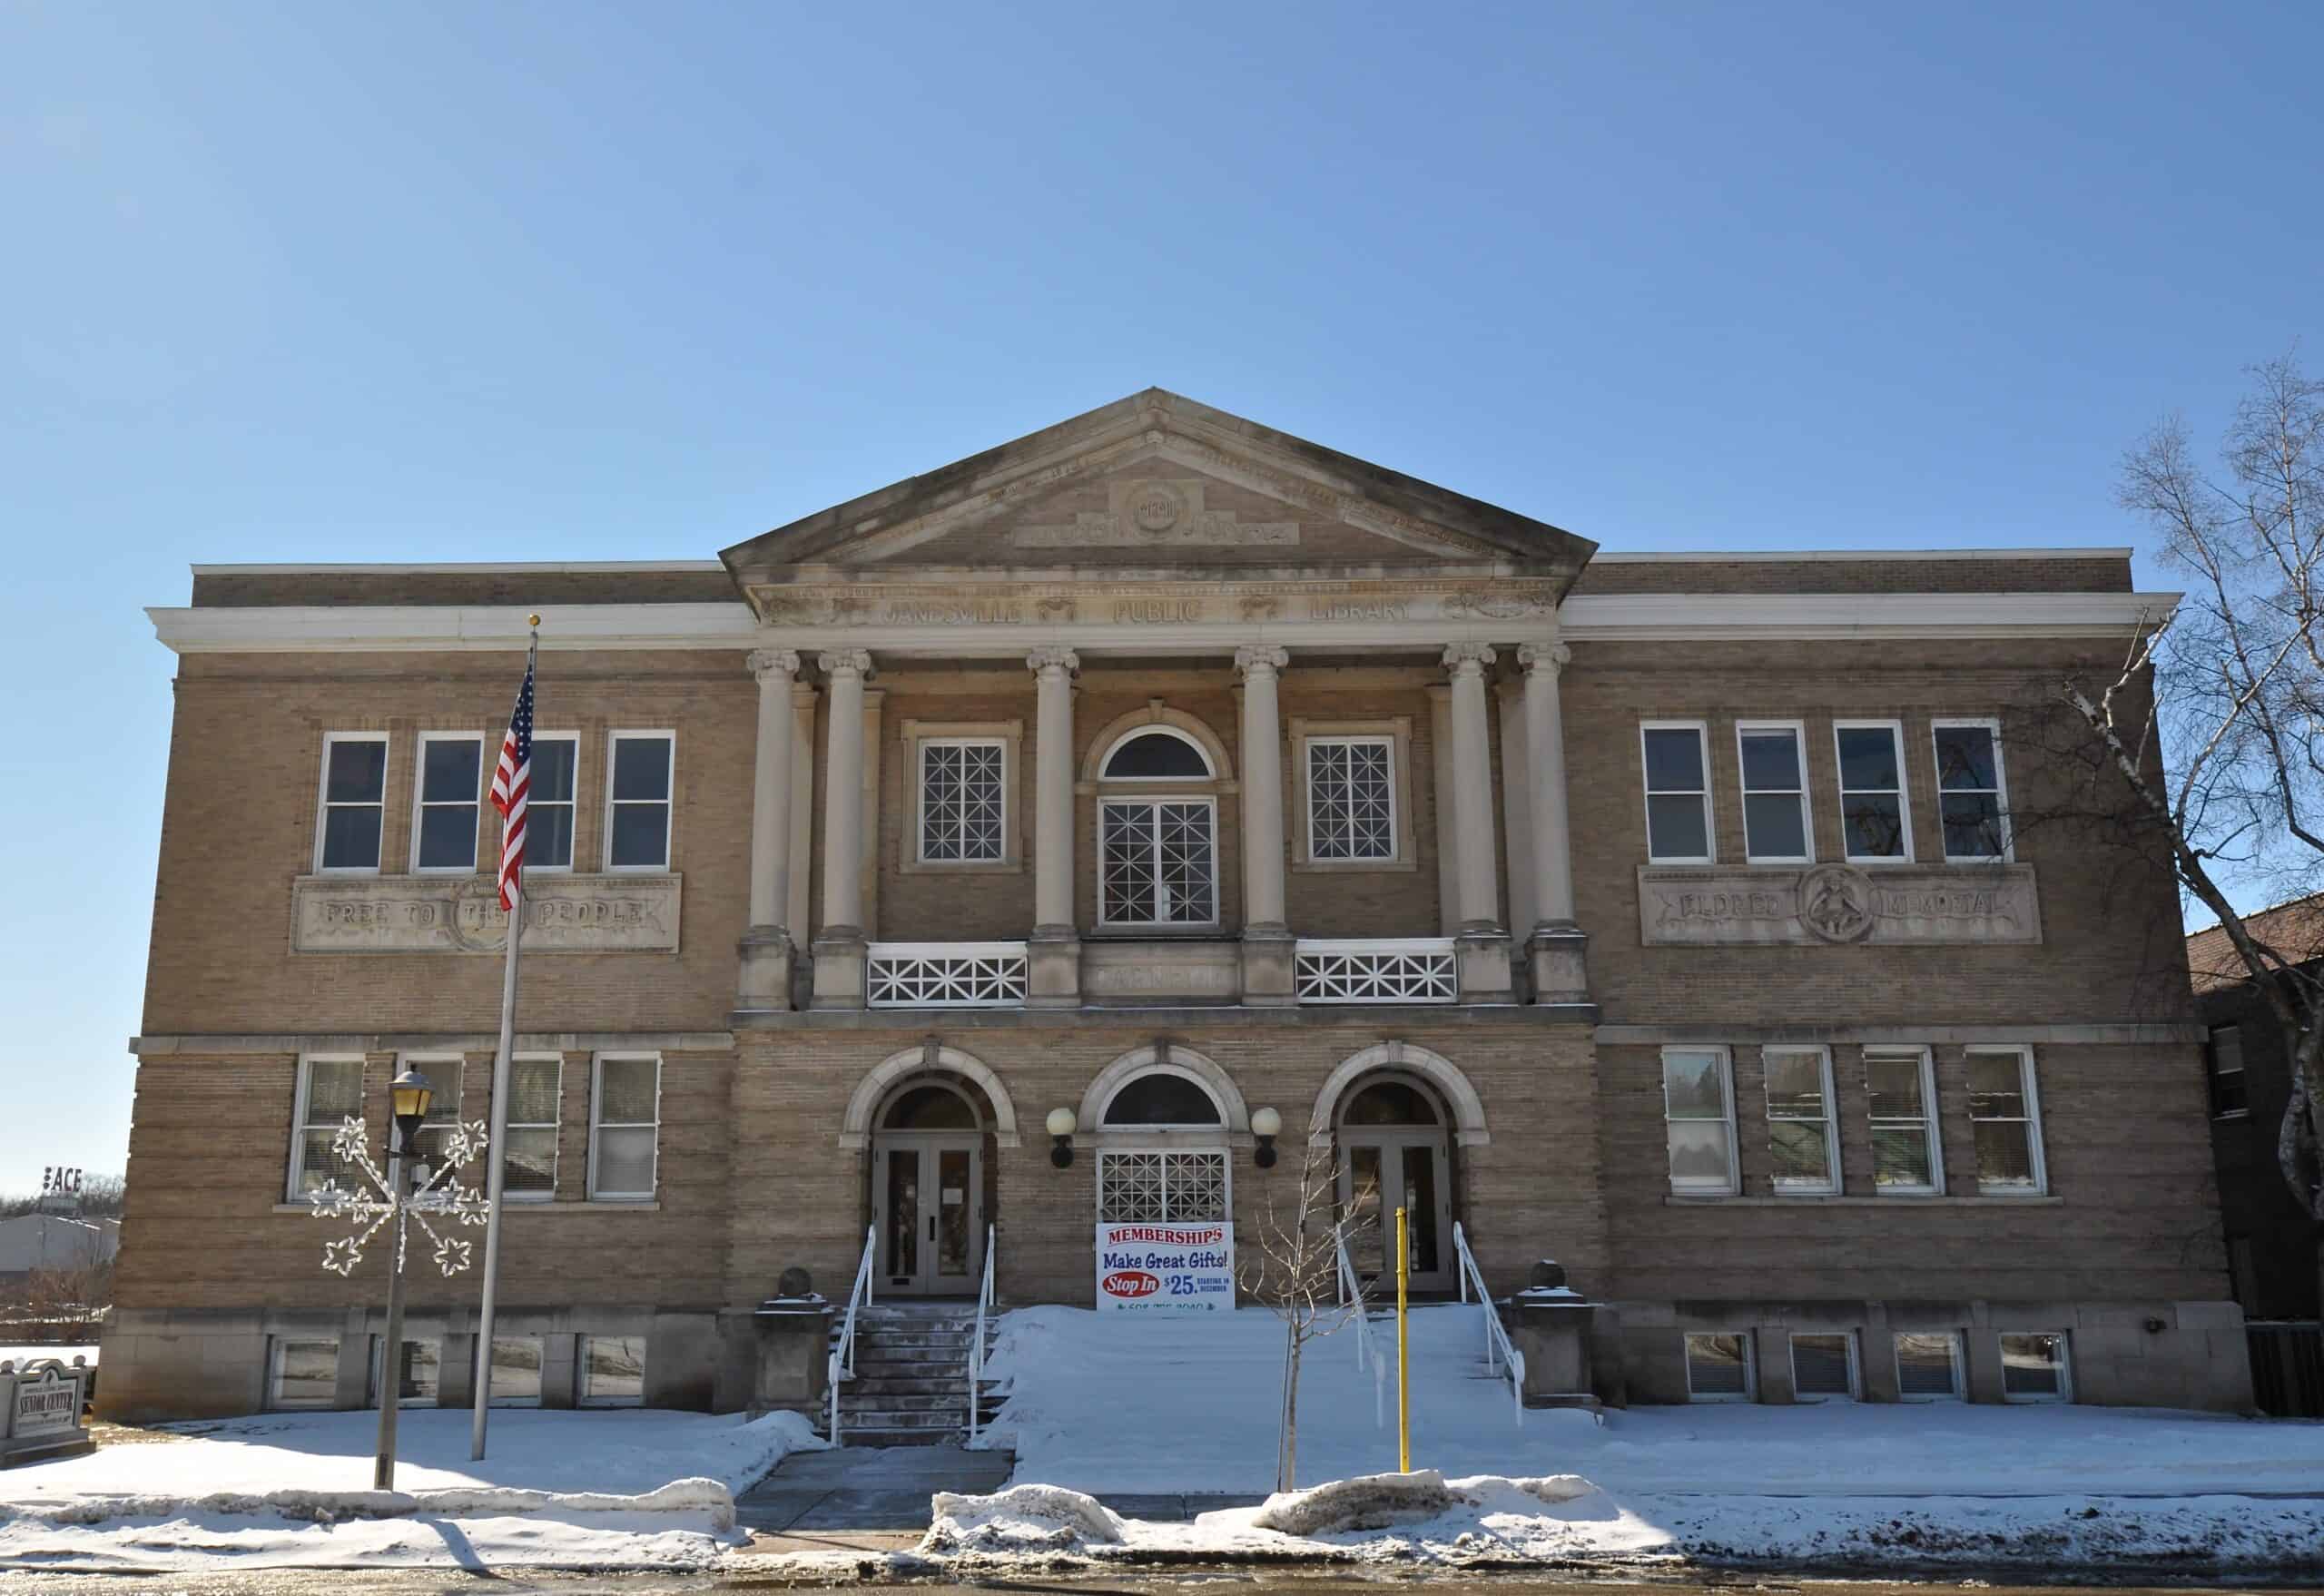
- Winter weather fatal crash rate, 2017-2021: 6.9 per 100,000 commuters who drive or carpool
- Total fatal crashes in winter conditions, 2017-2021: 5
- Most fatal winter-weather crashes in a single year, 2017-2021: 2 (40.0% of 5-yr. total)
- Avg. number of fatal crashes in winter conditions, 2017-2021: 1.0 per year
- Total commuters who drive or carpool: 72,865 (90.0% of all commuters)
15. South Bend-Mishawaka, IN-MI
- Winter weather fatal crash rate, 2017-2021: 6.9 per 100,000 commuters who drive or carpool
- Total fatal crashes in winter conditions, 2017-2021: 9
- Most fatal winter-weather crashes in a single year, 2017-2021: 3 (33.3% of 5-yr. total)
- Avg. number of fatal crashes in winter conditions, 2017-2021: 1.8 per year
- Total commuters who drive or carpool: 130,842 (86.1% of all commuters)
14. Topeka, KS

- Winter weather fatal crash rate, 2017-2021: 7.2 per 100,000 commuters who drive or carpool
- Total fatal crashes in winter conditions, 2017-2021: 7
- Most fatal winter-weather crashes in a single year, 2017-2021: 4 (57.1% of 5-yr. total)
- Avg. number of fatal crashes in winter conditions, 2017-2021: 1.4 per year
- Total commuters who drive or carpool: 96,623 (88.0% of all commuters)
13. St. Cloud, MN
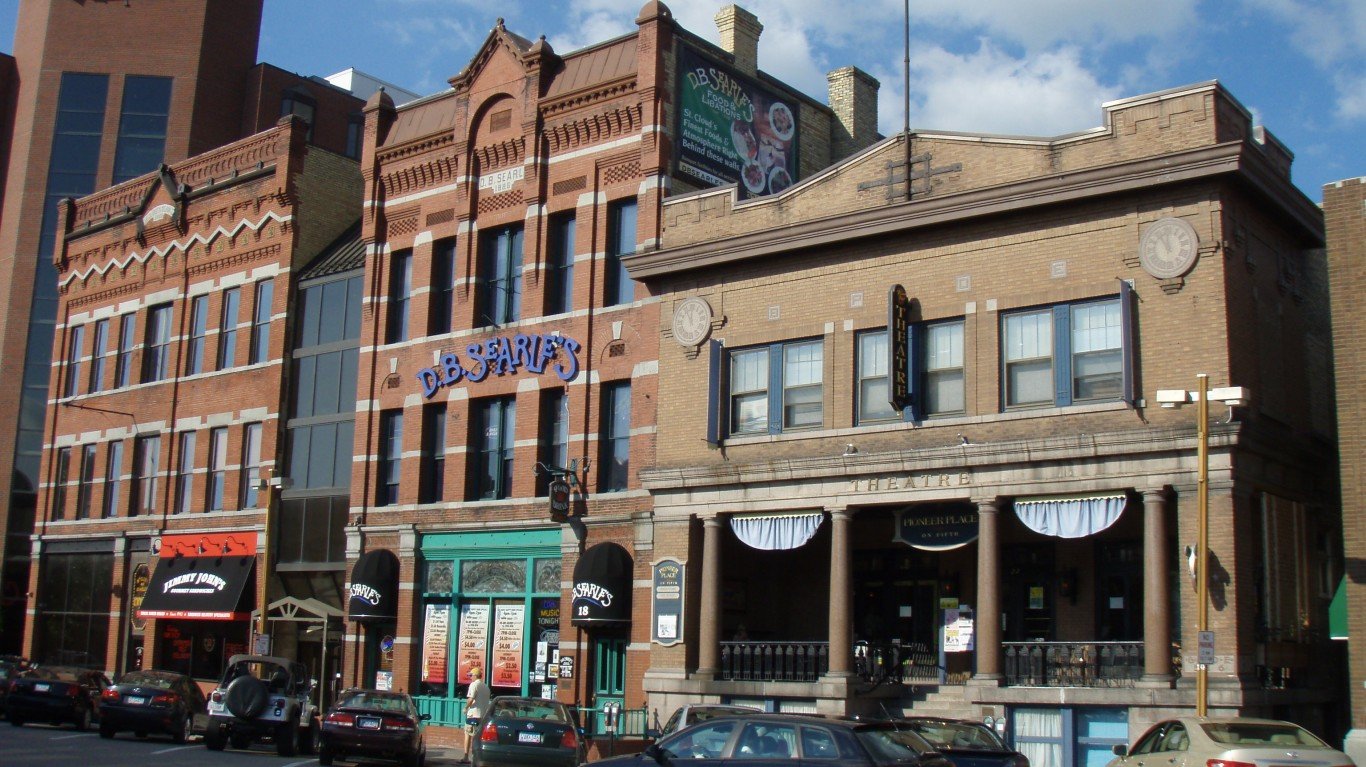
- Winter weather fatal crash rate, 2017-2021: 7.9 per 100,000 commuters who drive or carpool
- Total fatal crashes in winter conditions, 2017-2021: 7
- Most fatal winter-weather crashes in a single year, 2017-2021: 2 (28.6% of 5-yr. total)
- Avg. number of fatal crashes in winter conditions, 2017-2021: 1.4 per year
- Total commuters who drive or carpool: 88,655 (84.7% of all commuters)
12. Bangor, ME

- Winter weather fatal crash rate, 2017-2021: 8.2 per 100,000 commuters who drive or carpool
- Total fatal crashes in winter conditions, 2017-2021: 5
- Most fatal winter-weather crashes in a single year, 2017-2021: 2 (40.0% of 5-yr. total)
- Avg. number of fatal crashes in winter conditions, 2017-2021: 1.0 per year
- Total commuters who drive or carpool: 61,109 (84.6% of all commuters)
11. Idaho Falls, ID

- Winter weather fatal crash rate, 2017-2021: 8.3 per 100,000 commuters who drive or carpool
- Total fatal crashes in winter conditions, 2017-2021: 5
- Most fatal winter-weather crashes in a single year, 2017-2021: 2 (40.0% of 5-yr. total)
- Avg. number of fatal crashes in winter conditions, 2017-2021: 1.0 per year
- Total commuters who drive or carpool: 60,382 (86.0% of all commuters)
10. Duluth, MN-WI
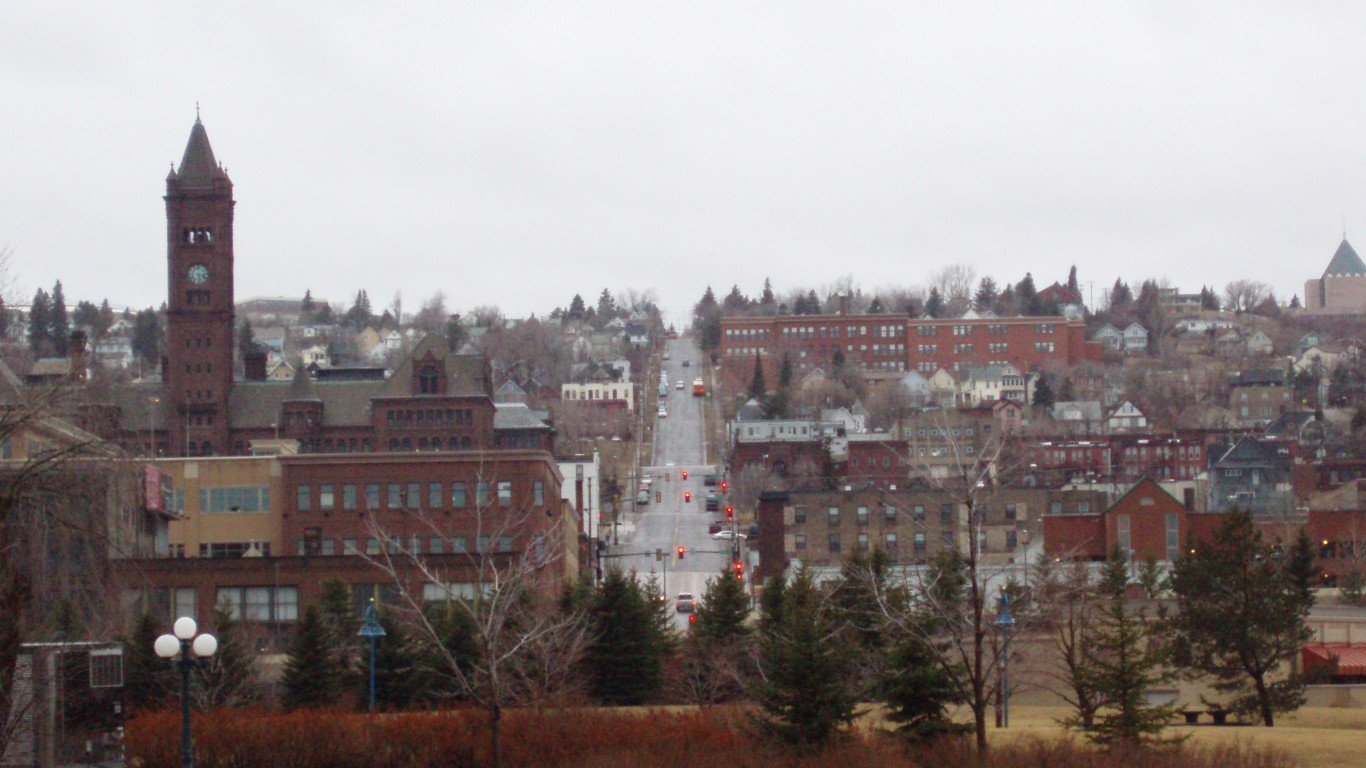
- Winter weather fatal crash rate, 2017-2021: 8.5 per 100,000 commuters who drive or carpool
- Total fatal crashes in winter conditions, 2017-2021: 10
- Most fatal winter-weather crashes in a single year, 2017-2021: 5 (50.0% of 5-yr. total)
- Avg. number of fatal crashes in winter conditions, 2017-2021: 2.0 per year
- Total commuters who drive or carpool: 118,279 (85.6% of all commuters)
9. Kalamazoo-Portage, MI
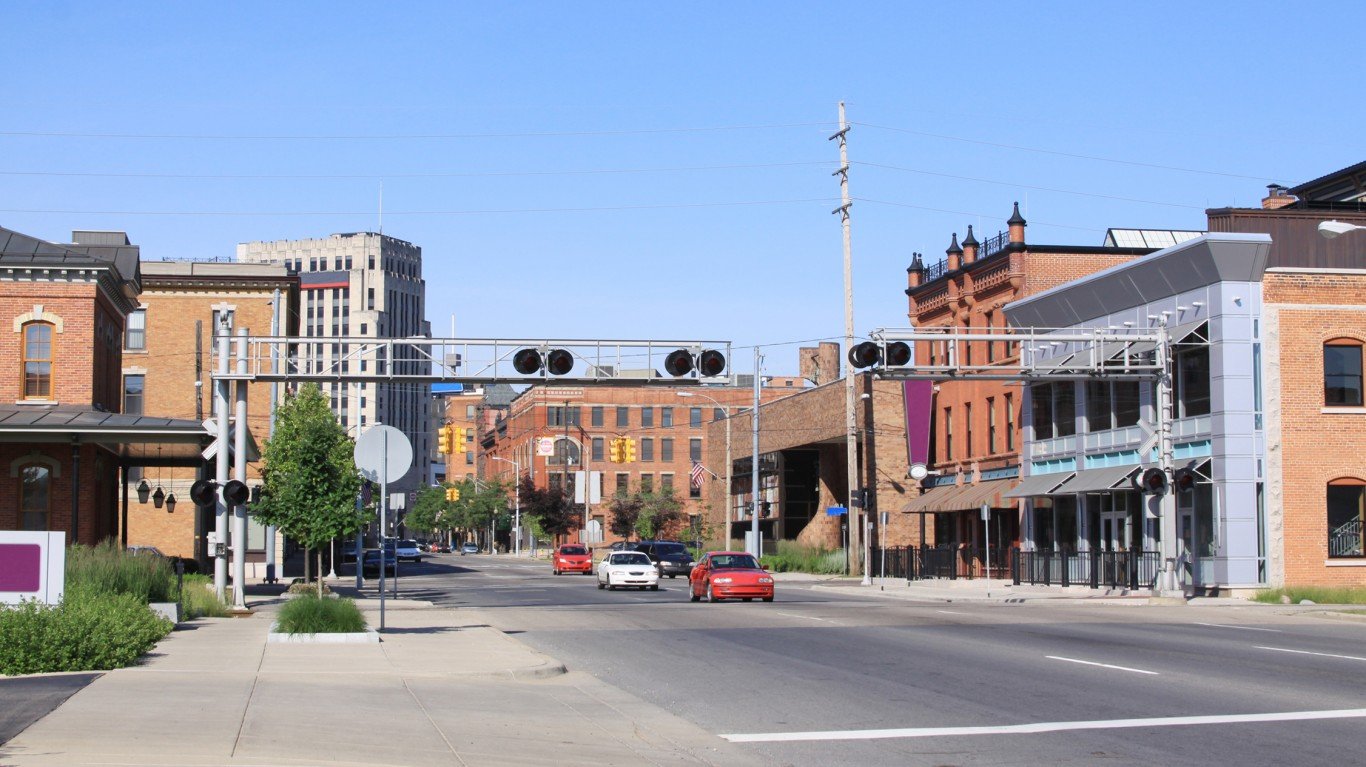
- Winter weather fatal crash rate, 2017-2021: 9.1 per 100,000 commuters who drive or carpool
- Total fatal crashes in winter conditions, 2017-2021: 10
- Most fatal winter-weather crashes in a single year, 2017-2021: 6 (60.0% of 5-yr. total)
- Avg. number of fatal crashes in winter conditions, 2017-2021: 2.0 per year
- Total commuters who drive or carpool: 110,339 (85.5% of all commuters)
8. Flagstaff, AZ

- Winter weather fatal crash rate, 2017-2021: 9.6 per 100,000 commuters who drive or carpool
- Total fatal crashes in winter conditions, 2017-2021: 5
- Most fatal winter-weather crashes in a single year, 2017-2021: 2 (40.0% of 5-yr. total)
- Avg. number of fatal crashes in winter conditions, 2017-2021: 1.0 per year
- Total commuters who drive or carpool: 52,052 (78.5% of all commuters)
7. Flint, MI

- Winter weather fatal crash rate, 2017-2021: 9.9 per 100,000 commuters who drive or carpool
- Total fatal crashes in winter conditions, 2017-2021: 15
- Most fatal winter-weather crashes in a single year, 2017-2021: 4 (26.7% of 5-yr. total)
- Avg. number of fatal crashes in winter conditions, 2017-2021: 3.0 per year
- Total commuters who drive or carpool: 152,262 (89.5% of all commuters)
6. Kankakee, IL
- Winter weather fatal crash rate, 2017-2021: 11.6 per 100,000 commuters who drive or carpool
- Total fatal crashes in winter conditions, 2017-2021: 5
- Most fatal winter-weather crashes in a single year, 2017-2021: 2 (40.0% of 5-yr. total)
- Avg. number of fatal crashes in winter conditions, 2017-2021: 1.0 per year
- Total commuters who drive or carpool: 43,272 (88.2% of all commuters)
5. Battle Creek, MI
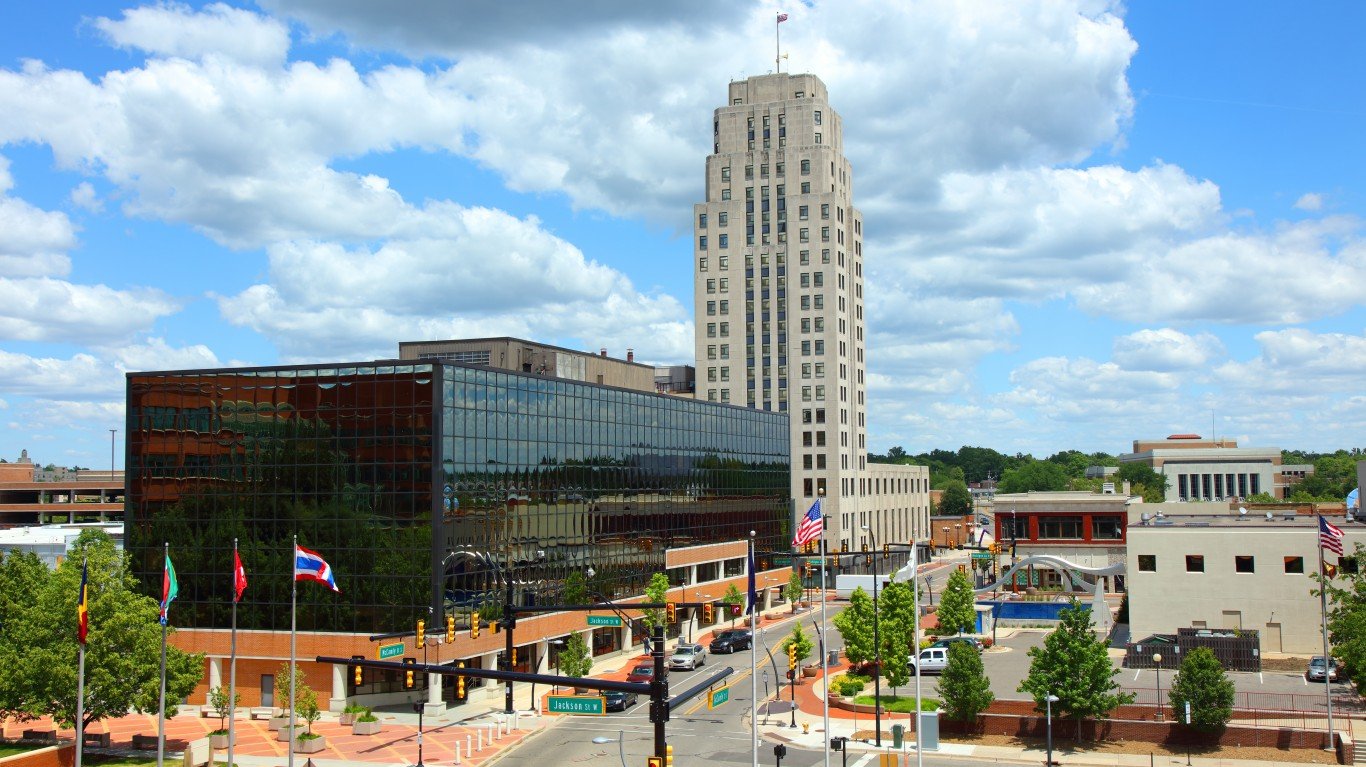
- Winter weather fatal crash rate, 2017-2021: 11.6 per 100,000 commuters who drive or carpool
- Total fatal crashes in winter conditions, 2017-2021: 6
- Most fatal winter-weather crashes in a single year, 2017-2021: 2 (33.3% of 5-yr. total)
- Avg. number of fatal crashes in winter conditions, 2017-2021: 1.2 per year
- Total commuters who drive or carpool: 51,696 (88.9% of all commuters)
4. Fairbanks, AK

- Winter weather fatal crash rate, 2017-2021: 12.1 per 100,000 commuters who drive or carpool
- Total fatal crashes in winter conditions, 2017-2021: 5
- Most fatal winter-weather crashes in a single year, 2017-2021: 1 (20.0% of 5-yr. total)
- Avg. number of fatal crashes in winter conditions, 2017-2021: 1.0 per year
- Total commuters who drive or carpool: 41,277 (85.7% of all commuters)
3. Anchorage, AK

- Winter weather fatal crash rate, 2017-2021: 14.1 per 100,000 commuters who drive or carpool
- Total fatal crashes in winter conditions, 2017-2021: 23
- Most fatal winter-weather crashes in a single year, 2017-2021: 8 (34.8% of 5-yr. total)
- Avg. number of fatal crashes in winter conditions, 2017-2021: 4.6 per year
- Total commuters who drive or carpool: 163,267 (83.9% of all commuters)
2. Cheyenne, WY
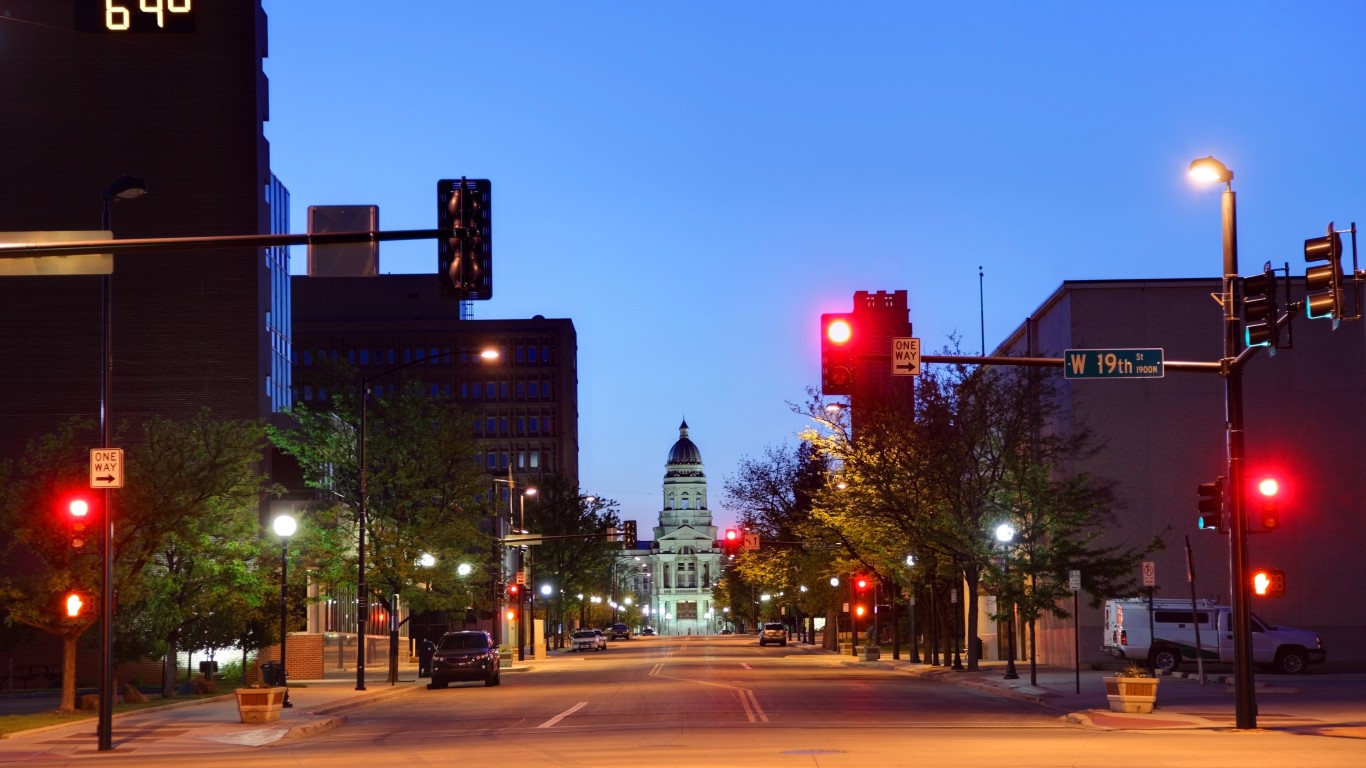
- Winter weather fatal crash rate, 2017-2021: 19.7 per 100,000 commuters who drive or carpool
- Total fatal crashes in winter conditions, 2017-2021: 9
- Most fatal winter-weather crashes in a single year, 2017-2021: 3 (33.3% of 5-yr. total)
- Avg. number of fatal crashes in winter conditions, 2017-2021: 1.8 per year
- Total commuters who drive or carpool: 45,635 (90.2% of all commuters)
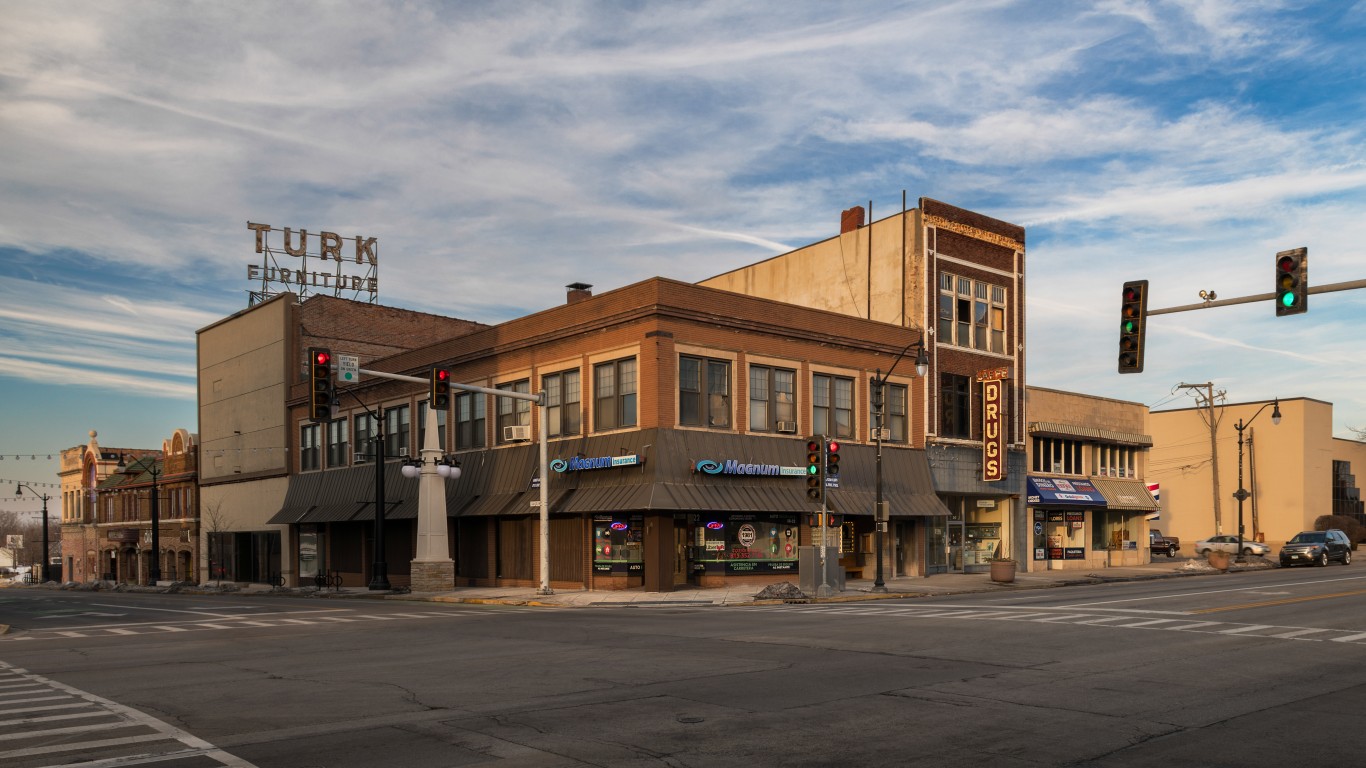
1. Michigan City-La Porte, IN
- Winter weather fatal crash rate, 2017-2021: 20.1 per 100,000 commuters who drive or carpool
- Total fatal crashes in winter conditions, 2017-2021: 9
- Most fatal winter-weather crashes in a single year, 2017-2021: 3 (33.3% of 5-yr. total)
- Avg. number of fatal crashes in winter conditions, 2017-2021: 1.8 per year
- Total commuters who drive or carpool: 44,803 (91.6% of all commuters)
Contact [email protected] for any questions or corrections.