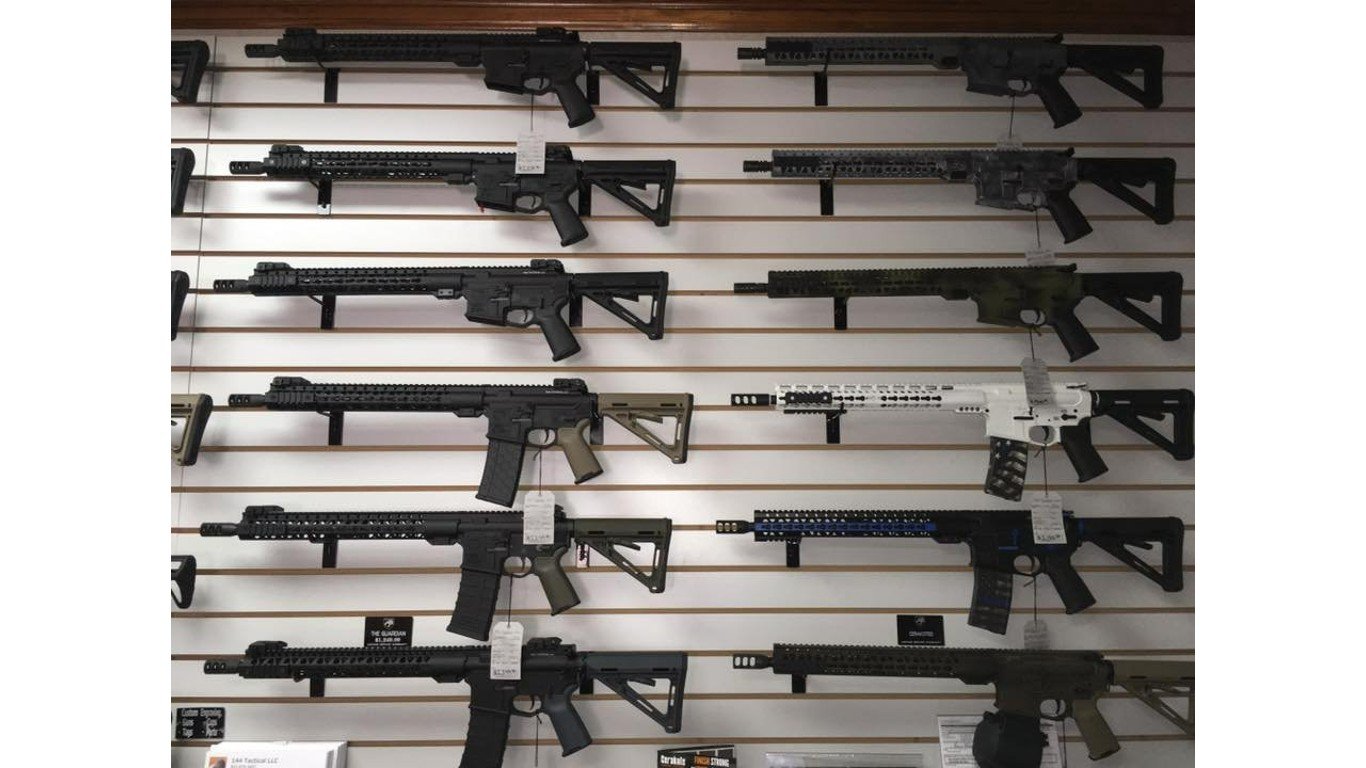
An estimated 1 in 3 American adults own at least one firearm. The most common reasons Americans cite for exercising their Second Amendment rights include personal protection, target shooting, and hunting. But with nearly 400 million civilian-owned firearms in circulation, some have inevitably fallen into the wrong hands, fueling a nationwide surge in gun violence. (Here is a look at the states where people buy the most guns.)
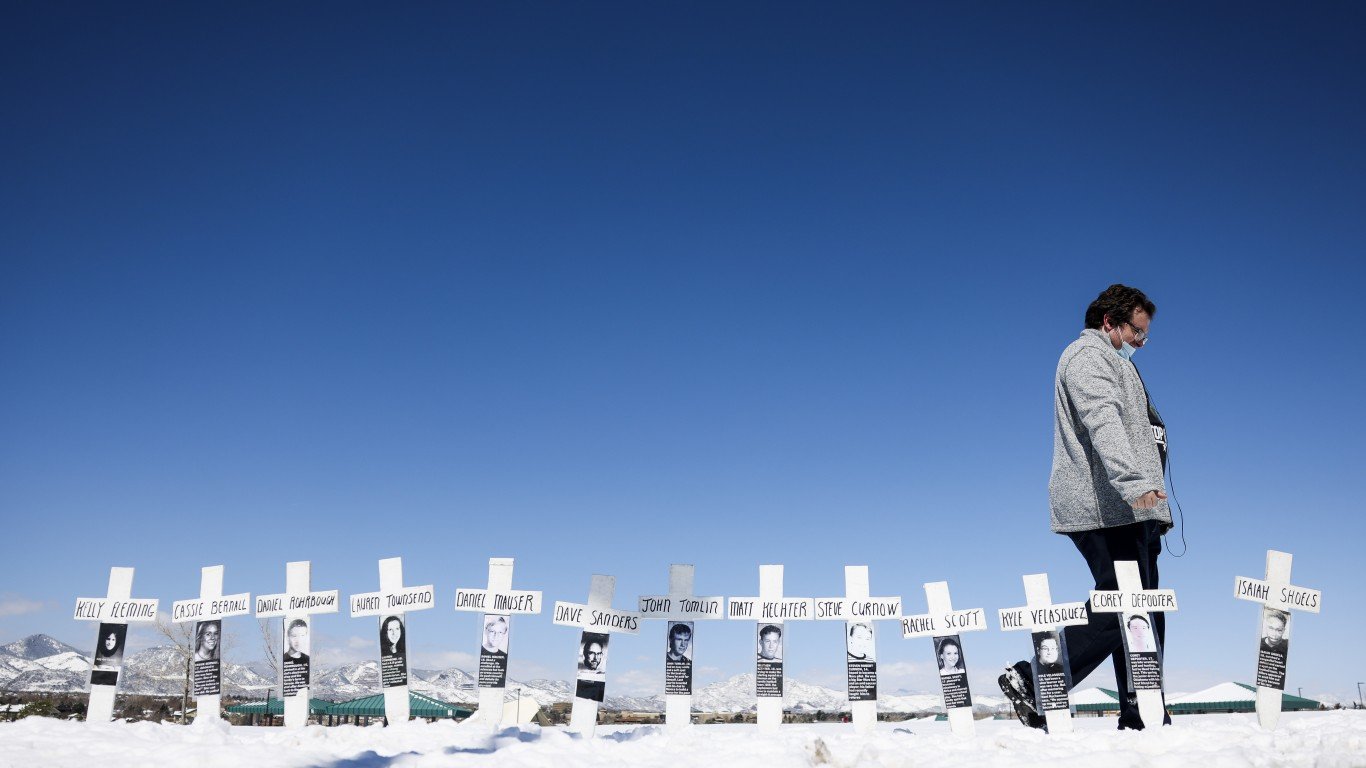
According to the FBI, active shooter incidents climbed by over 50% in 2021 compared to the previous year. Additionally, firearms were involved in over 234,500 violent crimes in 2021, a more than 30% increase from 2020.
Amid rising rates of gun violence, the Bureau of Alcohol, Tobacco, Firearms, and Explosives reported a spike in firearm trace requests from local, state, federal, and international law enforcement agencies. Guns that are traced by the ATF are typically those found at crime scenes. These guns have either been used, or are suspected to have been used, to commit a crime. It is important to note that not all firearms used in a crime are traced.
The ATF traced more than 453,500 firearms in 2021, up 16.2% from 389,300 in 2020 – and the increase is being driven by several states in particular.
North Carolina is one of 15 states in which the rise in firearm tracings exceeded the national average. The ATF traced a reported 22,918 firearms in the state in 2021, up from 18,973 in 2020. The 20.8% increase ranks as the 10th largest among the 50 states.
The most commonly traced firearms in North Carolina in 2021 were chambered for 9mm, .40 caliber, and .22 caliber rounds, in that order. These three calibers alone accounted for 60.0% of all firearms traced by the ATF in the state last year.
| Rank | State | 1-yr change in firearm tracings | ATF firearm tracings, 2021 | ATF firearm tracings, 2020 |
|---|---|---|---|---|
| 1 | Massachusetts | 74.5% | 3,193 | 1,830 |
| 2 | Rhode Island | 59.7% | 661 | 414 |
| 3 | Oklahoma | 54.4% | 5,246 | 3,397 |
| 4 | New York | 41.9% | 10,198 | 7,187 |
| 5 | Connecticut | 40.9% | 1,596 | 1,133 |
| 6 | Illinois | 28.1% | 19,086 | 14,897 |
| 7 | Florida | 27.3% | 34,331 | 26,966 |
| 8 | Ohio | 25.8% | 20,723 | 16,472 |
| 9 | Louisiana | 24.1% | 13,702 | 11,041 |
| 10 | North Carolina | 20.8% | 22,918 | 18,973 |
| 11 | California | 20.2% | 53,761 | 44,709 |
| 12 | Wisconsin | 19.2% | 7,021 | 5,892 |
| 13 | Texas | 19.0% | 45,351 | 38,109 |
| 14 | Tennessee | 18.2% | 15,337 | 12,970 |
| 15 | Kansas | 16.7% | 4,273 | 3,661 |
| 16 | South Carolina | 14.7% | 10,661 | 9,295 |
| 17 | New Mexico | 14.1% | 4,060 | 3,557 |
| 18 | Indiana | 14.0% | 10,316 | 9,049 |
| 19 | Kentucky | 13.9% | 6,764 | 5,941 |
| 20 | Minnesota | 13.4% | 4,560 | 4,020 |
| 21 | Wyoming | 13.4% | 288 | 254 |
| 22 | Alabama | 11.8% | 8,797 | 7,868 |
| 23 | New Jersey | 11.5% | 4,640 | 4,161 |
| 24 | Delaware | 10.7% | 1,651 | 1,491 |
| 25 | Pennsylvania | 9.9% | 15,186 | 13,823 |
| 26 | Arizona | 9.8% | 12,027 | 10,952 |
| 27 | Maryland | 9.4% | 9,710 | 8,872 |
| 28 | Idaho | 9.4% | 1,345 | 1,229 |
| 29 | Michigan | 8.6% | 12,274 | 11,301 |
| 30 | Nevada | 8.5% | 6,687 | 6,164 |
| 31 | New Hampshire | 8.1% | 692 | 640 |
| 32 | Utah | 8.0% | 2,989 | 2,767 |
| 33 | Colorado | 6.7% | 6,954 | 6,516 |
| 34 | Georgia | 6.2% | 20,356 | 19,172 |
| 35 | Missouri | 5.2% | 10,096 | 9,598 |
| 36 | Arkansas | 4.8% | 3,516 | 3,355 |
| 37 | South Dakota | 4.0% | 806 | 775 |
| 38 | Oregon | 3.8% | 5,331 | 5,138 |
| 39 | Washington | 3.2% | 5,478 | 5,310 |
| 40 | Mississippi | 2.2% | 4,699 | 4,596 |
| 41 | Nebraska | 1.9% | 2,181 | 2,140 |
| 42 | Iowa | 0.4% | 2,555 | 2,546 |
| 43 | Virginia | -0.1% | 12,019 | 12,033 |
| 44 | Alaska | -4.5% | 778 | 815 |
| 45 | North Dakota | -5.9% | 750 | 797 |
| 46 | Montana | -10.6% | 1,125 | 1,259 |
| 47 | Maine | -17.9% | 499 | 608 |
| 48 | West Virginia | -23.4% | 1,671 | 2,181 |
| 49 | Hawaii | -24.1% | 110 | 145 |
| 50 | Vermont | -26.1% | 232 | 314 |