One of the main drawbacks to living in major cities is the price. Goods and services are all fairly expensive compared to less densely populated areas. Nearly every state is home to one major metropolitan area in which the cost of living is well above the average for that state.
To determine the most expensive city in every state, 24/7 Wall St. reviewed data on cost of living from the Bureau of Economic Analysis.
Just because a city is the most expensive in its state does not necessarily mean its cost of living is that high when compared to the national average cost of living. In 29 states, the most expensive city has a lower cost of living than is typical nationwide, largely because the prices of goods and services statewide fall well below national prices.
The vast majority of metro areas on the list expanded, with their population increasing well beyond the 2.9% national population growth over the last five years. Costs of living tend to be higher in places where people want to live. These kinds of metro areas typically have abundant economic opportunity, reflected in the areas’ relatively high incomes and low poverty rates, compared to both the state and the country.
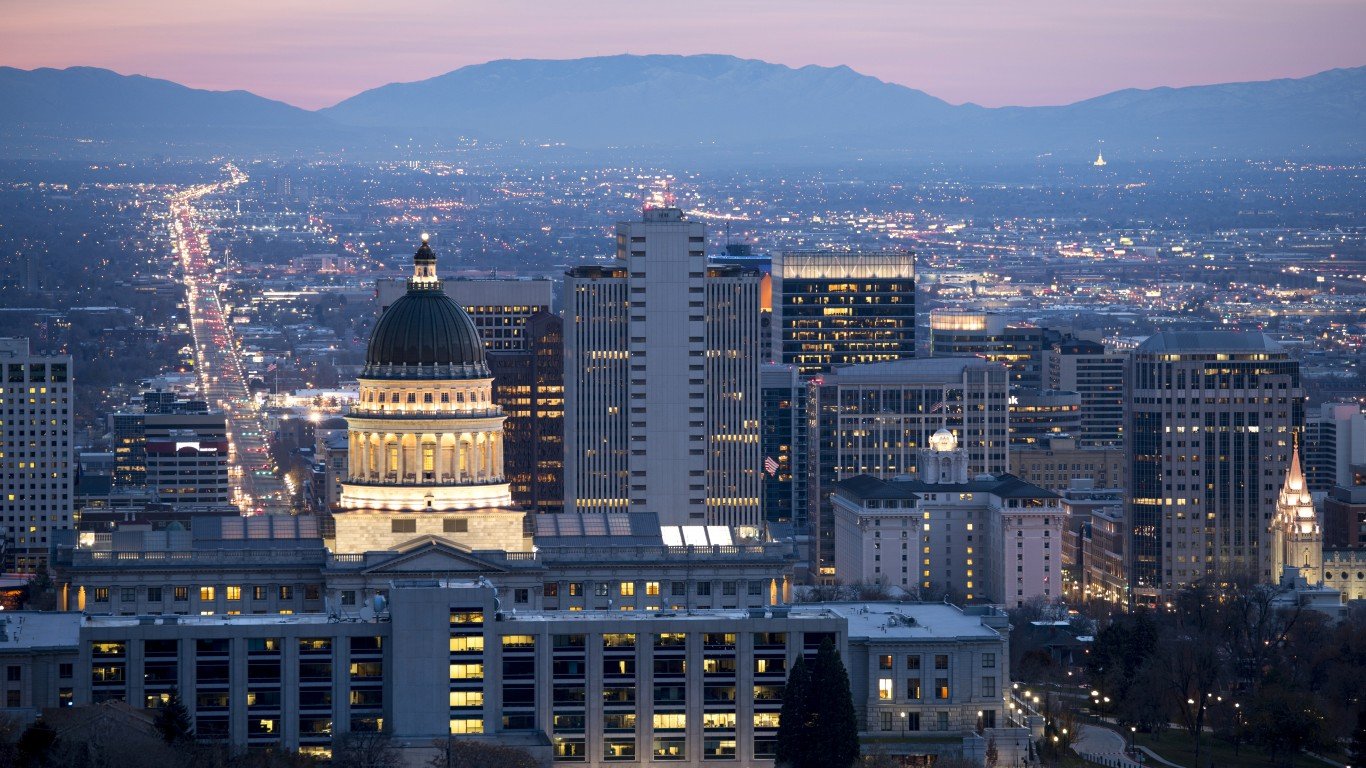
The most expensive city to live in Utah is the Salt Lake City metro area. There, the cost of living is 1.4% lower than the average cost nationwide. The cost of living in Utah is 3.5% lower than is typical in the U.S.
Cities tend to have higher costs of living when their residents have higher incomes. In the Salt Lake City metro area the median household income is $80,196, compared to the median in Utah, which is $75,780. The metro area also has a poverty rate of 8.6%, compared to the Utah poverty rate of 8.9%
To determine the most expensive city in every state, 24/7 Wall St. reviewed data on cost of living from the Bureau of Economic Analysis. Metropolitan areas were ranked based on the regional price parity for all goods and services as of 2019. Supplemental data on median household income and poverty rate came from the U.S. Census Bureau’s 2019 American Community Survey.
| State | Most expensive city | Cost of living vs. nationwide | State cost of living vs. nationwide | Median household income ($) |
|---|---|---|---|---|
| Alabama | Daphne-Fairhope-Foley | 9.8% lower | 14.2% lower | 56,439 |
| Alaska | Fairbanks | 6.8% higher | 5.1% higher | 72,065 |
| Arizona | Flagstaff | 0.7% lower | 3.7% lower | 58,085 |
| Arkansas | Fayetteville-Springdale-Rogers | 11.8% lower | 15.3% lower | 61,674 |
| California | San Francisco-Oakland-Berkeley | 34.5% higher | 16.4% higher | 114,696 |
| Colorado | Boulder | 6.7% higher | 1.9% higher | 88,535 |
| Connecticut | Bridgeport-Stamford-Norwalk | 12.4% higher | 5% higher | 97,053 |
| Delaware | Dover | 7.5% lower | 0.6% lower | 58,001 |
| Florida | Miami-Fort Lauderdale-Pompano Beach | 11.7% higher | 1% higher | 60,141 |
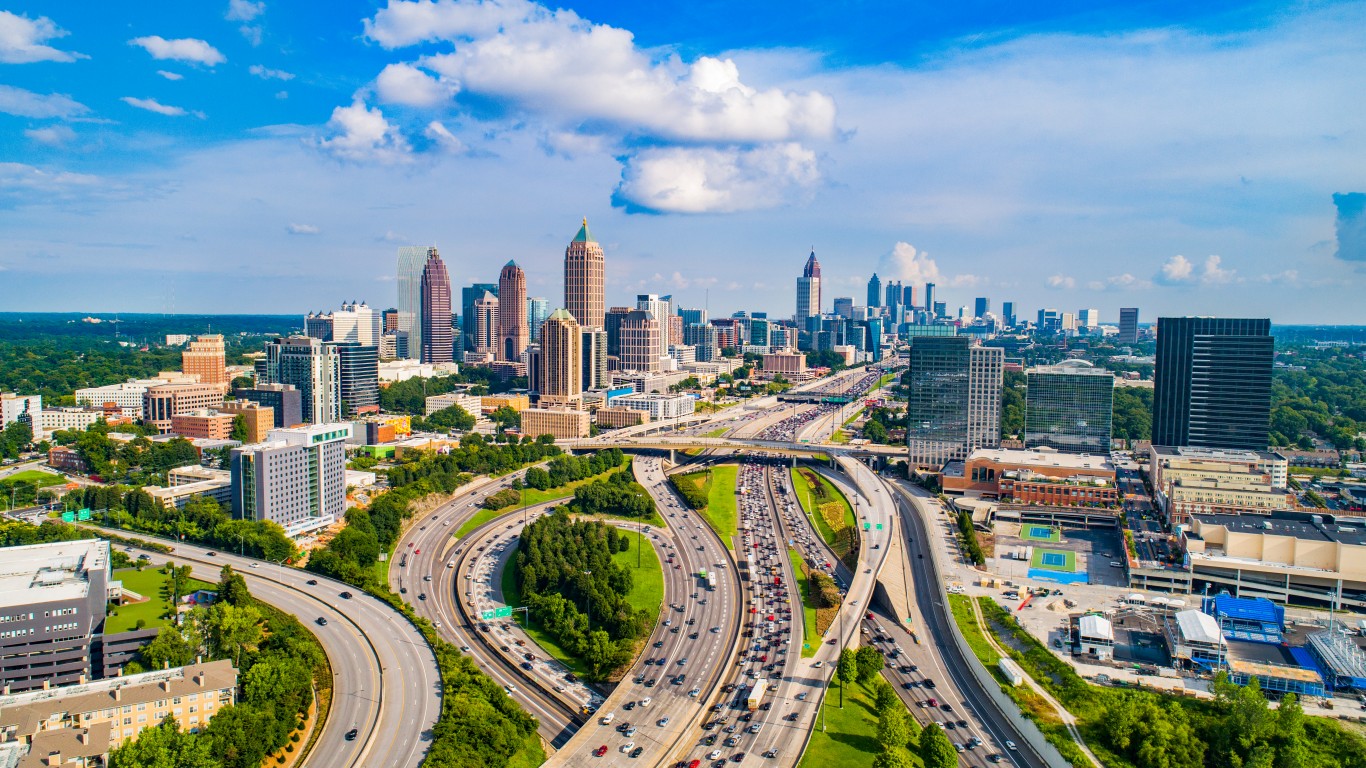
| Georgia | Atlanta-Sandy Springs-Alpharetta | 2.1% lower | 6.8% lower | 71,742 |
| Hawaii | Urban Honolulu | 23.8% higher | 19.3% higher | 87,470 |
| Idaho | Boise City | 6.4% lower | 7.8% lower | 66,466 |
| Illinois | Chicago-Naperville-Elgin | 2.8% higher | 2.6% lower | 75,379 |
| Indiana | Bloomington | 8.5% lower | 11.3% lower | 52,526 |
| Iowa | Iowa City | 7.1% lower | 11% lower | 63,761 |
| Kansas | Lawrence | 8.9% lower | 10.8% lower | 64,233 |
| Kentucky | Lexington-Fayette | 9.4% lower | 12.6% lower | 60,492 |
| Louisiana | New Orleans-Metairie | 6.9% lower | 12.1% lower | 55,710 |
| Maine | Portland-South Portland | 3.7% higher | 0.7% lower | 71,913 |
| Maryland | Baltimore-Columbia-Towson | 5.8% higher | 7.7% higher | 83,160 |
| Massachusetts | Boston-Cambridge-Newton | 15.5% higher | 10.4% higher | 94,430 |
| Michigan | Ann Arbor | 0.6% higher | 7.7% lower | 76,576 |
| Minnesota | Minneapolis-St. Paul-Bloomington | 2.9% higher | 2% lower | 83,698 |
| Mississippi | Jackson | 12.3% lower | 15.6% lower | 52,426 |
| Missouri | Kansas City | 7.2% lower | 11.3% lower | 70,215 |
| Montana | Missoula | 4.6% lower | 6.5% lower | 57,347 |
| Nebraska | Omaha-Council Bluffs | 8.3% lower | 10.5% lower | 70,373 |
| Nevada | Reno | 1.6% lower | 2.6% lower | 72,132 |
| New Hampshire | Manchester-Nashua | 7.6% higher | 6.5% higher | 83,626 |
| New Jersey | Trenton-Princeton | 6.2% higher | 16% higher | 79,492 |
| New Mexico | Santa Fe | 3% lower | 8.9% lower | 61,298 |
| New York | New York-Newark-Jersey City | 25.7% higher | 16.3% higher | 83,160 |
| North Carolina | Raleigh-Cary | 3.9% lower | 8.3% lower | 80,096 |
| North Dakota | Bismarck | 8.1% lower | 10.7% lower | 70,979 |
| Ohio | Columbus | 8.4% lower | 11.6% lower | 67,207 |
| Oklahoma | Oklahoma City | 10.2% lower | 12.8% lower | 60,605 |
| Oregon | Portland-Vancouver-Hillsboro | 5% higher | 2.2% higher | 78,439 |
| Pennsylvania | Philadelphia-Camden-Wilmington | 5.3% higher | 3% lower | 74,533 |
| Rhode Island | Providence-Warwick | 0.3% higher | 1.3% higher | 70,967 |
| South Carolina | Charleston-North Charleston | 2.9% lower | 8.5% lower | 70,505 |
| South Dakota | Sioux Falls | 8.8% lower | 12.2% lower | 65,566 |
| Tennessee | Nashville-Davidson–Murfreesboro–Franklin | 5.6% lower | 10.3% lower | 70,262 |
| Texas | Houston-The Woodlands-Sugar Land | 1.7% higher | 3.5% lower | 69,193 |
| Utah | Salt Lake City | 1.4% lower | 3.5% lower | 80,196 |
| Vermont | Burlington-South Burlington | 6.2% higher | 3.1% higher | 74,909 |
| Virginia | Charlottesville | 1.2% lower | 1.3% higher | 75,907 |
| Washington | Seattle-Tacoma-Bellevue | 14.5% higher | 8.4% higher | 94,027 |
| West Virginia | Morgantown | 10.2% lower | 12.9% lower | 56,395 |
| Wisconsin | Madison | 3.6% lower | 8.1% lower | 75,545 |
| Wyoming | Casper | 7% lower | 7.2% lower | 65,034 |