Micron Technology: Record DRAM Pricing Meets A Stock In Retreat
Micron just locked in five-year supply deals at historically high DRAM prices while a major AI cloud buyer quietly bets those same prices are about to fall. One of them is going to be very wrong.

Micron (Nasdaq: MU | MU Price Prediction) fell again yesterday, trading intraday between $873.63 and $982.40 and changing hands around $876, a decline that has taken the stock roughly 27-29% below the nearly $1,200 high it touched in June 2026. Although that sounds like a severe move, it looks almost trivial zoomed out to ten years: as shown in Chart 1, the stock’s entire prior trading range sits well below the spike that began late last year, and the current pullback barely registers against the scale of the move that preceded it.
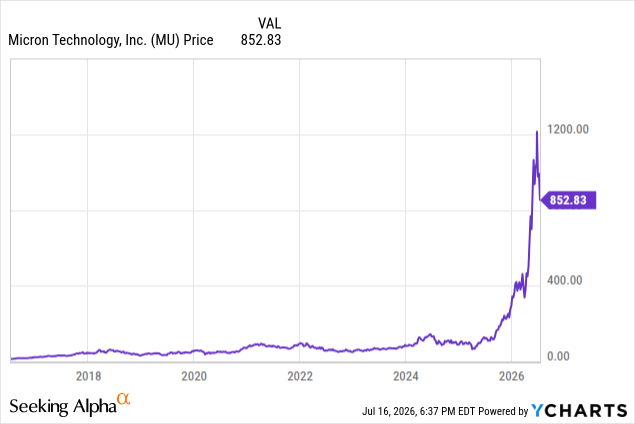
MU data by YCharts
Reports that Chinese memory maker CXMT is preparing an $8.55 billion IPO are being cited as the proximate cause of today’s decline, along with reports that AI cloud provider CoreWeave is exploring financial hedges against a potential drop in memory costs. Overall, the decline is also consistent with broader profit-taking across a semiconductor sector that gained roughly 82% in the first half of 2026, as measured by the SOXX (NASDAQ: SOXX).
A Correlation I Documented in 2018
I first laid out the relationship between Micron’s stock and the DRAM spot price in a June 2, 2018, Seeking Alpha article entitled “Micron: First Price Fixing, Now Antitrust Allegations By The Chinese Government.” That piece was written around China’s National Development and Reform Commission opening a formal antitrust probe into Micron, Samsung, and SK hynix over suspected DRAM price collusion during the 2016-2018 supercycle. Although the article was about a regulatory threat and not a chart, the correlation shown in Chart 2, Micron’s share price against the DDR3/DDR4 spot price, held in near lockstep from 2015 through mid-2018.
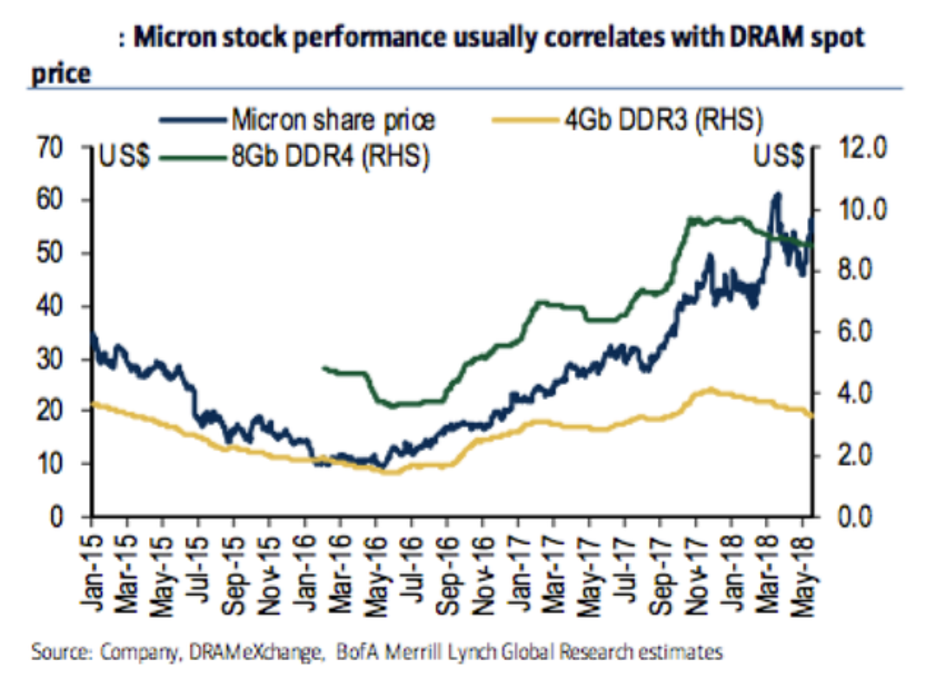
Chart 2: Micron share price vs. DDR3/DDR4 spot price, 2015-2018, from the 2018 article
What has changed in the eight years since is the mechanism, not the actor. In 2018, Chinese regulators tried to cap DRAM pricing power directly, through an antitrust investigation. In 2026, a Chinese competitor is trying to compete that pricing power away instead. Importantly, both episodes put a Chinese government-linked actor at the center of the story; in the current one, it is showing up in Micron’s stock price before it is showing up in the ASP (Average Selling Price) data.
DRAM ASPs at a Ten-Year High
According to The Information Network’s tracking of Micron’s DRAM average selling prices, shown in Chart 3, 2Q26 ASPs are running at approximately $1.17, above the prior cycle peak of roughly $0.87 in 3Q18-4Q18, and the highest point in the ten-year series.
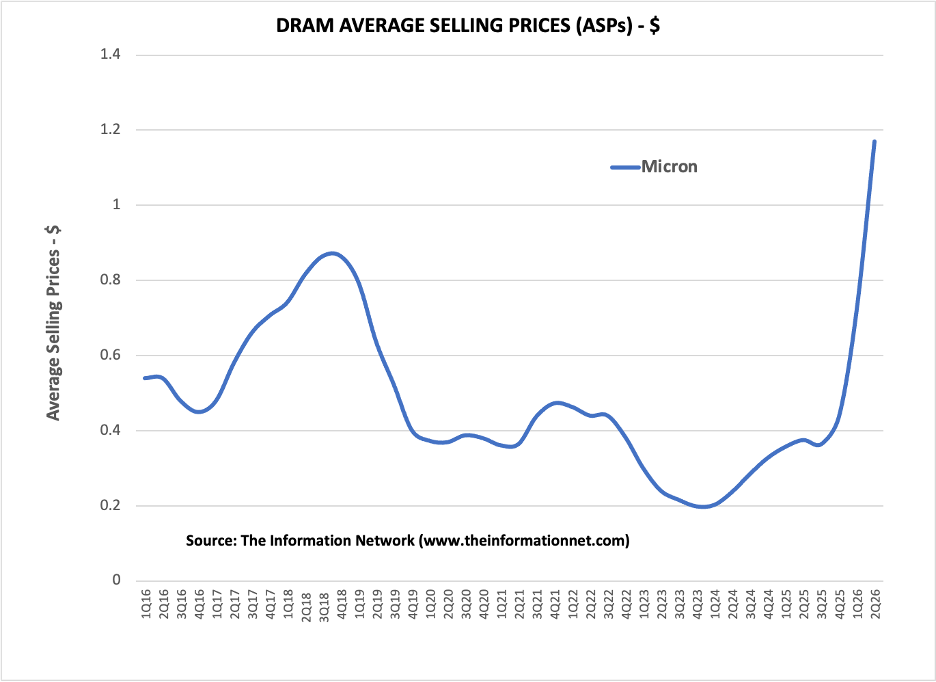
Chart 3: Micron DRAM average selling prices, 1Q16-2Q26
That peak in 2018 was followed by one of the worst downcycles in the company’s history:
- ASPs fell from roughly $0.87 to $0.35-0.39 through 2019-2020, a decline of more than 55%.
- ASPs recovered modestly to roughly $0.47 in 2021-2022, but fell again.
- ASPs bottomed around $0.19-0.20 by early 2024, low enough that Micron posted GAAP losses for several quarters.
From that 2024 trough, ASPs have roughly tripled. The move is not specific to Micron. In fact, conventional DRAM contract prices rose an estimated 93-98% quarter-over-quarter in Q1 2026 alone. Samsung’s DRAM ASP rose more than 90% quarter-over-quarter over the same period, with Q2 growth estimated at 50-60%, and the company is reportedly seeking a further 20% increase for Q3, with LPDDR hikes potentially running higher still. SK Hynix disclosed Q1 ASP gains in the mid-60% range. The benchmark DDR4 8Gb spot chip hit an all-time high of roughly $20 in May, up 25% from April, according to DRAMeXchange data going back to 2016.
Micron’s own actions indicate management views the pricing as durable rather than transitory. On June 25, the company locked in what has been described as historically high memory prices in supply agreements running out five years, not the posture of a company hedging against a near-term reversal. On the fiscal Q3 2026 earnings call, CEO Sanjay Mehrotra stated that supply constraints are expected to “persist beyond calendar 2026,” with market tightness “locked in to persist beyond calendar 2027,” and that Micron expects to meet only “half to two-thirds” of demand from its key customers. Mehrotra further indicated that long-term agreement pricing for DRAM now ranges from the “low teens to mid-$20s a gigabyte,” and that gross margins at the floor of the current cycle would be “well beyond the peaks” the company has previously experienced. Micron’s DRAM revenue reportedly reached a record $31.3 billion in the most recent quarter, up 343% year over year.
What Happened After the Last Two Peaks
Micron has been through comparable ASP peaks twice before in the past decade, and in both cases the stock eventually converged with the ASP chart rather than the reverse:
- After the 2018 peak, ASPs fell more than 55%, and Micron’s stock declined with them through 2019, ahead of the broader market’s 2020 selloff.
- After the smaller 2022 peak, ASPs fell to roughly $0.19-0.20 by early 2024, and the stock spent nearly two years underwater before the current cycle began.
In both instances, the ASP chart led and the stock chart followed it down. That history argues against dismissing the current stock decline as pure overreaction. Although Micron’s five-year pricing lock is a structurally different commitment than the company held heading into either prior downturn, and AI-driven server and HBM (High Bandwidth Memory) demand is, in my view, a more durable end market than the smartphone and PC replacement cycles that drove the 2018 and 2022 peaks, whether that difference is enough to break the pattern rather than merely delay it is the question the next two quarters will answer.
Why the Stock Is Falling Anyway
Three factors are being cited for today’s decline specifically. CXMT, already the world’s fourth-largest DRAM producer, is reportedly preparing an $8.55 billion IPO, which investors are reading as a signal of accelerating Chinese domestic DRAM capacity, a longer-horizon threat to pricing power independent of current contract prices. Reports that CoreWeave, a large AI-cloud buyer of memory, is exploring financial hedges against a future decline in memory costs are arguably more informative than a sell-side downgrade, since they imply a sophisticated buyer views current pricing as closer to a peak than a floor. Overall, broad sector-wide profit-taking following the SOXX’s 82% first-half gain has hit KLA Corporation (KLAC), Western Digital Corporation (WDC), and Seagate Technology Holdings plc (STX) alongside Micron.
There is also a rate-of-change signal worth noting. The pace of DRAM price increases appears to be decelerating even as the absolute price continues to rise, with some reporting tying May’s all-time-high print to a slowing quarter-over-quarter rate of increase as PC OEM deals closed. A price still rising, but rising more slowly, is exactly the kind of second-derivative signal a sophisticated buyer such as CoreWeave would act on well before it shows up in the spot price itself.
The selloff has not been confined to Micron. Comparing recent moves across the memory and storage complex:
- SK hynix fell approximately 15% in a single session after South Korean brokerage KIS published a Q2 profit estimate roughly 8% below consensus, citing a slower-than-expected HBM4 shipment ramp.
- Western Digital (NASDAQ: WDC) fell approximately 6% and Seagate (NASDAQ: STX) fell approximately 7% in sympathy sessions tied to broader memory supply-glut concerns.
- SanDisk (NASDAQ: SNDK) fell approximately 11% in a separate session on the same concerns and is off roughly 30% from its 52-week high, although it remains up more than 600% year to date.
- KLA Corporation (NASDAQ: KLAC) fell 12% intraday on broad semiconductor profit-taking, followed by declines of 6.56% and 4.93% in subsequent sessions, even though management has flagged surging DRAM prices as a gross-margin headwind, meaning falling memory prices should, on KLA’s own disclosed economics, improve rather than harm its margin outlook.
The KLA case is worth isolating. A stock falling for a reason that contradicts its own disclosed cost structure indicates indiscriminate selling across a sector label, not a reassessment of that specific company’s earnings power.
Investor Takeaway
The bull case rests on current, hard data: record ASPs, a five-year pricing lock Micron itself just signed, management’s own commentary that supply tightness persists beyond 2027, and 343% year-over-year DRAM revenue growth. The bear case rests on forward-looking behavior from a sophisticated buyer, CoreWeave’s hedging activity, plus a multi-year Chinese competitive overhang from CXMT that compresses forward multiples today regardless of when it fully materializes.
I expect the next two data points to resolve which side is right. First, whether Samsung’s reported push for a further 20% DRAM price increase in Q3 2026 actually holds. Second, whether Micron’s next earnings call indicates hyperscaler order books are being renegotiated in light of CoreWeave-style hedging. If the Q3 price increase holds and order books stay firm, I would expect the stock to close the gap with the ASP chart by moving higher, consistent with the correlation I documented in 2018. If the increase is delayed or discounted, that would be the first evidence that the stock, not the ASP chart, is the accurate leading indicator this time.
Contact [email protected] for any questions or corrections.
Dr. Robert Castellano has over 40 years of experience analyzing the high-tech industries. He is president of The Information Network (www.theinformationnet.com). He earned a PhD degree in Chemistry from Oxford University (UK). His PhD thesis advisor, John Goodenough, won the Nobel Prize in Chemistry in 2019 for the invention of the Lithium Ion Battery. He writes with George Gilder, novelist, futurist, and economist, and his team for Eagle Financial Publishing.