Nationwide, personal income rose 14.6% from 2010 to 2015, a period in which the U.S. recovered sharply from the recession. That increase took aggregate national income to $14 trillion last year (just short of America’s annual gross domestic product). In five states, the rise in income was much sharper than the national average, based to some extent of the strength of their economies and some industries that operate inside their borders.
The personal income increase in these five states was over 20%. 24/7 Wall St. examined them in a recent article “States Where Incomes Are Booming (or Not).” Changes in the economies could shake up the list considerably in the near future. One example is North Dakota, where personal income soared and unemployment fell, to some extent because of the fracking industry, which has been substantially damaged by falling oil prices.
The top five, listed smallest increase to largest:
5. Colorado
> Personal income growth (2010-2015): 19.9%
> Per capita personal income 2015: $45,142 (19th highest)
> Unemployment rate: 3.9% (10th lowest)
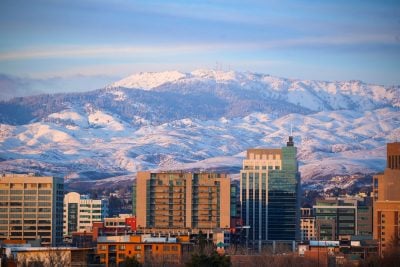
> Pct. change in labor force (2010-2015): 3.8% (12th highest)Personal Income in Colorado increased by nearly 20% between 2010 and 2015, one of the sharpest such increases in the country. Every major economic sector in the state expanded over that time period, and two-thirds outpaced their national growth. Rapidly increasing incomes were also likely spurred by an increasing labor force and a decreasing unemployment rate. Between 2010 and 2015, Colorado’s labor force grew by 3.8% as unemployment decreased by 4.8 percentage points, each outpacing the corresponding national rates. Over that same time period, the state’s poverty rate dropped from 13.4% to 12.0%, one of the most drastic drops in the country.
4. Utah
> Personal income growth (2010-2015): 20.3%
> Per capita personal income 2015: $36,764 (the lowest)
> Unemployment rate: 3.5% (5th lowest)
> Pct. change in labor force (2010-2015): 8.0% (2nd highest)While personal income in Utah grew by 20.3% between 2010 and 2015 — nearly the fastest growth of all states — Utah residents have some of the nation’s lowest incomes. Utah’s per capita income of $36,764 is the lowest in the nation. Still, the state’s poverty rate of 11.7% is among the lower rates nationwide, and the state’s jobless rate of 3.5% is nearly the lowest. Despite the low per capita personal income, the income growth and relatively strong economic factors are attracting people to the state. Utah’s labor force grew by 8% between 2010 and 2015, the second fastest such growth nationwide.
[nativounit]
3. California
> Personal income growth (2010-2015): 22.7%
> Per capita personal income 2015: $42,909 (22nd lowest)
> Unemployment rate: 6.2% (7th highest)
> Pct. change in labor force (2010-2015): 3.5% (14th highest)Personal income in California grew by 22.7% between 2010 and 2015, the third-fastest growth in the country. The contribution to GDP from California’s information sector — which includes many companies in Silicon Valley — increased by 18.4% between 2010 and 2014. This was the eighth largest such growth nationwide. Now, the sector accounts for 8.1% of the state’s economy, the second largest share of all states. California’s recent income growth has been even more robust, increasing by 6.0% last year, the largest increase in any state.
2. Texas
> Personal income growth (2010-2015): 23.5%
> Per capita personal income 2015: $44,241 (24th highest)
> Unemployment rate: 4.5% (18th lowest)
> Pct. change in labor force (2010-2015): 6.8% (4th highest)Like in a number of other largely energy-dependent states, the dramatic five-year aggregate income growth in Texas has slowed in the past year. The state’s mining sector accounts for 13.5% of Texas GDP, the sixth largest share compared with other states. While the state’s mining sector grew 65.7% between 2010 and 2014 — the fifth largest growth from mining nationally — growth over the last year has been far less remarkable. In fact, Texas’ income grew by just 4.0% in 2015, in line with the overall national income growth.
Despite the mining sector’s tepid one-year growth, personal income in Texas was boosted in the fourth quarter of last year by bonuses paid to workers after the United Auto Workers successfully ratified new contracts.
1. North Dakota
> Personal income growth (2010-2015): 27.9%
> Per capita personal income 2015: $54,448 (2nd highest)
> Unemployment rate: 2.7% (the lowest)
> Pct. change in labor force (2010-2015): 9.5% (the highest)The mining industry has been one of the primary drivers of income growth over the last five years. This was especially the case in North Dakota, where personal income grew by 27.9% over from 2010 to 2015, by far the largest income boom nationwide. Recently, however, the sector has waned significantly. Earnings in mining declined by 5.2% from 2014 to 2015 nationally, and the sector drove down income growth in North Dakota and in several other state economies that are highly dependent on the energy sector in the last year.
North Dakota could fall off the list entirely in 2016 and 2017. It is an example of how much one industry can affect an economy that is not diversified and has a relatively small population.
Methodology: We derived our own estimates of real personal income by adjusting nominal figures from regional and national prices, based on the BEA’s methodology. Due to limited data availability, real personal income estimates for 2014 and 2015 were calculated with 2013 regional prices. Also from the BEA, we considered industry contributions to GDP for 2010 and 2014. Labor force and unemployment came from the Bureau of Labor Statistics. Socioeconomic factors, such as educational attainment rates, poverty rates and net population change from migration, came from the U.S. Census Bureau’s 2015 American Community Survey (ACS).
Contact [email protected] for any questions or corrections.