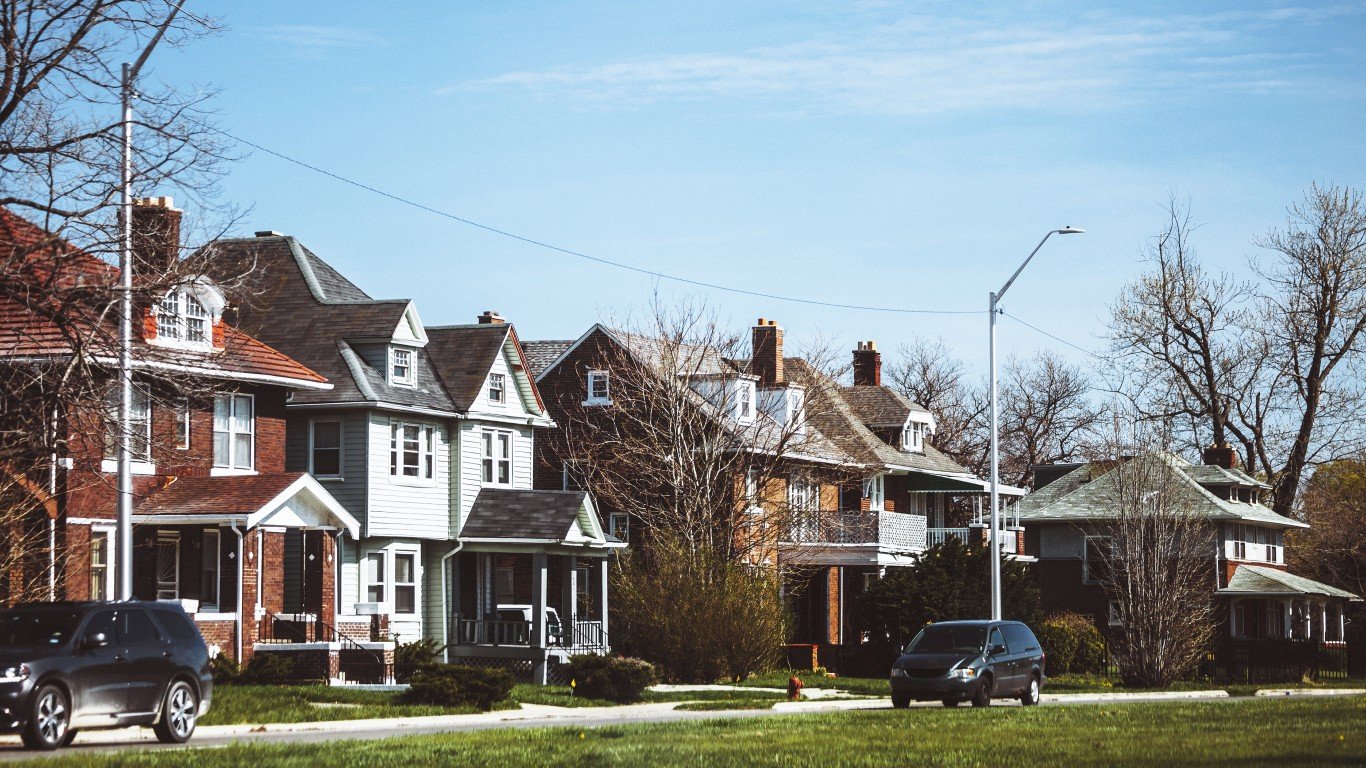
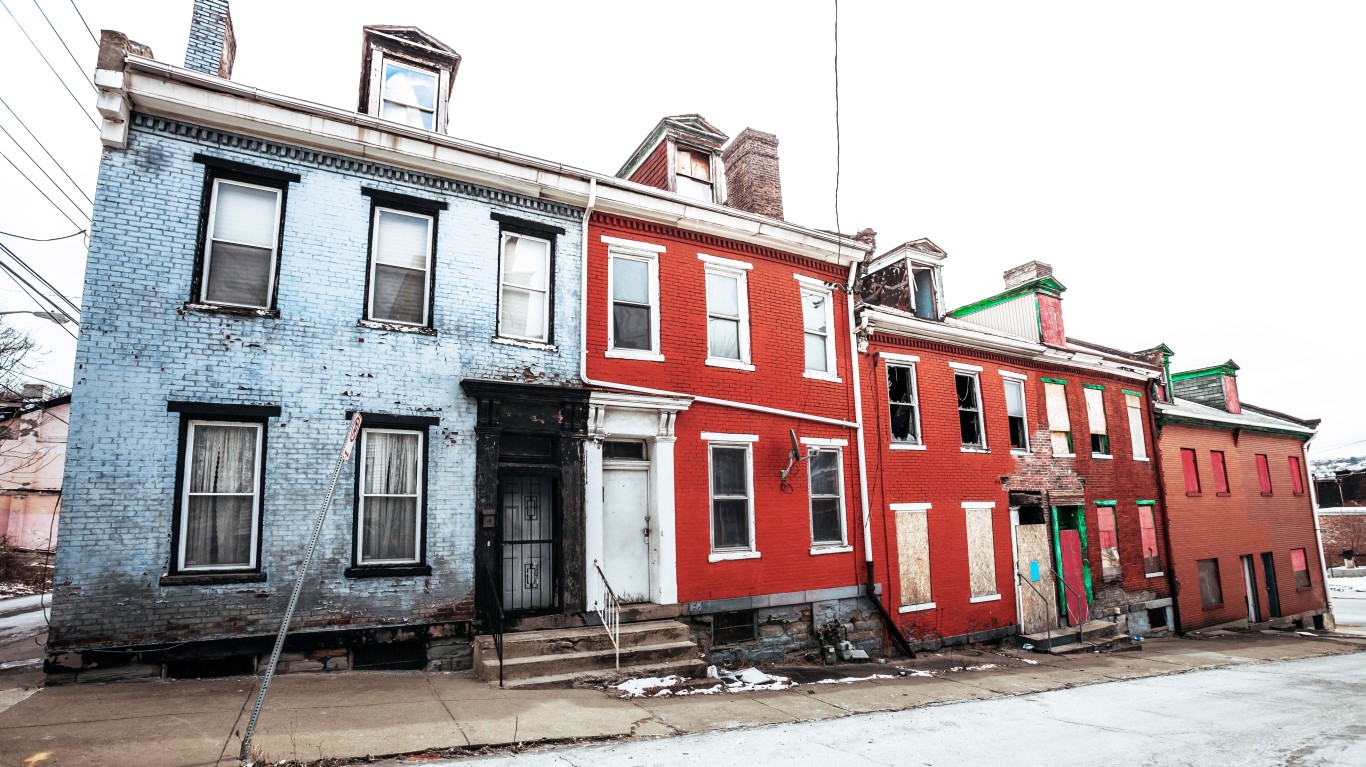
Nearly every important set of data from the government and private sector analysts shows that the housing market has begun to recover. The housing recovery picked up steam in recent months. Home sales jumped in both December and January. Source: Thinkstock
In some cities the rebound is so strong that housing prices are up by double-digit percentages year-over-year. However, it is worth pointing out that many of these comeback cities, such as Las Vegas, are those that were hit the hardest when the housing bubble burst. In other words, the home markets that suffered severe damage in 2008 through 2011 have bounced back, although, in most cases, not to their peak levels of 2006.
Click Here To See All Seven Cities
The data on the recovery make one thing very clear. Not all housing markets were badly hurt in the crash. The recovery has been very uneven. Like unemployment, changes to the national benchmark do not tell the entire tale. The devil is in the details as far as tracking the home prices is concerned.
One of the most widely followed measures of home prices is the S&P/Case-Shiller Home Price Indices. The base index tracks the prices in the 20 largest cities. It was set at 100 in January 2000. This allows observers to track home values for a period that stretches back more than 10 years.
A review of housing data shows how closely it is married with unemployment. New data from Case-Shiller for December indicate that the value of homes in Phoenix rose 23% from December of 2011 to 2012. In Detroit, the jump was 13.6% for the same period.
In Detroit, the unemployment rate rose above 17% in mid-2009. By contrast, national unemployment rates never rose above 10.1%. While Detroit’s unemployment rate remains worse than the United States as a whole, the city has since had a nearly miraculous recovery, with unemployment dropping to 10.2% in December of last year.
In December, the value of homes in the 20 cities Case-Shiller measures rose by 6.8% year-over-year. In seven cities, the rise was much more dramatic — in the double digits. 24/7 Wall St. reviewed the seven cities to find trends that could indicate what may have caused these jumps. Those same factors may be critical to the broad recovery of real estate across the nation in the longer term.
7. Los Angeles
> 1-yr. home price change: 10.2%
> Price drop through Q2 2012: 40.4%
> Median home price Q2 2012: $345,000
> Unemployment: 9.3%
Los Angeles still suffers from higher unemployment than the U.S. average. That is holding down home prices, which remain about 40% below their peak in the second quarter of 2006. Prices gained 10.2% in 2012 and are well above their low point in the third quarter of 2008. Distressed sales fell to around 35% of single-family home sales in December of 2012, down from nearly 49% in December 2011. As with other cities on this list, as the distressed homes get moved through the system, prices will rise.
6. Miami
> 1-yr. home price change: 10.6%
> Price drop through Q2 2012: 50.4%
> Median home price Q2 2012: $196,000
> Unemployment: 8.1%
Miami home prices peaked in the first quarter of 2007 and fell rapidly in the fourth quarter of 2008. Last year, house prices rose 10.6% in the metropolitan area while unemployment remained slightly above the national average of 7.9% at 8.1%. To a far lower degree than Las Vegas, Miami’s economy has a strong tourism component, but it also serves as a trading hub for Caribbean and Latin American nations. Neither tourism nor trade fared well during the economic downturn. Miami’s housing market suffered from overbuilding as well. Prices remained 50% below their peak through the middle of last year, and the city still has some ways to go to recover fully.
Also Read: American Cities With The Highest And Lowest Taxes
5. Minneapolis
> 1-yr. home price change: 12.2%
> Price drop through Q2 2012: 31.7%
> Median home price Q2 2012: $187,000
> Unemployment: 5.1%
Unemployment in Minneapolis hit a peak of “just” 7.9% in 2009, and the current rate is down to 5.1%, the lowest among these seven cities. House prices rose 12.2% in 2012, reaching a median of $187,000 in the second quarter of last year. Prices peaked in the first quarter of 2006 and had their biggest decline in the first quarter of 2009, around the same time as national unemployment was rapidly rising. Short sales have declined to around 10% in Minneapolis, and foreclosure sales are slightly less than a third of all sales.
4. Las Vegas
> 1-yr. home price change: 12.9%
> Price drop through Q2 2012: 60%
> Median home price Q2 2012: $147,000
> Unemployment: 10%
Las Vegas, like Phoenix, experienced a home building boom that peaked in the first quarter of 2006. Like Detroit, unemployment remains in double digits in the metropolitan area as the local tourism-based economy took a drubbing during the lean years of the Great Recession. Home prices fell 60% from their 2006 peak and have been hindered by the number of distressed properties on the market. Distressed sales comprised 73.6% of all home sales in January of 2012, and that percentage fell to 48.7% this past January.
3. Detroit
> 1-yr. home price change: 13.6%
> Price drop through Q2 2012: 53.6%
> Median home price Q2 2012: $45,000
> Unemployment: 10.2%
House prices rose 13.6% in Detroit in 2012, but the median price remains the lowest by far of any of the 20 cities in the Case-Shiller benchmark. One of just a handful of large U.S. cities where unemployment rates remain in double digits, the city has knocked more than 5% off its unemployment rate, but its current rate of around 10% is still higher than the worst periods in some of the other cities on this list. The biggest decline for home prices in Detroit occurred in the second quarter of 2009, with prices falling from a peak in the first quarter of 2006. Foreclosure sales have dropped from around 55% in January of 2012 to around 36% last month.
Also Read: The States With The Strongest and Weakest Unions
2. San Francisco
> 1-yr. home price change: 14.4%
> Price drop through Q2 2012: 22.3%
> Median home price Q2 2012: $717,000
> Unemployment: 7.3%
Home prices in San Francisco reached their peak in the first quarter of 2007, although the worst period of decline for the region did not occur until two years later. That does not mean home prices ever got cheap exactly, but they did decline more than 20%. Prices recovered 14.4% in 2012 alone, corresponding with a function of a 1.4 percentage point drop in unemployment. Unlike Phoenix, scarcity of inventory has long been a cause of the high prices here.
1. Phoenix
> 1-yr. home price change: 23%
> Price drop through Q2 2012: 49.8%
> Median home price Q2 2012: $164,000
> Unemployment: 6.7%
Phoenix house prices rose 23% in 2012, the best among any of the metropolitan areas in the Case-Shiller rankings. The unemployment rate in Phoenix reached an annual peak of 9.3% in 2009, the second lowest peak rate among these seven cities. The problem with housing in Phoenix was not unemployment so much as oversupply. As housing inventory has dwindled and mortgage rates have stayed low, housing prices have risen since 2009. Distressed sales (short sales and foreclosure sales) are lower in Phoenix than in any other city on this list. That is probably the biggest boost to home prices in the Valley of the Sun.
Sponsored: Attention Savvy Investors: Speak to 3 Financial Experts – FREE
Ever wanted an extra set of eyes on an investment you’re considering? Now you can speak with up to 3 financial experts in your area for FREE. By simply
clicking here you can begin to match with financial professionals who can help guide you through the financial decisions you’re making. And the best part? The first conversation with them is free.
Click here to match with up to 3 financial pros who would be excited to help you make financial decisions.
Thank you for reading! Have some feedback for us?
Contact the 24/7 Wall St. editorial team.


