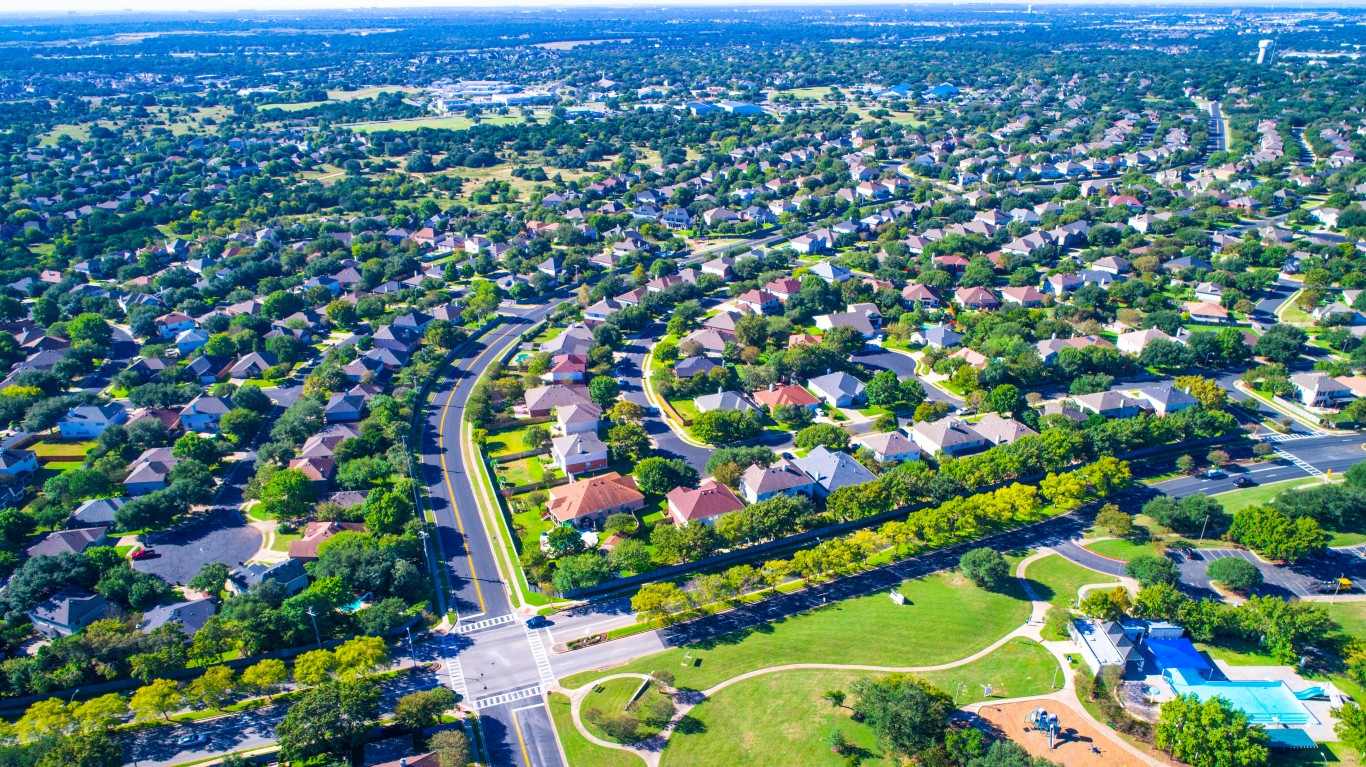
Across America, housing prices have escalated for a variety of reasons. Interestingly, one contributing factor to the rising market was the global pandemic, which allowed many individuals across the nation to work from home. These people were suddenly free to purchase homes outside the city where they worked, which had the effect of forcing prices to rise in areas that were previously considered affordable.
Housing across the country varies in terms of price-point and housing market, with some states being much more affordable than others. California is consistently ranked among the states with the priciest homes. Though most of the excessively costly real estate exists in cities like San Francisco and LA, the housing market remains high throughout the state. Another state that tops the list of soaring real estate prices is Hawaii. The island state joins the ranks due to its highly desirable gorgeous scenery and limited plots of land, in addition to its distance from the main 48. Despite the variation in housing costs across state lines, each state has its most expensive areas, alongside more affordable regions.
Among the cities on the list, the median listing price ranges from nearly $585,000 to over $1.7 million — well above the national median listing price of $415,500 in February. While the cities span the country, 13 are in California, including Los Angeles and San Francisco. Five cities in Washington state also made the list, as well as four in Montana, and three each in Hawaii, Colorado, Idaho, and Florida. Clearly, the West region is more represented. However, Boston and New York City are also on the list.
24/7 Wall St. wanted to find the most expensive housing markets in the country. To get our data, we reviewed the real estate listing website Realtor.com’s monthly inventory metro data. While Realtor.com has over 920 markets, we only considered cities with a population of 25,000 or more. Here we listed the 50 cities where homes had the highest median listing prices in February 2024. The median listing price in February 2023 and the median listing price per square foot also came from Realtor.com. From the Census Bureau’s American Community Survey five-year estimates for 2022, we added median household income, the percentage of households earning more than $200,000 a year, and population.
Why This Matters
There are a number of reasons why a city may have higher than average real estate costs ranging from limited land, higher cost of living, and access to amenities such as nearby shopping, high-quality schools, convenient transportation, and plenty of parks. However, these perks will cost you. If you are planning a move to one of these expensive cities, it’s good to be aware of the higher real estate prices.
50. Helena, Montana

- Median listing price, Feb 2024: $584,950 (+1.0% from Feb 2023)
- Median listing price, Feb 2023: $579,450 — #48 highest of 464 markets
- Median listing price per sq ft, Feb 2024: $291 — #59 highest of 464 markets
- Median households income, 2022: $64,798 — #247 highest of 464 markets
- Pct households making over $200,000: 7.7% (compared to 11.4% nationwide)
- Population, 2022: 32,529
49. Bremerton-Silverdale-Port Orchard, Washington

- Median listing price, Feb 2024: $588,598 (+6.1% from Feb 2023)
- Median listing price, Feb 2023: $555,000 — #57 highest of 464 markets
- Median listing price per sq ft, Feb 2024: $289 — #62 highest of 464 markets
- Median households income, 2022: $93,675 — #22 highest of 464 markets
- Pct households making over $200,000: 13.6% (compared to 11.4% nationwide)
- Population, 2022: 275,411
48. Boise City, Idaho

- Median listing price, Feb 2024: $589,900 (+6.8% from Feb 2023)
- Median listing price, Feb 2023: $552,495 — #59 highest of 464 markets
- Median listing price per sq ft, Feb 2024: $285 — #65 highest of 464 markets
- Median households income, 2022: $78,138 — #89 highest of 464 markets
- Pct households making over $200,000: 9.4% (compared to 11.4% nationwide)
- Population, 2022: 771,602
47. Corvallis, Oregon
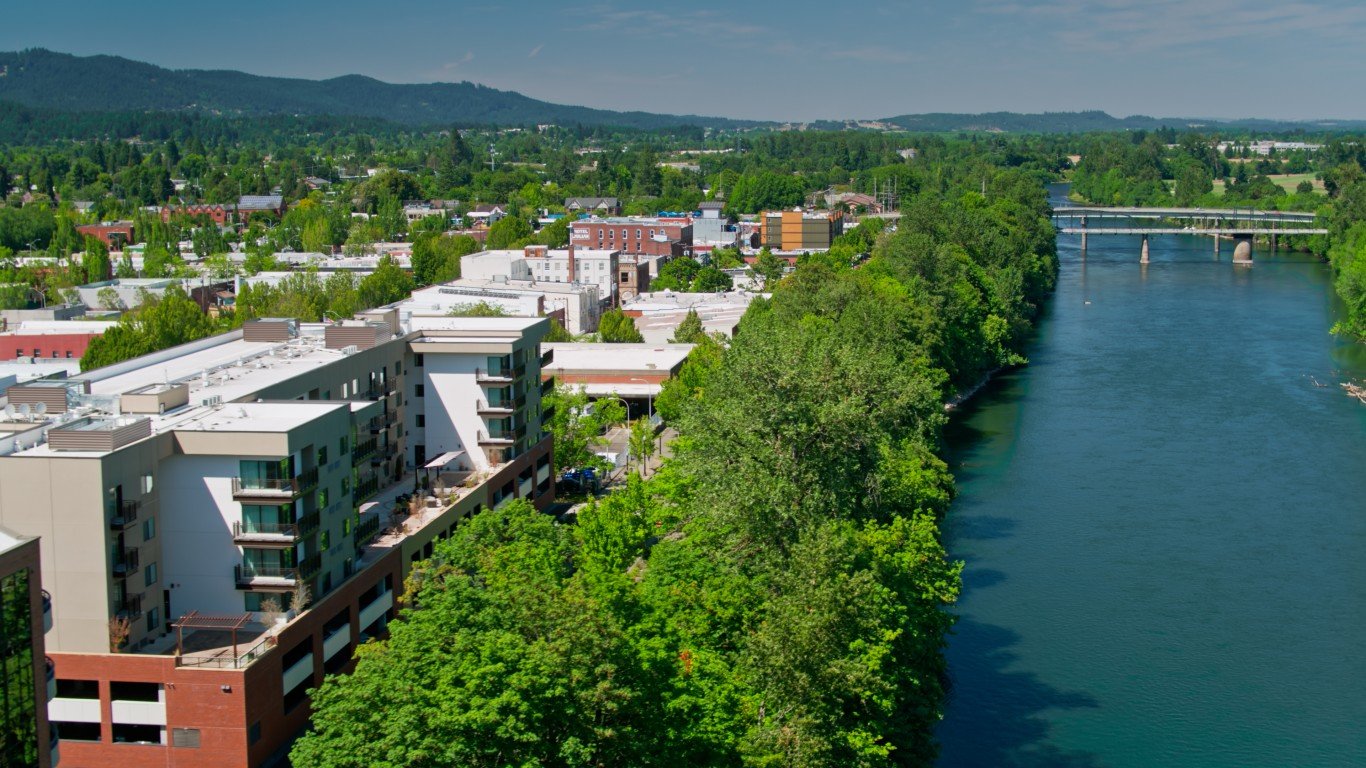
- Median listing price, Feb 2024: $591,728 (+4.7% from Feb 2023)
- Median listing price, Feb 2023: $565,001 — #52 highest of 464 markets
- Median listing price per sq ft, Feb 2024: $298 — #56 highest of 464 markets
- Median households income, 2022: $72,882 — #133 highest of 464 markets
- Pct households making over $200,000: 10.2% (compared to 11.4% nationwide)
- Population, 2022: 95,615
46. Riverside-San Bernardino-Ontario, California
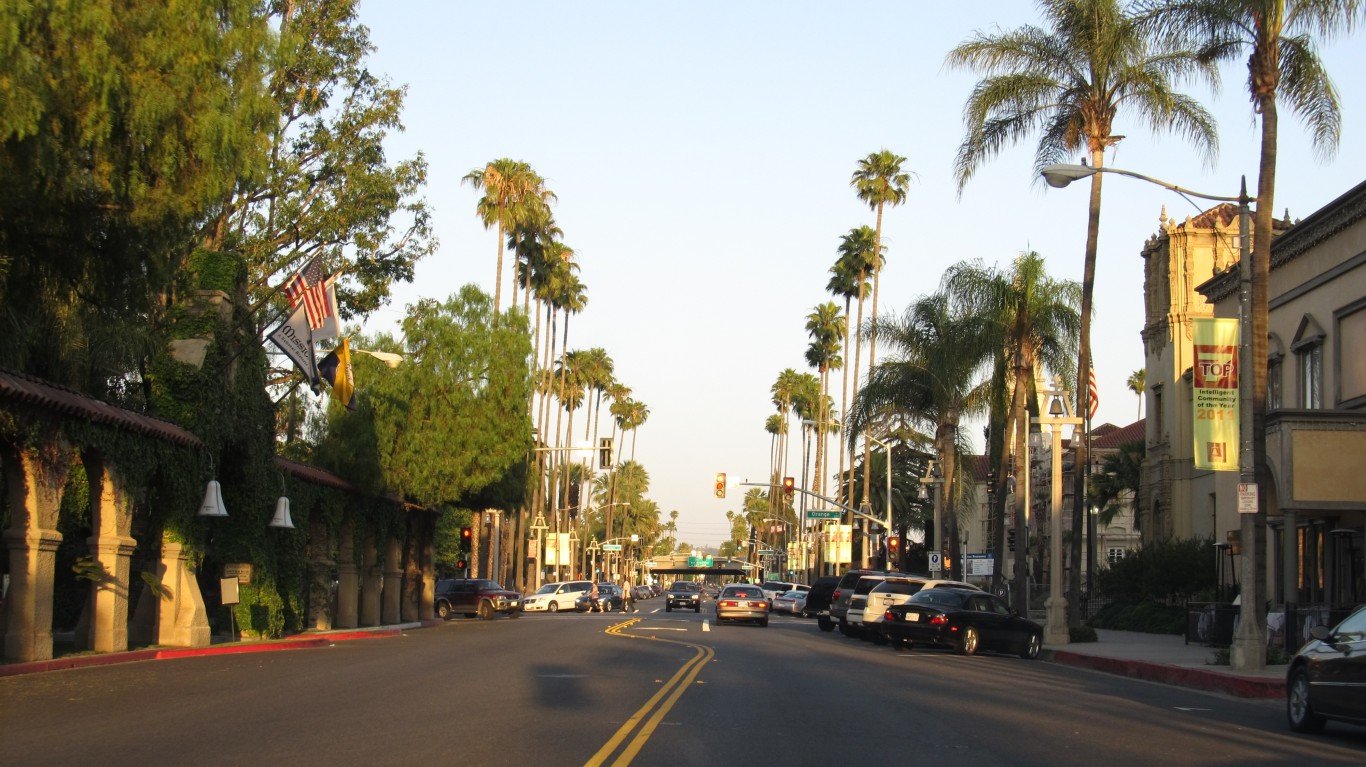
- Median listing price, Feb 2024: $595,000 (+6.3% from Feb 2023)
- Median listing price, Feb 2023: $559,900 — #55 highest of 464 markets
- Median listing price per sq ft, Feb 2024: $339 — #40 highest of 464 markets
- Median households income, 2022: $81,041 — #72 highest of 464 markets
- Pct households making over $200,000: 11.0% (compared to 11.4% nationwide)
- Population, 2022: 4,610,050
45. Washington-Arlington-Alexandria, DC-VA-MD-WV

- Median listing price, Feb 2024: $599,000 (+2.5% from Feb 2023)
- Median listing price, Feb 2023: $584,681 — #46 highest of 464 markets
- Median listing price per sq ft, Feb 2024: $318 — #46 highest of 464 markets
- Median households income, 2022: $119,803 — #3 highest of 464 markets
- Pct households making over $200,000: 25.4% (compared to 11.4% nationwide)
- Population, 2022: 6,346,083
44. Torrington, Connecticut
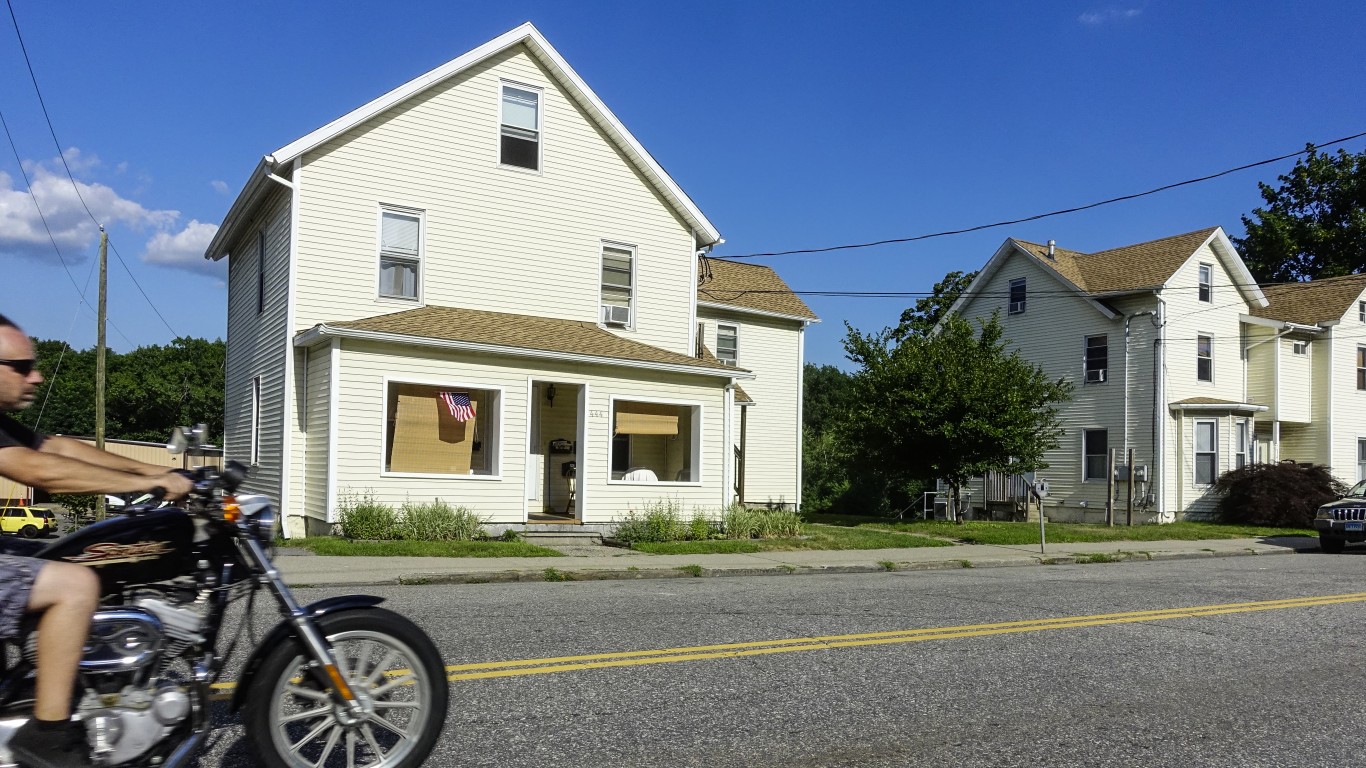
- Median listing price, Feb 2024: $599,975 (+0.3% from Feb 2023)
- Median listing price, Feb 2023: $598,500 — #44 highest of 464 markets
- Median listing price per sq ft, Feb 2024: $265 — #83 highest of 464 markets
- Median households income, 2022: $66,616 — #226 highest of 464 markets
- Pct households making over $200,000: 5.2% (compared to 11.4% nationwide)
- Population, 2022: 35,510
43. Portland-Vancouver-Hillsboro, OR-WA
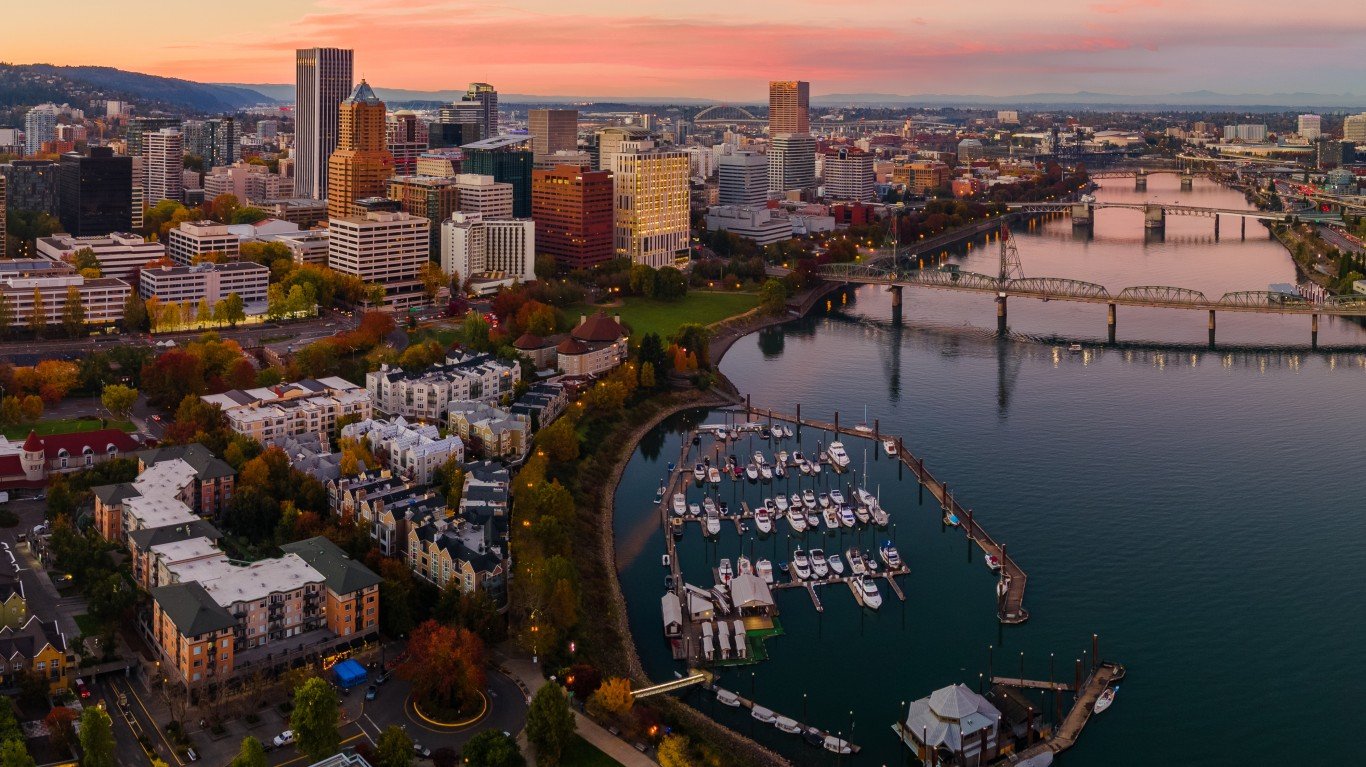
- Median listing price, Feb 2024: $600,000 (-1.2% from Feb 2023)
- Median listing price, Feb 2023: $607,050 — #37 highest of 464 markets
- Median listing price per sq ft, Feb 2024: $321 — #45 highest of 464 markets
- Median households income, 2022: $90,451 — #33 highest of 464 markets
- Pct households making over $200,000: 14.1% (compared to 11.4% nationwide)
- Population, 2022: 2,505,312
42. Moscow, Idaho
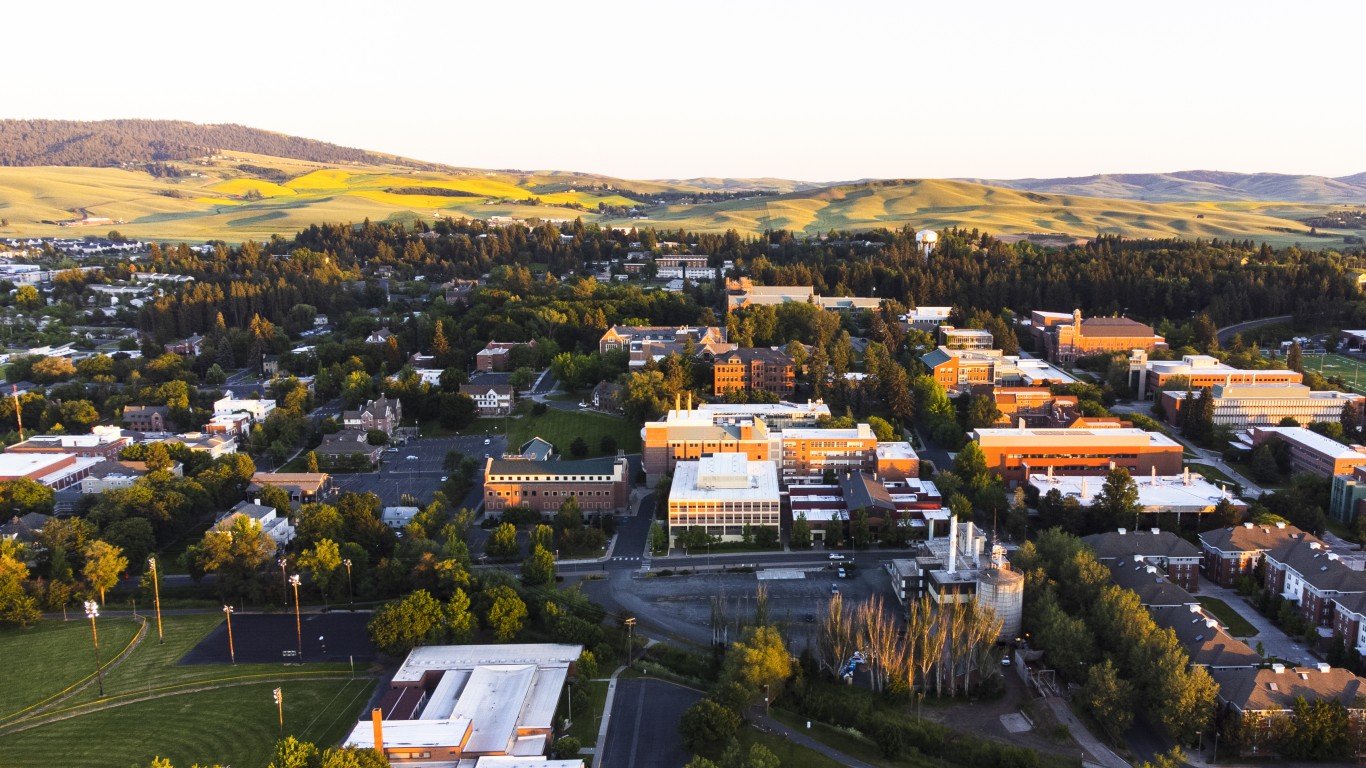
- Median listing price, Feb 2024: $601,500 (+20.4% from Feb 2023)
- Median listing price, Feb 2023: $499,750 — #75 highest of 464 markets
- Median listing price per sq ft, Feb 2024: $271 — #77 highest of 464 markets
- Median households income, 2022: $53,679 — #405 highest of 464 markets
- Pct households making over $200,000: 4.1% (compared to 11.4% nationwide)
- Population, 2022: 25,616
41. Portland-South Portland, Maine

- Median listing price, Feb 2024: $604,900 (+2.5% from Feb 2023)
- Median listing price, Feb 2023: $590,000 — #45 highest of 464 markets
- Median listing price per sq ft, Feb 2024: $363 — #32 highest of 464 markets
- Median households income, 2022: $84,095 — #53 highest of 464 markets
- Pct households making over $200,000: 11.0% (compared to 11.4% nationwide)
- Population, 2022: 552,916
40. Denver-Aurora-Lakewood, Colorado
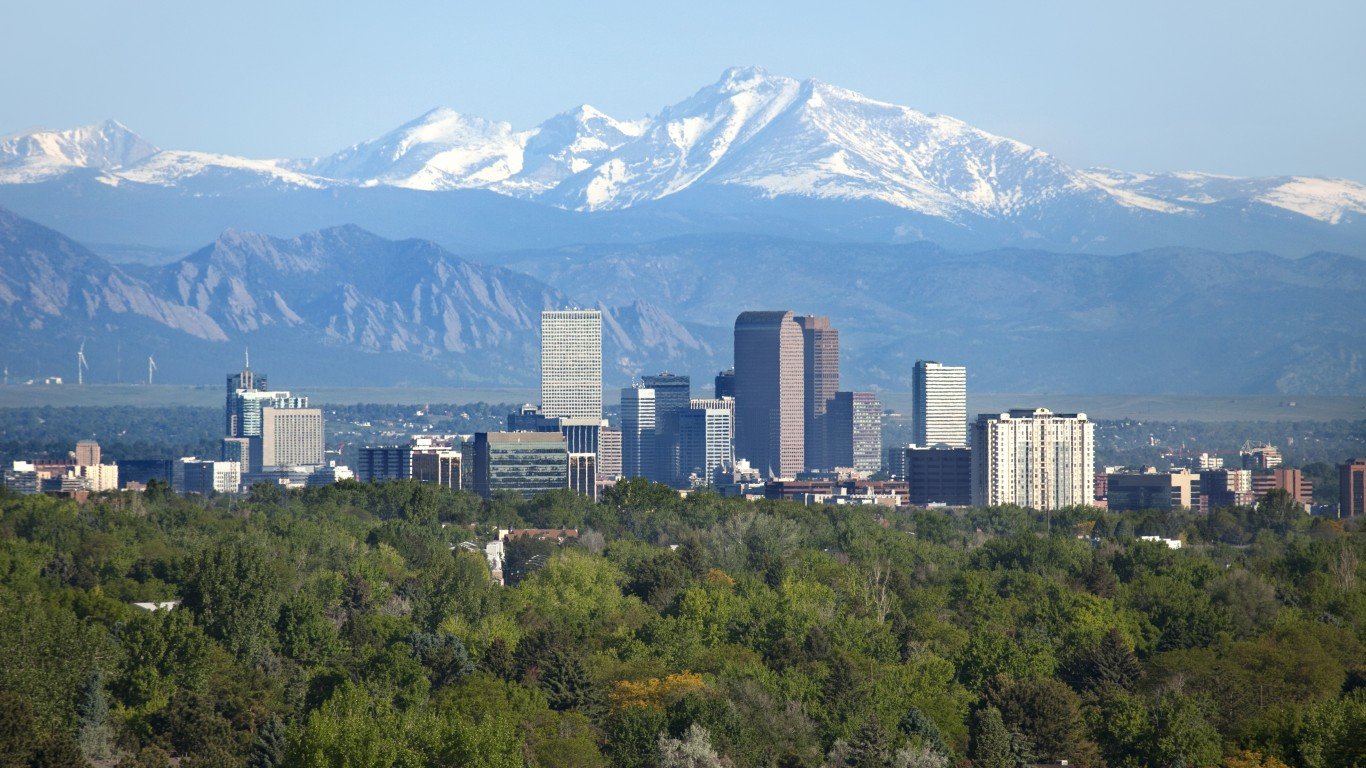
- Median listing price, Feb 2024: $609,625 (-3.6% from Feb 2023)
- Median listing price, Feb 2023: $632,475 — #34 highest of 464 markets
- Median listing price per sq ft, Feb 2024: $310 — #48 highest of 464 markets
- Median households income, 2022: $96,920 — #16 highest of 464 markets
- Pct households making over $200,000: 16.5% (compared to 11.4% nationwide)
- Population, 2022: 2,959,386
39. Fort Collins, Colorado
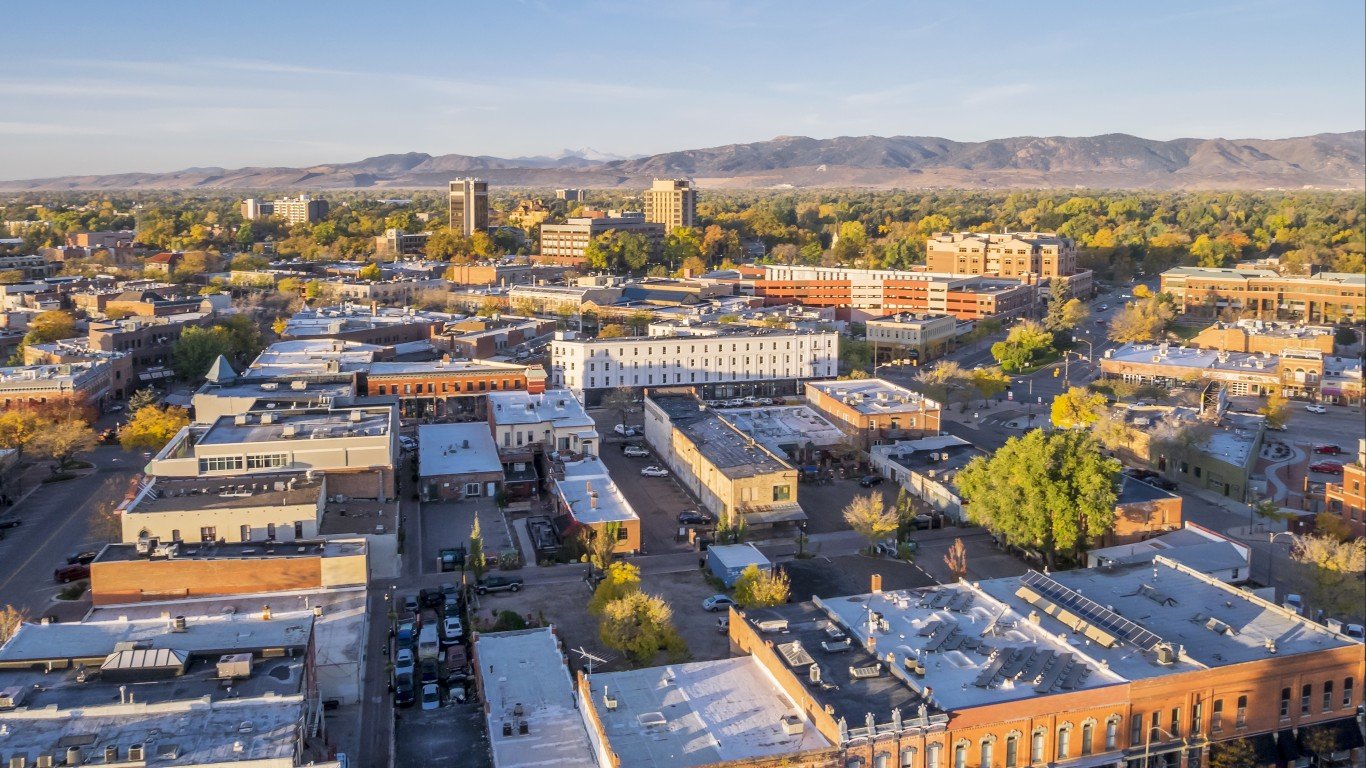
- Median listing price, Feb 2024: $618,985 (+6.0% from Feb 2023)
- Median listing price, Feb 2023: $583,906 — #47 highest of 464 markets
- Median listing price per sq ft, Feb 2024: $279 — #69 highest of 464 markets
- Median households income, 2022: $87,199 — #44 highest of 464 markets
- Pct households making over $200,000: 13.0% (compared to 11.4% nationwide)
- Population, 2022: 359,363
38. Sacramento-Roseville-Folsom, California

- Median listing price, Feb 2024: $633,034 (+4.4% from Feb 2023)
- Median listing price, Feb 2023: $606,442 — #38 highest of 464 markets
- Median listing price per sq ft, Feb 2024: $348 — #37 highest of 464 markets
- Median households income, 2022: $89,227 — #40 highest of 464 markets
- Pct households making over $200,000: 14.9% (compared to 11.4% nationwide)
- Population, 2022: 2,394,673
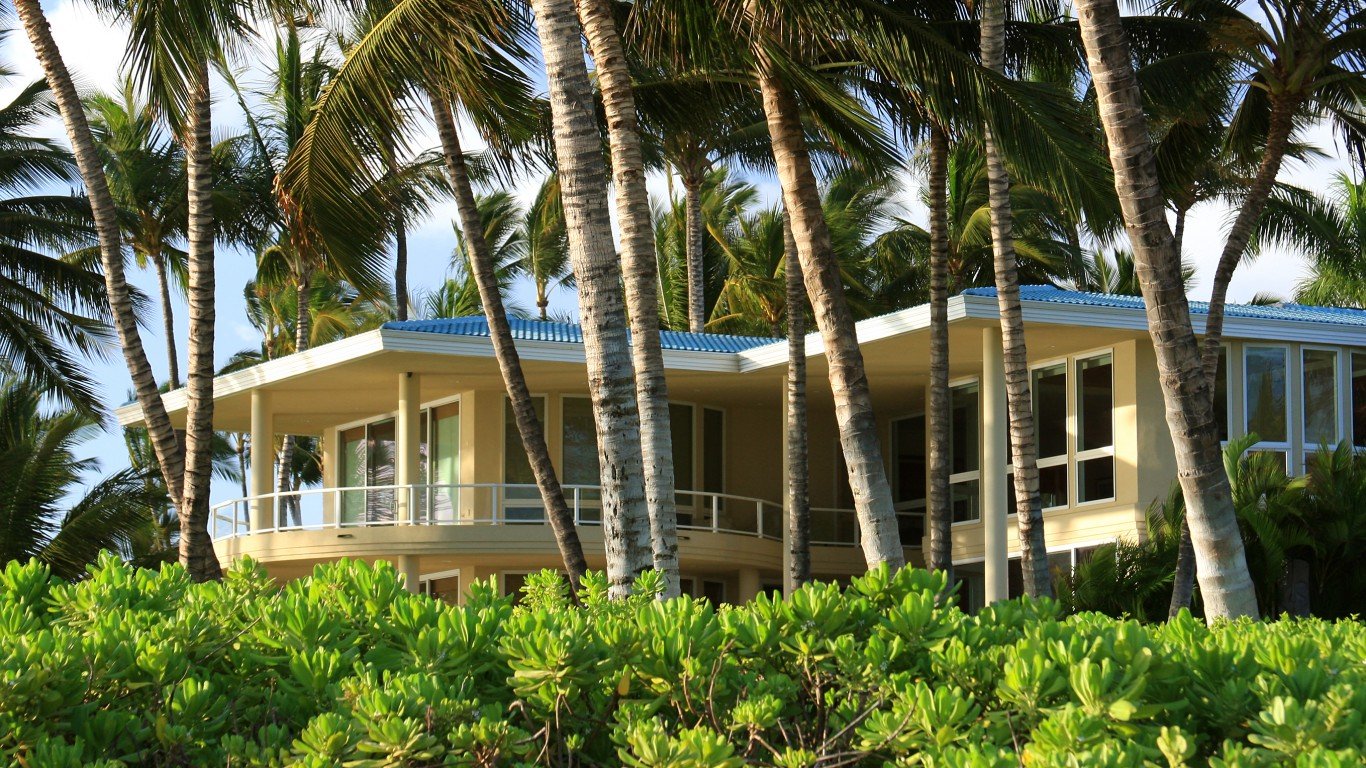
37. Hilo, Hawaii
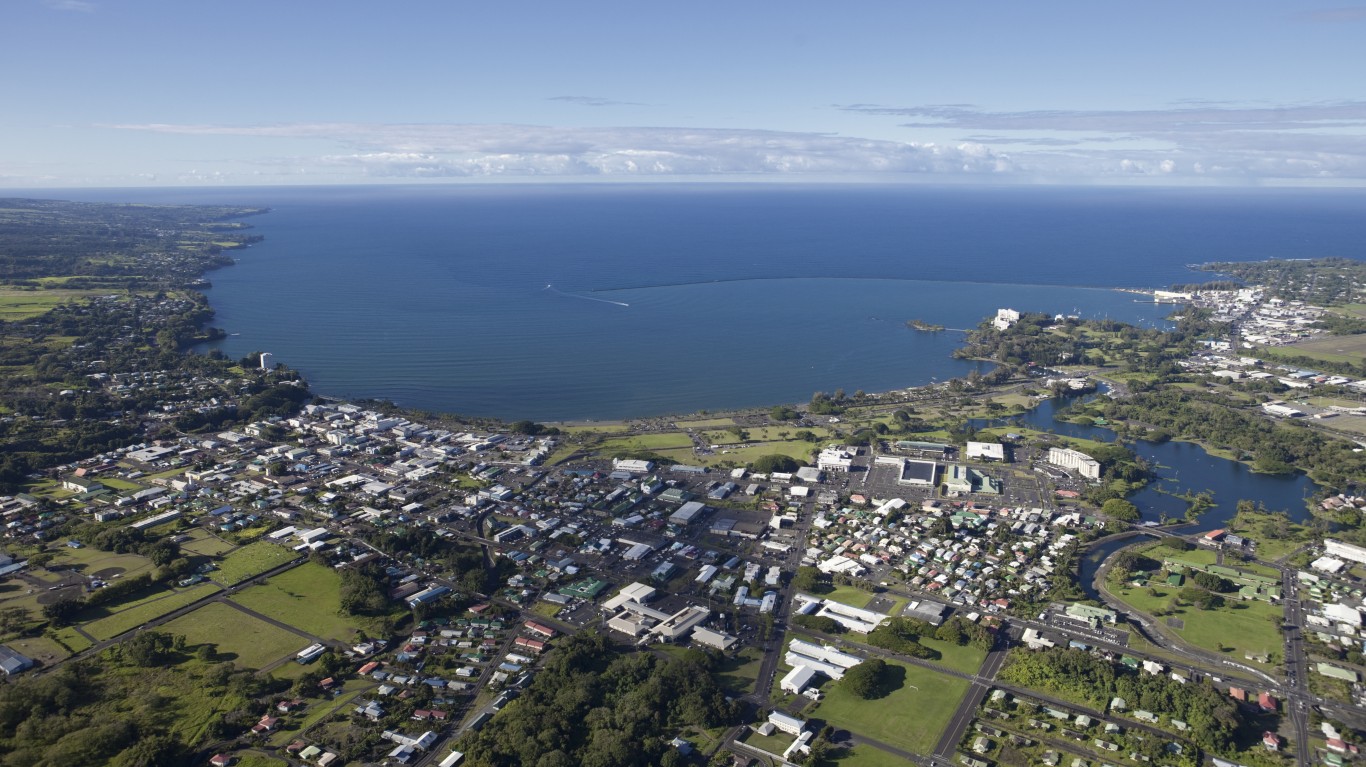
- Median listing price, Feb 2024: $633,250 (+5.7% from Feb 2023)
- Median listing price, Feb 2023: $599,250 — #40 highest of 464 markets
- Median listing price per sq ft, Feb 2024: $492 — #20 highest of 464 markets
- Median households income, 2022: $75,589 — #107 highest of 464 markets
- Pct households making over $200,000: 9.3% (compared to 11.4% nationwide)
- Population, 2022: 47,627
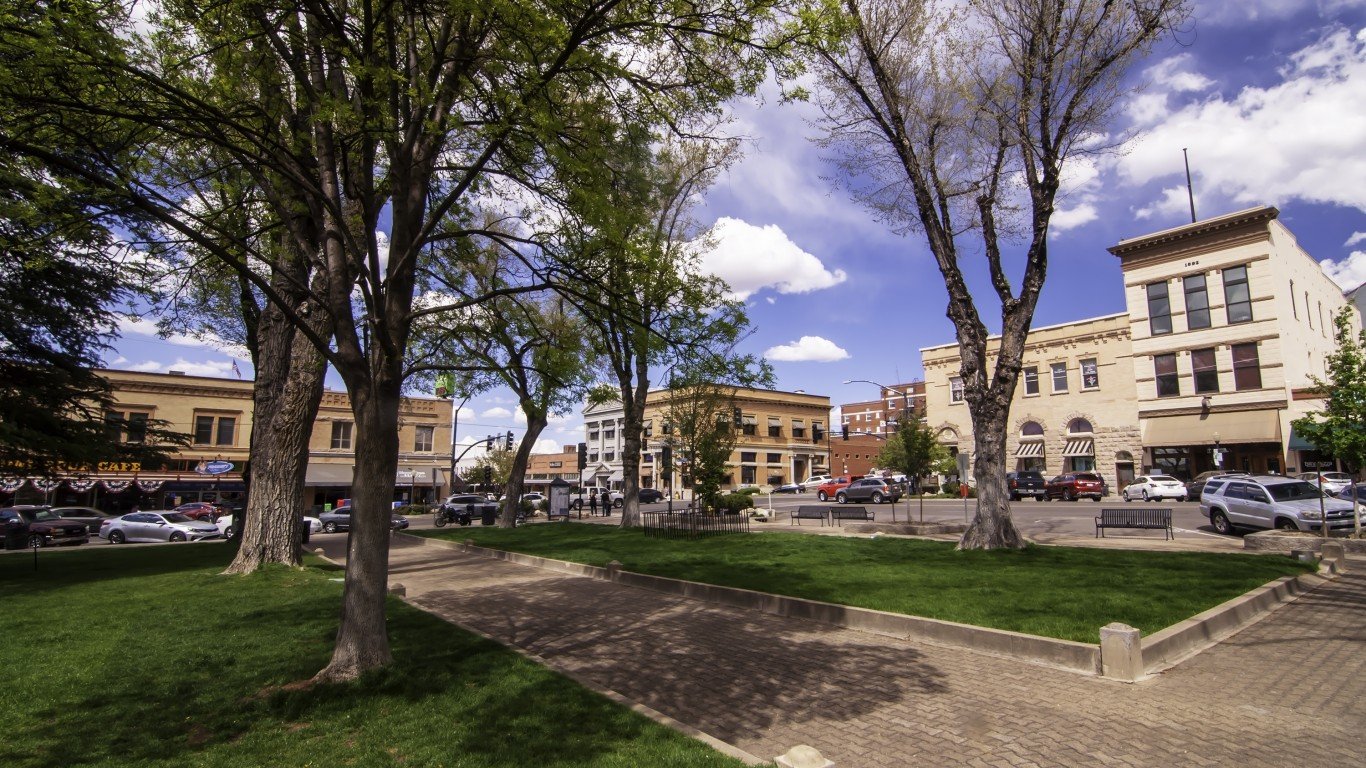
36. Wenatchee, Washington
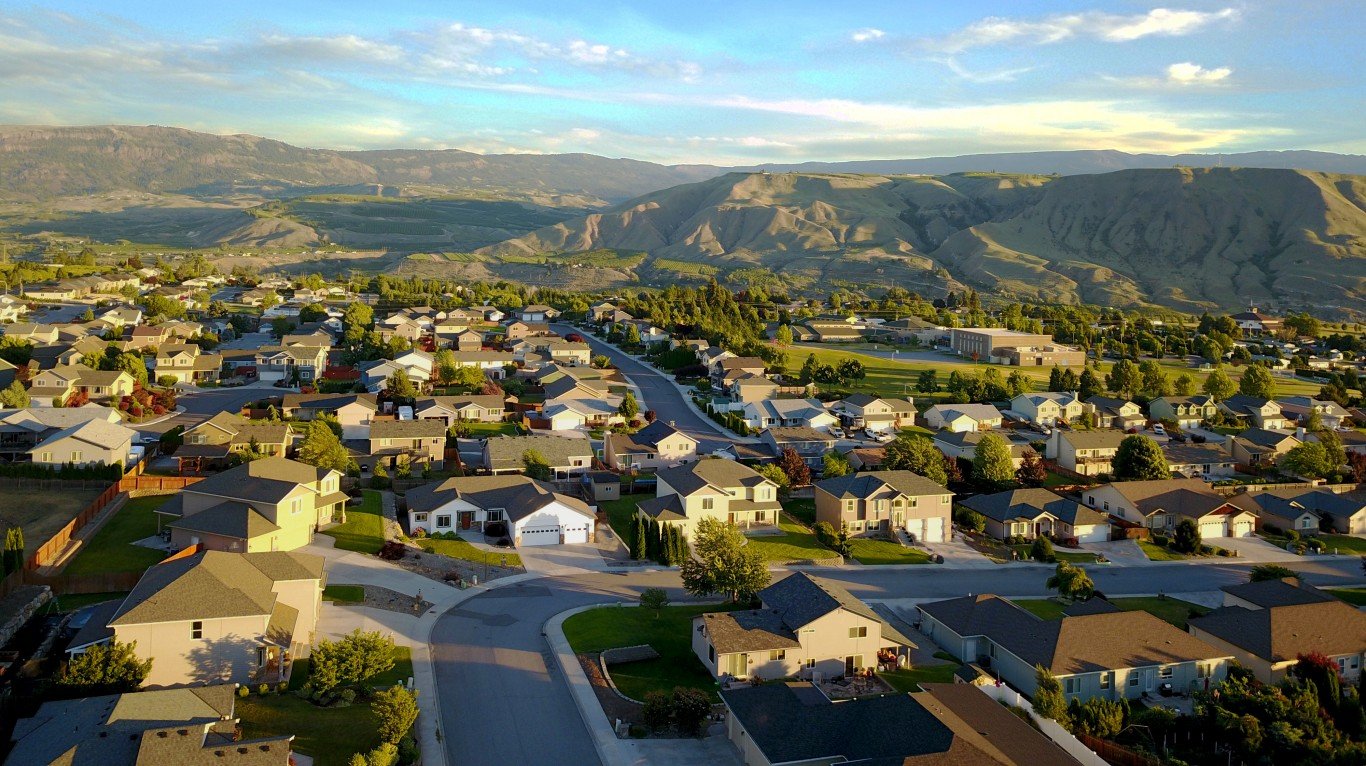
- Median listing price, Feb 2024: $641,100 (-5.0% from Feb 2023)
- Median listing price, Feb 2023: $674,998 — #29 highest of 464 markets
- Median listing price per sq ft, Feb 2024: $335 — #41 highest of 464 markets
- Median households income, 2022: $75,185 — #112 highest of 464 markets
- Pct households making over $200,000: 9.3% (compared to 11.4% nationwide)
- Population, 2022: 122,265
35. Crestview-Fort Walton Beach-Destin, Florida

- Median listing price, Feb 2024: $642,350 (+1.6% from Feb 2023)
- Median listing price, Feb 2023: $632,200 — #35 highest of 464 markets
- Median listing price per sq ft, Feb 2024: $468 — #22 highest of 464 markets
- Median households income, 2022: $74,279 — #116 highest of 464 markets
- Pct households making over $200,000: 9.6% (compared to 11.4% nationwide)
- Population, 2022: 288,639
34. Prescott Valley-Prescott, Arizona
- Median listing price, Feb 2024: $647,100 (+2.3% from Feb 2023)
- Median listing price, Feb 2023: $632,483 — #33 highest of 464 markets
- Median listing price per sq ft, Feb 2024: $324 — #44 highest of 464 markets
- Median households income, 2022: $62,430 — #286 highest of 464 markets
- Pct households making over $200,000: 6.1% (compared to 11.4% nationwide)
- Population, 2022: 237,830
33. Reno, Nevada

- Median listing price, Feb 2024: $652,000 (+3.5% from Feb 2023)
- Median listing price, Feb 2023: $630,000 — #36 highest of 464 markets
- Median listing price per sq ft, Feb 2024: $326 — #43 highest of 464 markets
- Median households income, 2022: $81,576 — #67 highest of 464 markets
- Pct households making over $200,000: 10.9% (compared to 11.4% nationwide)
- Population, 2022: 490,769
32. Mount Vernon-Anacortes, Washington
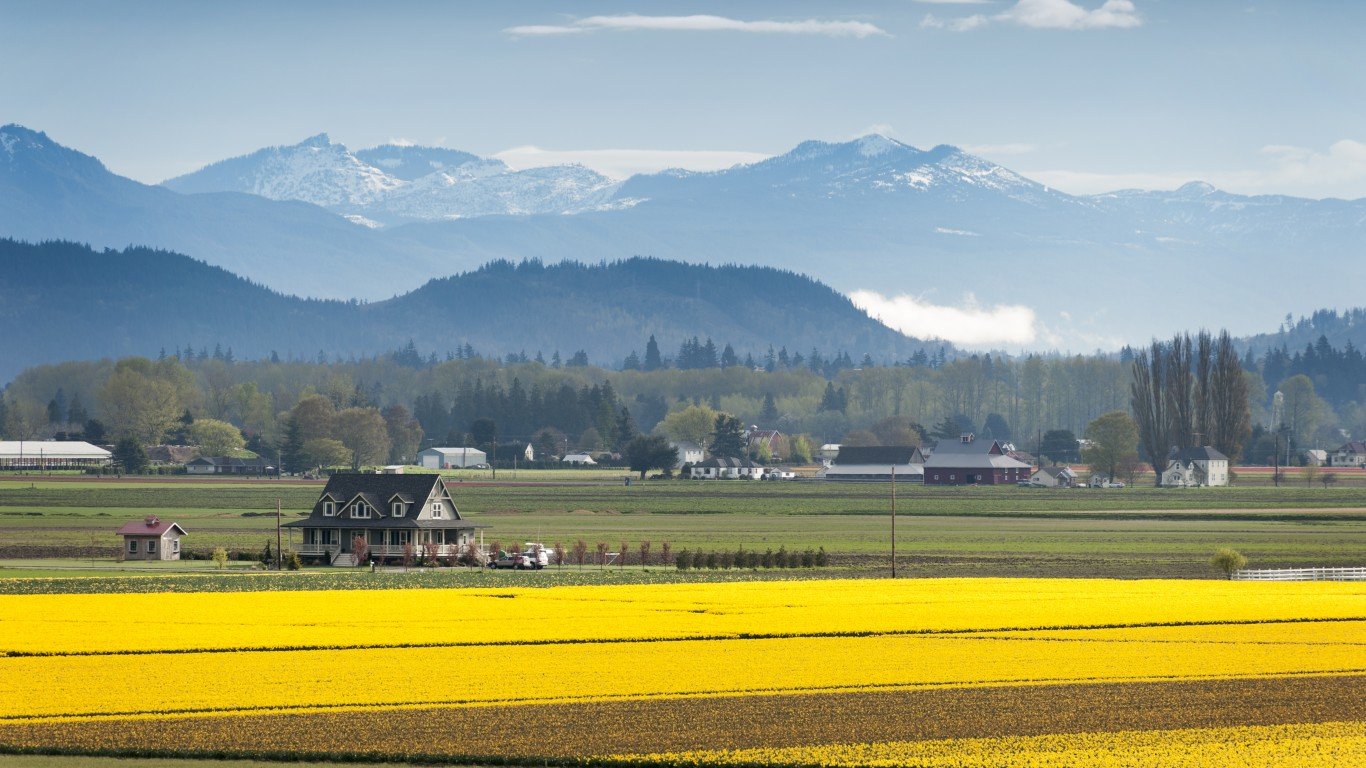
- Median listing price, Feb 2024: $669,963 (+10.9% from Feb 2023)
- Median listing price, Feb 2023: $604,325 — #39 highest of 464 markets
- Median listing price per sq ft, Feb 2024: $359 — #33 highest of 464 markets
- Median households income, 2022: $82,029 — #63 highest of 464 markets
- Pct households making over $200,000: 9.4% (compared to 11.4% nationwide)
- Population, 2022: 129,480
31. Coeur d’Alene, Idaho
- Median listing price, Feb 2024: $672,469 (-6.0% from Feb 2023)
- Median listing price, Feb 2023: $715,219 — #27 highest of 464 markets
- Median listing price per sq ft, Feb 2024: $341 — #39 highest of 464 markets
- Median households income, 2022: $71,949 — #145 highest of 464 markets
- Pct households making over $200,000: 6.5% (compared to 11.4% nationwide)
- Population, 2022: 173,396
30. Bend, Oregon
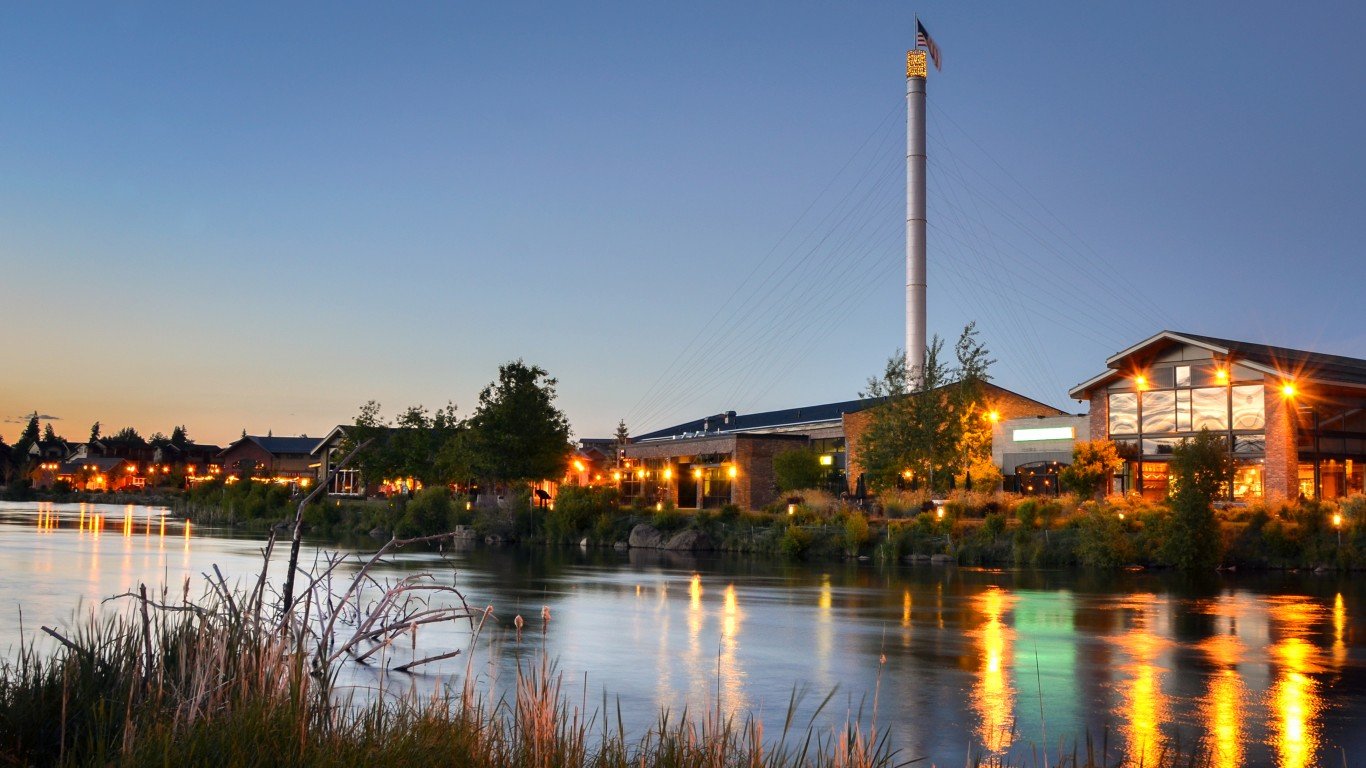
- Median listing price, Feb 2024: $691,270 (+4.8% from Feb 2023)
- Median listing price, Feb 2023: $659,425 — #30 highest of 464 markets
- Median listing price per sq ft, Feb 2024: $377 — #29 highest of 464 markets
- Median households income, 2022: $82,042 — #62 highest of 464 markets
- Pct households making over $200,000: 12.4% (compared to 11.4% nationwide)
- Population, 2022: 199,352
29. St. George, Utah
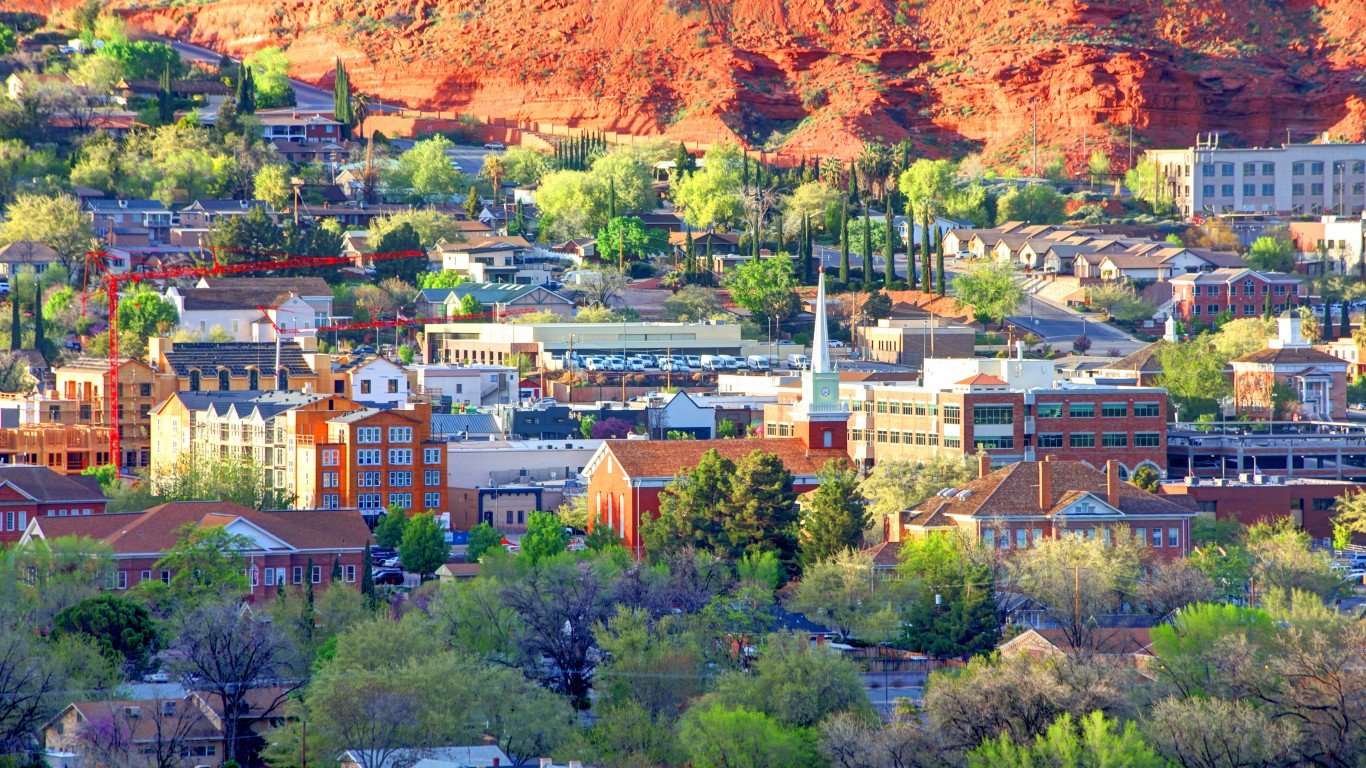
- Median listing price, Feb 2024: $696,073 (+5.6% from Feb 2023)
- Median listing price, Feb 2023: $659,000 — #31 highest of 464 markets
- Median listing price per sq ft, Feb 2024: $303 — #50 highest of 464 markets
- Median households income, 2022: $71,976 — #144 highest of 464 markets
- Pct households making over $200,000: 8.1% (compared to 11.4% nationwide)
- Population, 2022: 183,297
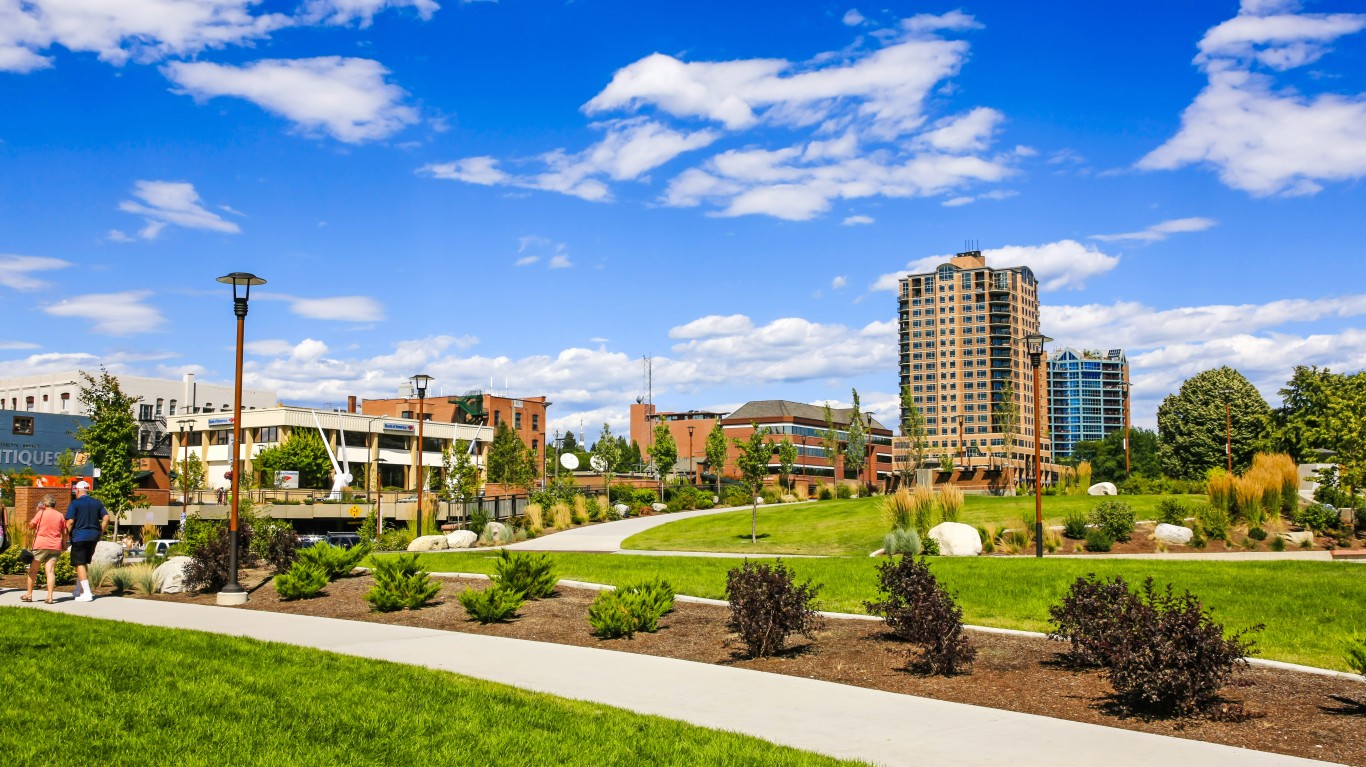
28. Bellingham, Washington
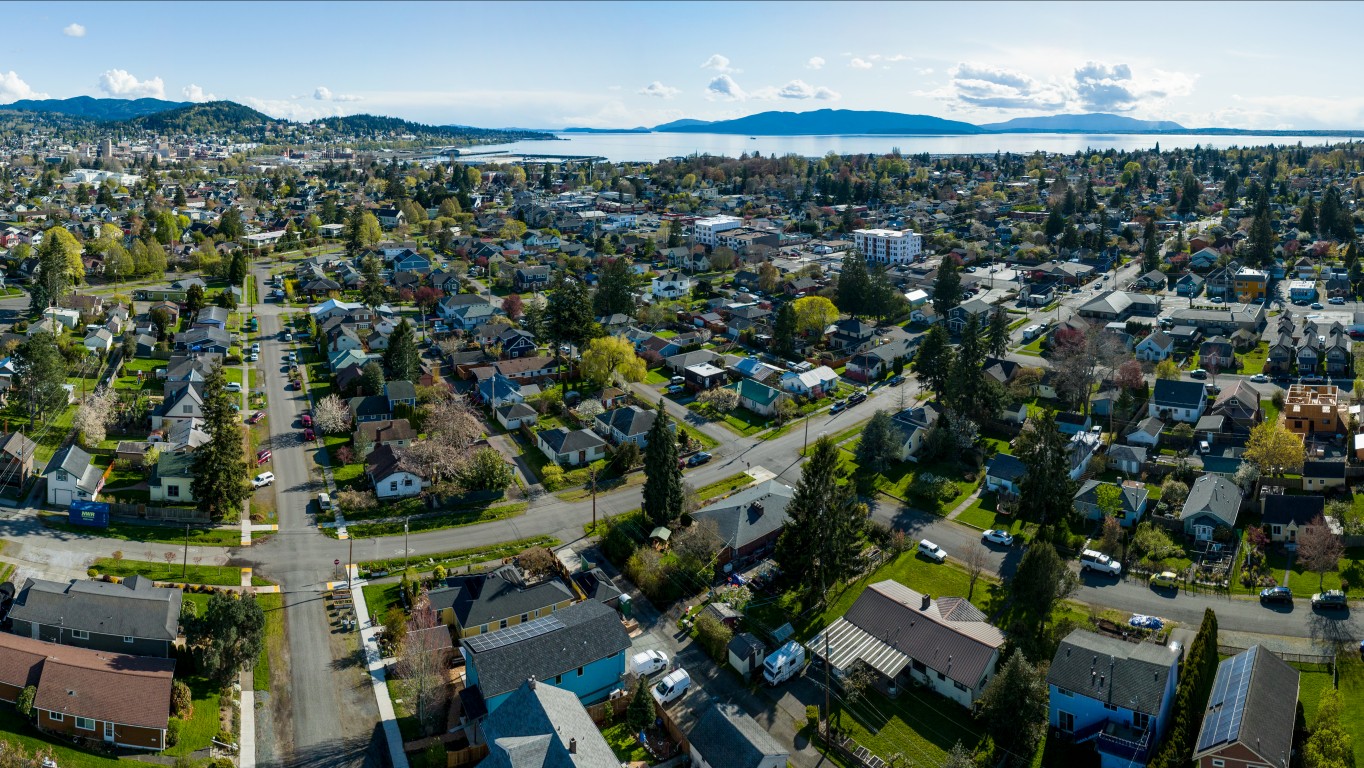
- Median listing price, Feb 2024: $697,475 (+16.4% from Feb 2023)
- Median listing price, Feb 2023: $599,000 — #41 highest of 464 markets
- Median listing price per sq ft, Feb 2024: $371 — #30 highest of 464 markets
- Median households income, 2022: $77,581 — #92 highest of 464 markets
- Pct households making over $200,000: 8.8% (compared to 11.4% nationwide)
- Population, 2022: 226,523
27. Missoula, Montana
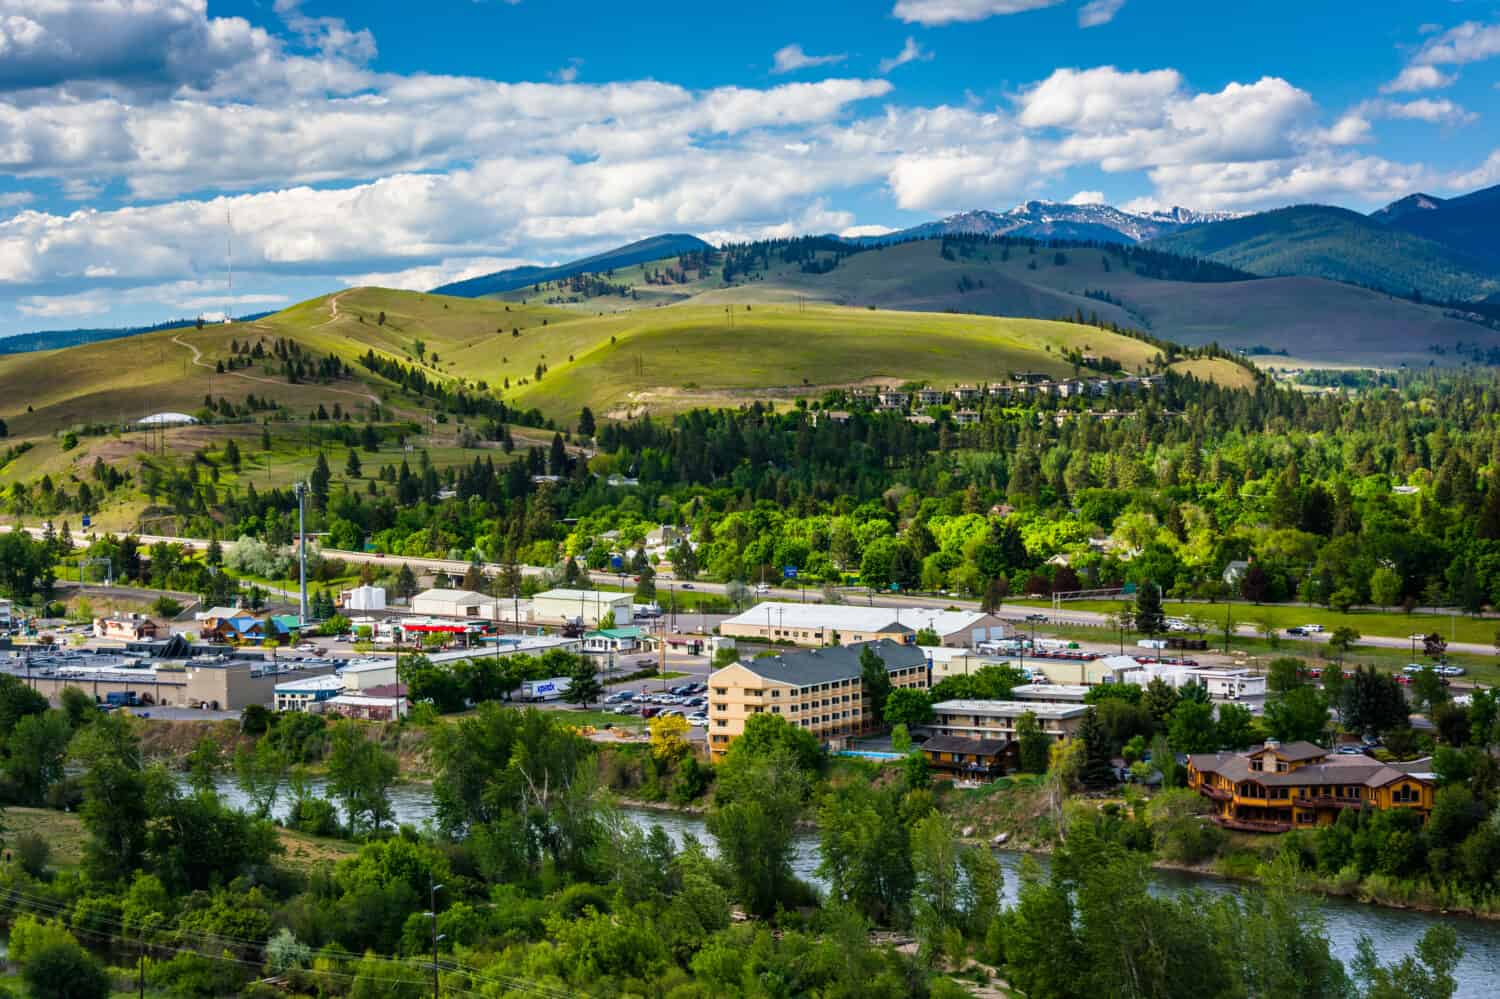
- Median listing price, Feb 2024: $711,238 (-5.1% from Feb 2023)
- Median listing price, Feb 2023: $749,250 — #24 highest of 464 markets
- Median listing price per sq ft, Feb 2024: $364 — #31 highest of 464 markets
- Median households income, 2022: $66,840 — #217 highest of 464 markets
- Pct households making over $200,000: 7.8% (compared to 11.4% nationwide)
- Population, 2022: 118,541
26. Flagstaff, Arizona
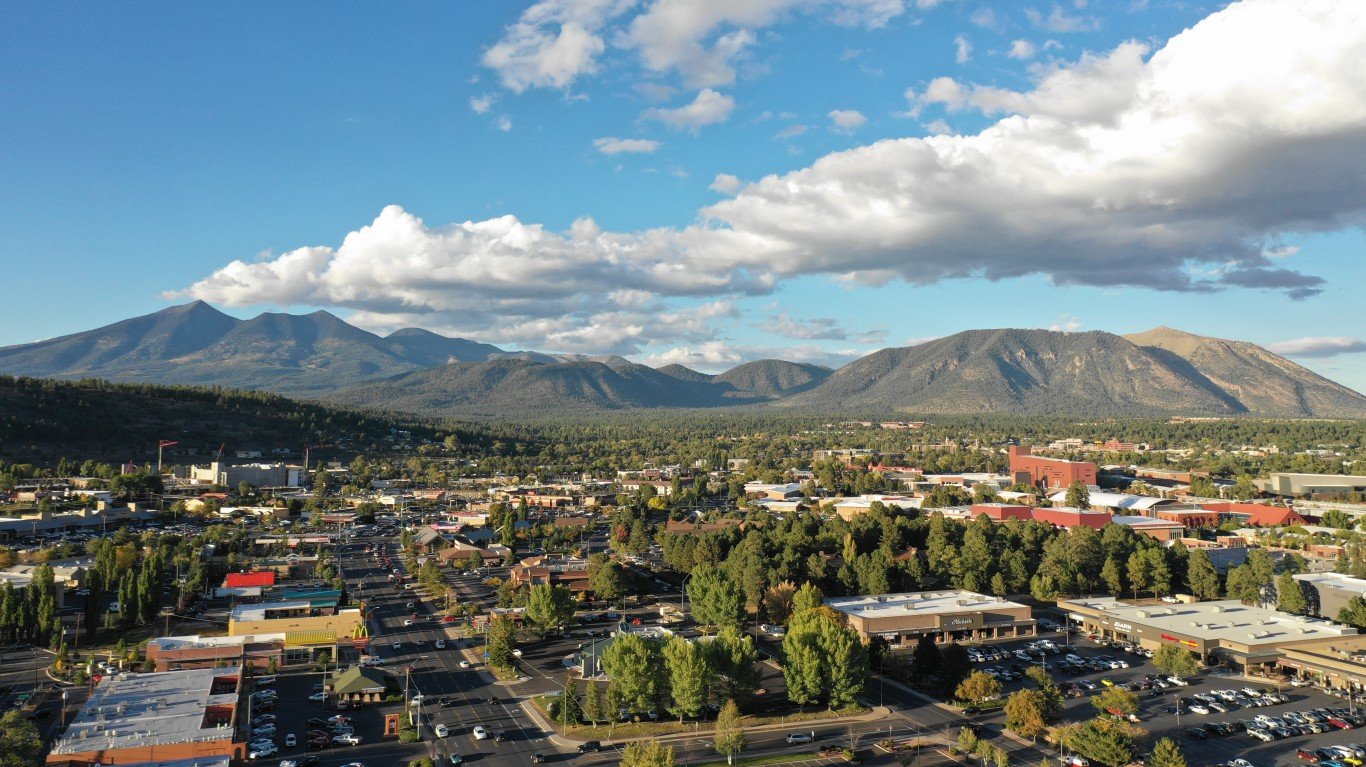
- Median listing price, Feb 2024: $741,200 (+0.4% from Feb 2023)
- Median listing price, Feb 2023: $738,250 — #26 highest of 464 markets
- Median listing price per sq ft, Feb 2024: $397 — #26 highest of 464 markets
- Median households income, 2022: $67,266 — #211 highest of 464 markets
- Pct households making over $200,000: 8.2% (compared to 11.4% nationwide)
- Population, 2022: 144,705
25. New York-Newark-Jersey City, NY-NJ-PA

- Median listing price, Feb 2024: $749,500 (+10.2% from Feb 2023)
- Median listing price, Feb 2023: $679,950 — #28 highest of 464 markets
- Median listing price per sq ft, Feb 2024: $549 — #16 highest of 464 markets
- Median households income, 2022: $93,610 — #23 highest of 464 markets
- Pct households making over $200,000: 19.8% (compared to 11.4% nationwide)
- Population, 2022: 19,908,595
24. Seattle-Tacoma-Bellevue, Washington

- Median listing price, Feb 2024: $765,000 (+2.0% from Feb 2023)
- Median listing price, Feb 2023: $749,950 — #23 highest of 464 markets
- Median listing price per sq ft, Feb 2024: $439 — #24 highest of 464 markets
- Median households income, 2022: $107,206 — #6 highest of 464 markets
- Pct households making over $200,000: 21.2% (compared to 11.4% nationwide)
- Population, 2022: 4,001,701
23. Urban Honolulu, Hawaii

- Median listing price, Feb 2024: $789,750 (+1.1% from Feb 2023)
- Median listing price, Feb 2023: $781,250 — #22 highest of 464 markets
- Median listing price per sq ft, Feb 2024: $673 — #9 highest of 464 markets
- Median households income, 2022: $99,816 — #11 highest of 464 markets
- Pct households making over $200,000: 17.3% (compared to 11.4% nationwide)
- Population, 2022: 1,010,100
22. Santa Fe, New Mexico
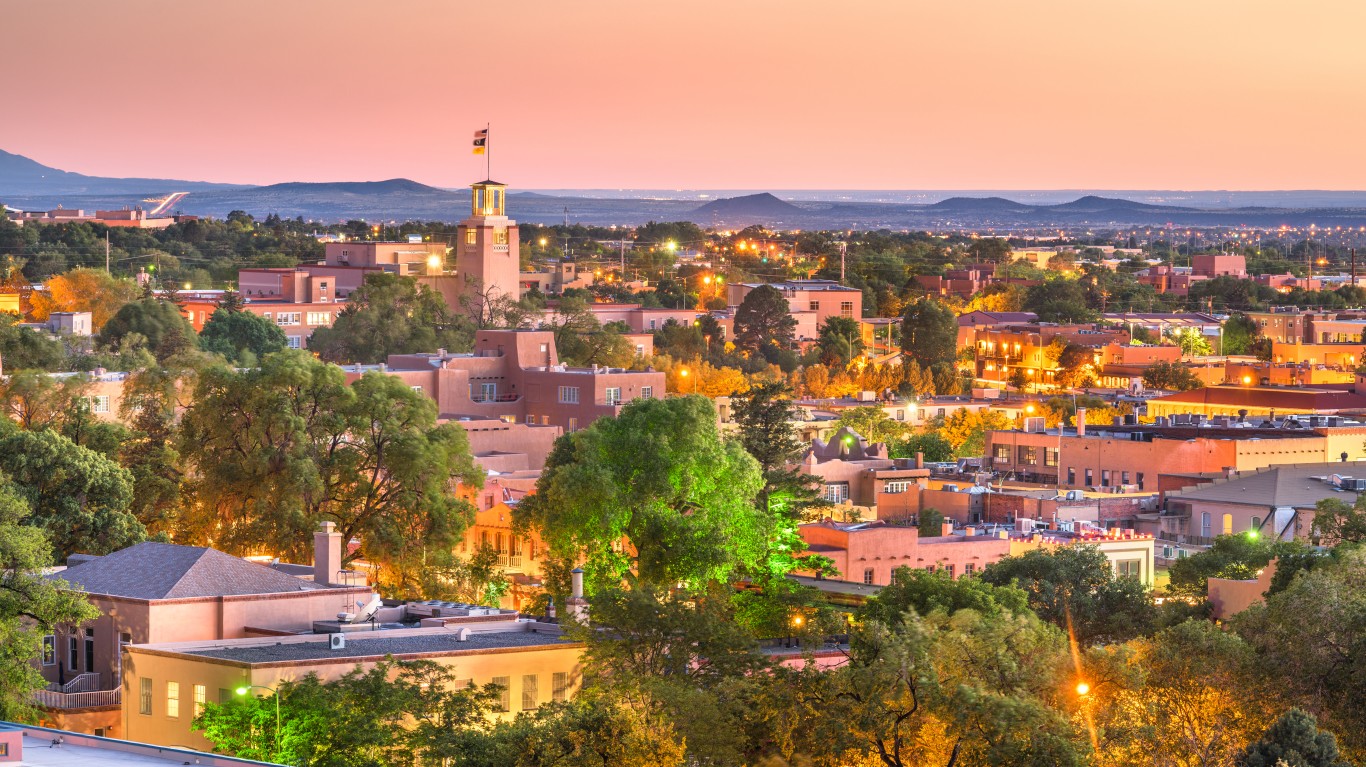
- Median listing price, Feb 2024: $799,450 (+8.0% from Feb 2023)
- Median listing price, Feb 2023: $739,975 — #25 highest of 464 markets
- Median listing price per sq ft, Feb 2024: $381 — #28 highest of 464 markets
- Median households income, 2022: $70,522 — #162 highest of 464 markets
- Pct households making over $200,000: 10.0% (compared to 11.4% nationwide)
- Population, 2022: 154,481
21. Naples-Marco Island, Florida
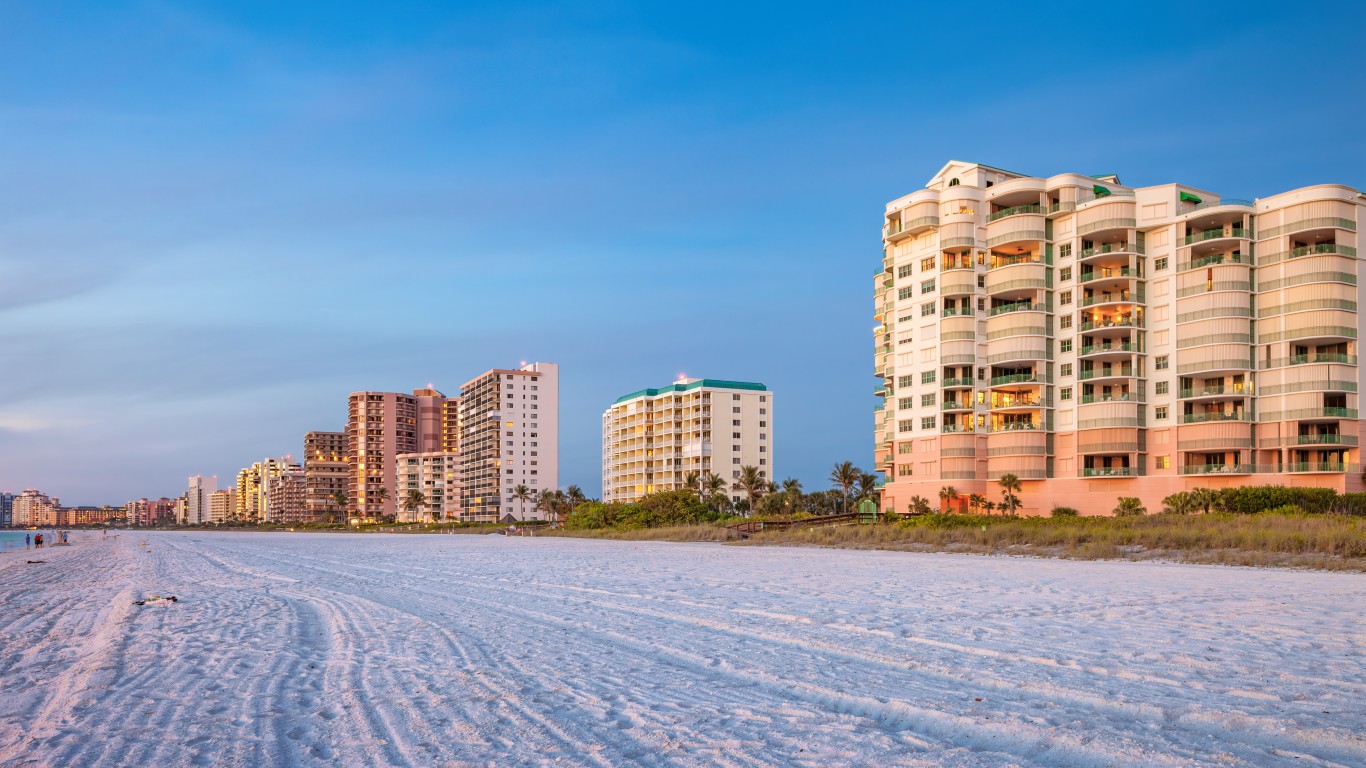
- Median listing price, Feb 2024: $849,950 (-3.4% from Feb 2023)
- Median listing price, Feb 2023: $879,500 — #17 highest of 464 markets
- Median listing price per sq ft, Feb 2024: $500 — #19 highest of 464 markets
- Median households income, 2022: $82,011 — #64 highest of 464 markets
- Pct households making over $200,000: 15.7% (compared to 11.4% nationwide)
- Population, 2022: 380,221
20. Kalispell, Montana
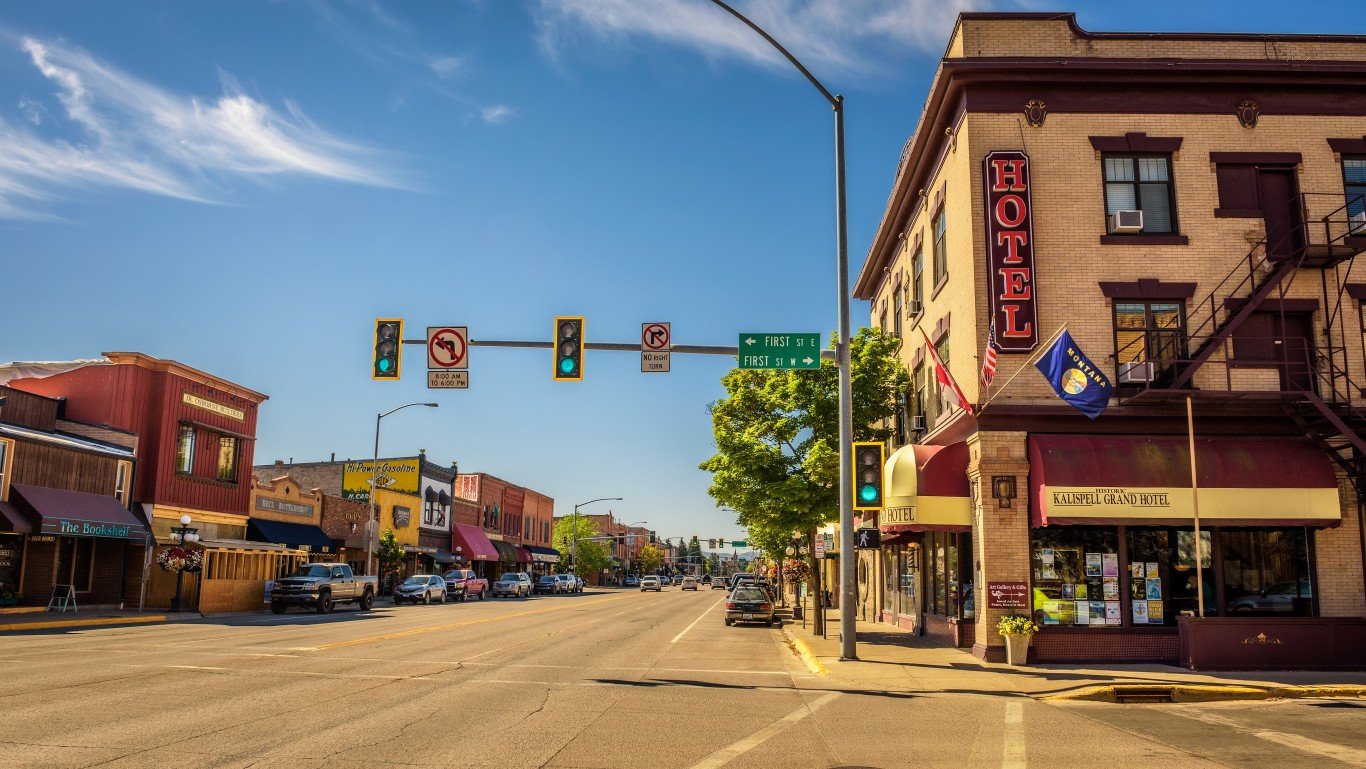
- Median listing price, Feb 2024: $850,000 (+8.0% from Feb 2023)
- Median listing price, Feb 2023: $786,950 — #21 highest of 464 markets
- Median listing price per sq ft, Feb 2024: $418 — #25 highest of 464 markets
- Median households income, 2022: $57,123 — #362 highest of 464 markets
- Pct households making over $200,000: 4.6% (compared to 11.4% nationwide)
- Population, 2022: 25,473
19. Boston-Cambridge-Newton, MA-NH

- Median listing price, Feb 2024: $854,450 (+6.9% from Feb 2023)
- Median listing price, Feb 2023: $799,000 — #20 highest of 464 markets
- Median listing price per sq ft, Feb 2024: $474 — #21 highest of 464 markets
- Median households income, 2022: $107,117 — #7 highest of 464 markets
- Pct households making over $200,000: 22.7% (compared to 11.4% nationwide)
- Population, 2022: 4,912,449
18. Bridgeport-Stamford-Norwalk, Connecticut

- Median listing price, Feb 2024: $869,450 (-9.8% from Feb 2023)
- Median listing price, Feb 2023: $963,450 — #11 highest of 464 markets
- Median listing price per sq ft, Feb 2024: $357 — #34 highest of 464 markets
- Median households income, 2022: $107,351 — #5 highest of 464 markets
- Pct households making over $200,000: 26.1% (compared to 11.4% nationwide)
- Population, 2022: 958,371
17. Ocean City, New Jersey
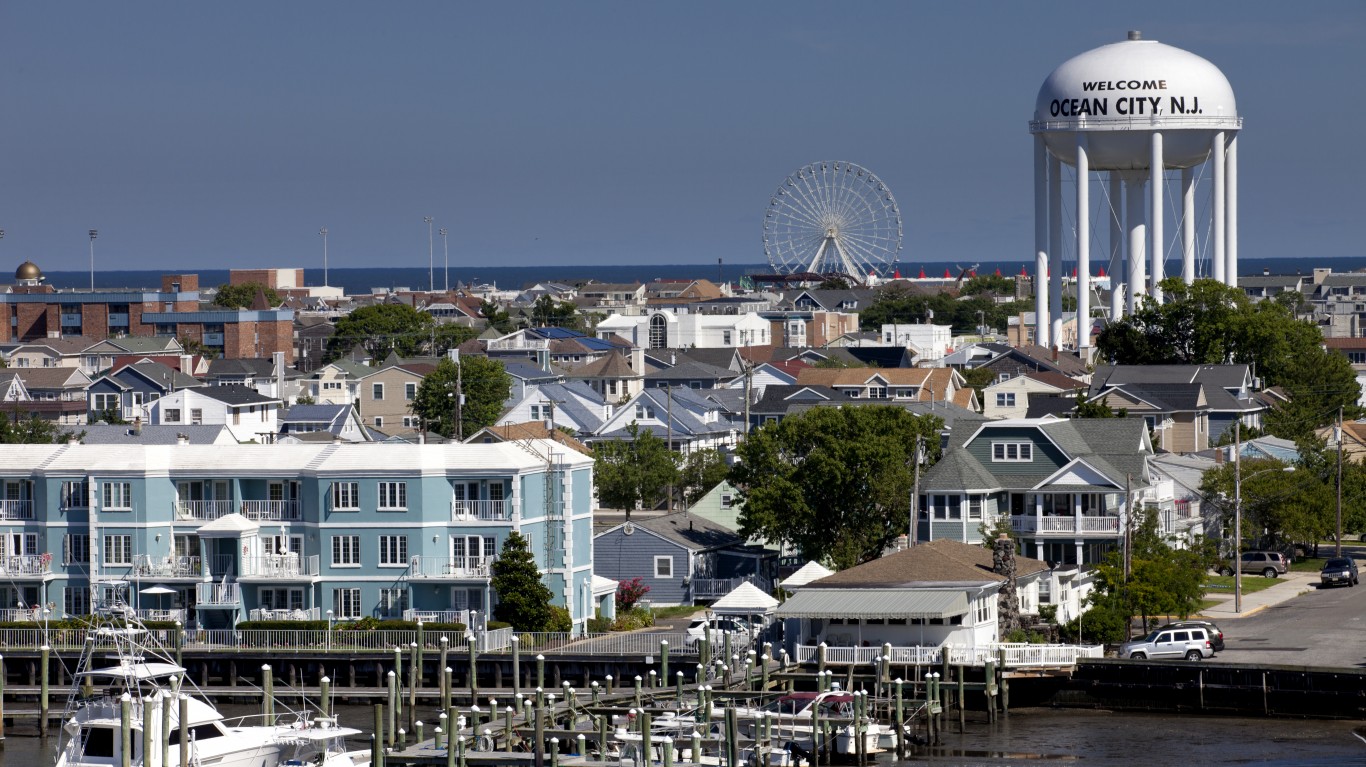
- Median listing price, Feb 2024: $899,900 (+1.2% from Feb 2023)
- Median listing price, Feb 2023: $889,500 — #16 highest of 464 markets
- Median listing price per sq ft, Feb 2024: $625 — #12 highest of 464 markets
- Median households income, 2022: $83,870 — #54 highest of 464 markets
- Pct households making over $200,000: 12.9% (compared to 11.4% nationwide)
- Population, 2022: 95,456
16. Boulder, Colorado
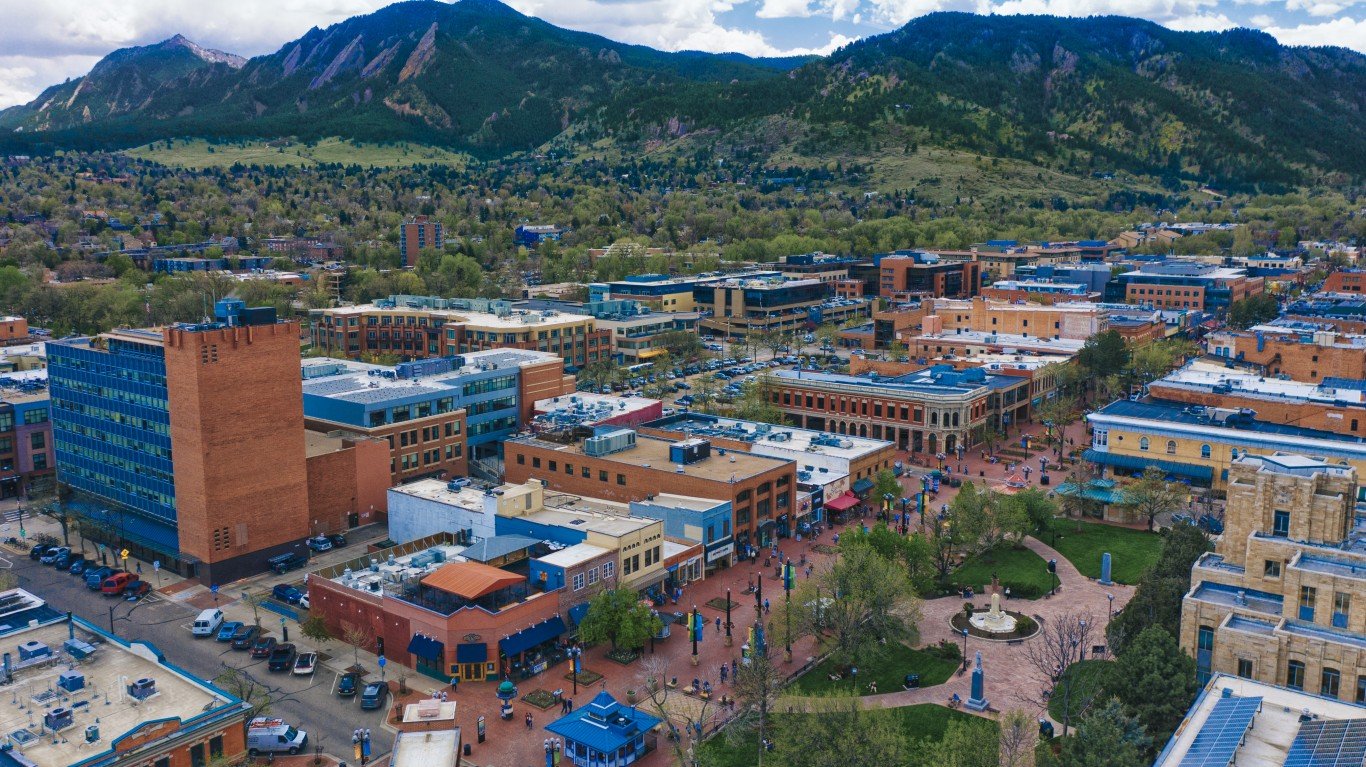
- Median listing price, Feb 2024: $914,441 (+4.5% from Feb 2023)
- Median listing price, Feb 2023: $875,000 — #18 highest of 464 markets
- Median listing price per sq ft, Feb 2024: $440 — #23 highest of 464 markets
- Median households income, 2022: $99,770 — #12 highest of 464 markets
- Pct households making over $200,000: 20.5% (compared to 11.4% nationwide)
- Population, 2022: 328,658
15. Barnstable Town, Massachusetts
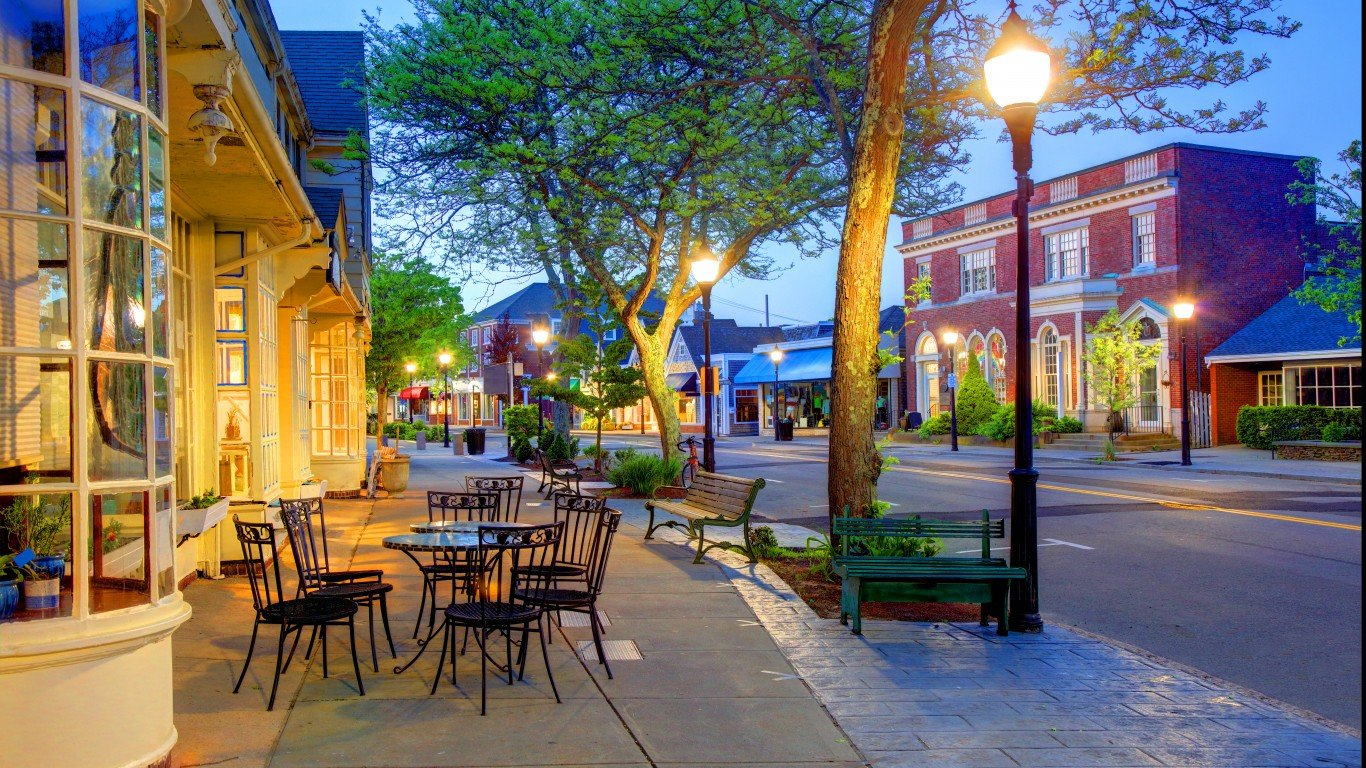
- Median listing price, Feb 2024: $915,725 (+4.7% from Feb 2023)
- Median listing price, Feb 2023: $874,975 — #19 highest of 464 markets
- Median listing price per sq ft, Feb 2024: $546 — #17 highest of 464 markets
- Median households income, 2022: $90,447 — #34 highest of 464 markets
- Pct households making over $200,000: 15.4% (compared to 11.4% nationwide)
- Population, 2022: 229,436
14. Santa Rosa-Petaluma, California

- Median listing price, Feb 2024: $970,000 (+2.0% from Feb 2023)
- Median listing price, Feb 2023: $951,225 — #12 highest of 464 markets
- Median listing price per sq ft, Feb 2024: $537 — #18 highest of 464 markets
- Median households income, 2022: $99,266 — #13 highest of 464 markets
- Pct households making over $200,000: 17.4% (compared to 11.4% nationwide)
- Population, 2022: 488,436
13. San Francisco-Oakland-Berkeley, California

- Median listing price, Feb 2024: $989,444 (-1.3% from Feb 2023)
- Median listing price, Feb 2023: $1,002,500 — #9 highest of 464 markets
- Median listing price per sq ft, Feb 2024: $700 — #8 highest of 464 markets
- Median households income, 2022: $129,315 — #2 highest of 464 markets
- Pct households making over $200,000: 31.4% (compared to 11.4% nationwide)
- Population, 2022: 4,692,242
12. San Diego-Chula Vista-Carlsbad, California
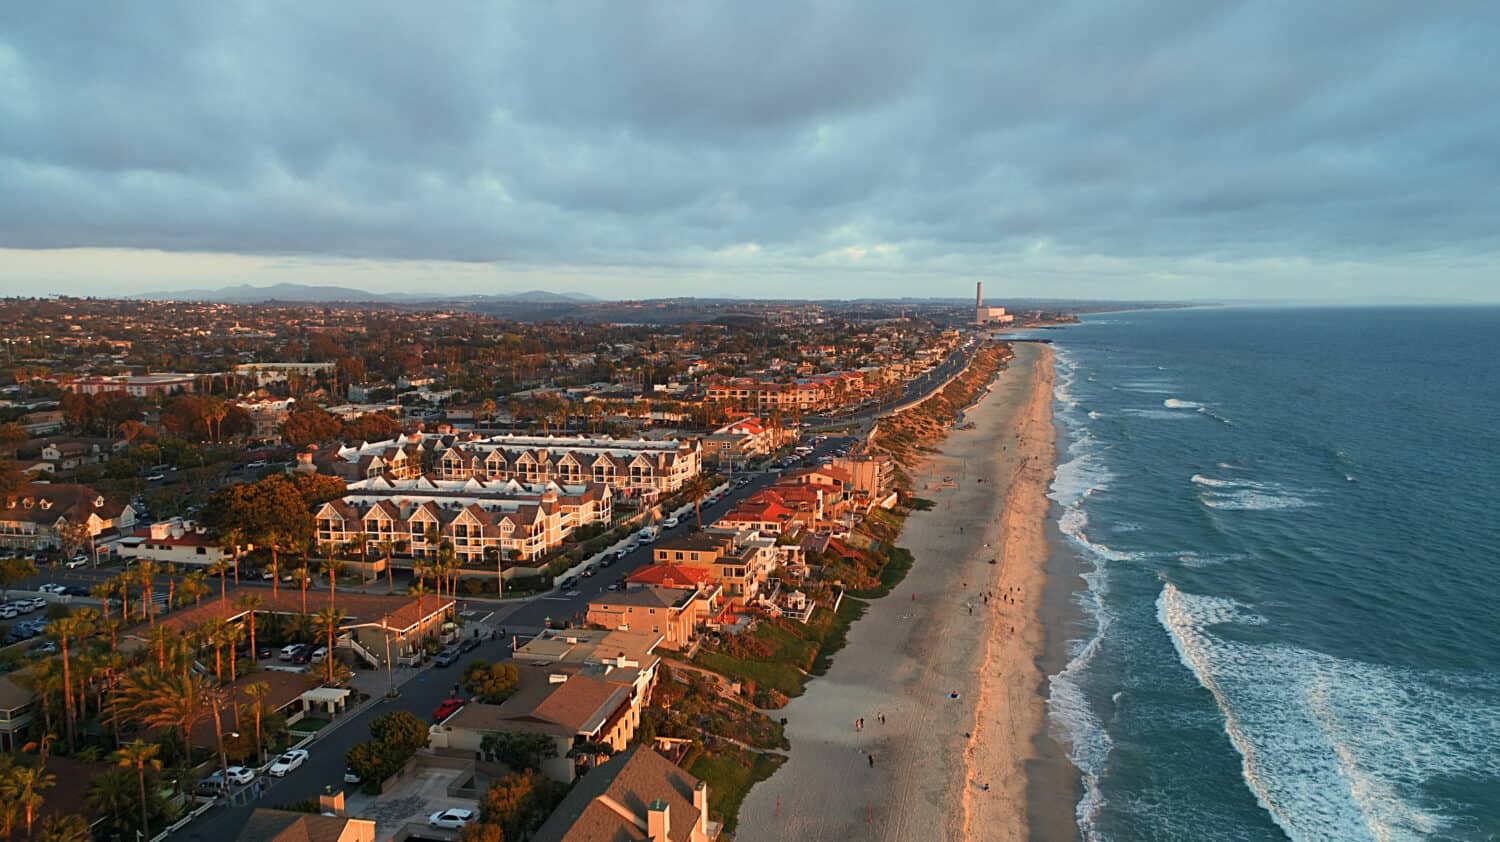
- Median listing price, Feb 2024: $996,500 (+6.9% from Feb 2023)
- Median listing price, Feb 2023: $931,999 — #15 highest of 464 markets
- Median listing price per sq ft, Feb 2024: $637 — #11 highest of 464 markets
- Median households income, 2022: $96,974 — #15 highest of 464 markets
- Pct households making over $200,000: 17.7% (compared to 11.4% nationwide)
- Population, 2022: 3,289,701
11. San Luis Obispo-Paso Robles, California
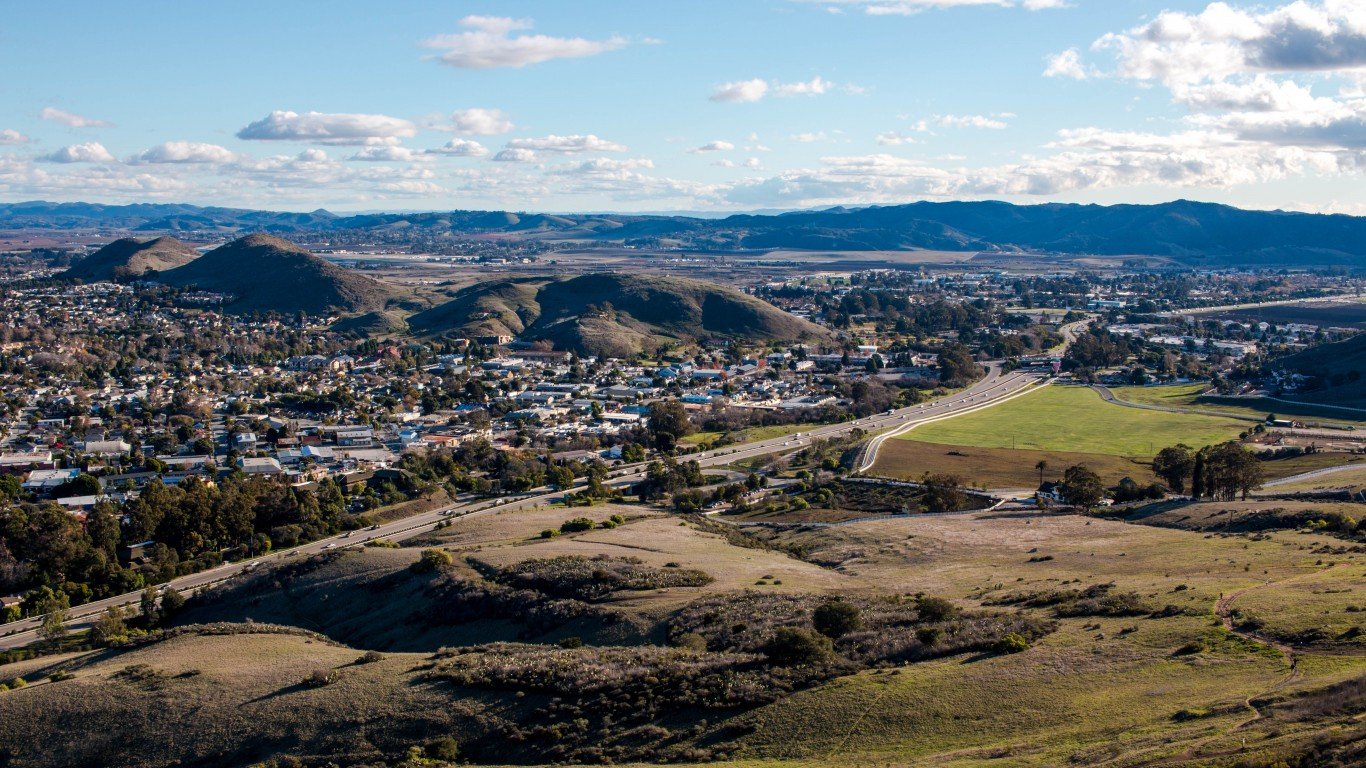
- Median listing price, Feb 2024: $1,029,250 (+8.5% from Feb 2023)
- Median listing price, Feb 2023: $949,000 — #13 highest of 464 markets
- Median listing price per sq ft, Feb 2024: $600 — #13 highest of 464 markets
- Median households income, 2022: $90,158 — #37 highest of 464 markets
- Pct households making over $200,000: 14.3% (compared to 11.4% nationwide)
- Population, 2022: 281,712
10. Santa Cruz-Watsonville, California

- Median listing price, Feb 2024: $1,074,850 (-18.3% from Feb 2023)
- Median listing price, Feb 2023: $1,316,250 — #6 highest of 464 markets
- Median listing price per sq ft, Feb 2024: $735 — #5 highest of 464 markets
- Median households income, 2022: $104,409 — #9 highest of 464 markets
- Pct households making over $200,000: 22.4% (compared to 11.4% nationwide)
- Population, 2022: 268,571
9. Oxnard-Thousand Oaks-Ventura, California
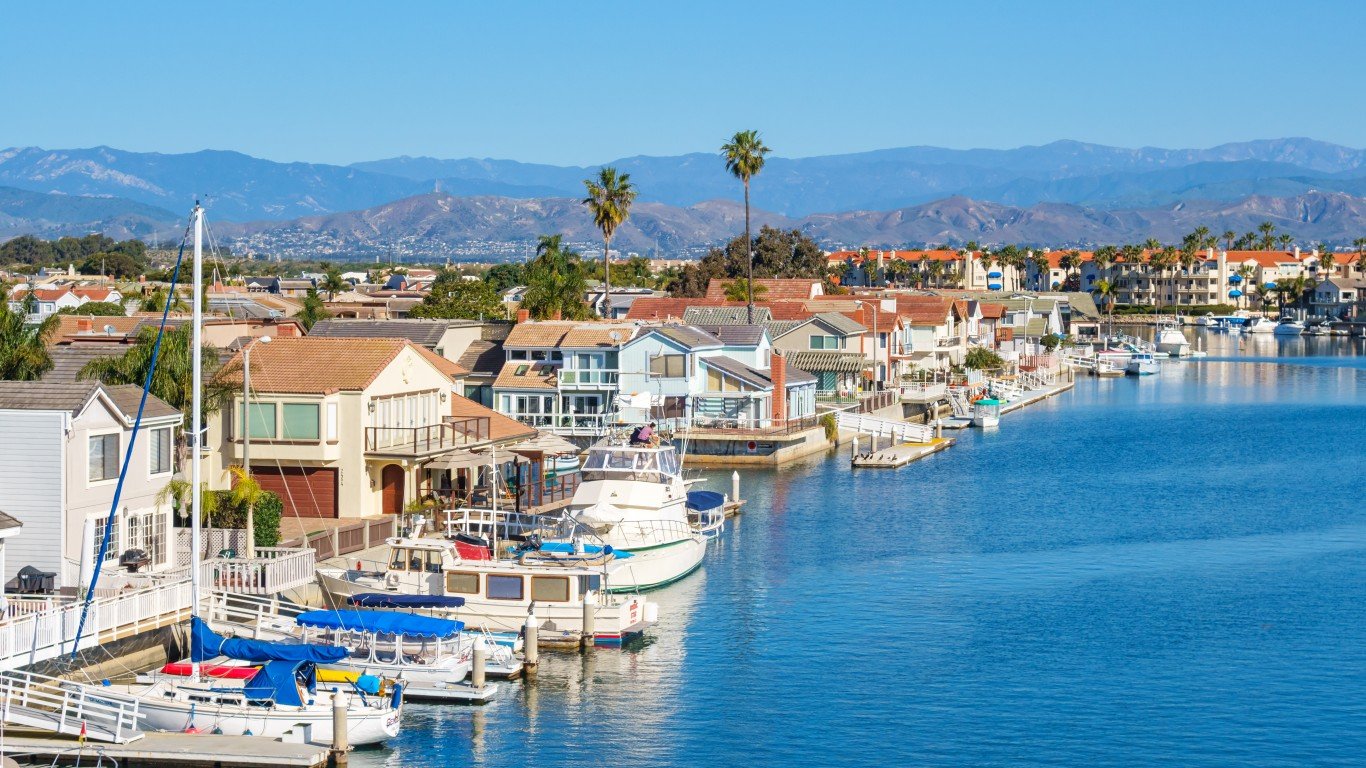
- Median listing price, Feb 2024: $1,095,750 (+17.5% from Feb 2023)
- Median listing price, Feb 2023: $932,500 — #14 highest of 464 markets
- Median listing price per sq ft, Feb 2024: $564 — #15 highest of 464 markets
- Median households income, 2022: $102,141 — #10 highest of 464 markets
- Pct households making over $200,000: 18.9% (compared to 11.4% nationwide)
- Population, 2022: 842,009
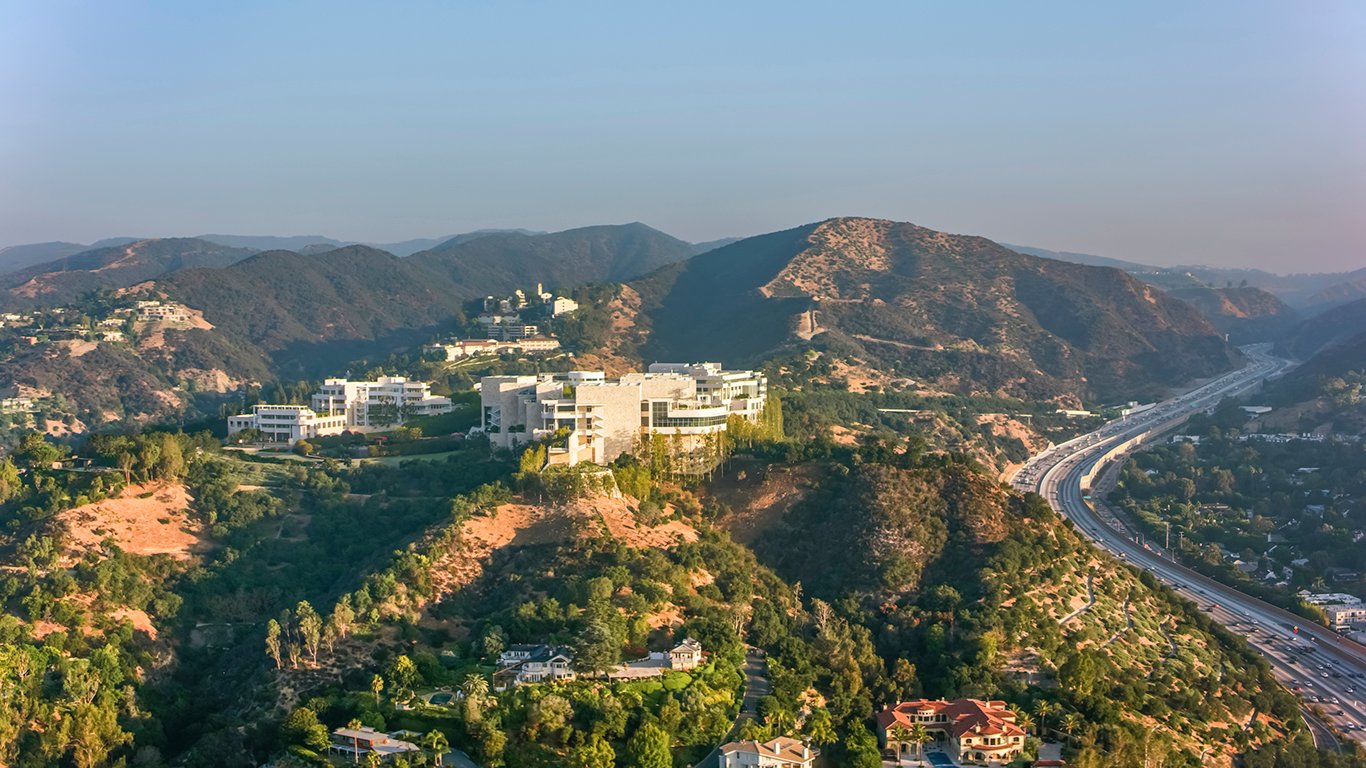
8. Los Angeles-Long Beach-Anaheim, California
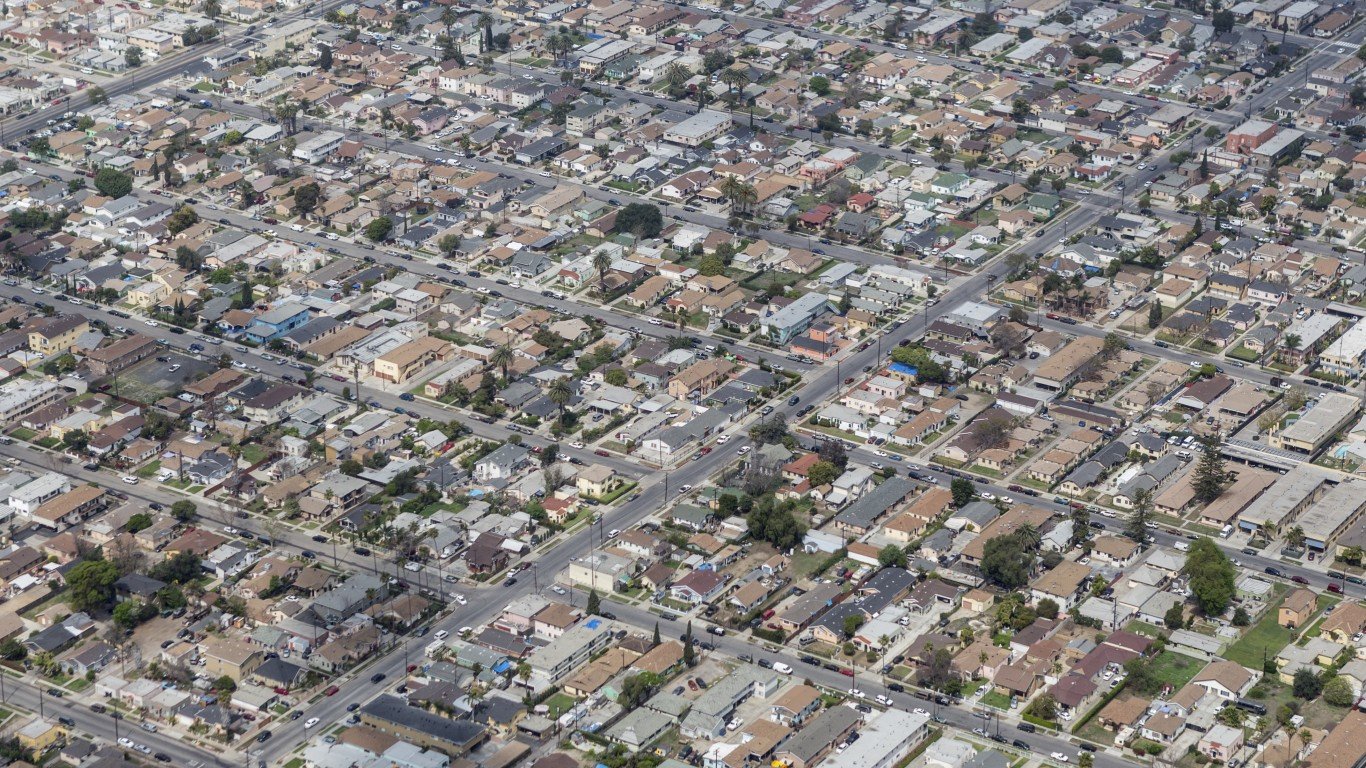
- Median listing price, Feb 2024: $1,137,000 (+16.8% from Feb 2023)
- Median listing price, Feb 2023: $973,500 — #10 highest of 464 markets
- Median listing price per sq ft, Feb 2024: $672 — #10 highest of 464 markets
- Median households income, 2022: $89,105 — #42 highest of 464 markets
- Pct households making over $200,000: 16.7% (compared to 11.4% nationwide)
- Population, 2022: 13,111,917
7. Bozeman, Montana
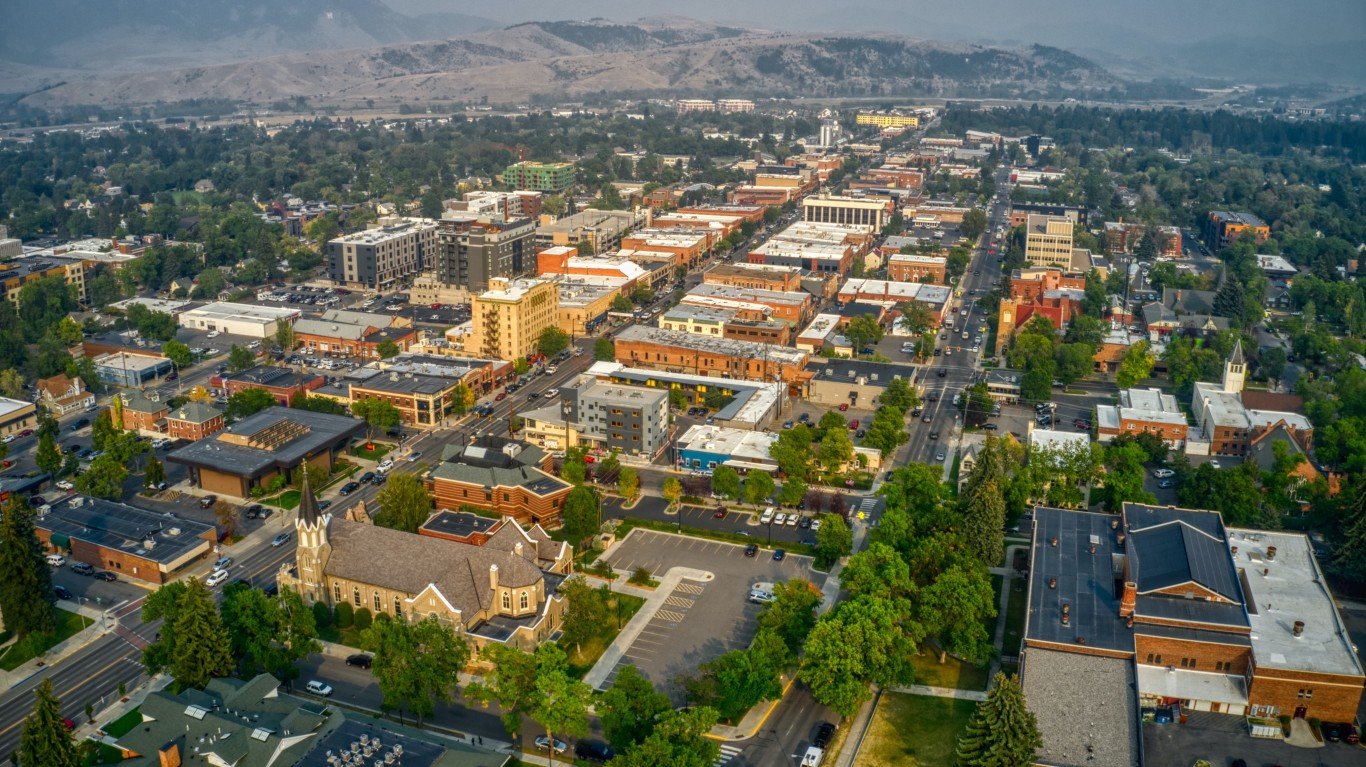
- Median listing price, Feb 2024: $1,197,000 (-2.5% from Feb 2023)
- Median listing price, Feb 2023: $1,227,250 — #8 highest of 464 markets
- Median listing price per sq ft, Feb 2024: $596 — #14 highest of 464 markets
- Median households income, 2022: $74,113 — #119 highest of 464 markets
- Pct households making over $200,000: 10.9% (compared to 11.4% nationwide)
- Population, 2022: 53,500
6. Salinas, California
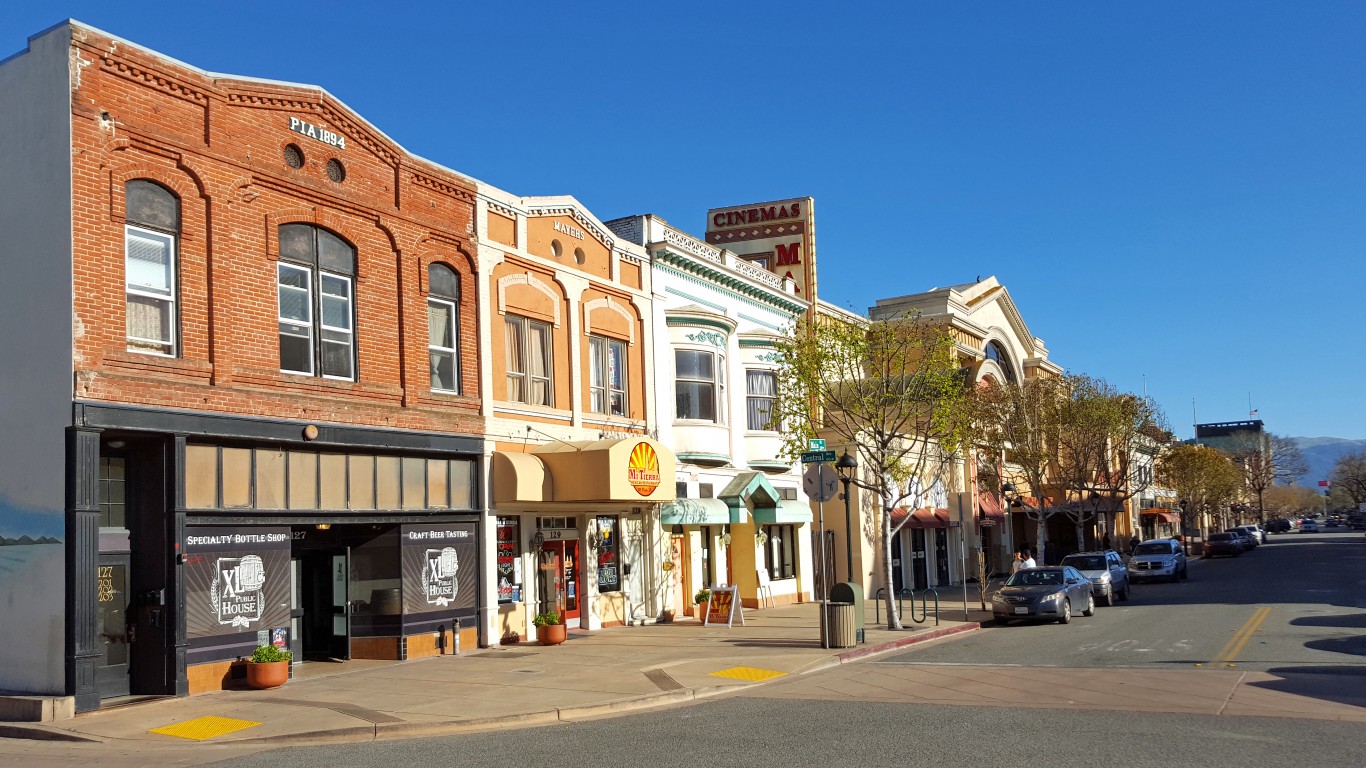
- Median listing price, Feb 2024: $1,229,892 (-0.3% from Feb 2023)
- Median listing price, Feb 2023: $1,233,500 — #7 highest of 464 markets
- Median listing price per sq ft, Feb 2024: $709 — #6 highest of 464 markets
- Median households income, 2022: $91,043 — #31 highest of 464 markets
- Pct households making over $200,000: 14.8% (compared to 11.4% nationwide)
- Population, 2022: 437,609
5. San Jose-Sunnyvale-Santa Clara, California
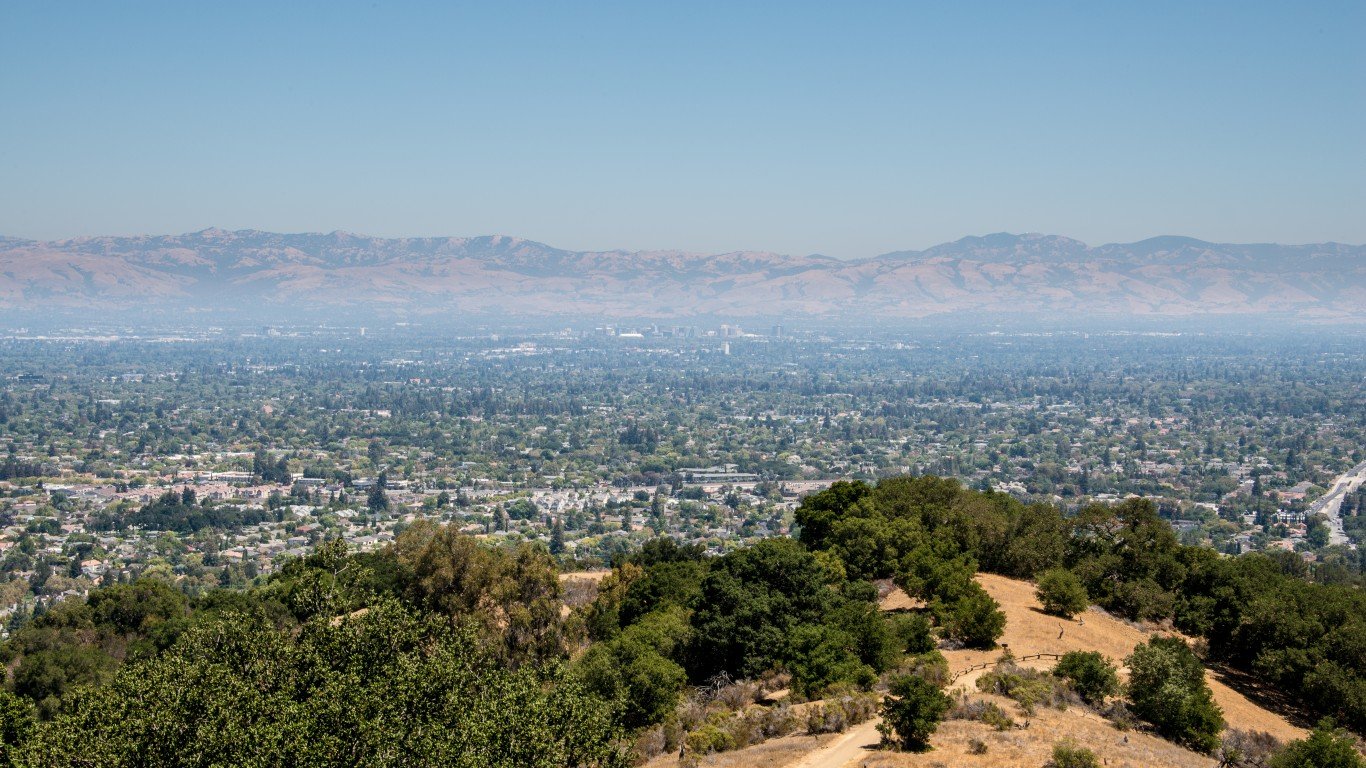
- Median listing price, Feb 2024: $1,366,944 (-2.3% from Feb 2023)
- Median listing price, Feb 2023: $1,399,500 — #3 highest of 464 markets
- Median listing price per sq ft, Feb 2024: $838 — #4 highest of 464 markets
- Median households income, 2022: $151,713 — #1 highest of 464 markets
- Pct households making over $200,000: 37.4% (compared to 11.4% nationwide)
- Population, 2022: 1,981,584
4. Key West, Florida

- Median listing price, Feb 2024: $1,384,085 (-6.0% from Feb 2023)
- Median listing price, Feb 2023: $1,472,500 — #1 highest of 464 markets
- Median listing price per sq ft, Feb 2024: $948 — #2 highest of 464 markets
- Median households income, 2022: $80,828 — #74 highest of 464 markets
- Pct households making over $200,000: 13.5% (compared to 11.4% nationwide)
- Population, 2022: 26,078
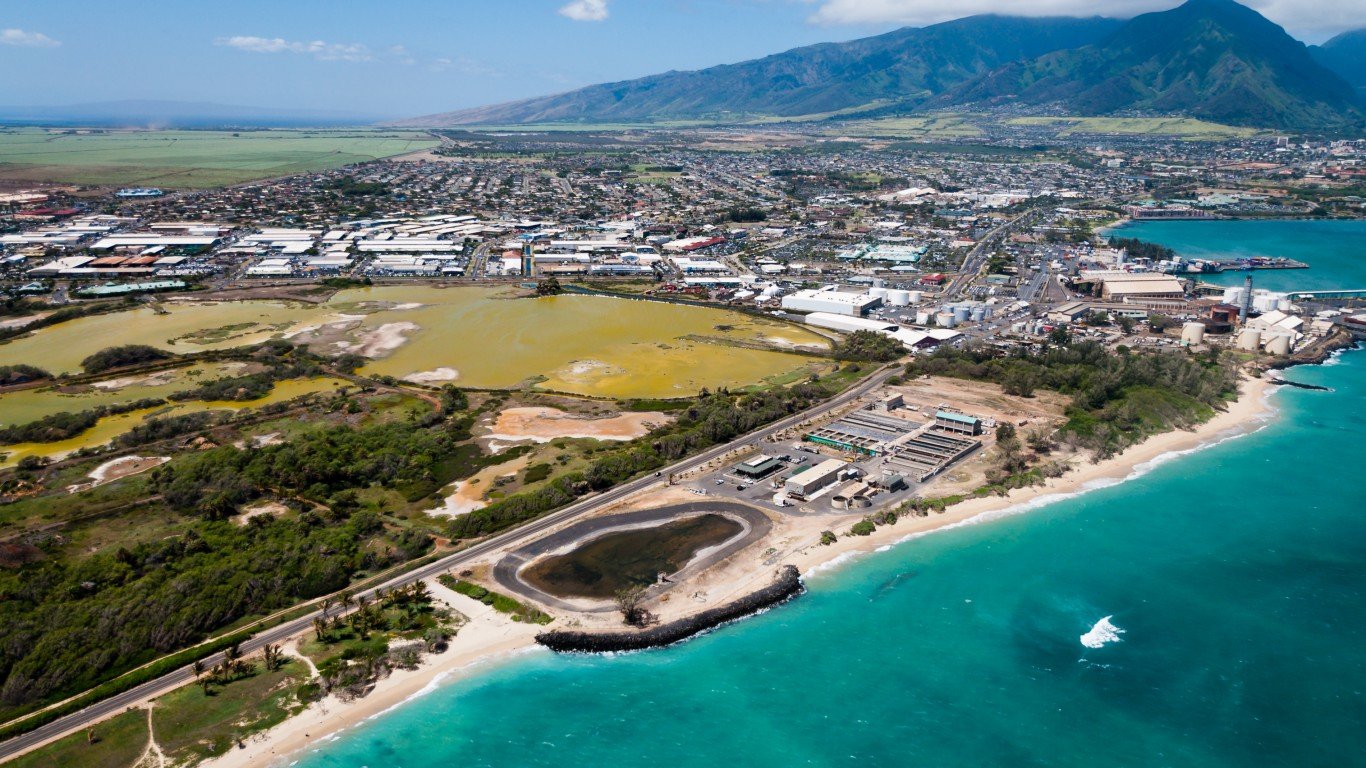
3. Kahului-Wailuku-Lahaina, Hawaii

- Median listing price, Feb 2024: $1,412,500 (+1.3% from Feb 2023)
- Median listing price, Feb 2023: $1,395,000 — #4 highest of 464 markets
- Median listing price per sq ft, Feb 2024: $1,279 — #1 highest of 464 markets
- Median households income, 2022: $95,379 — #18 highest of 464 markets
- Pct households making over $200,000: 15.8% (compared to 11.4% nationwide)
- Population, 2022: 164,765
2. Napa, California
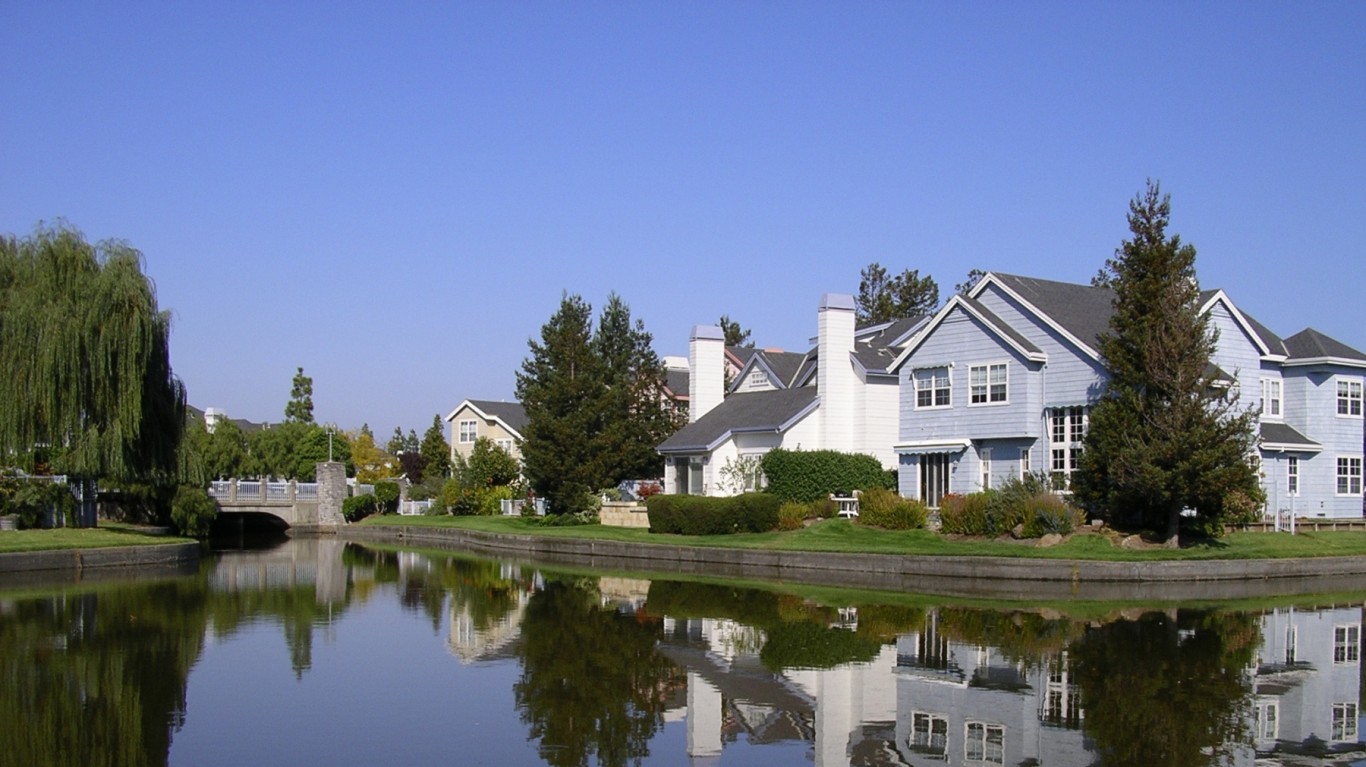
- Median listing price, Feb 2024: $1,449,500 (+2.9% from Feb 2023)
- Median listing price, Feb 2023: $1,409,250 — #2 highest of 464 markets
- Median listing price per sq ft, Feb 2024: $706 — #7 highest of 464 markets
- Median households income, 2022: $105,809 — #8 highest of 464 markets
- Pct households making over $200,000: 20.6% (compared to 11.4% nationwide)
- Population, 2022: 137,384
1. Santa Maria-Santa Barbara, California
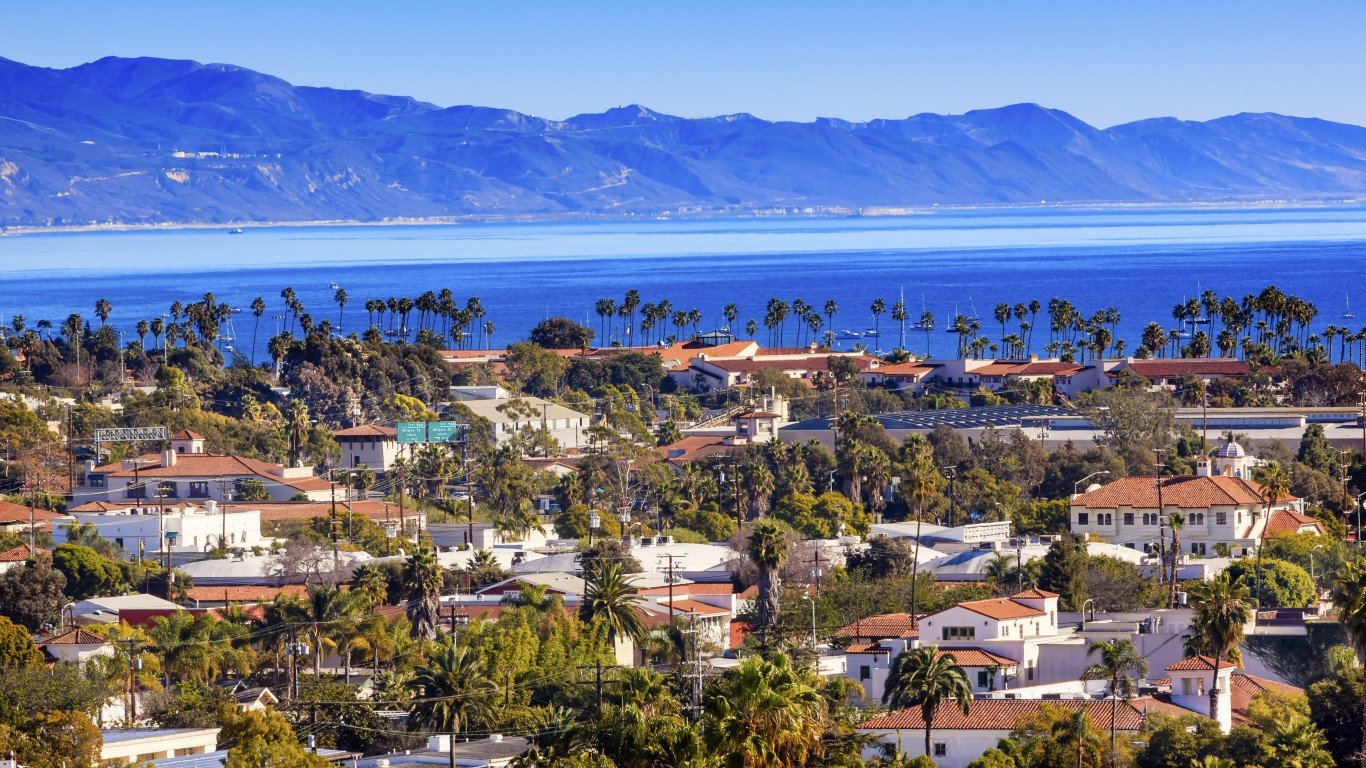
- Median listing price, Feb 2024: $1,779,750 (+32.5% from Feb 2023)
- Median listing price, Feb 2023: $1,343,750 — #5 highest of 464 markets
- Median listing price per sq ft, Feb 2024: $919 — #3 highest of 464 markets
- Median households income, 2022: $92,332 — #28 highest of 464 markets
- Pct households making over $200,000: 18.0% (compared to 11.4% nationwide)
- Population, 2022: 445,213
Contact [email protected] for any questions or corrections.