

By ETFGI
ETFGI, an independent research and consultancy firm covering trends in the global ETFs and ETPs ecosystem, reports assets in the Global ETFs industry reached a record 9.46 trillion US dollars at the end of July. ETFs and ETPs listed globally gathered net inflows of US$80.45 billion during July, bringing year-to-date net inflows to a record US$739.54 billion which is higher than the US$373.01 billion gathered at this point last year. Assets invested in the global ETFs/ETPs industry have increased by 1.2% from US$9.35 trillion at the end of June 2021, to US$9.46 trillion at the end of July, according to ETFGI’s July 2021 Global ETFs and ETPs industry landscape insights report, the monthly report which is part of an annual paid-for research subscription service. (All dollar values in USD unless otherwise noted.)
Highlights
- Record $9.46 trillion invested in ETFs and ETPs listed globally at the end of July 2021.
- Record YTD 2021 net inflows of $739.54 Bn beating the prior record of $390.93 Bn gathered in YTD 2017.
- $739.54 Bn YTD net inflows are just $22 Bn lower than the full year 2020 record net inflows $490.19 Bn.
- $1.13 trillion in net inflows gathered in the past 12 months.
- Assets have increased 18.4% YTD in 2021, going from $7.99 trillion at end of 2020, to $9.46 trillion.
- 26th month of consecutive net inflows
- “The S&P 500 gained 2.38% in July. Developed markets ex-U.S. gained 0.40% in July. Luxembourg 8.41% and Finland 5.59% were the leaders of the month while Hong Kong suffer the biggest loss of 4.47%. Emerging markets were down by 5.59% at the end of July,” according to Deborah Fuhr, managing partner, founder and owner of ETFGI.
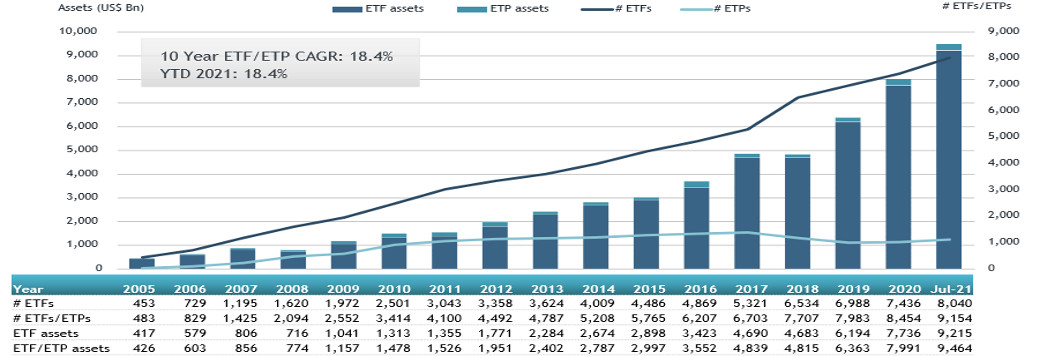
- Global ETF and ETP assets as of the end of July 2021
Source: ETFGI data sourced from ETF/ETP sponsors, exchanges, regulatory filings, Thomson Reuters/Lipper, Bloomberg, publicly available sources and data generated in-house. Note: This report is based on the most recent data available at the time of publication. Asset and flow data may change slightly as additional data becomes available.
The Global ETFs and ETPs industry had 9,154 products, with 18,539 listings, assets of $9,464 trillion, from 563 providers listed on 78 exchanges in 62 countries at the end of July.
During July 2021, ETFs/ETPs gathered net inflows of $80.45 Bn. Equity ETFs/ETPs listed globally gathered net inflows of $53.04 Bn during July, bringing net inflows for 2021 to $512.17 Bn, much greater than the $112.90 Bn in net inflows equity products attracted for the corresponding period in 2020. Fixed Income ETFs/ETPs listed globally reported net inflows of $21.68 Bn during July, bringing net inflows for 2021 to $133.34 Bn, lower than the $140.53 Bn in net inflows fixed income products had attracted YTD in 2020. Commodity ETFs/ETPs listed globally gathered net outflows of $1.20 Bn, bringing net outflows for 2021 to $6.13 Bn, significantly lower than the $64.44 Bn in net inflows commodity products had attracted over the same period last year. Active ETFs/ETPs reported $6.00 Bn in net inflows, bringing net inflows for 2021 to $88.23 Bn, higher than the $35.23 Bn in net inflows active products had attracted YTD in 2020.
Substantial inflows can be attributed to the top 20 ETFs by net new assets, which collectively gathered $43.59 Bn during July. Vanguard Short-Term Bond ETF (BSV US) gathered $6.16 Bn the largest net inflow.
Top 20 ETFs by net new inflows July 2021: Global
| Name | Ticker | Assets (US$ Mn) July-21 | NNA (US$ Mn) YTD-21 | NNA (US$ Mn) July-21 |
|---|---|---|---|---|
| Vanguard Short-Term Bond ETF | BSV US | 40,535.86 | 11,201.79 | 5,991.36 |
| Vanguard S&P 500 ETF | VOO US | 243,339.08 | 32,054.86 | 5,337.55 |
| Vanguard Total Stock Market ETF | VTI US | 258,285.59 | 23,583.45 | 3,223.34 |
| iShares TIPS Bond ETF | TIP US | 31,543.15 | 4,438.84 | 2,599.66 |
| Health Care Select Sector SPDR Fund | XLV US | 32,230.40 | 2,491.71 | 2,574.19 |
| iShares Core MSCI EAFE ETF | IEFA US | 99,091.47 | 7,713.16 | 2,354.05 |
| iShares Trust iShares ESG Aware MSCI USA ETF | ESGU US | 20,827.30 | 4,905.20 | 2,005.20 |
| KraneShares CSI China Internet ETF | KWEB US | 5,114.13 | 3,516.61 | 1,913.84 |
| Vanguard Total World Stock ETF | VT US | 23,863.05 | 4,696.46 | 1,901.04 |
| Vanguard FTSE Developed Markets ETF | VEA US | 103,424.87 | 7,674.68 | 1,817.14 |
| iShares Core S&P 500 ETF | IVV US | 291,326.63 | 14,533.83 | 1,784.12 |
| iShares Edge MSCI USA Quality Factor ETF | QUAL US | 23,966.92 | -1,121.38 | 1,623.08 |
| iShares MSCI USA Momentum Factor ESG UCITS ETF – Acc | IUME NA | 1,497.26 | 1,455.77 | 1,455.77 |
| Consumer Staples Select Sector SPDR Fund | XLP US | 13,208.07 | -612.48 | 1,413.63 |
| iShares MSCI USA Value Factor ESG UCITS ETF – Acc | IUVE NA | 1,425.31 | 1,413.11 | 1,413.11 |
| iShares MSCI EAFE Growth ETF | EFG US | 12,115.43 | 1,373.16 | 1,387.63 |
| Vanguard Total International Bond ETF | BNDX US | 44,726.55 | 7,835.14 | 1,278.34 |
| iShares Core MSCI World UCITS ETF – Acc | IWDA LN | 40,345.92 | 6,657.38 | 1,252.58 |
| iShares Core S&P Total U.S. Stock Market ETF | ITOT US | 41,965.61 | 4,202.12 | 1,157.23 |
| Vanguard Total International Stock Index Fund ETF | VXUS US | 48,629.22 | 7,407.76 | 1,105.61 |
The top 10 ETPs by net new assets collectively gathered $984 Mn over July. Invesco Physical Gold ETC – Acc (SGLD LN) gathered $313 Mn the largest net inflow.
Top 10 ETPs by net new inflows July 2021: Global
| Name | Ticker | Assets (US$ Mn) July-21 | NNA (US$ Mn) YTD-21 | NNA (US$ Mn) July-21 |
|---|---|---|---|---|
| Invesco Physical Gold ETC – Acc | IAU US | 13,221.67 | -221.86 | 313.20 |
| Xetra Gold EUR – Acc | UVXY US | 13,871.03 | 1,148.14 | 198.79 |
| Xtrackers Physical Gold Euro Hedged ETC – Acc | XGDE GY | 2,393.85 | -878.39 | 72.41 |
| Aberdeen Standard Precious Metals Basket Trust | GLD US | 1,104.63 | 277.36 | 72.20 |
| iShares Physical Gold ETC – Acc | 00XQ GY | 13,391.63 | -337.90 | 63.22 |
| AMUNDI PHYSICAL GOLD ETC (C) – Acc | XGDU LN | 3,832.96 | 681.36 | 60.53 |
| Xtrackers IE Physical Gold ETC Securities – Acc | SLVO US | 2,001.22 | 1,708.94 | 59.69 |
| WisdomTree Physical Swiss Gold – Acc | GOLD FP | 3,686.52 | 172.40 | 56.16 |
| Invesco DB US Dollar Index Bullish Fund | VXX US | 473.22 | 99.30 | 44.89 |
| Credit Suisse Silver Shares Covered Call ETN | 4GLD GY | 294.78 | 270.04 | 43.35 |
Source: ETFGI data sourced from ETF/ETP sponsors, exchanges, regulatory filings, Thomson Reuters/Lipper, Bloomberg, publicly available sources and data generated in-house. Note: This report is based on the most recent data available at the time of publication. Asset and flow data may change slightly as additional data becomes available.
Investors have tended to invest in Equity ETFs and ETPs during July.
Contact [email protected] if you have any questions or comments on the press release or ETFGI events, research or consulting services.
Contact [email protected] for any questions or corrections.


